1. Introduction
Perovskites of the general formula AC
3B
4O
12 represent a large family of materials and can be considered as a fourfold superstructure of the ABO
3 perovskite in which a cation (A-site) and Jahn-Teller ions (C-site; Cu
2+, Mn
3+) are long-range ordered in a double-cubic unit cell. A wide variety of cations can occupy the A-, B- and C-sites, and various partial substitutions are possible on each of these sites [
1,
2,
3,
4,
5,
6]. Many interesting properties have been found in these compounds, leading to potential applications in various fields. For instance, CaCu
3Ti
4O
12 and CaMn
3−xCu
xMn
4O
12 show an anomalously high dielectric constant and a giant magneto-resistance, respectively [
4,
5,
7,
8,
9]; LaCu
3Fe
4O
12 is a negative thermal expansion material [
10]; and CaCu
3Ru
4O
12 exhibits high metallic electrical conductivity [
11,
12].
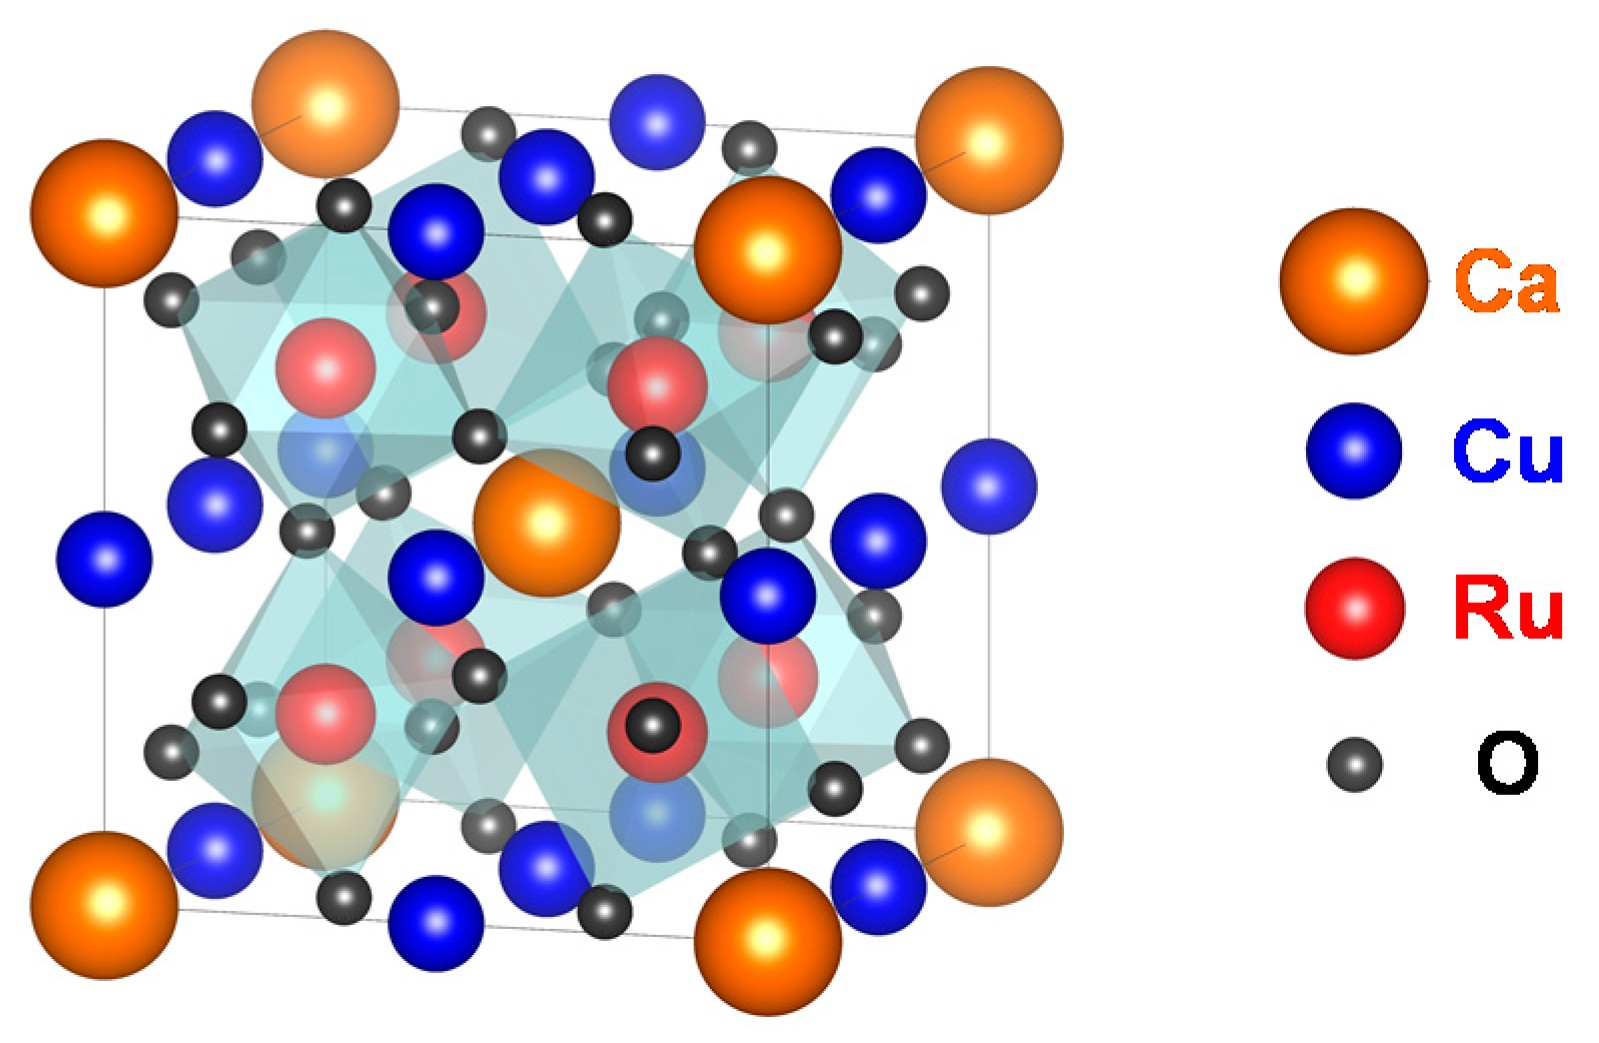
Figure 1 shows the crystal structure of CaCu
3Ru
4O
12. Ca
2+ and Cu
2+ share the A-site of the perovskite. The Ru-ions (Ru
4+) occupy the B-site at the point (1/4, 1/4, 1/4) of the lattice. The O-ions (O
2−) are shifted from their regular position at (1/4, 1/4, 0) in simple perovskites as the RuO
6 octahedra are tilted [
13].
Recently, many high-temperature operating electrical devices such as gas sensors and solid oxide fuel cells have been actively developed. Their conductive materials are required to be stable at high temperatures and in various atmospheres [
14,
15,
16,
17,
18,
19,
20]. Platinum is conventionally used as the conductive materials in such devices, but its high cost has been a serious barrier to their widespread use. Owing to their stability at high temperatures, oxides appear as a potential alternative to platinum, provided they exhibit low resistivity. Among the conducting metal oxides, noble-metal oxides such as RuO
2 [
21], IrO
2 [
21,
22], and ReO
2 [
23] exhibit the lowest resistivity. Next comes CaCu
3Ru
4O
12, with a resistivity value at room temperature below 0.5 mΩcm, which is one order of magnitude lower than that of La-Sr-Co-Fe-O perovskites (over 10 mΩcm) at room temperature [
24]. Therefore, CaCu
3Ru
4O
12 is a suitable candidate to replace platinum in devices. However, there are two main challenges with the use of CaCu
3Ru
4O
12 in devices. One is its resistance to sintering, but we have found that a possible solution to this issue is to use CuO as a sintering additive [
25]. The other is the high cost of Ru. Fortunately, various alternative elements are expected to substitute Ru on the B-site to reduce the material cost of CaCu
3Ru
4O
12 while keeping its resistivity low. In addition, the electrical conducting mechanism in CaCu
3Ru
4O
12 has been investigated by Kobayashi et al [
11], who have shown that not only the Ru-O network, but also Cu
2+ through Kondo coupling [
9] between Ru 4d and Cu 3d electrons contributes to the good electrical conduction of the material. This result encourages our scheme to reduce the amount of Ru in CaCu
3Ru
4O
12 by substitution while maintaining a high electrical conductivity. In order to use conducting oxides as substitute materials for platinum, their resistivity should be a few mΩcm over 500 °C and show a temperature dependence similar to that of metal.
In this study, we focused on Mn as a substitute element for Ru in CaCu
3Ru
4O
12 with a fixed amount of sintering additive of 20 vol.% CuO. While the crystal structure and magnetism of CaCu
3Ru
4−xMn
xO
12 have been discussed in a previous report [
6], no detailed information on the conducting properties of the material is available. Here, the transport properties of 20 vol.% CuO-mixed CaCu
3Ru
4−xMn
xO
12 with various Mn substitution amounts (in the range 0.00–2.00) were investigated over a wide temperature range (8–900 K).
2. Experimental Procedure
CaCu3Ru4−xMnxO12 powders with various Mn substitution amounts (x = 0.00, 0.25, 0.50, 0.75, 1.00, 1.25, 1.50, 1.75 and 2.00) were prepared by a solid-state reaction method. Stoichiometric mixtures of CaCO3, CuO, RuO2, and Mn3O4 were pressed into pellets and calcined in air at 1000 °C for 48 h. During calcination, the pellets were surrounded by a mixture of CaCO3, CuO, and RuO2 powders to prevent the sublimation of Ru and a consequent composition deviation. In our preliminary experiment, Ru sublimation and formation of second phases such as CaRuO3 were confirmed after calcination at 1000 °C without the surroundings. In addition, although the exact solubility limit of Mn at the Ru-site obtained with a synthesis at atmospheric pressure is unknown, it was not possible to synthesize CaCu3RuMn3O12 (x = 3) with this synthesis method.
CaCu3Ru4−xMnxO12 powders were obtained via the mechanical grinding of the calcined pellets. The CaCu3Ru4−xMnxO12 powders were then mixed with CuO powder acting as a sintering additive, pressed into a pellet, and sintered at 1000 °C for 48 h in air. The obtained samples are hereafter referred to as CuO(20 vol.%)-CaCu3Ru4−xMnxO12 bulks. A CuO volume fraction of 20 vol.% was calculated using the molecular weights and lattice constants for each Mn substitution amount. Twenty vol.% of the samples with x = 0.00, 0.25, 0.50, 0.75, 1.00, 1.25, 1.50, 1.75, and 2.00 correspond to 19.6, 19.7, 19.8, 19.9, 20.0, 20.1, 20.1, 20.2, and 20.4 wt%, respectively.
X-ray diffraction (XRD) of the bulk samples was carried out using a standard diffractometer with CuKα radiation, in the 2θ-θ scan mode (Rigaku SmartLab, Tokyo, Japan). The morphology of the bulk samples was observed using a field emission scanning electron microscope (FE-SEM; JEOL JSM-6335FM, Tokyo, Japan). The resistivity and thermopower were measured from 7 K to 350 K using a conventional four-probe method and a steady-state technique in vacuum using a cryostat, and from 350 K to 900 K by a four-point probe method in air using an electrical conductivity and Seebeck coefficient measurement system (Ozawa Science RZ2001S, Nagoya, Japan). Since we used different methods and devices for the resistivity measurements below and above 350 K, the value of the resistivity at 350 K obtained with each method differed slightly for each sample. The error is considered to be due to the measurement error of the distance between the voltage terminals in the low-temperature measurements, and the difference between the high-temperature and low-temperature measurement values was less than 10%. Consequently, we normalized the low-temperature data so that the value found at 350 K by the low-temperature method matches that found at 350 K by the high-temperature method. An excellent agreement between the derivative of the two datasets at 350 K was found in all samples.
3. Results and Discussion
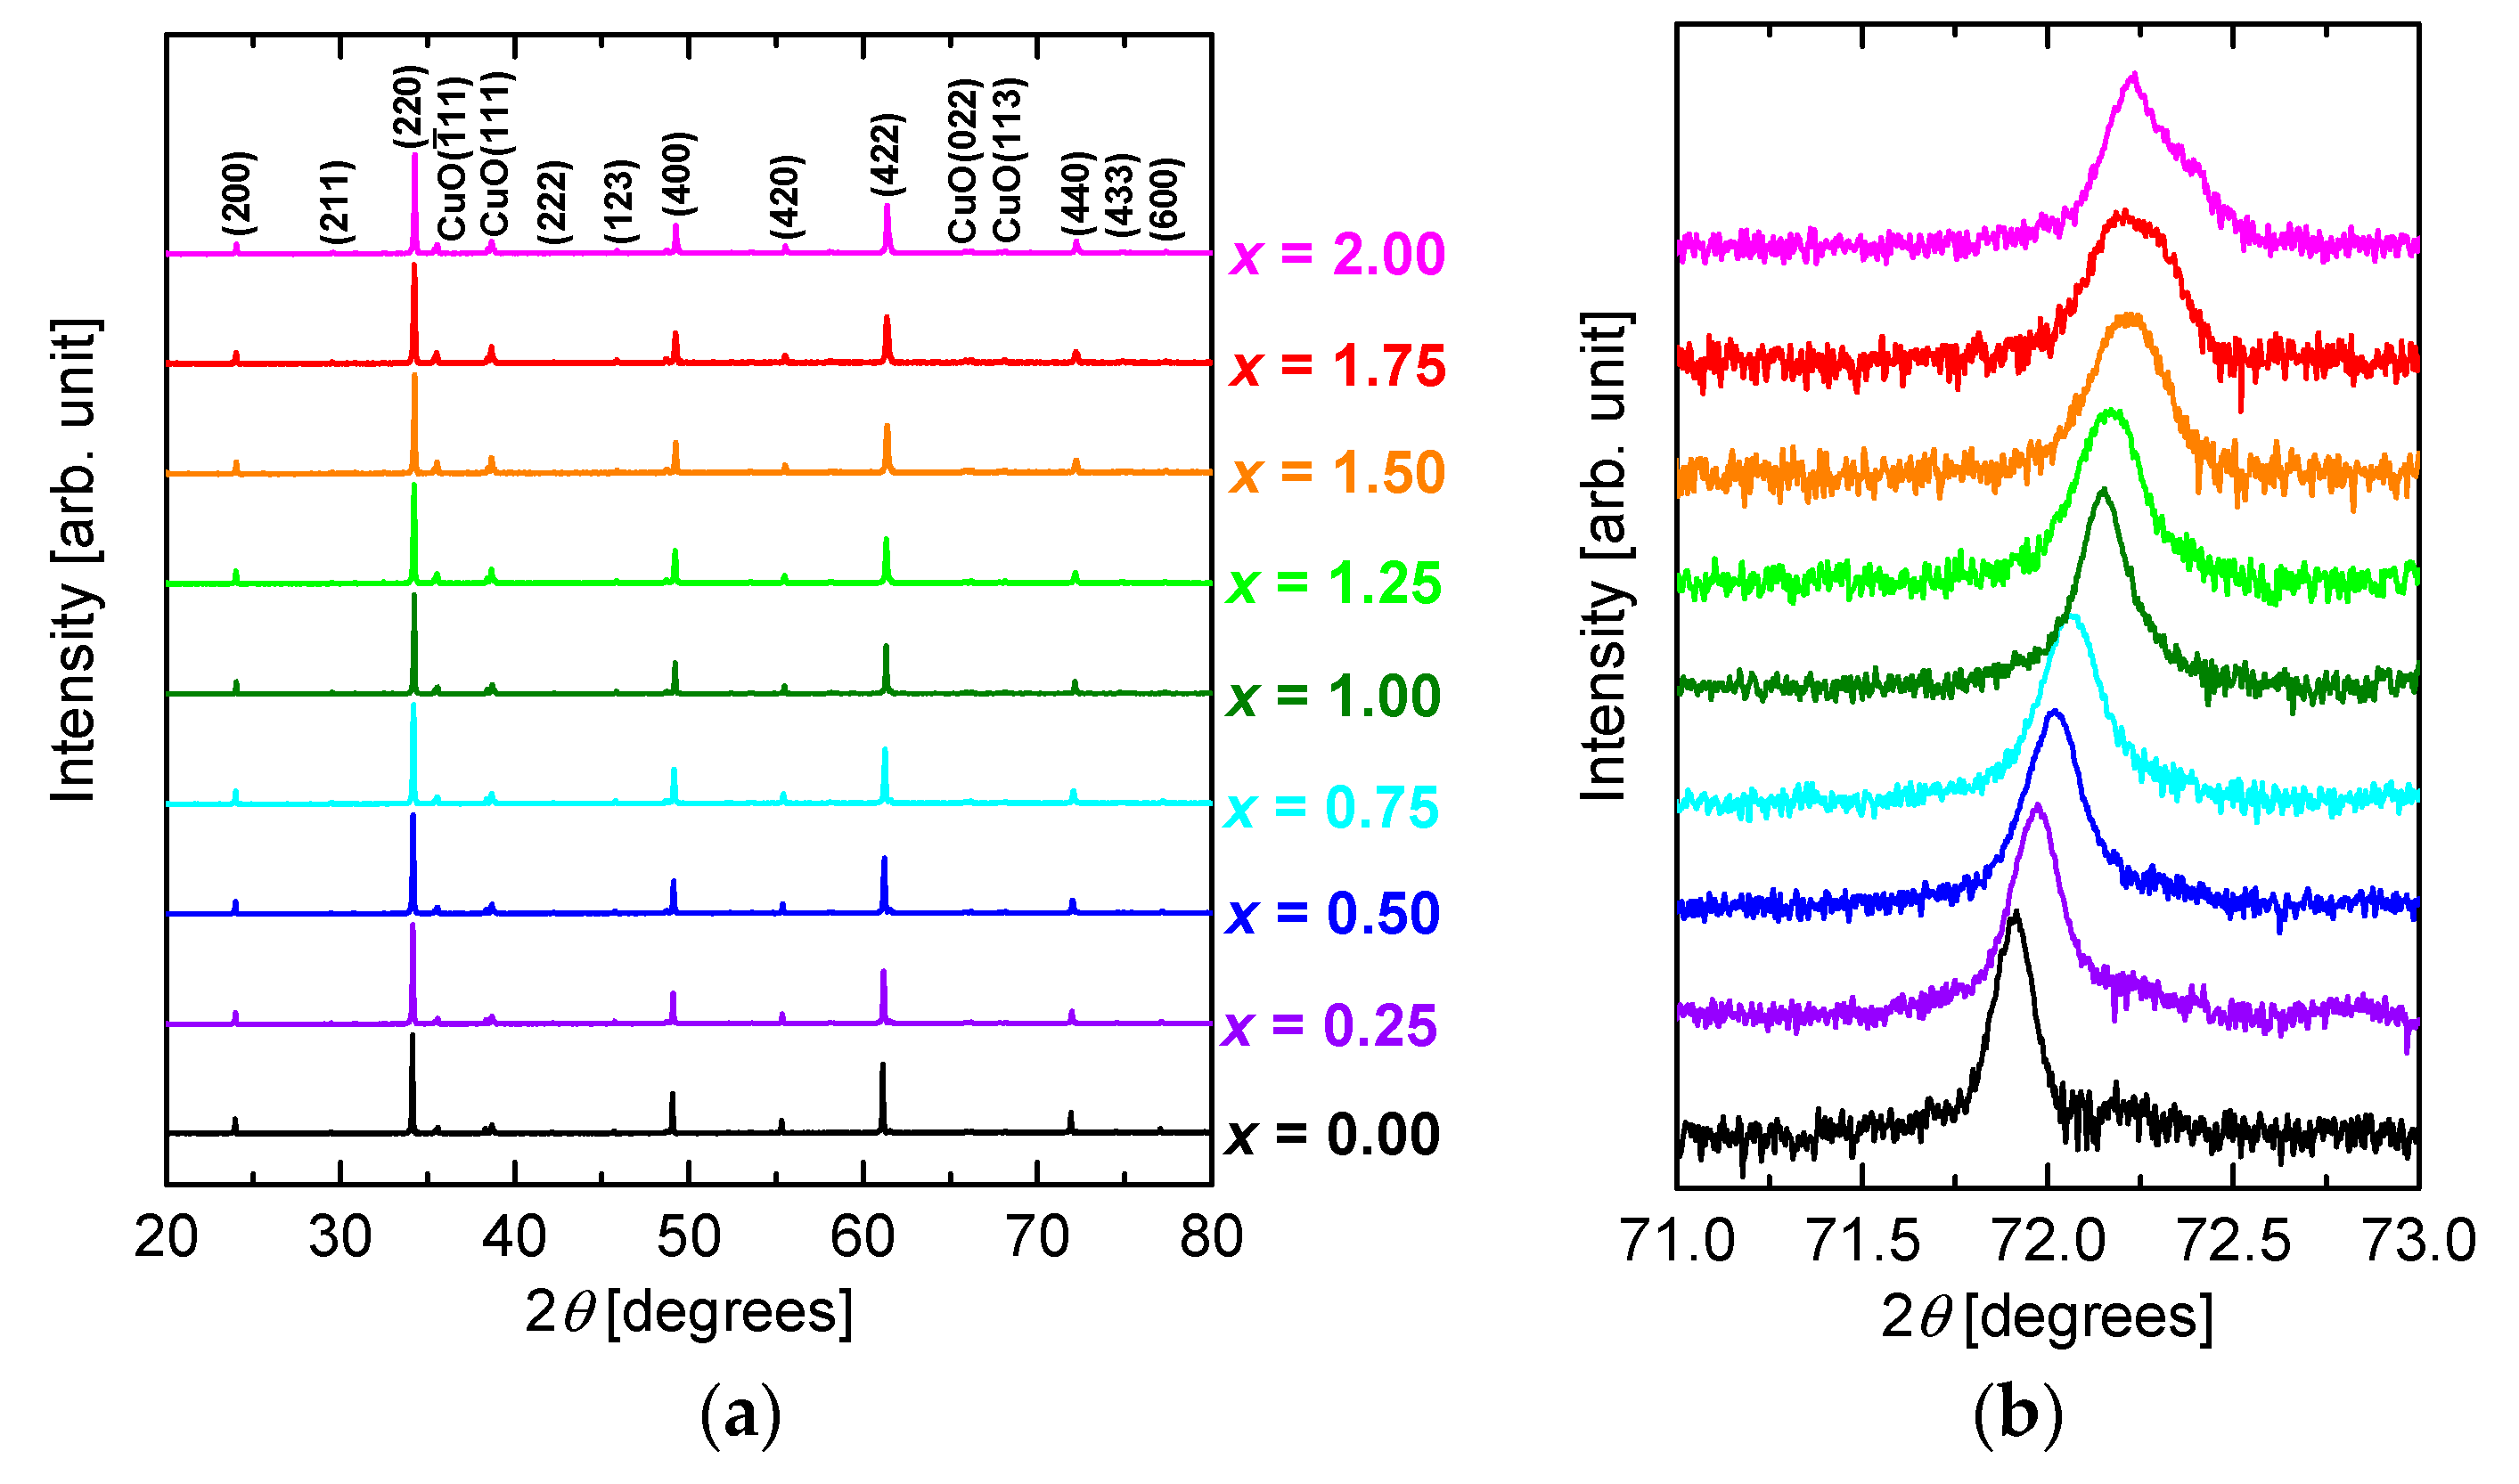
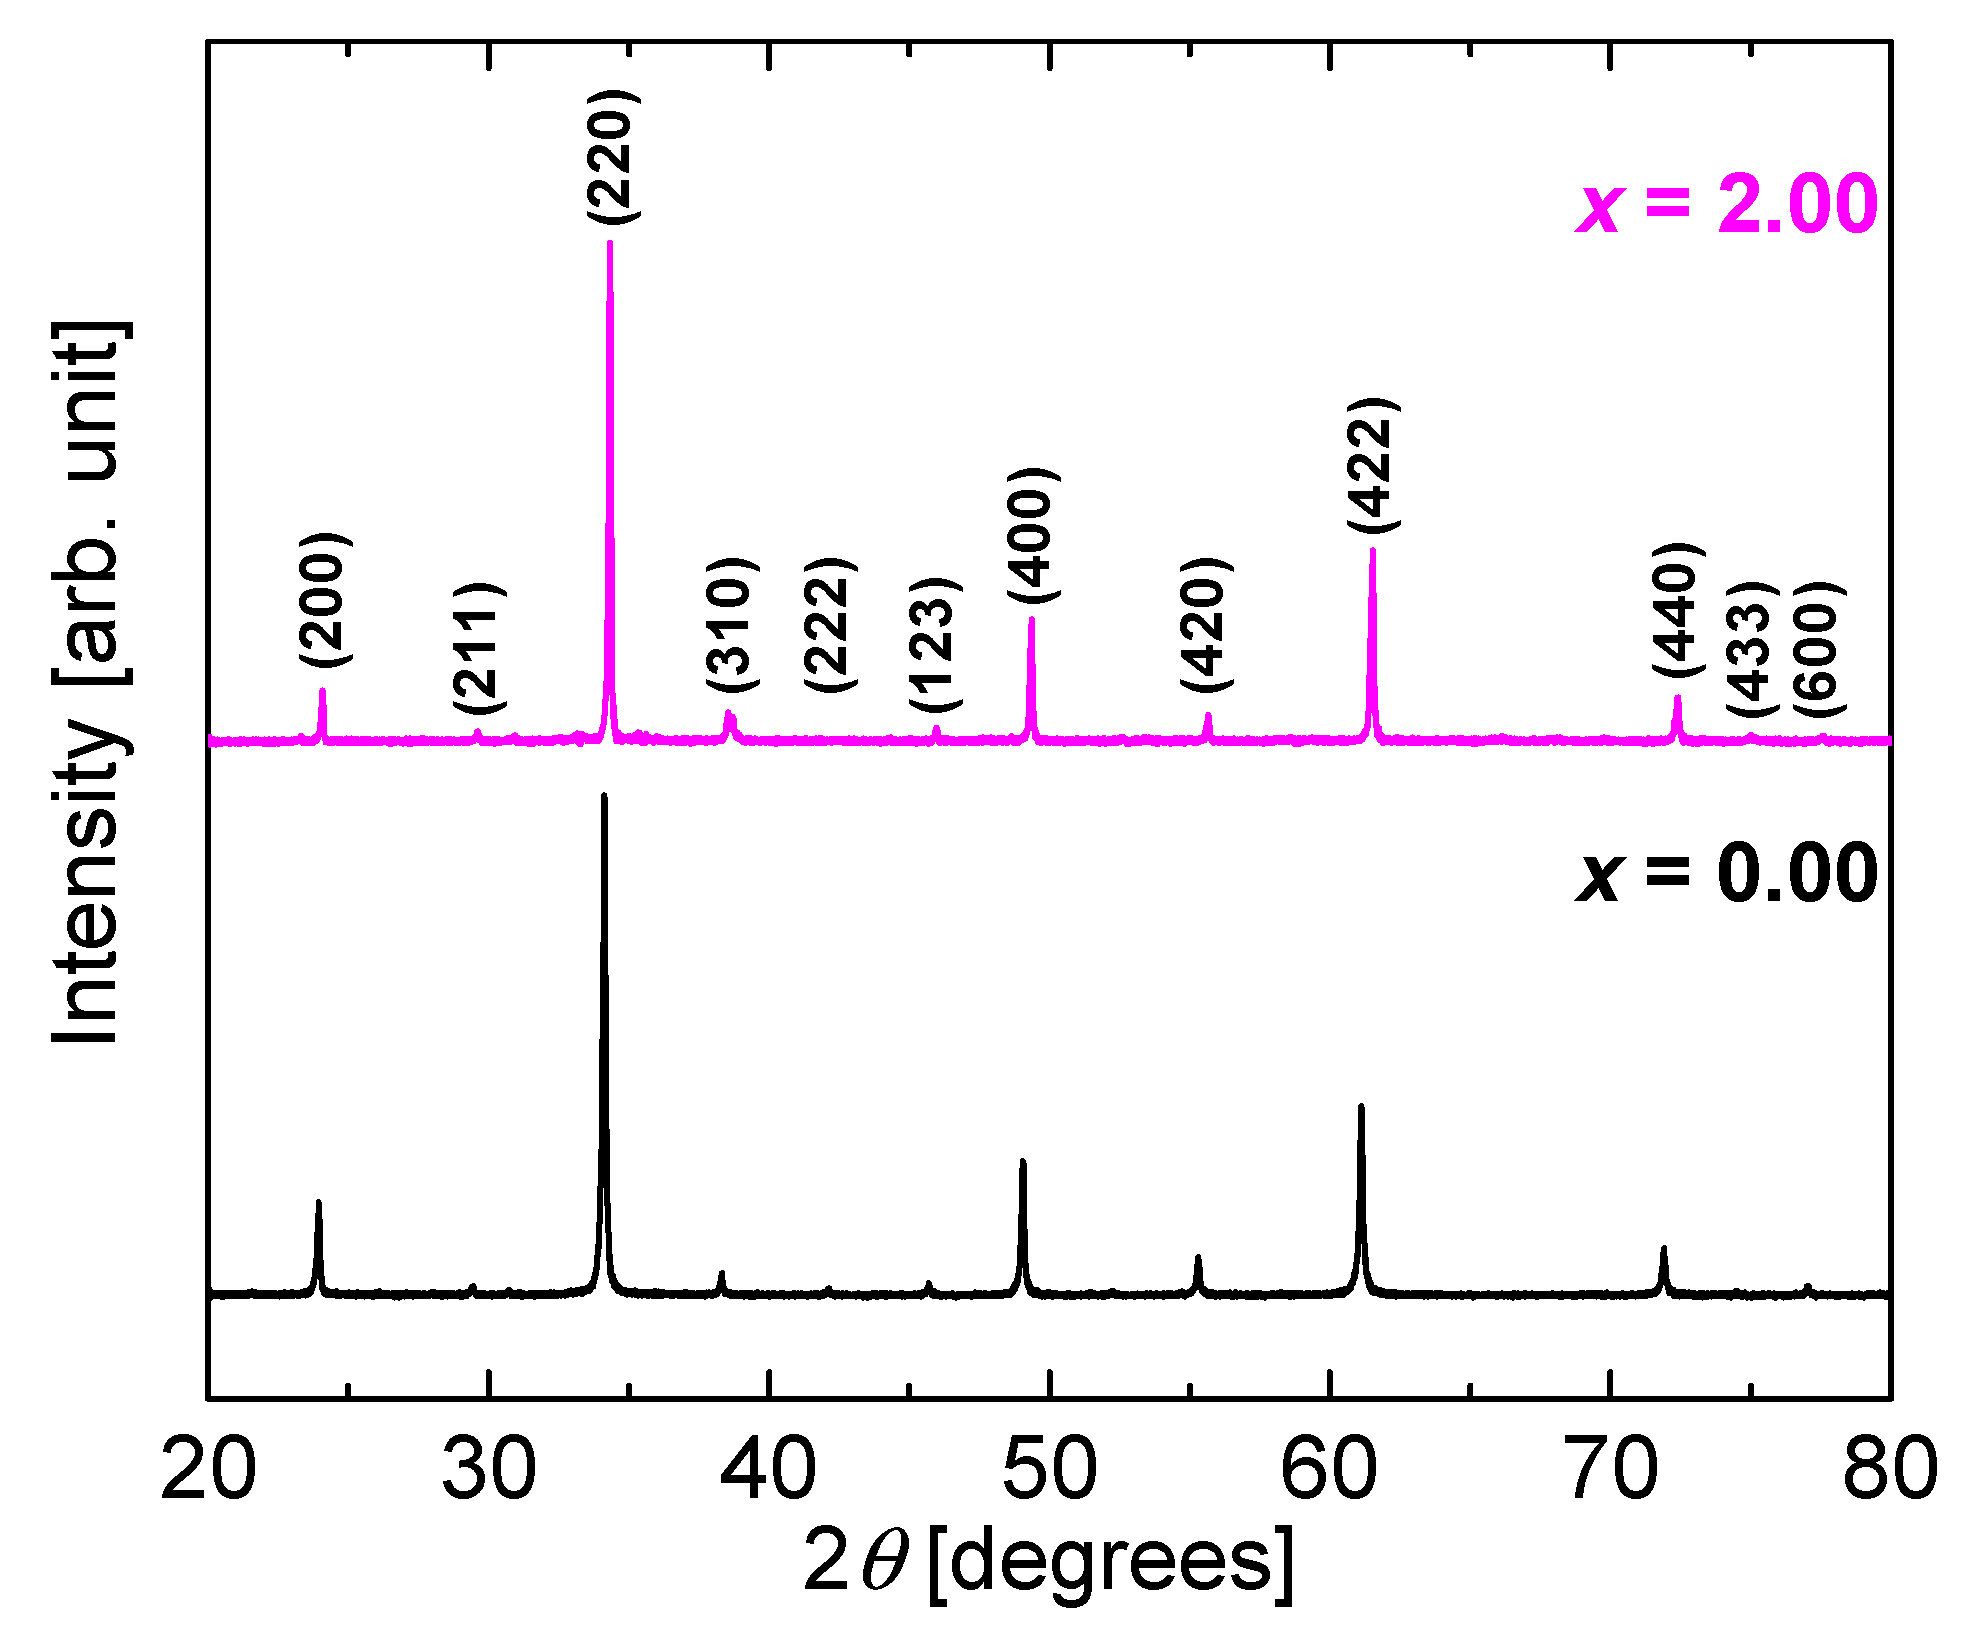
Figure 2a shows the XRD patterns of CuO(20 vol.%)-CaCu
3Ru
4−xMn
xO
12 bulks for
x varying between 0.00 and 2.00. All the patterns are similar, displaying peaks that can be assigned to CaCu
3Ru
4O
12 phase and CuO, respectively. The peaks corresponding to diffraction by the (440) planes of CaCu
3Ru
4O
12 phase are enlarged in
Figure 2b. The peaks are systematically shifted to higher diffraction angles with increasing
x, indicating that the lattice constant of the sample decreased as
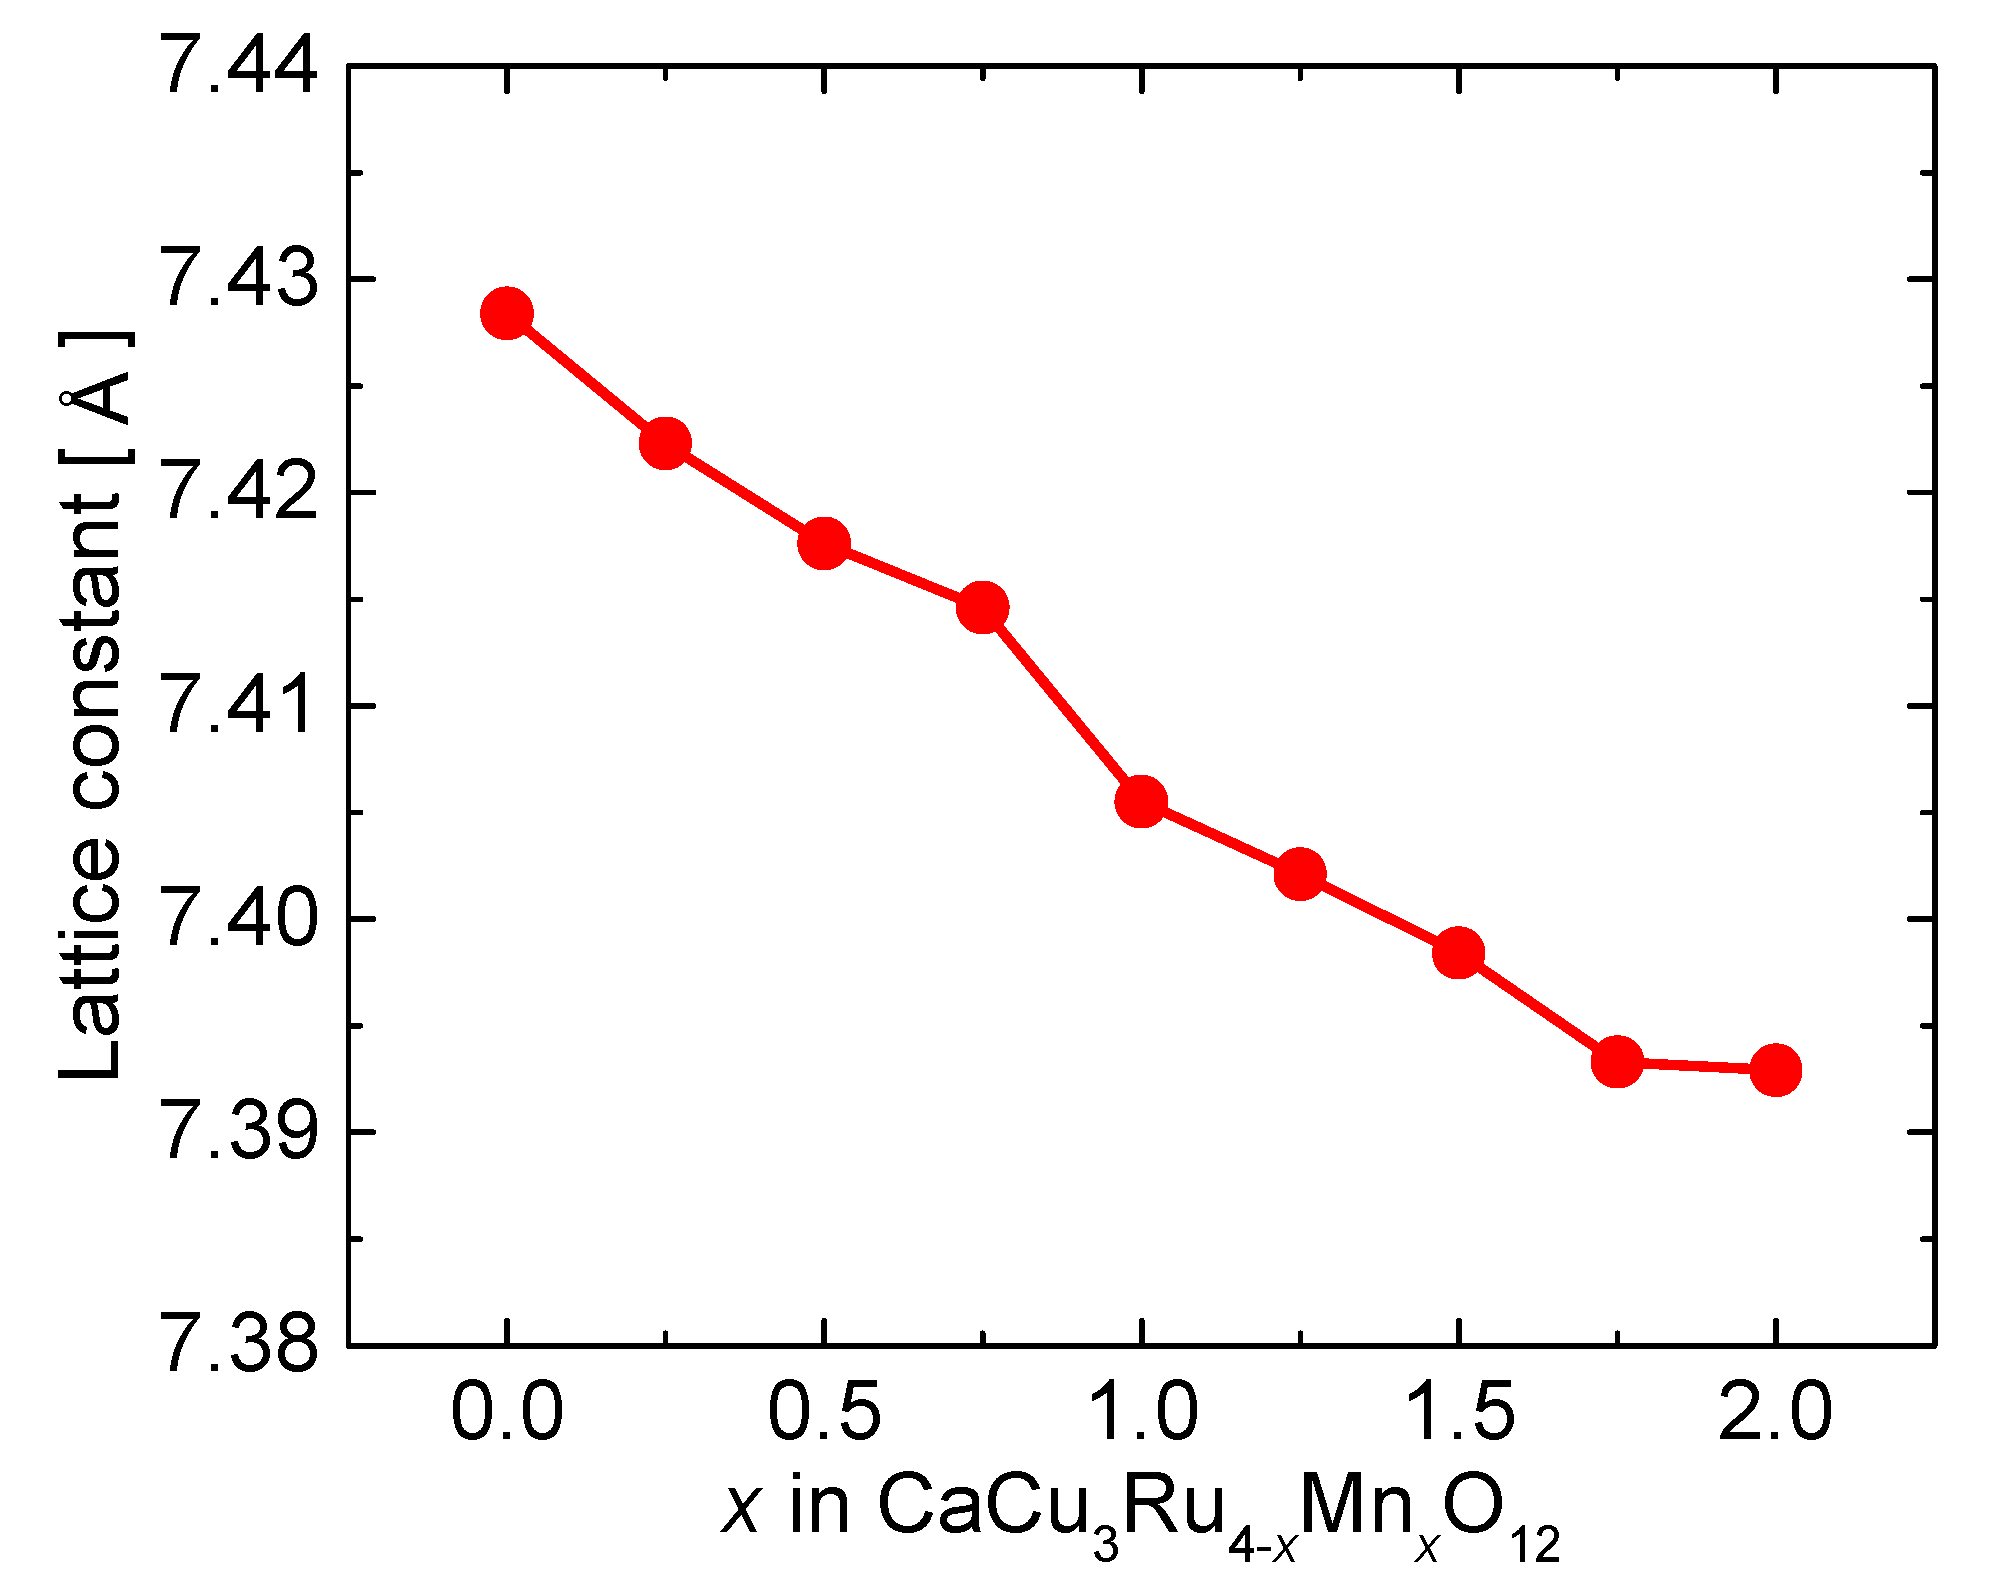
x increased. The lattice constant, which was calculated from the 2
θ angles corresponding to (
n00) planes, is plotted as a function of
x in
Figure 3. The lattice constant systematically decreases from 7.428 Å for CaCu
3Ru
4O
12 to 7.393 Å for CaCu
3Ru
2Mn
2O
12 with increasing
x. As a charge transfer from (Ru
4+ + Mn
4+) to (Ru
5+ + Mn
3+) has been reported to take place in SrMn
1−yRu
yO
3 [
27], we should consider this possibility in CaCu
3Ru
4−xMn
xO
12 as well. In both cases, given the respective ion size (Ru
4+: 0.62 Å, Ru
5+: 0.565 Å, Mn
3+: 0.645 Å, and Mn
4+: 0.53 Å), the shift observed in the XRD spectra can be explained by the smaller average size of the ions on the B-site of the substituted material (either Mn
4+ and Ru
4+, or Mn
3+ and Ru
5+) with respect to that of Ru
4+, even if the size reduction effect would be larger without the charge transfer. By contrast, the influence of such a charge transfer on the electrical transport and resistivity would be dramatically large. In light of our resistivity measurements discussed below, which show no such dramatic change upon substitution, we can infer that the valence of Ru did not change.
Figure 4 shows the XRD patterns of as-synthesized CaCu
3Ru
4O
12 and CaCu
3Ru
2Mn
2O
12 powders. The patterns of both are almost the same, and there are no peaks corresponding to the raw materials or some second phases. We accurately weighed the raw materials according to the stoichiometry of CaCu
3Ru
2Mn
2O
12. Therefore, if we assume that Mn could substitute Cu, yielding CaCu
3−yMn
yRu
4−xMn
xO
12, then the composition ratio of the raw materials would not match that of the formed compound, and some peaks corresponding to the raw materials and/or second phases would be observed in the XRD patterns. From this result, we consider that a very small quantity of Mn may have substituted Cu. In
Figure 2b, the peaks corresponding to the (440) plane of CaCu
3Ru
2.25Mn
1.75O
12 and CaCu
3Ru
2Mn
2O
12 are broader than those of the other samples. This broadening may due to a phase separation between the phases with and without Cu-Mn substitution in the samples with high Mn substitution.
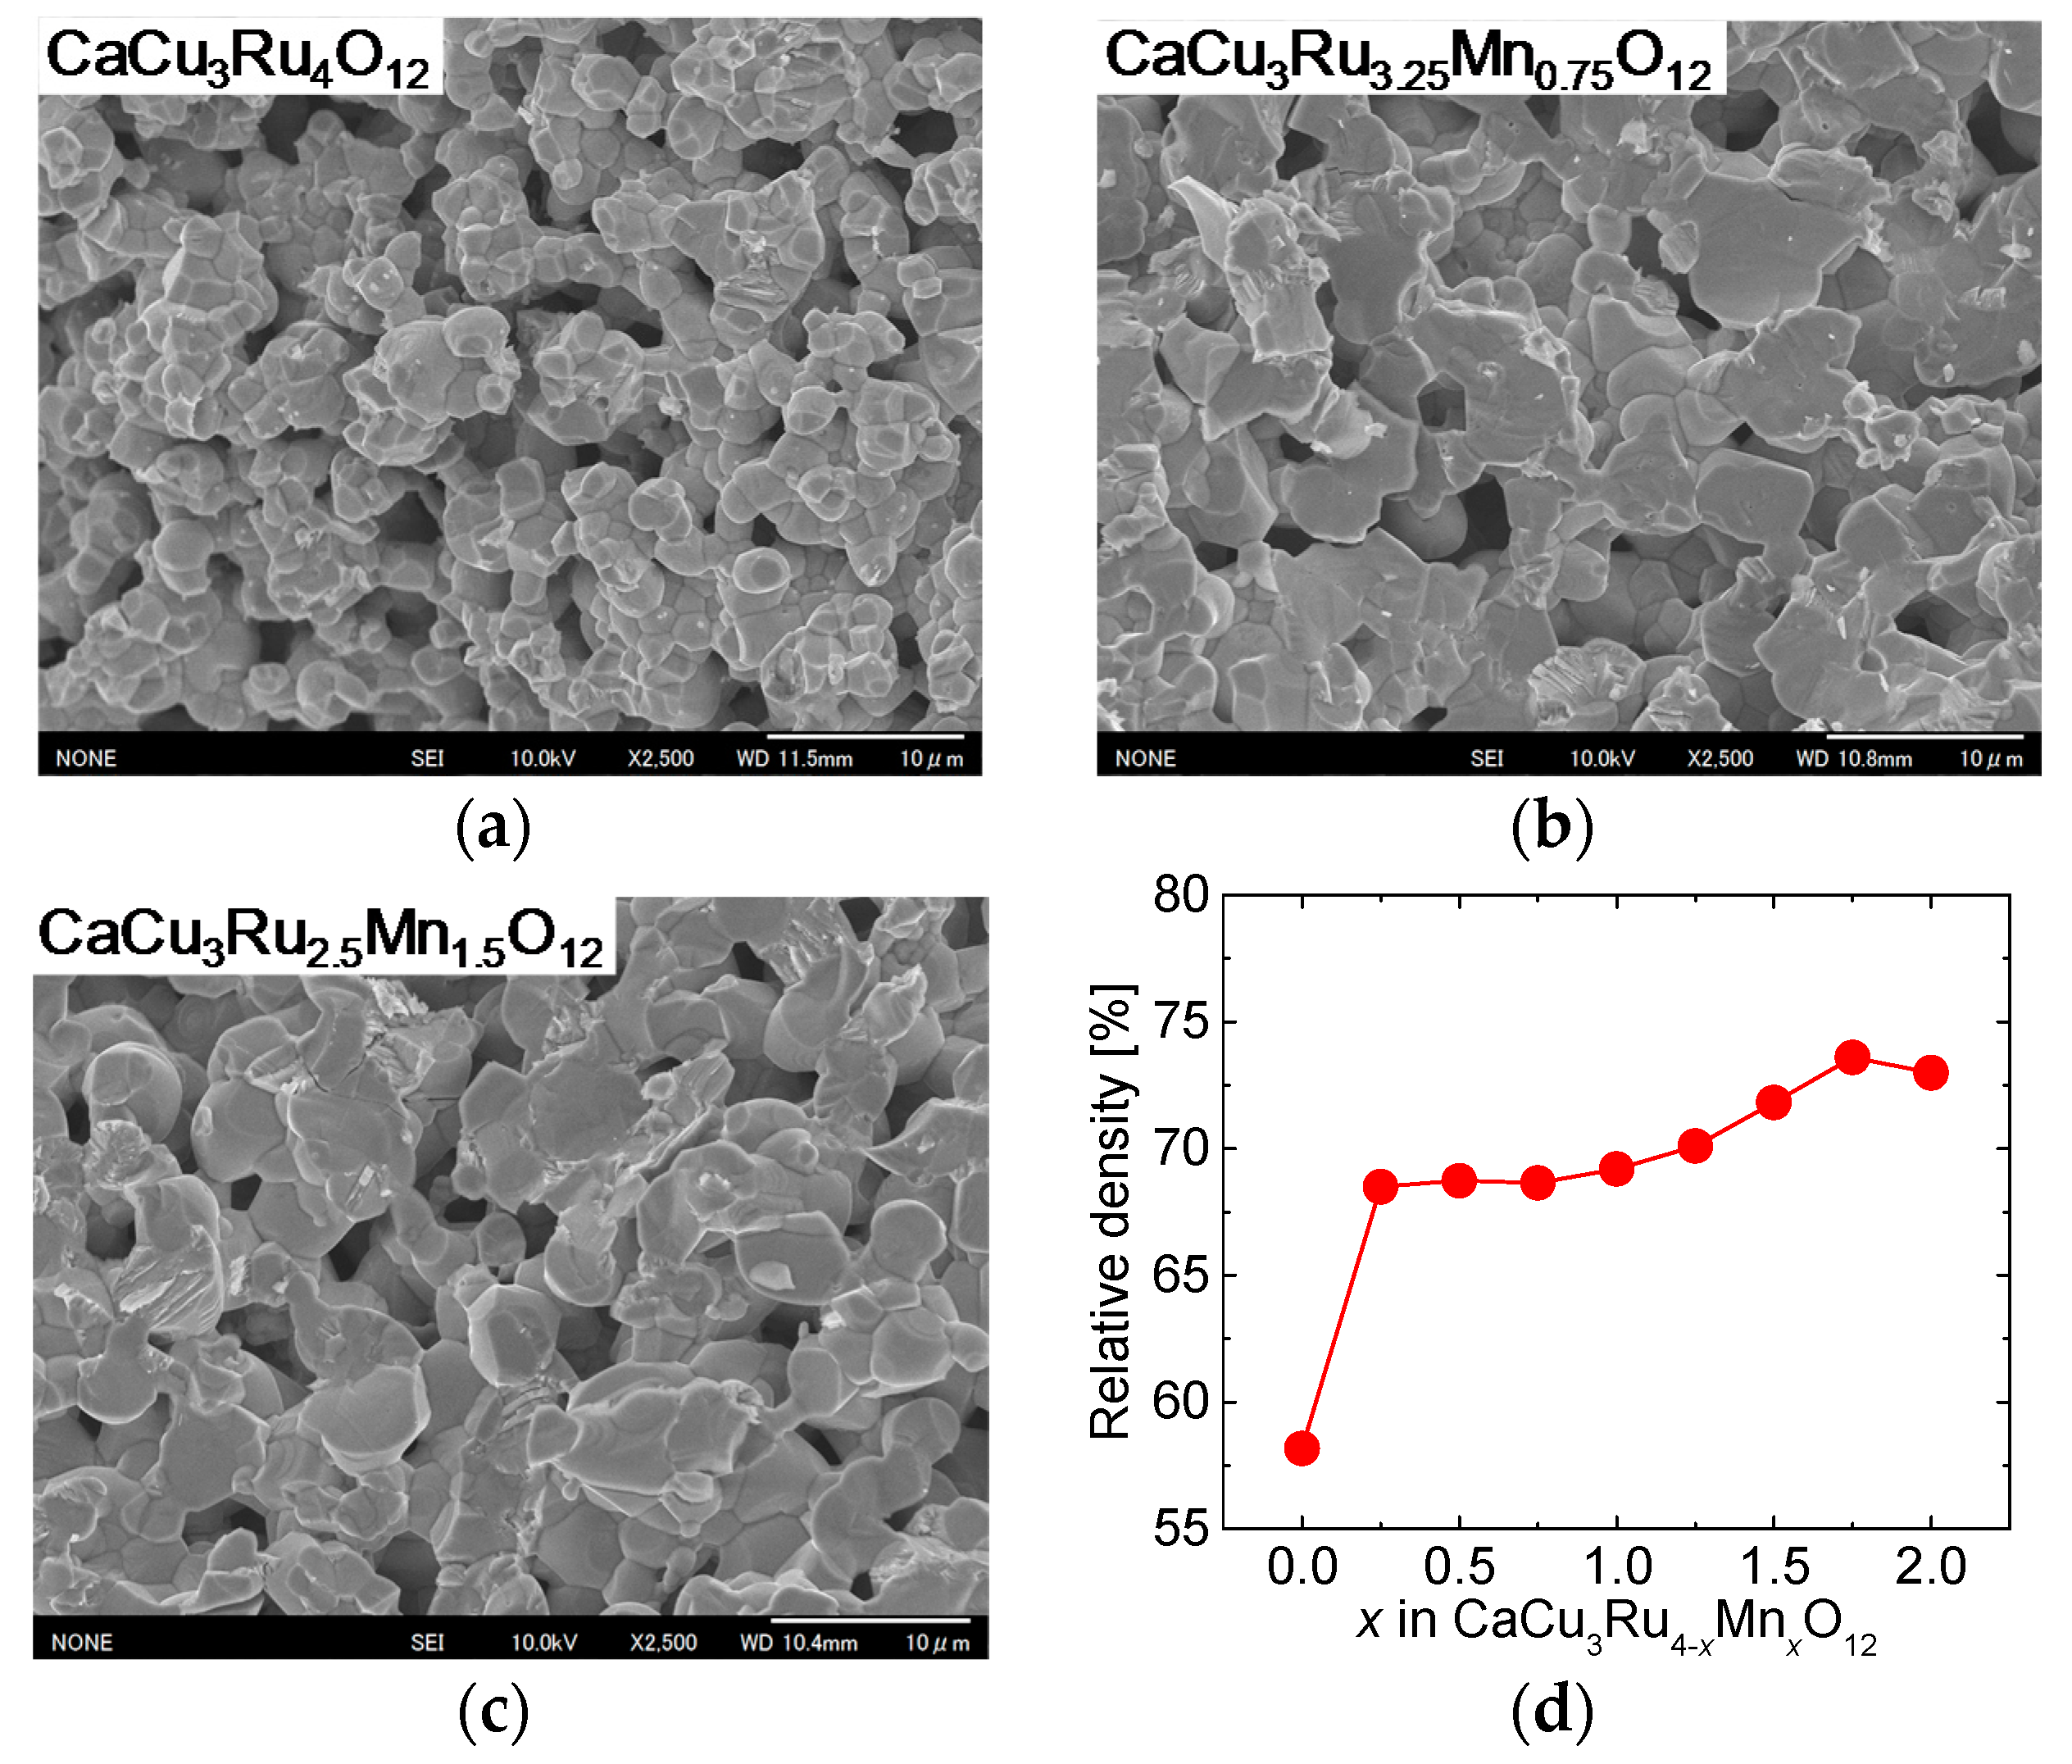
Figure 5a through c show FE-SEM images of the surface of the samples with
x = 0.00, 0.75, and 1.50, respectively. In all samples, the grains fused together, and there are a lot of voids. The diameter of the grain was about 3 and 5 μm without and with Mn substitution, respectively. The grain size in the samples with Mn substitution was observed to be almost the same for all values of
x ≠ 0.00. As it depends on the grain size, the thickness of the necks between the grains was larger in the substituted samples than in the unsubstituted sample.
Figure 5d shows the relative density of CuO(20 vol.%)-CaCu
3Ru
4−xMn
xO
12 bulks as a function of
x. The relative density displayed a dramatic increase between
x = 0.00 (unsubstituted sample) and
x = 0.25, and then slightly increased with increasing
x. The results shown in
Figure 5 suggest that Mn substitution increased the defect density, which promoted volume diffusion, and, in turn, grain growth and densification of the CaCu
3Ru
4−xMn
xO
12 phase.
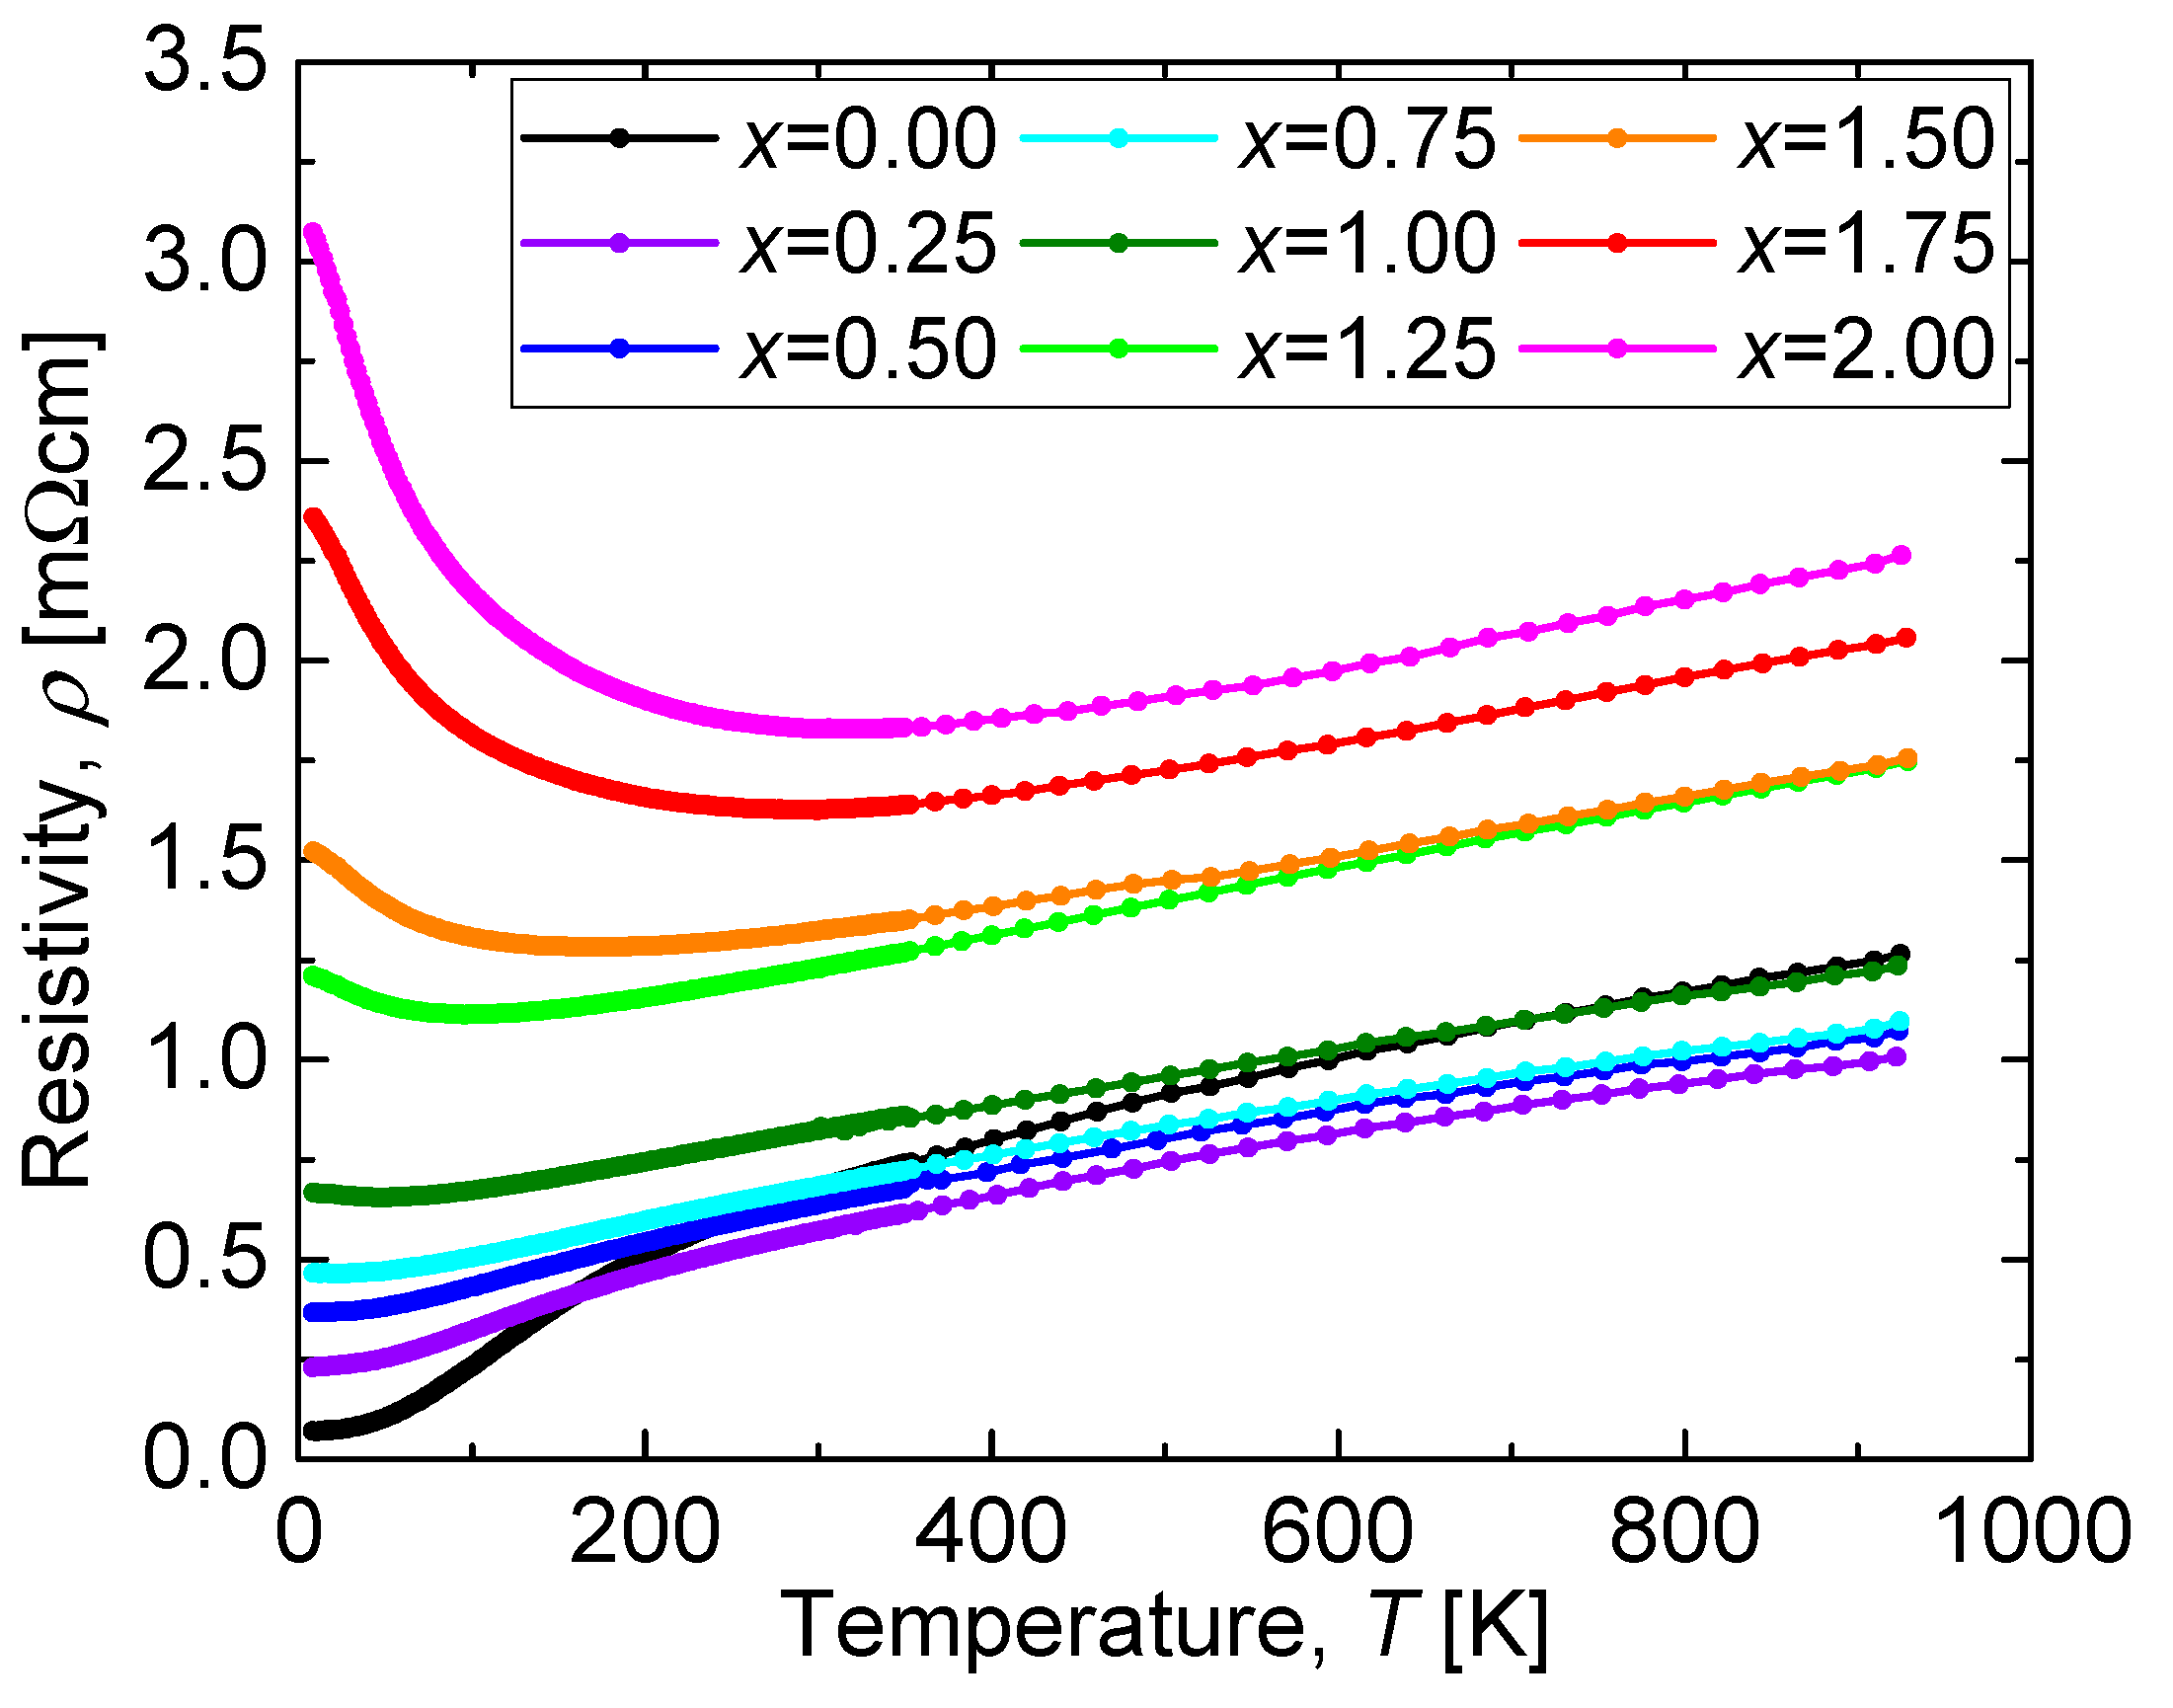
The temperature dependence of the resistivity (
ρ-
T curve) of the CuO(20 vol.%)-CaCu
3Ru
4−xMn
xO
12 bulks is shown in
Figure 6. The resistivity systematically increased with increasing
x except for the sample with
x = 0.00, which is attributed to its lower relative density with respect to the other (Mn-substituted) samples. A CaCu
3Ru
4O
12 bulk sample prepared with a similar relative density to that of the Mn-substituted samples would be expected to have a lower resistivity than that of the sample with
x = 0.25. It is noteworthy that the resistivity value was always as low as a few mΩcm, even in the sample with
x = 2.00, which contains as many Mn as Ru ions. In the case of other perovskite materials with Ru-Mn substitution such as CaRu
1−xMn
xO
3 and SrRu
1−xMn
xO
3, the substitution of half of the Ru-sites with Mn causes a drastic increase in the resistivity or band gap [
28,
29]. In particular, the resistivity increases at 300 K from 2 mΩcm for SrRuO
3 to 20 mΩcm for SrRu
0.5Mn
0.5O
3. In these materials, Ru 4d electrons are responsible for electrical conduction, while Mn substitution reduces the overlaps between the electron clouds. However, as mentioned in the introduction, in the case of CaCu
3Ru
4O
12, electrons from the A-site (Cu
2+) are also responsible for electrical conduction [
11], which explains the low resistivity of CaCu
3Ru
2Mn
2O
12.
While the resistivity systematically increased with increasing x, it showed the same temperature dependence at high temperatures for all values of x. The reason for this is that phonon scattering following Matthiessen’s rule is the dominant parameter that influences the electrical resistivity at temperatures above 300 K. On the other hand, the temperature dependence of the resistivity at low temperatures differed according to the value of x. The residual resistivity ρ(T = 0) increased with increasing x below x = 1.00. Above x = 1.25, the resistivity increased with cooling, which corresponds to a semiconducting behavior.
Let us analyze the semiconducting behavior at low temperatures of Mn-substituted samples using two kinds of transport mechanism, the activated conduction and the hopping conduction, which are representative conduction mechanisms for semiconducting electrical transport. Parts of the
ρ-
T curves corresponding to a transport mechanism dominated by activated conduction can be fitted by the following equation:
where
kB,
T, and
Eg are the Boltzmann constant, absolute temperature, and activation energy, respectively. In that way, the activation energy, i.e., the transport gap
Eg, can be determined.
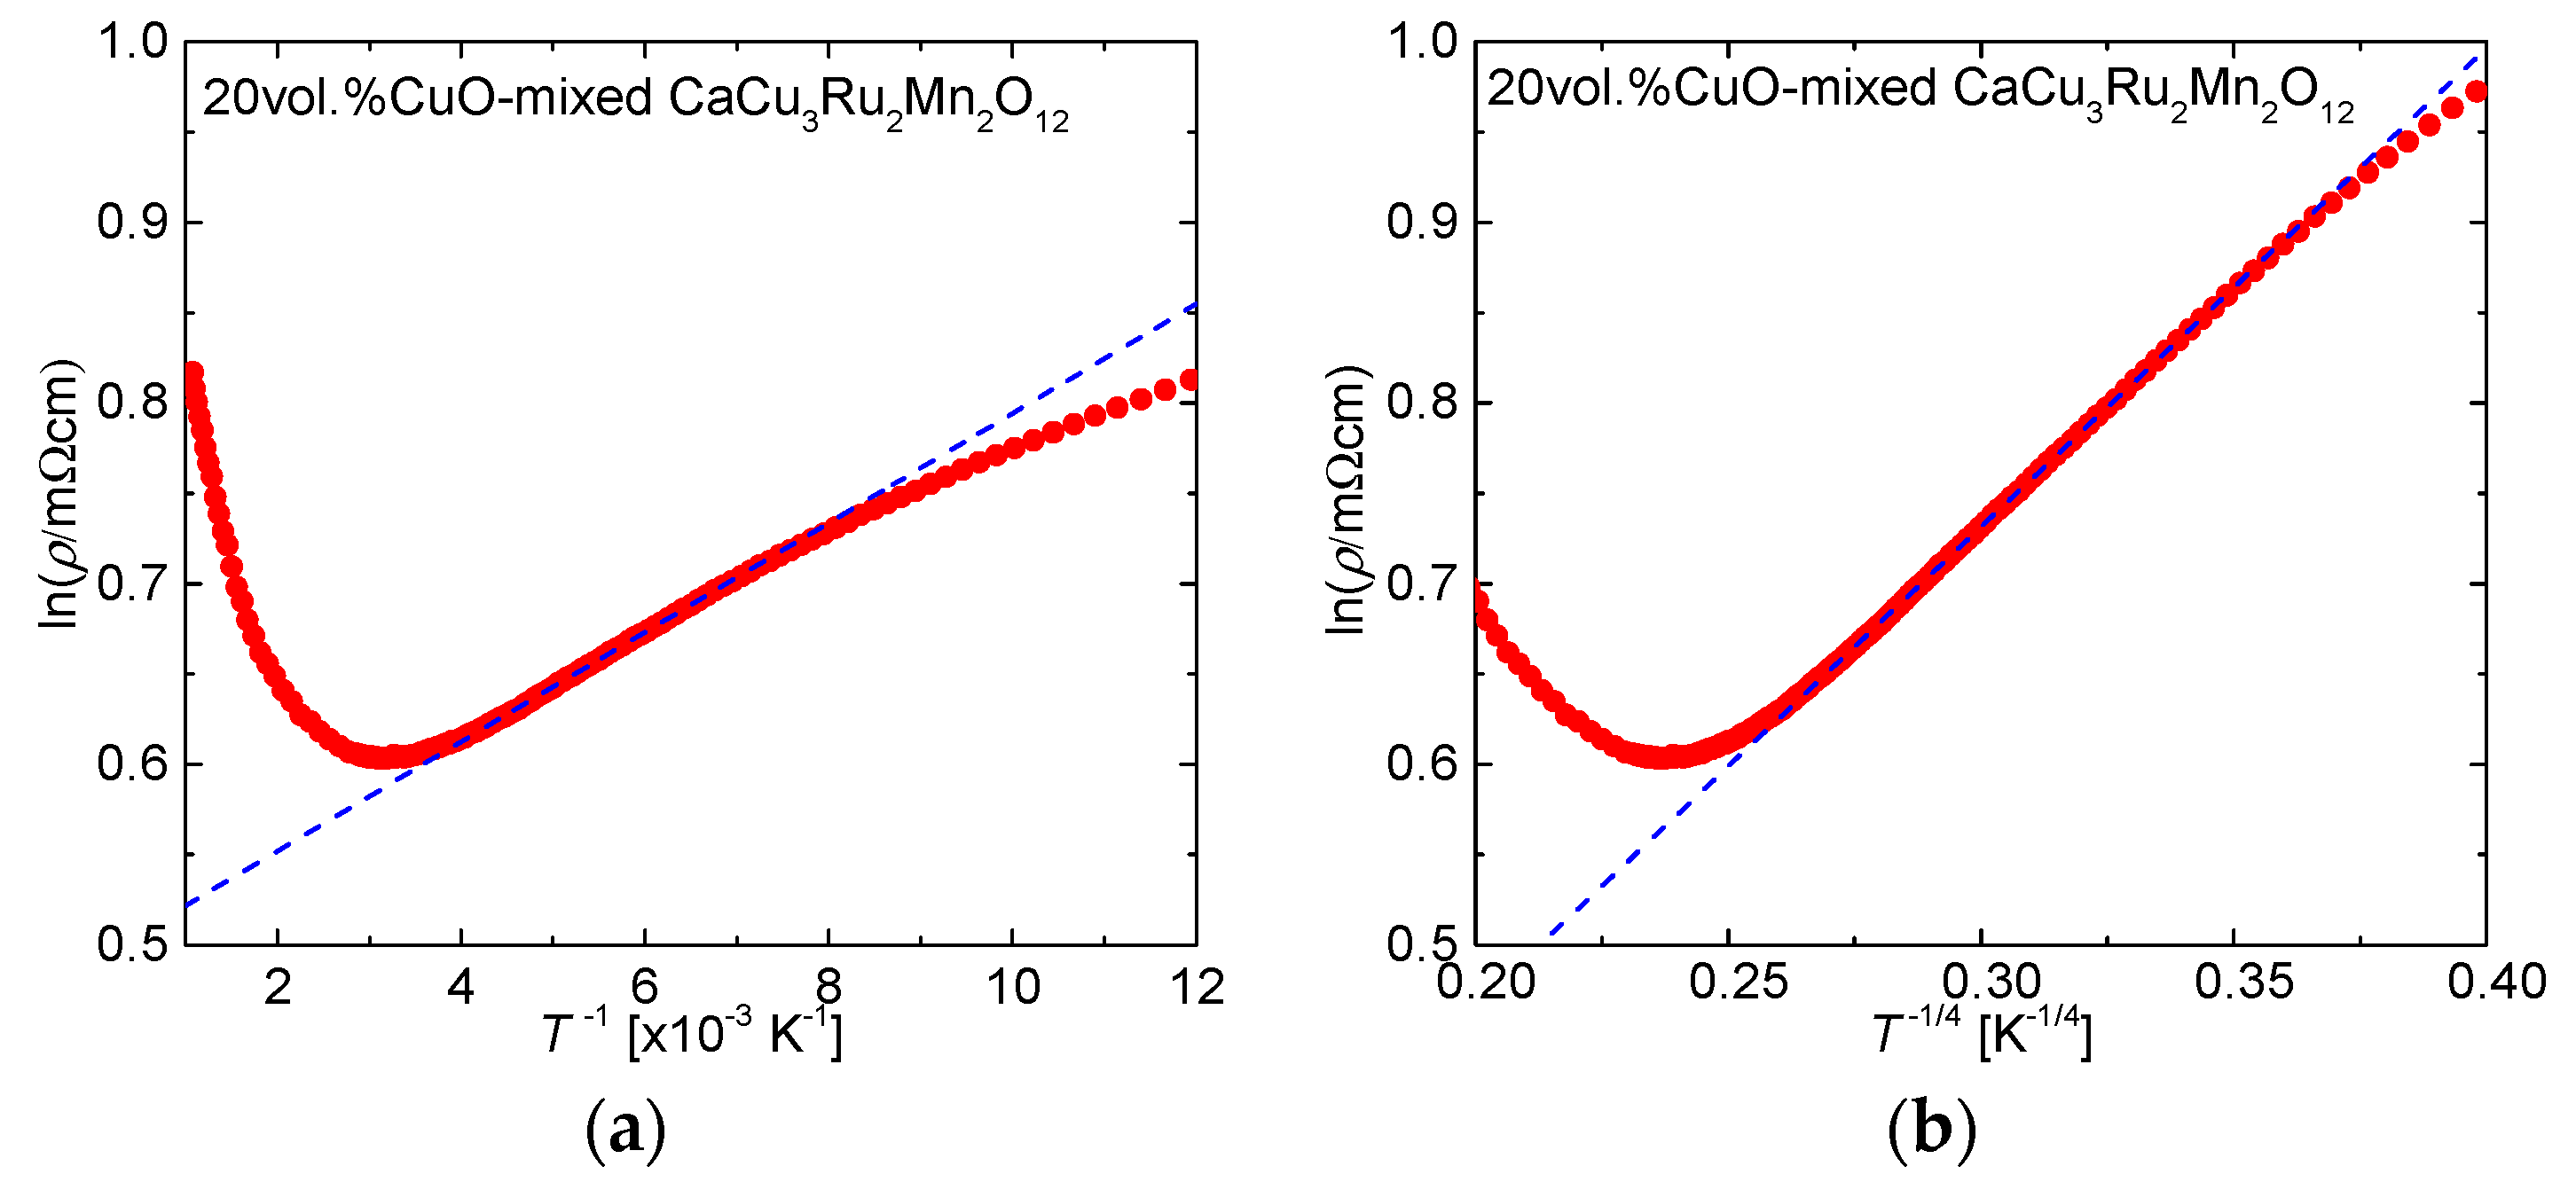
Figure 7a shows ln(
ρ/mΩcm) plotted against
T−1 for CaCu
3Ru
2Mn
2O
12. The fitting curve corresponding to Equation (1) is shown as a broken line. The plot was well fitted by Equation (1) between
T−1 = 5.563 × 10
−3 (i.e.,
T = 179.76 K) and 4.204 × 10
−3 (i.e.,
T = 237.86 K), in good agreement with the minimal value of the resistivity showed in
Figure 6. From the fitting curve, the activation energy, expressed as a temperature, was determined as
Eg/
kB = 30.28 K. This temperature is much lower than the temperature at which semiconducting behavior begins, indicating that activated conduction is not employed in CaCu
3Ru
2Mn
2O
12 at low temperatures; hopping conduction is the conduction mechanism at work.
Variable range hopping (VRH) conduction is one type of hopping conduction that gives rise to a temperature dependence of the resistivity of the form [
30]:
Figure 7b shows ln(
ρ/mΩcm) plotted against
T−1/4 for CaCu
3Ru
2Mn
2O
12. The broken line is the fitting curve obtained with Equation (2). The fitting line fits to the plot for
T−1/4 between 0.3612 (i.e.,
T = 58.76 K) and 0.2609 (i.e.,
T = 215.89 K). This temperature range roughly corresponds to the temperature region where CaCu
3Ru
2Mn
2O
12 showed semiconducting behavior according to the
ρ-
T curve shown in
Figure 6. Accordingly, it can be concluded that the conducting mechanism in CaCu
3Ru
2Mn
2O
12 at low temperatures is VRH conduction. Hopping conduction occurs due to the discontinuity of Ru conduction caused by Mn substitution, which explains the expansion of the temperature range of the semiconducting behavior to higher temperatures with increasing
x, as shown in
Figure 6.
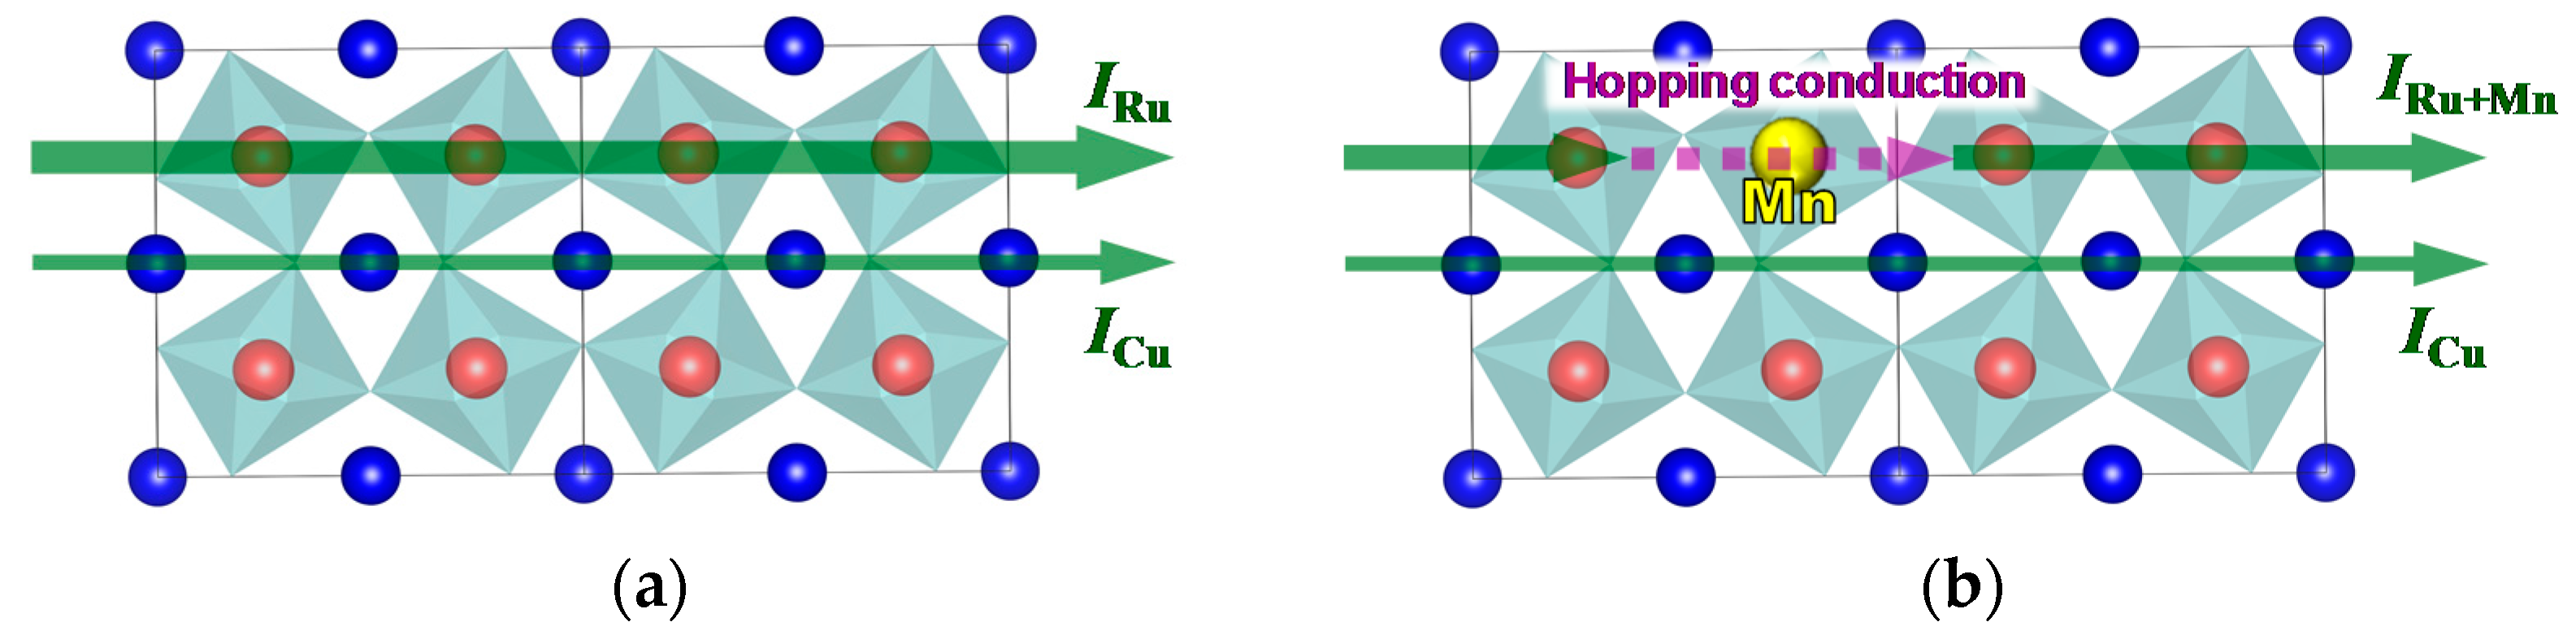
From these results, it appears that two electrical conduction mechanisms underlie the electrical conduction in CaCu
3Ru
4−xMn
xO
12, as schematically shown in
Figure 8. As reported in previous reports, CaCu
3Ru
4O
12 (
x = 0) exhibits two kinds of electrical current paths (
Figure 8a). The first one relies on the Ru-O network (
IRu), while the second relies on Cu
2+ (
ICu). In the case of
x ≠ 0 (
Figure 8b), the substitution of part of the Ru sites with Mn disrupts the conducting Ru-O network, and conduction electrons hop on to the Mn sites along their path (
IRu+Mn). Hopping slows down the electrons, therefore
IRu+Mn is smaller than
IRu. However, the decrease in the total conduction current intensity is small as
ICu is not affected by the presence of Mn.
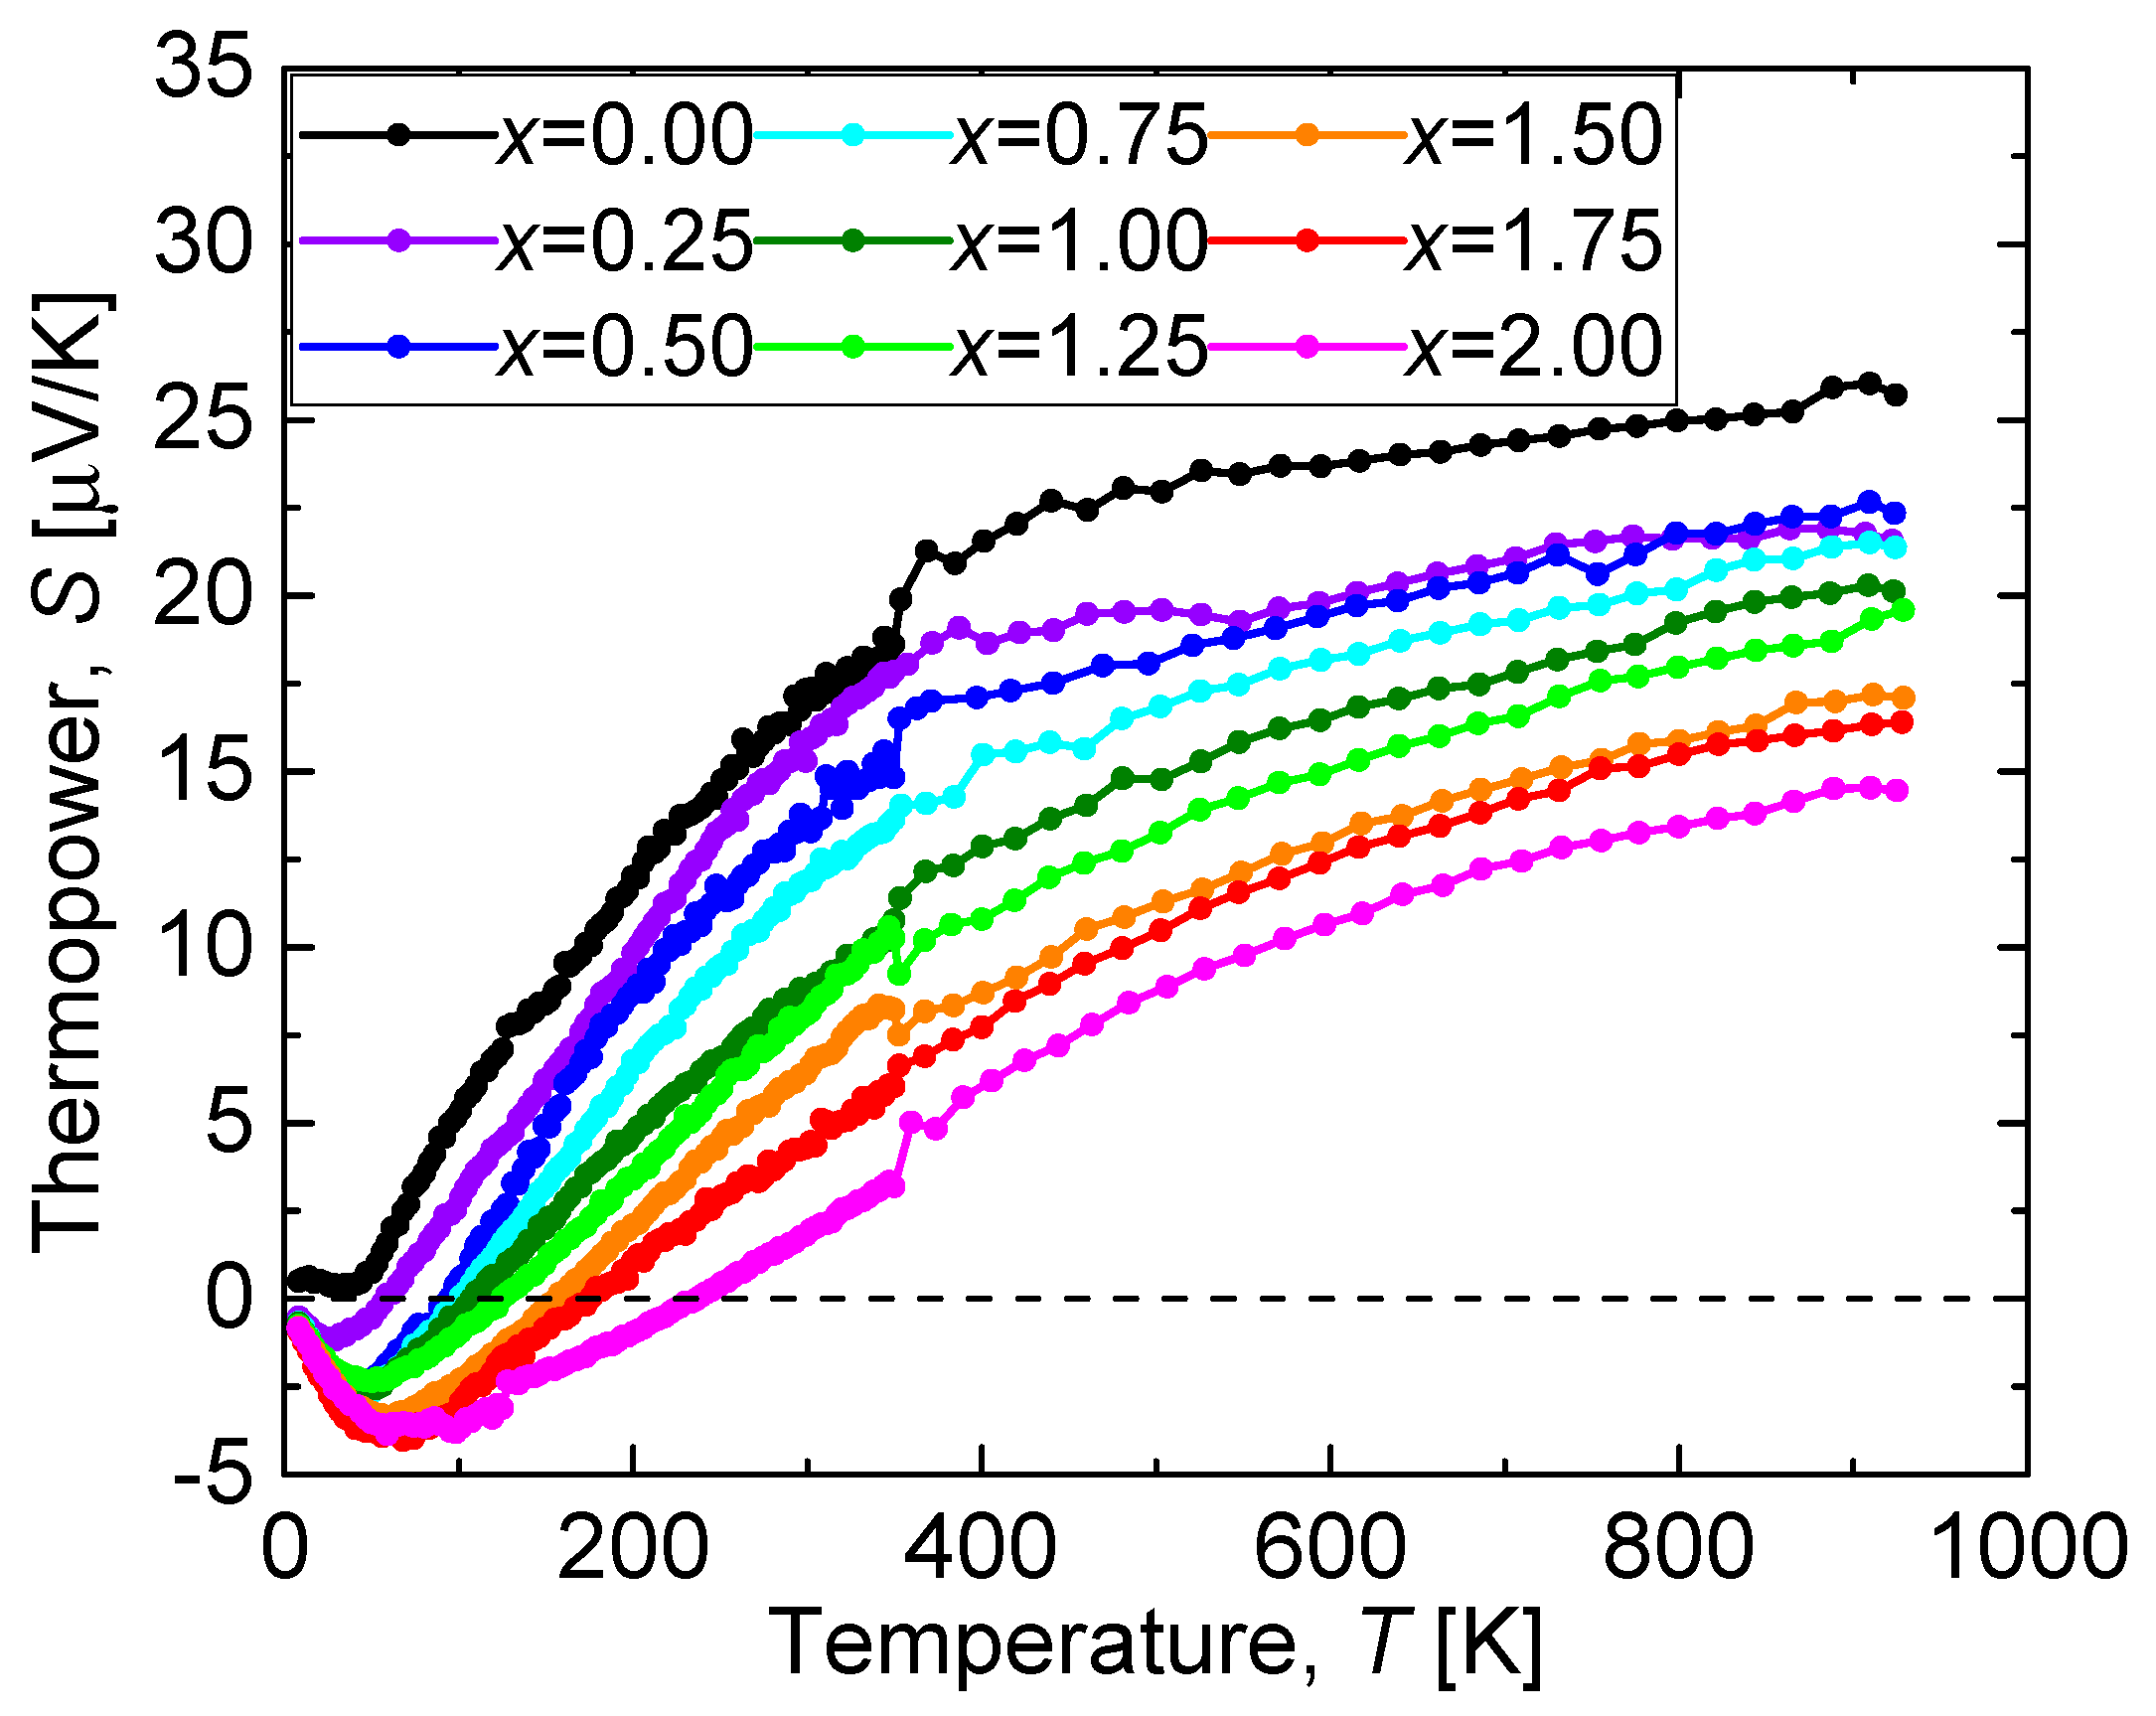
Figure 9 shows the temperature dependence of the thermopower
S (
S-
T curve) of the CuO(20 vol.%)-CaCu
3Ru
4−xMn
xO
12 bulks. Similarly to the
ρ-
T curves, the
S-
T curves exhibit a systematic variation with
x. The thermopower of all samples decreased with cooling, and the thermopower of the Mn-substituted samples was negative at low temperatures, while that of CaCu
3Ru
4O
12 was positive. A similar effect was observed for Ca
0.5Sr
0.5RuO
3 and Ca
0.5Sr
0.5Ru
0.5Mn
0.5O
3, whose thermopower between 10 and 280 K is respectively positive and negative between 10 and 280 K, explained by the fact that the Ru-Mn substitution changes the majority carrier from holes to electrons [
28]. The temperature range in which the thermopower of the CuO(20 vol.%)-CaCu
3Ru
4−xMn
xO
12 bulks is negative increased with increasing
x, indicating that a gradual change of majority carrier took place in the CuO(20 vol.%)-CaCu
3Ru
4−xMn
xO
12 bulks with increasing
x. This Mn substitution effect is considered to be weaker in CaCu
3Ru
4−xMn
xO
12 than in Ca
0.5Sr
0.5Ru
1−xMn
xO
3 because of the A-site-based electrical conduction, which, as already mentioned, is not affected by B-site substitution.
It has been reported that the temperature dependence of the thermopower in the case of VRH conduction is of the form:
S =
T1/2 [
31].
Figure 10 shows the thermopower
S of CaCu
3Ru
2Mn
2O
12 plotted against
T1/2. Although VRH conduction was observed below 215.89 K in the resistivity curve (215.89 K corresponds to
T1/2 = 14.7 K
1/2, shown as a black dash line in
Figure 10), the fitting line in
Figure 10 (shown as a red solid line) corresponding to |
S| =
aT1/2 +
b indicates VRH conduction below
T1/2 = 7 K
1/2 (
T = 49 K, shown as a blue dot line). This discrepancy can be explained by the fact that the fitting equation for
S has been derived from a model of an amorphous semiconductor with a single type of carrier, while both electrons and holes are electrical carriers in CaCu
3Ru
4−xMn
xO
12. As
S is strongly affected by the type of carrier, the red fitting line in
Figure 10 fitted the
S(
T1/2) curve only at very low temperatures, because holes lose mobility at these temperatures and electrons can be considered as the only charge carriers.


 ,
, 