Article

Optical and X-Ray Topographic Studies of Dislocations, Growth-Sector Boundaries, and Stacking Faults in Synthetic Diamonds

by
Moreton Moore
1,*,
Stuart G. Nailer
2 and
Wojciech K. Wierzchowski
3
1
Department of Physics, Royal Holloway University of London, Surrey, TW20 0EX Egham, UK
2
Hilti Corporation, Feldkircherstrasse 100, 9494 Schaan, Liechtenstein
3
The Institute of Electronic Materials Technology, 133, 01-919Warsaw Wólczyńska, Poland
*
Author to whom correspondence should be addressed.
Crystals 2016, 6(7), 71; https://doi.org/10.3390/cryst6070071
Submission received: 2 May 2016 / Revised: 13 June 2016 / Accepted: 17 June 2016 / Published: 24 June 2016
(This article belongs to the Special Issue Crystal Dislocations)

Abstract

:
The characterization of growth features and defects in various high-pressure high-temperature (HPHT) synthetic diamonds has been achieved with optical and X-ray topographic techniques. For the X-ray studies, both characteristic and synchrotron radiation were used. The defects include dislocations, stacking faults, growth banding, growth sector boundaries, and metal inclusions. The directions of the Burgers vectors of many dislocations (edge, screw, and mixed 30°, 60°, and 73.2°), and the fault vectors of stacking faults, were determined as <110> and 1/3 <111> respectively. Some dislocations were generated at metallic inclusions; and some dislocations split with the formation of stacking faults.

Graphical Abstract

1. Introduction

The purpose of these studies was to characterize the various growth features and defects in some specimens of synthetic high-pressure high-temperature (HPHT) diamonds grown by the reconstitution technique [1,2,3]; and to identify Burgers vectors of dislocations and fault vectors of stacking faults. The interest in X-ray topographic investigations of diamonds is due both to the importance of diamond as a material, but also to the possible information about their growth processes, which take place under conditions of extreme temperature and pressure. Thanks to the low absorption of diamond, X-ray topography can be successfully applied for studying whole diamonds [4]; however, more convenient for the investigations seem to be diamond slabs with artificially introduced surfaces, where X-ray topography could be simultaneously used together with other methods, e.g., cathodoluminescence topography [5,6].
The interesting objects for investigations of this kind are large synthetic diamonds (several millimetres in diameter) grown by the reconstitution method. The progress in this technique has made possible the routine growth of such diamonds with relatively low concentrations of dislocations and metallic inclusions. X-ray topographic investigations of large synthetic diamonds have already been reported in a number of publications [7,8,9,10,11]. Some newer possibilities, especially using synchrotron X-radiation, were introduced by using double-crystal X-ray topographic methods [12,13]. Crystal growth techniques are continually advancing; and newer commercial products contain fewer and fewer defects. Other investigations of synthetic diamonds with optical and X-ray methods performed by some of the present authors have been published elsewhere [14,15,16,17,18,19,20,21]. In some natural diamonds, it has been found that nitrogen stiffened the diamond structure against plastic deformation [22].
The places where dislocations and stacking faults meet the crystal surface can be revealed by etching [23,24]: a mildly destructive technique as it removes material. On a (111) face of a diamond, the triangular etch pits are called “trigons”, which come in several varieties: of positive and negative orientations with respect to an octahedral face, point-bottomed and flat-bottomed, steep-sided and shallow-sided [25]. Dislocations in <111> directions can give rise to low-elevation hillocks on HPHT diamonds [26]; and some {111} growth sectors in synthetic diamonds can be substantially free of dislocations. Edge or mixed dislocations have been found in (001) and (111) growth sectors of low dislocation density (<47 cm−2) HPHT diamonds, all with Burgers vectors of (a/2) <110> type [27].
Dislocations and stacking faults can also widen double-crystal rocking-curves [28]. In a quest for supplying perfect diamond crystal for use as monochromators for synchrotron radiation, sub-surface damage has been investigated by limited-projection topographs [29]. Chemical vapor-deposited (CVD) diamond on HPHT or CVD diamond substrates showed dislocations emanating from points at, or near to, the substrate surface [30].
Some of the diamonds studied here had been grown in the [001] direction and others in the [111] direction. Some were complete crystals while others had been sliced and polished parallel to a (100) or (110) plane. Some diamonds contained metal inclusions of micrometre size, identified as body-centred cubic Fe-Co [31], which introduced strain; and in a large diamond (100) slice, 5 mm × 5 mm × 0.7 mm, the metallic inclusions were 600 μm in length, from which numerous dislocations emanated.
The investigative methods to image defects comprised optical microscopy, with or without filters; quantitative birefringence microscopy using a rotating polarizer/analyser in the “Deltascan” or “Metripol” technique [32]; and X-ray topography, using either conventional or synchrotron sources of X-rays [33,34,35].
Section 2 describes the quantitative birefringence technique and its application to the study of strain in synthetic diamonds grown in the [111] direction, together with X-ray topography to locate bundles of radiating dislocations. Section 3 concentrates on synchrotron X-ray topography and its application to the study of defects in diamonds grown in the [001] direction. Section 4 is an extensive study by characteristic X-radiation of the Burgers vectors of dislocations, and the fault vectors of stacking faults, in slabs of diamond cut from a crystal which had grown predominantly in the [001] direction.

2 Diamonds Grown in the [111] Direction—Birefringence Studies

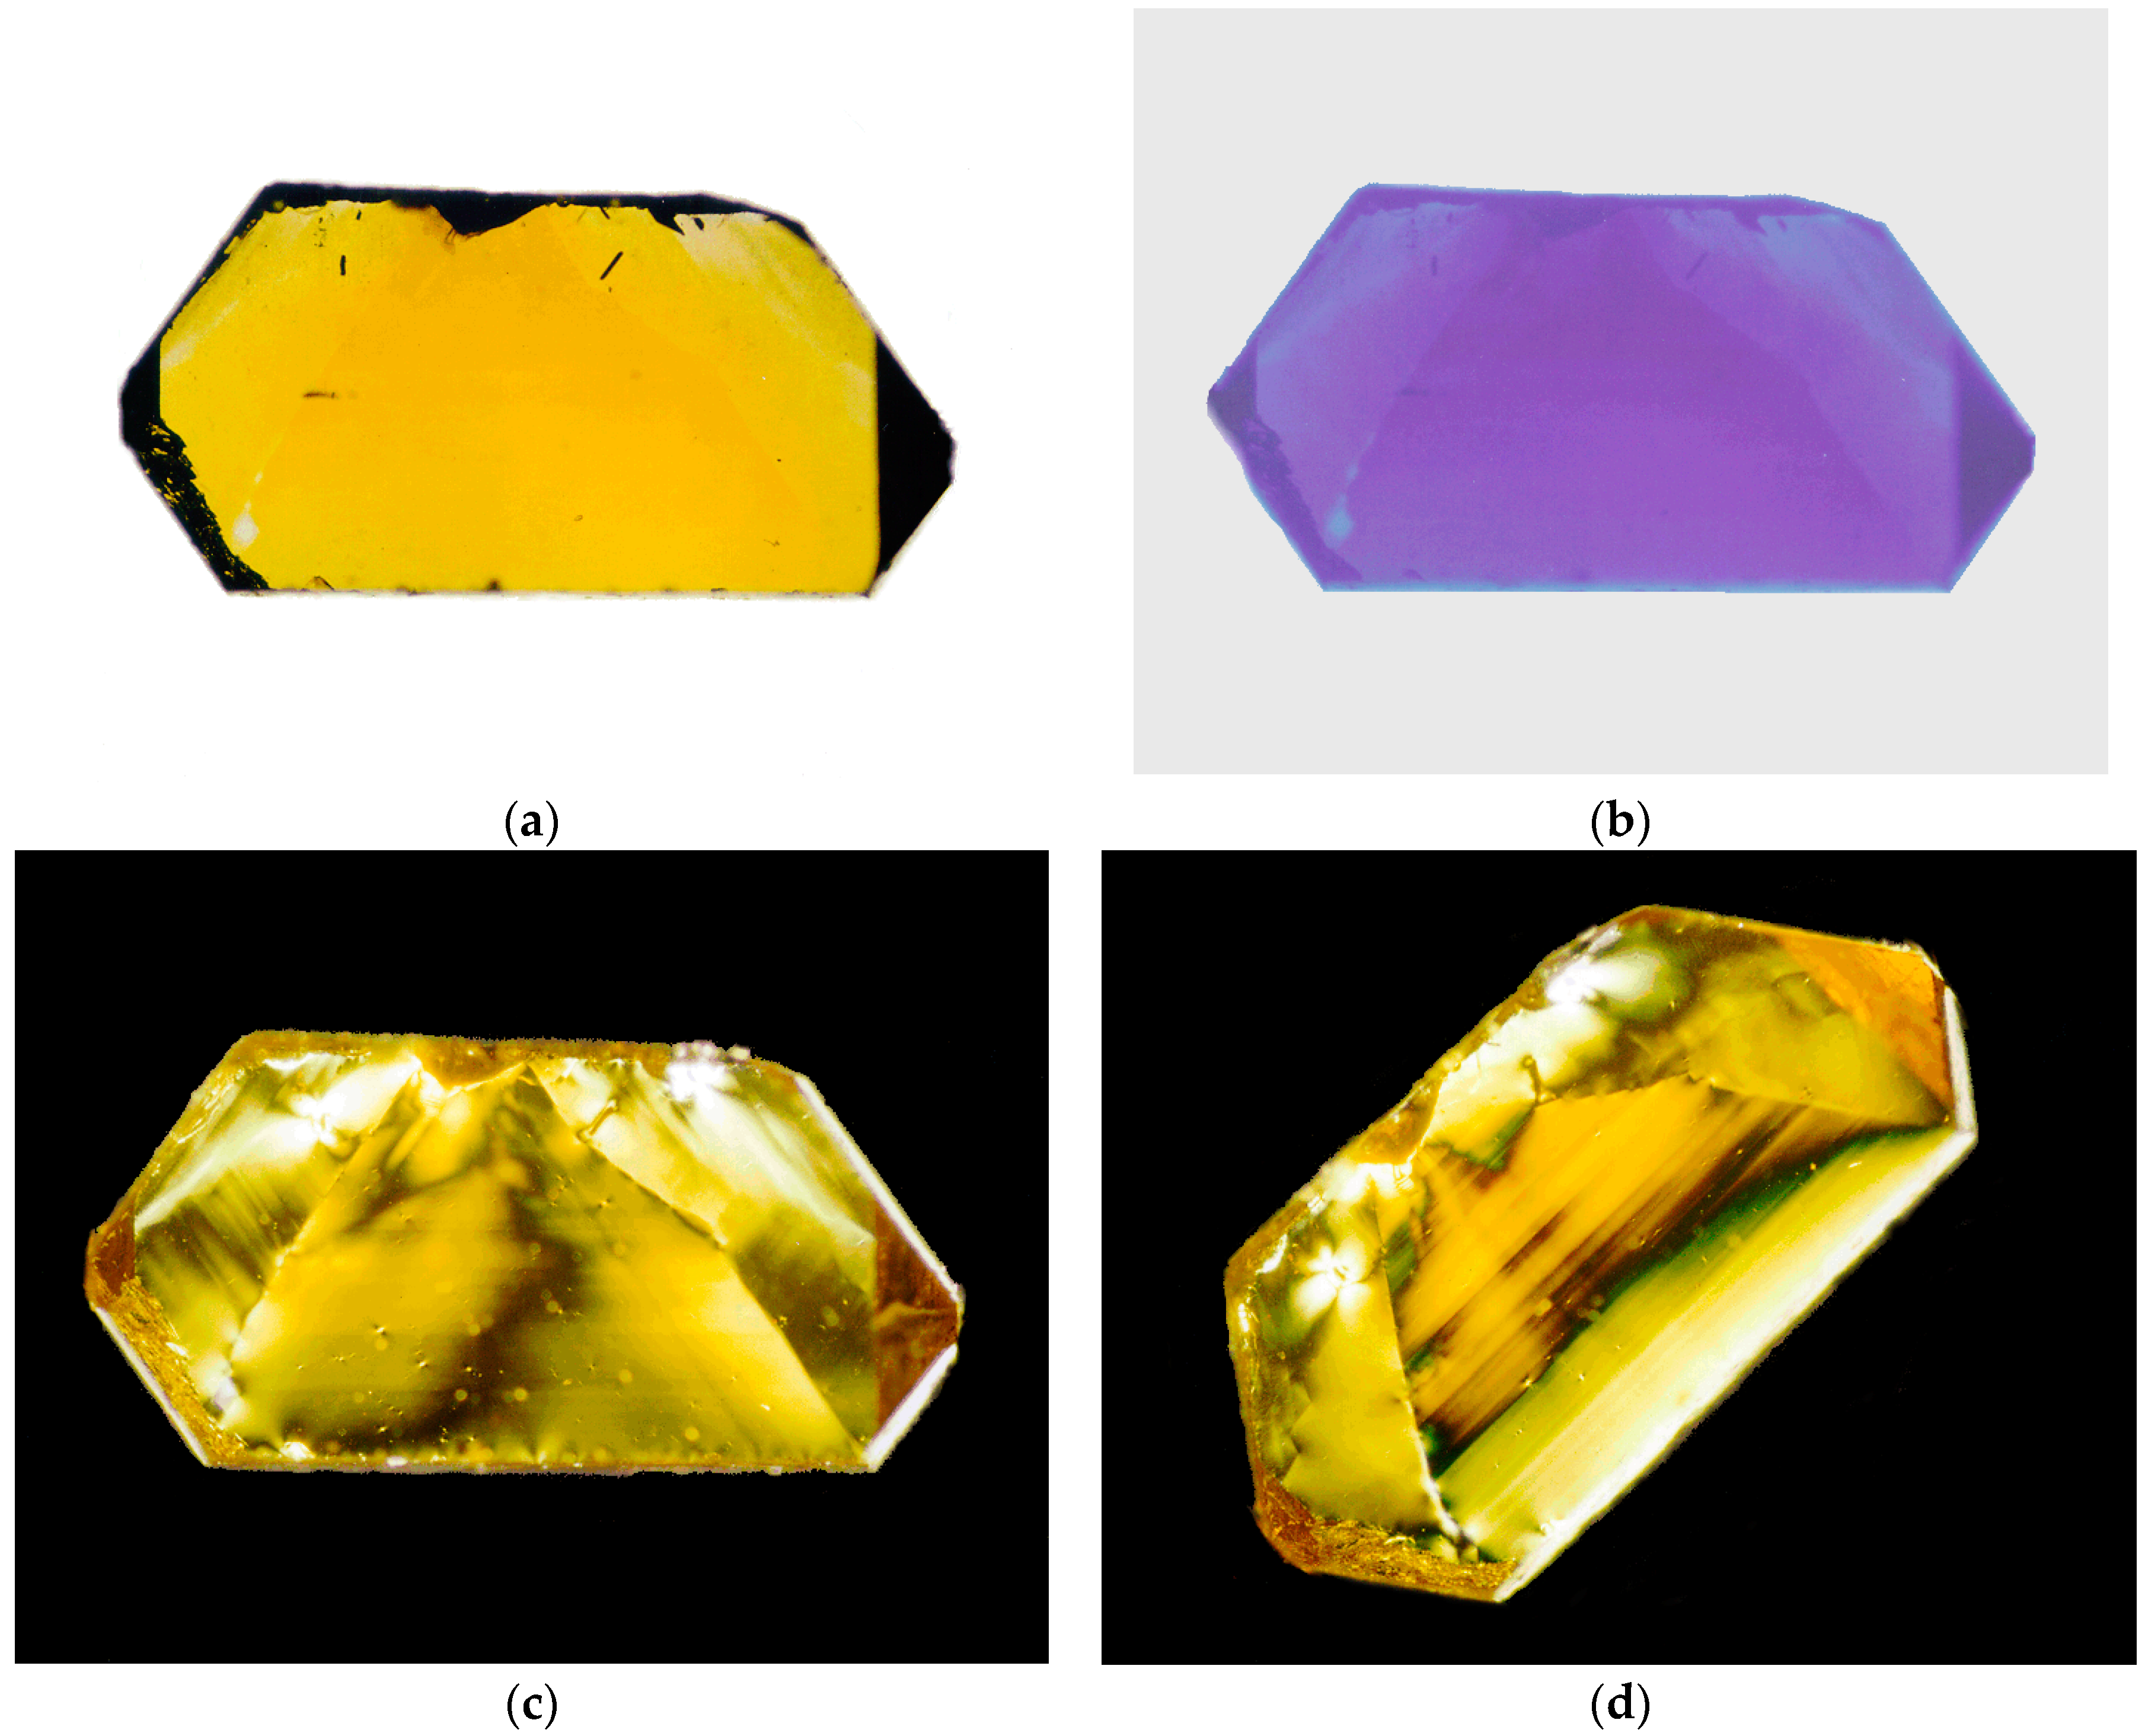
2.1. The Diamond Specimens

For convenience, the four diamonds in this suite are labelled A1, A2, A3, and A4 (renamed from various earlier studies, where they had been named HS, GB, MM2, and S8 respectively [31]). Diamond A1 is 2.0 mm × 2.0 mm × 0.3 mm in size and had been grown in the [111] direction. It is a typical example of diamonds, which after laser drilling a central hole, would be used in industry as wire-drawing dies. Shaped like a triangle with truncated apices, distinguishing features of the diamond include prominent boundaries between the three {100} growth sectors and the abundance of micron-sized particles known in the diamond trade as “clouds”. Previous X-ray and optical studies of this diamond and the following specimen, A2, were reported by Kowalski, Moore and co-workers [31]; and it was suggested that these “clouds” may consist of body-centred cubic iron-cobalt, a favoured solvent/catalyst in the diamond synthesis process.
An optical micrograph of diamond A1 is presented in Figure 1a. The diamond does not contain large metallic inclusions or other features expected to be sources of strain, and with the exception of the “clouds” near the centre, the specimen is generally optically clear.

2.2. Birefringence Measurements of [111]-Grown Diamonds

Figure 1b–d show the central area of the diamond taken by the prototype technique of quantitative polarizing microscopy called “Deltascan”, invented by Professor Michael Glazer and co-workers at the University of Oxford [32]. After development, this technique was renamed and marketed as “Metripol”. The specimen is placed between two polarizers (one circular, one linear), illuminated by a monochromatic light source, and viewed by a CCD camera connected to a video frame-grabber in a PC computer. The circularly-polarized light passes through the specimen which, if optically anisotropic, elliptically polarizes the light. The linear polarizer rotates about the microscope axis at a frequency ω. The resultant intensity I through this circular polarizer–specimen–linear polarizer (CP–S–LP) system is given by:
I = I 0 2 [ 1 + sin 2 ( ω t φ ) sin δ ]
where I0 is the incident intensity, t the time, φ the orientation of the optical indicatrix (an ellipsoid describing the variation in refractive index with light vibration direction), and δ the phase shift due to optical retardation of the light by the specimen.
This phase shift is given by:
δ = 2 π λ Δ n L
where λ is the wavelength of the monochromatic light (in this instance, sodium light of wavelength 589 nm), L is the thickness of the specimen, and Δn is the birefringence of the specimen.
Thus, the intensity I at any point on the CCD camera consists of contributions from the optical retardation, giving the magnitude of the strain birefringence, and the orientation of the optical indicatrix, giving the direction of the strain birefringence. These two components are separated by the system software, and represented as colour-coded maps of the specimen. Such a map is also produced for the absorption in the specimen, I/I0. The palette of colours used in the interpretation of the Metripol maps is shown in Figure 2.
The clever feature of Metripol is to display separately the three contributions to the intensity. The absorption in the specimen I/I0 ranges from 0 to 1 in steps of 0.01, and so the first 100 colours of the palette are used to depict these values. The optical retardation maps display the value of |sin δ|, which again ranges from 0 to 1; and the first 100 colours of the palette are used to represent this quantity, in steps of |sin δ| = 0.01. The orientation of the optical indicatrix varies from 0° to 180°, and the first 180 palette colours are used.
Figure 1b shows the quantitative optical absorption map of diamond A1. For example, the bright yellow colour on the growth-sector boundaries matches the value 40 on the palette, and thus the transmission I/I0 at those points is 0.40. The absorption tends to increase as the centre of the specimen is approached (that is, I/I0 values decrease). This observation is accounted for by the increase in the population of “clouds” near the centre of the diamond.

2.3. Measurements of Birefringence

The optical retardation map of Figure 1c displays the modulus of the phase change due to optical retardation |sin δ|, which is directly proportional to the birefringence Δn in accordance with Equation (2). Thus, the optical retardation maps may be considered as plotting the magnitude of strain in a specimen. The resulting image has a striking three-fold symmetry, and suggests that the strain birefringence is greatest around the growth-sector boundaries. The image colour at these boundaries is a pale orange, which corresponds to a palette value of 75 and thus |sin δ| is 0.75. This corresponds to a birefringence Δn of 15 × 10−3. Further from these regions, the strain reaches a minimum and is depicted by dark blue and purple. These colours represent |sin δ| values of the order of 0.10, and the birefringence Δn in these regions is 1.8 × 10⁻³.
The orientation of the optical indicatrix φ of diamond A1 is shown in Figure 1d. The orientation takes values of 1° to 180°, and so the first 180 colours could be read from the Metripol palette; but here we are using just 18 colours at 10° intervals. The striking pattern of optical orientation indicates that the strain in A1 is radial about the centre of the specimen. While radial strain is often found to be localized to a few hundred microns around a particular feature, for example an inclusion, in this image the pattern is maintained throughout almost the entire crystal.

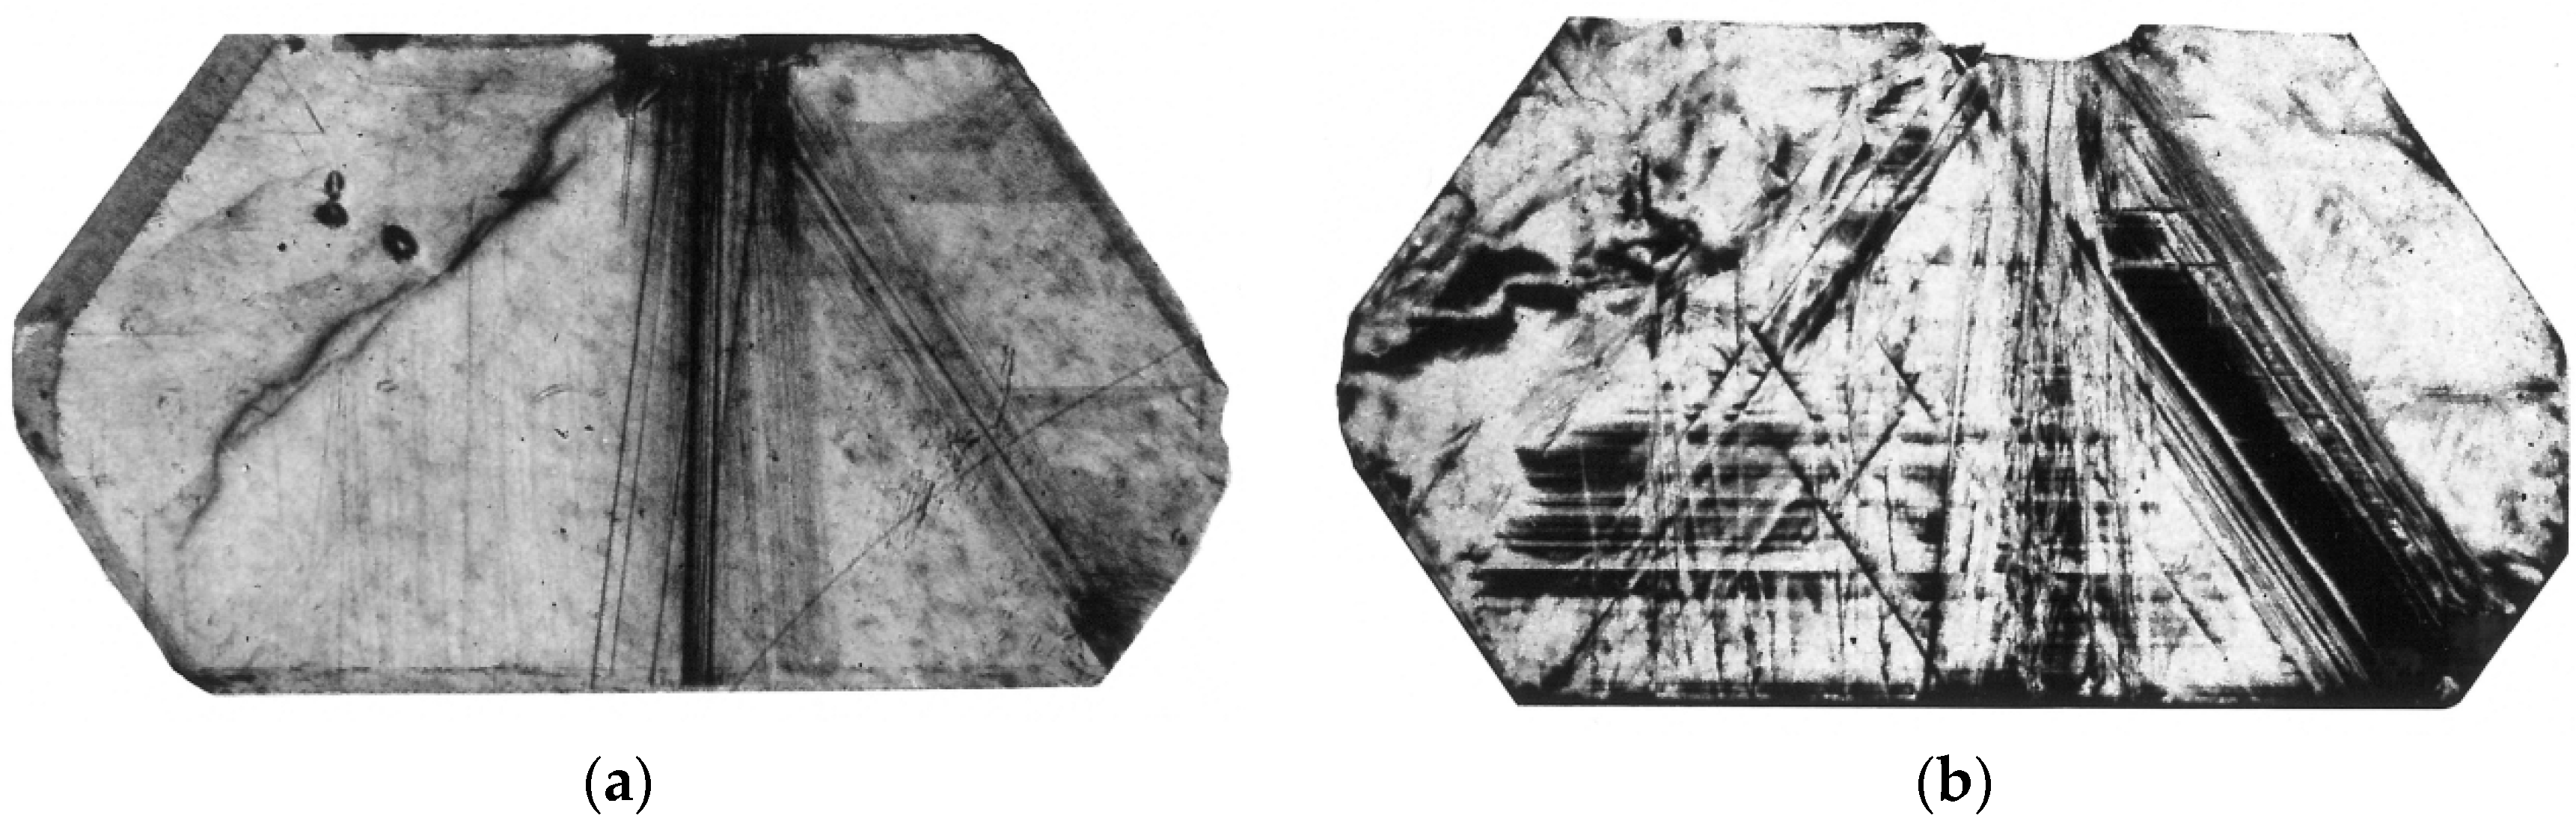
2.4. X-Ray Topography of [111]-Grown Diamonds

Figure 3 shows a section X-ray topograph of this diamond, taken with the 440 reflection of MoKα1 radiation (wavelength λ = 0.71 Å; Bragg angle θ = 34.22°), with the incident X-rays slicing nearly parallel to the major (111) faces of the diamond (off-set = 1.04°). This image reveals bundles of numerous dislocations (forming a “Y” configuration), arranged in directions opposite to those of the growth-sector boundaries and into regions of low birefringence. The greatest contributions to strain birefringence came from the growth-sector boundaries.
Double-crystal topographs and rocking-curve measurements of diamond A1 were made using synchrotron X-radiation at the Daresbury Laboratory, UK. The 800 reflection from a (100) silicon monochromator selected 1.0 Å radiation from the wavelength continuum. The 1.0 Å X-ray beam was then diffracted by diamond A1 using the 333 reflection. Rocking-curve widths were of the order of 20 seconds of arc, which are large compared to the 3″ widths of perfect single-crystal diamonds. Kowalski, Moore and co-workers [31] concluded that the relatively large misorientations in this crystal were associated with the incorporation of “clouds” during growth. The double-crystal topographs confirmed the radial dislocation distributions observed in the characteristic-radiation studies.
The other diamonds in this suite (A2, A3 and A4) showed some differences and some similarities to A1 in the optical and X-ray images; A4 being the most similar. A2 and A4 had fewer “clouds” of point-like inclusions than A1; while A3 was free of “clouds”. The images of these diamonds are given in Figure 4, together with their sizes and estimates of birefringence far from, and near to, the growth-sector boundaries (g.s.b.). Reading down the figure, the second row shows optical micrographs, followed by quantitative maps of absorption, retardation, and orientation. (For A2 and A3, only the central regions are mapped.) The final row shows section X-ray topographs, taken with the 440 reflection of MoKα1 radiation for A2 and A4; and with the 311 reflection of 1 Å synchrotron radiation for A3. The bundles of dislocations emanating from the centres of diamonds A1 and A4 have brought relief of strain to those sectors, and thus the strain birefringence in those regions is relatively low. By contrast, the growth-sector boundaries of A2 and A3 are less strained, and there are fewer strain-relieving dislocations. The lower level of strain in these diamonds is manifest by the strain extending over much smaller volumes, and thus the type of “trefoil” birefringence image seen for A1 and A4 is not observed for A2 and A3.

3. Diamonds Grown in the [001] Direction—Synchrotron X-Radiation Studies

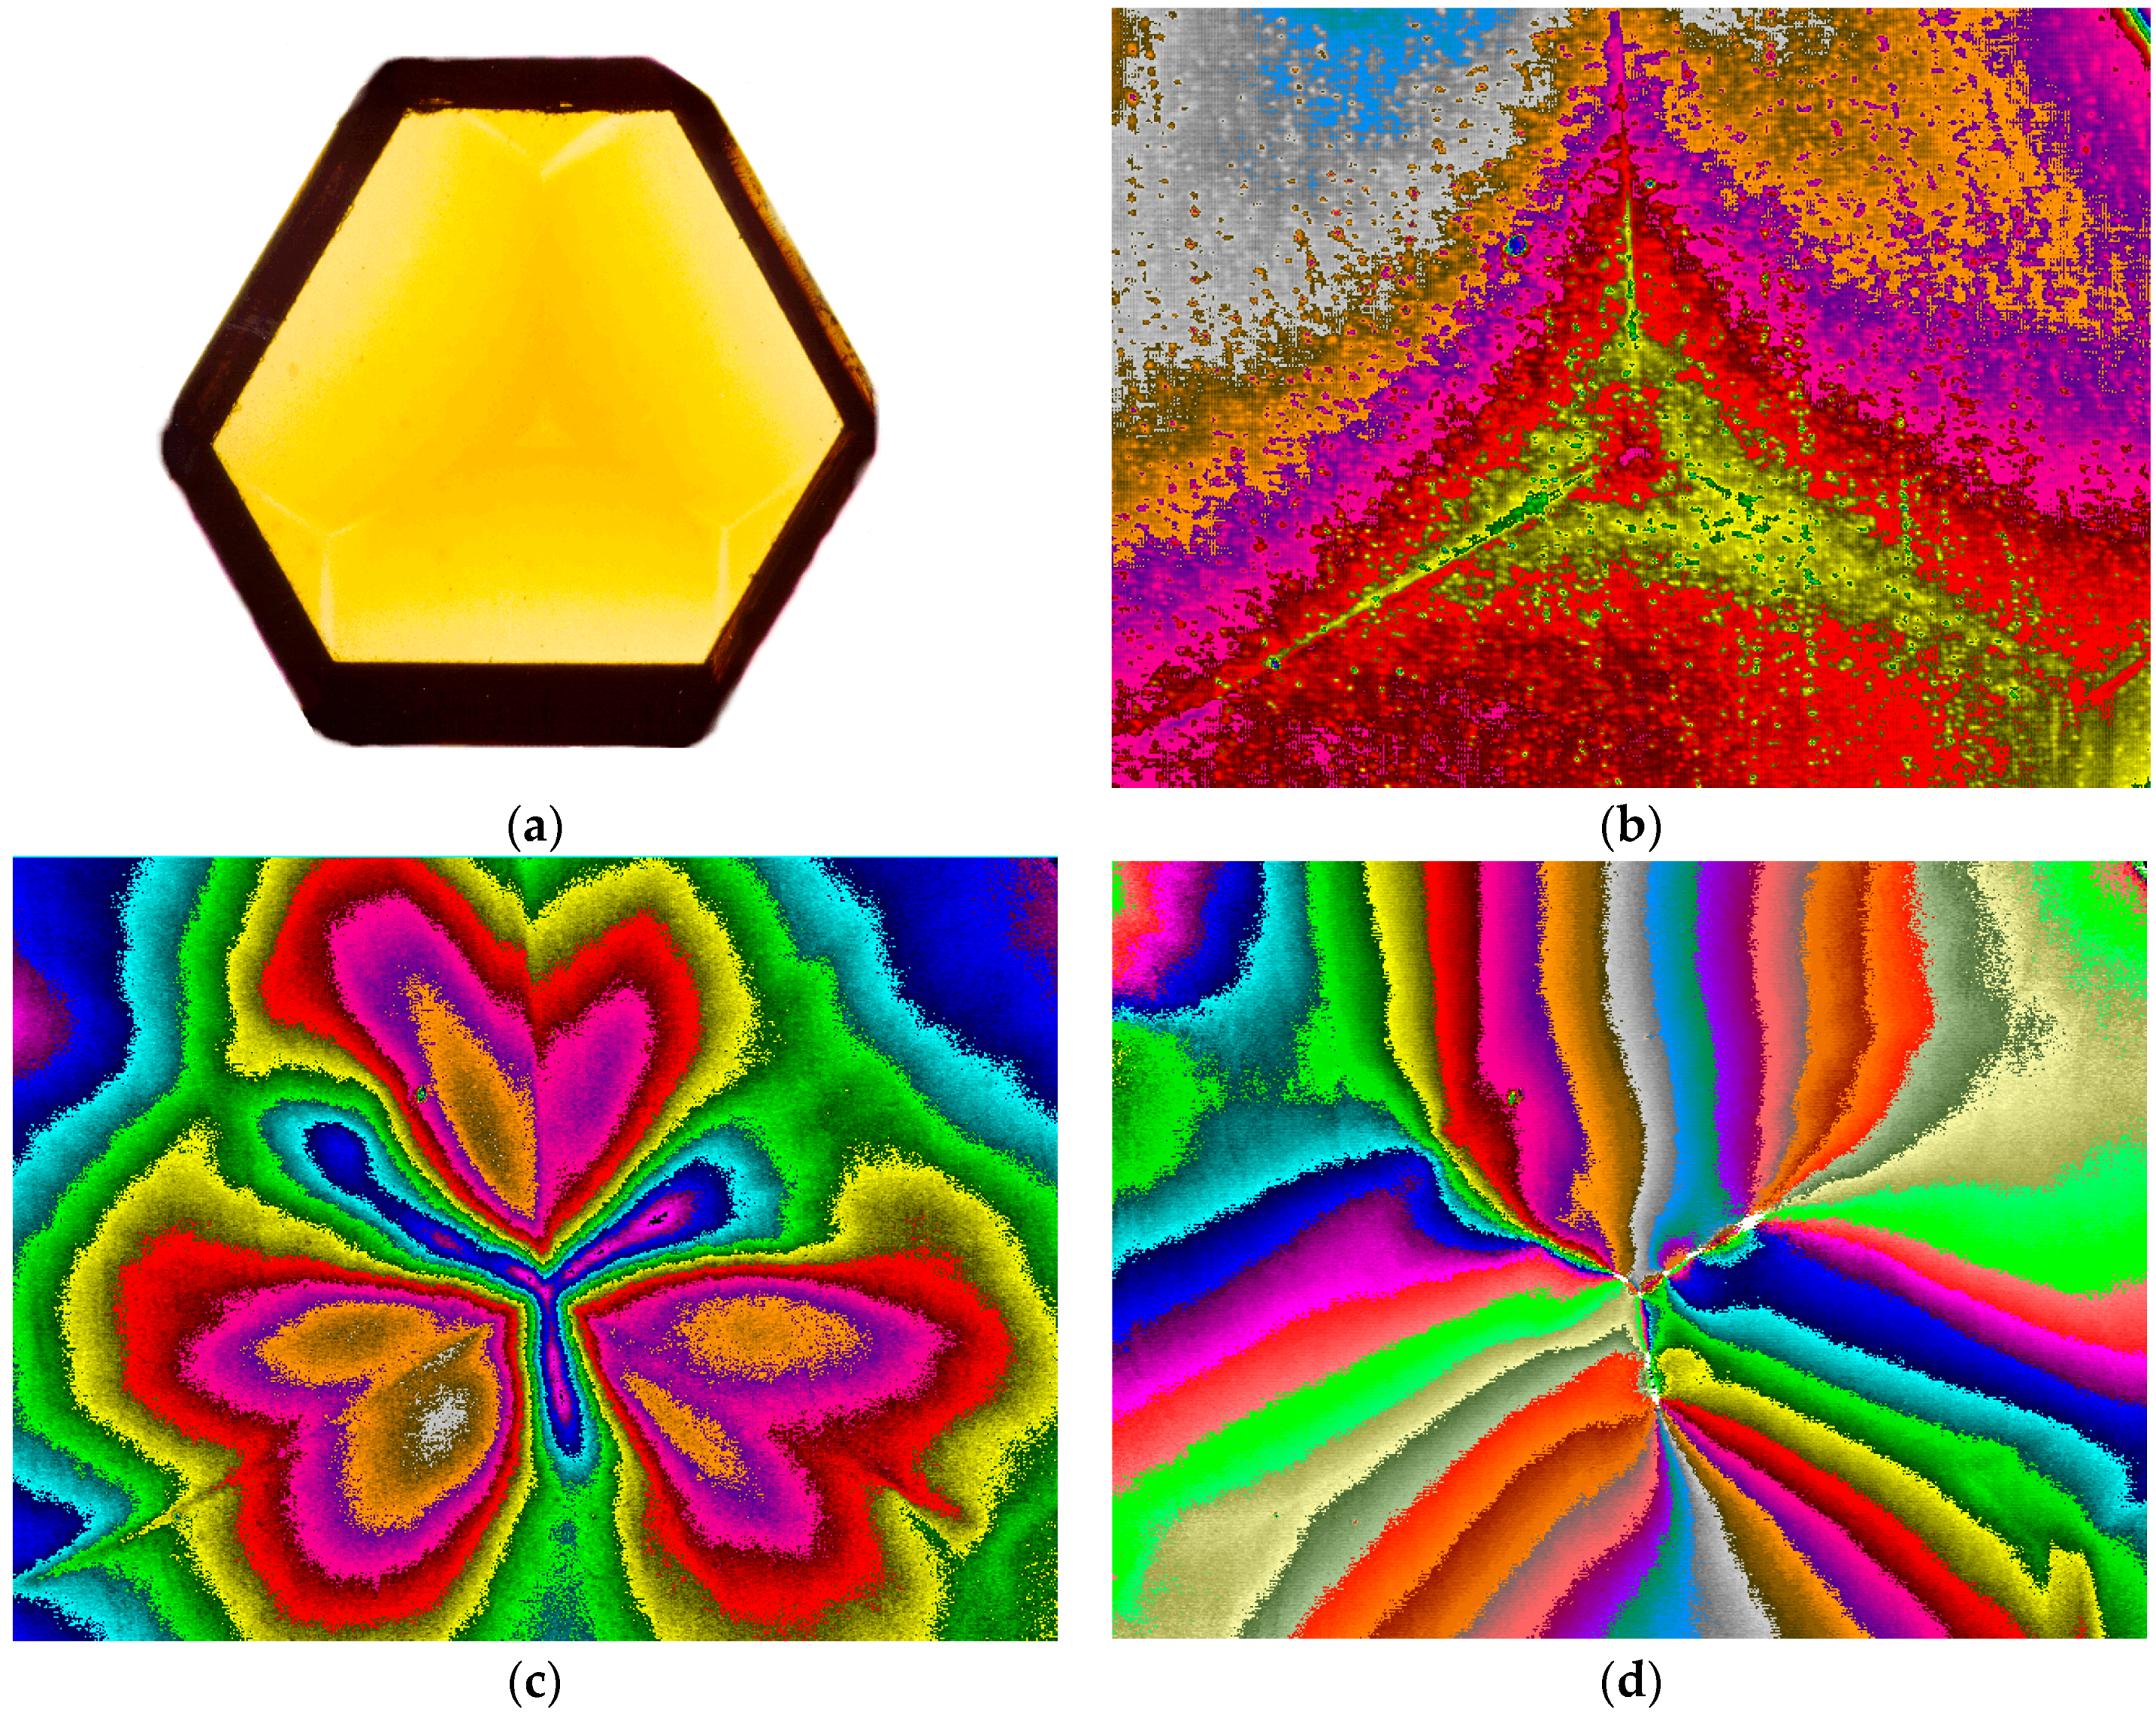
3.1. Optical Studies of [001]-Grown Diamonds

Just two representatives, B1 and B2, of several suites of synthetic diamonds are reported here. Both B1 and B2 are 4.0 × 2.0 × 0.8 mm3 in size. They had both been grown in the [001] direction; and had been cut and polished parallel to a (110) major face, to reveal growth sectors of {001}, {111}, and {113} types. The growth sector information available from such {110} diamond slices has frequently been employed in studies of impurity zoning and optical absorption [36,37]. Differences in lattice parameter between sectors in diamonds have been reported by Lang and co-workers [12].
A plane-polarized optical micrograph of B1 is presented in Figure 5a. The crystal comprises three major growth sectors: from left to right, ( 1 ¯ 11 ), (001) and ( 1 1 ¯ 1 ). The (001) sector appears to have a larger nitrogen content than the other two, and this can be seen in the micrograph in Figure 5b. Taken with plane-polarized light and a Wratten 47B blue filter, the sectors of higher nitrogen content absorb blue light more efficiently, and so appear darker in the micrograph. A small area at the bottom of the left growth-sector boundary appears very pale, and this is the ( 1 ¯ 13 ) sector. In synthetic diamonds, the concentration of single-substitutional nitrogen in {111} sectors is usually twice that of {100} sectors [38]; yet the (001) sector in diamond B1 clearly absorbs more blue light than the surrounding {111} sectors, suggesting a greater nitrogen content.
Diamond B1 also contains a number of inclusions which most likely consist of metals used as solvent/catalysts in the growth process. These inclusions are small, however, and do not have a large effect on overall crystal perfection, as the birefringence micrographs in Figure 5c,d confirm.
For the latter image, the crystal was rotated by 45°. Note how the birefringence pattern changes upon rotation of the specimen. This effect makes analysing the strain in a crystal more difficult, and emphasizes the benefits of the Metripol quantitative birefringence microscope which eliminates such orientation dependence. The greater strain is found along the top edge of the crystal, which is the area originally in contact with the seed crystal, and also the growth-sector boundaries. Some growth banding is visible in each sector, the 0° image highlighting the <111> banding, and the 45° image accentuating the [001] banding.

3.2. X-Ray Studies of [001]-Grown Diamonds

Diamond B1 was also studied with single-crystal X-ray topography using the Synchrotron Radiation Source at the Daresbury Laboratory, UK. The specimen was aligned with the large (110) surface horizontal, and a 50 μm ribbon of polychromatic (“white”) radiation was used to section the crystal in a number of places. Various topographic images were formed as the crystal planes selected appropriate wavelengths for Bragg reflection. Growth-sector boundaries were seen to appear with varying strength according to the reflection, but of particular interest was the observation that the [001] growth banding, caused by impurity variations from fluctuating growth conditions [38], was visible in certain X-ray topographic reflections and invisible in others. A detailed study was then undertaken, obtaining numerous topographic images of the specimen using a variety of wavelengths and reflections in order to establish a pattern (if any) of growth-banding visibility.
Just two such X-ray topographs are shown here. Figure 6a is the image of the 335 reflection with 0.82 Å X-rays. Growth banding in the (001) sector appears in the form of a number of thin, clear lines on a darkened region. The sector is traversed in places by bundles of dislocations. The {111} sectors do not display any banding, and this was the case in all topographic images. The right-hand growth-sector boundary is visible along its entire length.
Figure 6b is the image of the 224 reflection with 1.18 Å X-rays. Banding in the (001) sector differs from the previous image in that the individual bands are stronger (although distorted), and the dark background is less prominent. The right-hand growth-sector boundary is also still present, but becomes fainter and less sharp nearer the bottom of the crystal. However, the dislocations which were only slightly discernible in the previous image are now individually visible. The two bands, of [001] and [ 1 1 ¯ 2 ] orientation, form an inverted “V” shape; and emanate from the seed crystal area at the top of the diamond.
The [001] growth banding in B1 was studied in many other topographic images, and in each case was assigned a rank according to visibility. The results were then tabulated in order to find a possible correlation between banding visibility and diffraction conditions. By positioning a photographic plate directly under the specimen and parallel to its major faces, the multi-wavelength synchrotron beam was diffracted by many crystallographic planes, producing approximately fifteen clear topographic images on each plate. The images on the central line of each plate were identified for this study: these images corresponded to the 115, 337, 224, 335, and 333 (or 111, depending on wavelength) reflections. Although the 113 reflection was present, the wavelengths required for diffraction were long, and the topographs were very pale as a result of air absorption. Off-centre images were also examined, and growth banding visibility was seen to be similar to that of adjacent images on the central line. The visibility of growth banding in each topograph is presented in Table 1.
Diamond B2 is so similar in outward appearance to B1, and in its birefringence, that separate pictures are not shown here. Its internal structure, as seen in X-ray topographs, is however quite different: the growth banding is less obvious and bundles of dislocations appear in strong contrast in the [001] and [ 1 1 ¯ 2 ] directions.
Figure 7a shows these dislocations particularly well resolved in a projection topograph, as well as some strain around three metal inclusions (top left). In Figure 7b, which is a section topograph taken with a slit width of 50 μm, the dislocations are less well resolved (especially those in the [001] direction) but the growth banding in the (001) sector is more apparent. The dislocations were never completely invisible in any of the many X-ray topographs taken with various diffraction vectors (g), so their Burgers vectors (b) were not unambiguously determined from the g.b = 0 criterion. (See Section 3.4 below.) The results nevertheless were consistent with the dislocations being of mixed type (edge and screw) and with b being parallel to a <011> direction.

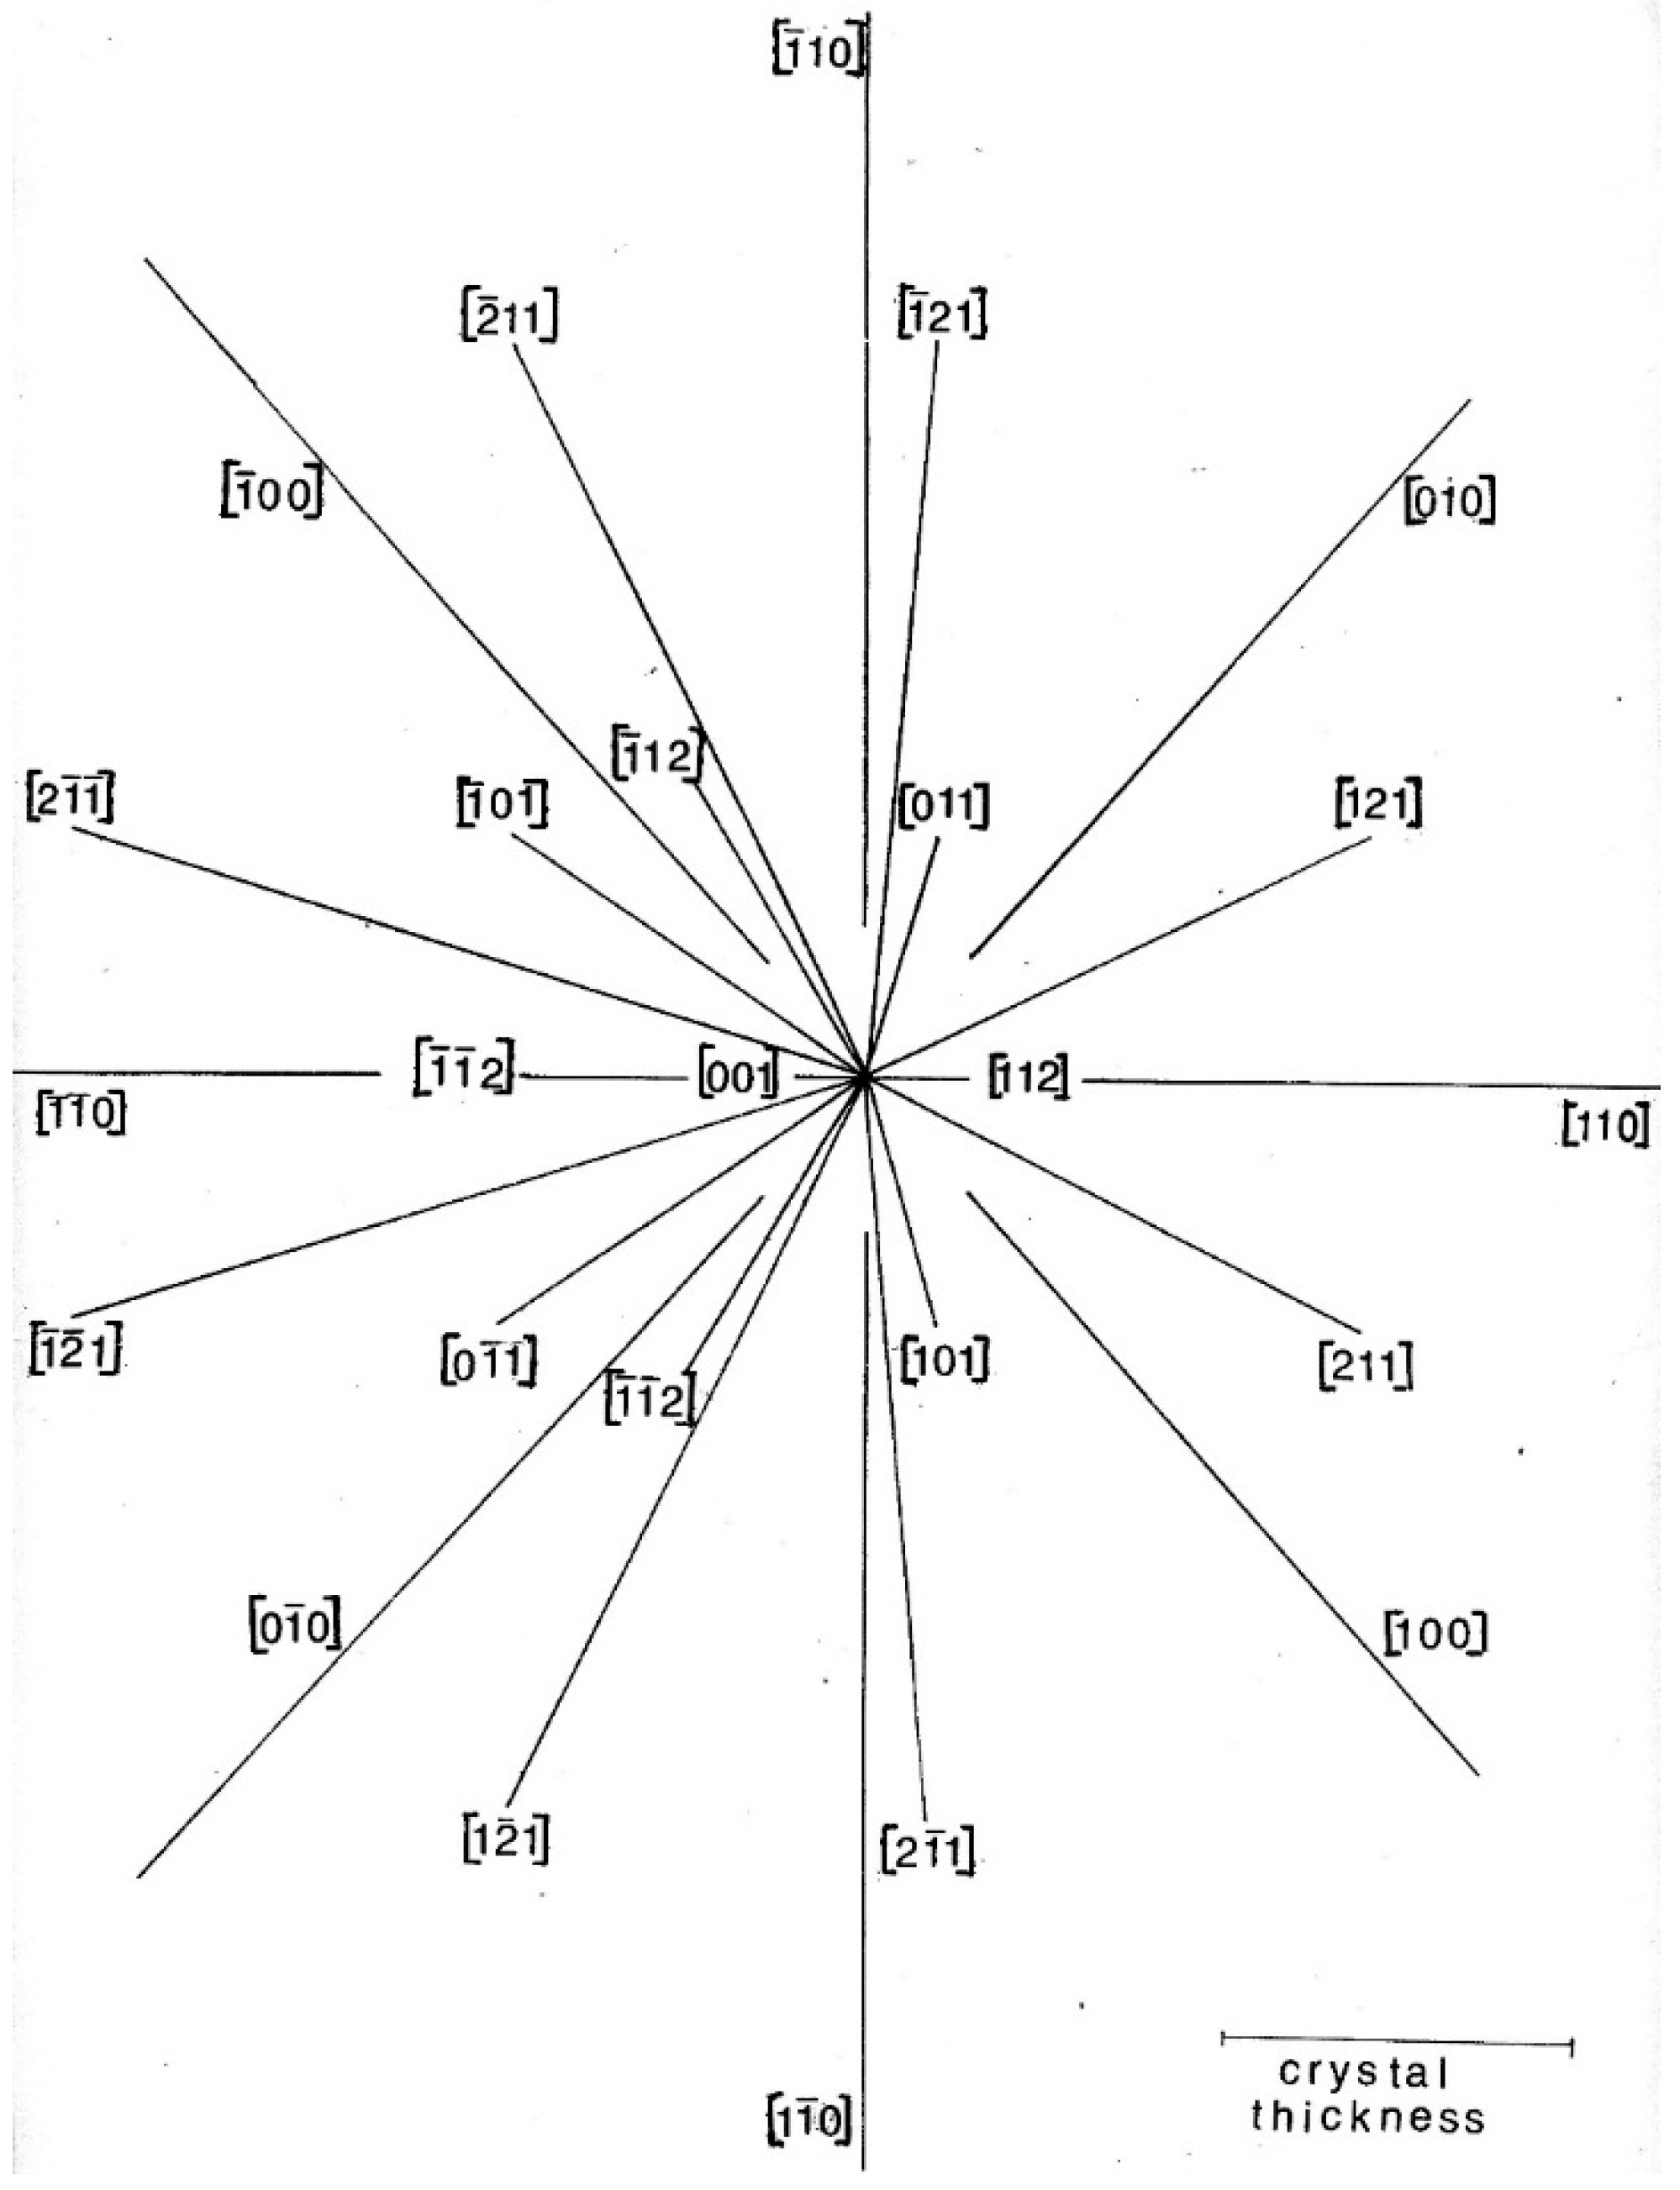
3.3. The g.b = 0 Criterion for Invisibility of a Dislocation of Burgers Vector b

Where a crystal is deformed by a displacement of vector u from its perfect structure, the electron density is modified as follows:
ρ(r’) = ρ(r + u) = (1/V) Σ Fg exp[-2πi g.(r + u)]
where r is the lattice vector, V is the volume of the unit cell, and Fg is the structure factor for the diffraction vector (reflection) g. The extra phase factor exp[-2πi g.u] shows itself in the structure factor as exp[2πi g.u]. For g.u = 0, there is no change in structure factor; and therefore in diffraction the deformed crystal will appear perfect. This can be simply appreciated geometrically, by noting that for g perpendicular to u, the atomic displacements are parallel to the Bragg planes and therefore they have no influence on the Bragg reflection.
The strain field surrounding a mixed dislocation in general has three components, which may be written as
u = Ab + B(b × l) + C(l × b × l)
where b is the Burgers vector of the dislocation and l is the unit vector in the direction of the dislocation line. The second term gives the component perpendicular to both b and l; and the third term is perpendicular to both the second term and to l. Cylindrical polar coordinates (r, θ, z) are chosen, with z measured along the direction l of the dislocation line, and θ measured from the plane containing b and l. A = θ/2π; but B and C are more complicated expressions, involving the Poisson’s ratio of the material.
For a screw dislocation, b is parallel to l, so b × l = 0 and u = (θ/2π)b. Thus the g.u = 0 criterion for invisibility in diffraction becomes just g.b = 0.
For an edge dislocation, b is perpendicular to l. Thus b.l = 0; and l × b × l = (l.l)b − (l.b)l = b. Therefore u = (A + C)b + B(b × l). An edge dislocation will be invisible if both g.b = 0 and g.(b × l) = 0.
A mixed dislocation is never completely invisible in diffraction, since g cannot simultaneously satisfy the three equations g.b = 0; g.(b × l) = 0; and g.(l × b × l) = 0. The values of the parameters B and C are however usually smaller than A, so low visibility is found where g.b = 0 for all types of dislocation.
The determination of the direction of the Burgers vector b needs the invisibility of two reflections: g1.b = 0 and g2.b = 0. Each equation defines a plane in which b must lie; and the intersection of these two planes gives the direction (but not the magnitude) of the Burgers vector b. The solution of the two simultaneous equations
g1x bx + g1y by + g1z bz = 0
g2x bx + g2y by + g2z bz = 0
gives the desired ratio of the Cartesian components (bx, by, bz) of b.

4. Diamond Slabs Cut from a Truncated Octahedral Diamond—Characteristic X-Ray Topographic Studies

4.1. Specimen Preparation

We also studied dislocations and growth sectors in slabs (C1 and C2) cut from a synthetic diamond of truncated octahedral habit, with diameters of 5 mm × 5 mm at its base, showing also small {011} faces. We published X-ray topographs of these specimens in Figure 2b,c and Figure 8 of reference [13]. In this paper, we also published evaluations of lattice parameter differences within different growth sectors in diamond C, obtained from double-crystal experiments with conventional X-ray sources. These differences Δa/a were 1.0 × 10⁻⁶ between {111} and {001}; and 1.0 × 10⁻⁵ between {001} and low nitrogen {011} sectors (and similarly between {001} and {113} sectors). In the present paper we include more complete X-ray topographic results concerning identified dislocations and stacking faults.
The diamond was of truncated octahedral habit, but obviously it could grow into one hemisphere only, from the seed situated close to the end of the reaction capsule. The dimensions of the crystal close to its base were 5 × 5 mm2, while its height was nearly 3.5 mm. The diamond contained large octahedral faces and some smaller cube faces truncating its vertices: the largest (001) face was at the top vertex. The diamond contained also some narrow {011} and {113} facets, but only one of the {011} faces was of significant dimensions. The diamond contained also some metallic inclusions.
We decided to cut the crystal, using a laser saw, into two slabs (C1 and C2) perpendicular to the main [001] growth direction. The slabs were mechanically polished, removing also the areas close to the top vertex and the bottom-most imperfect layer. The thicknesses of the two slabs were approximately 0.7 mm, while the gap between them due to laser sawing and polishing was also evaluated to be 0.7–0.8 mm. Here we include the results obtained in the slab (C1) closer to the seed. As already mentioned, other results obtained in the present diamond have been described elsewhere [13,14].

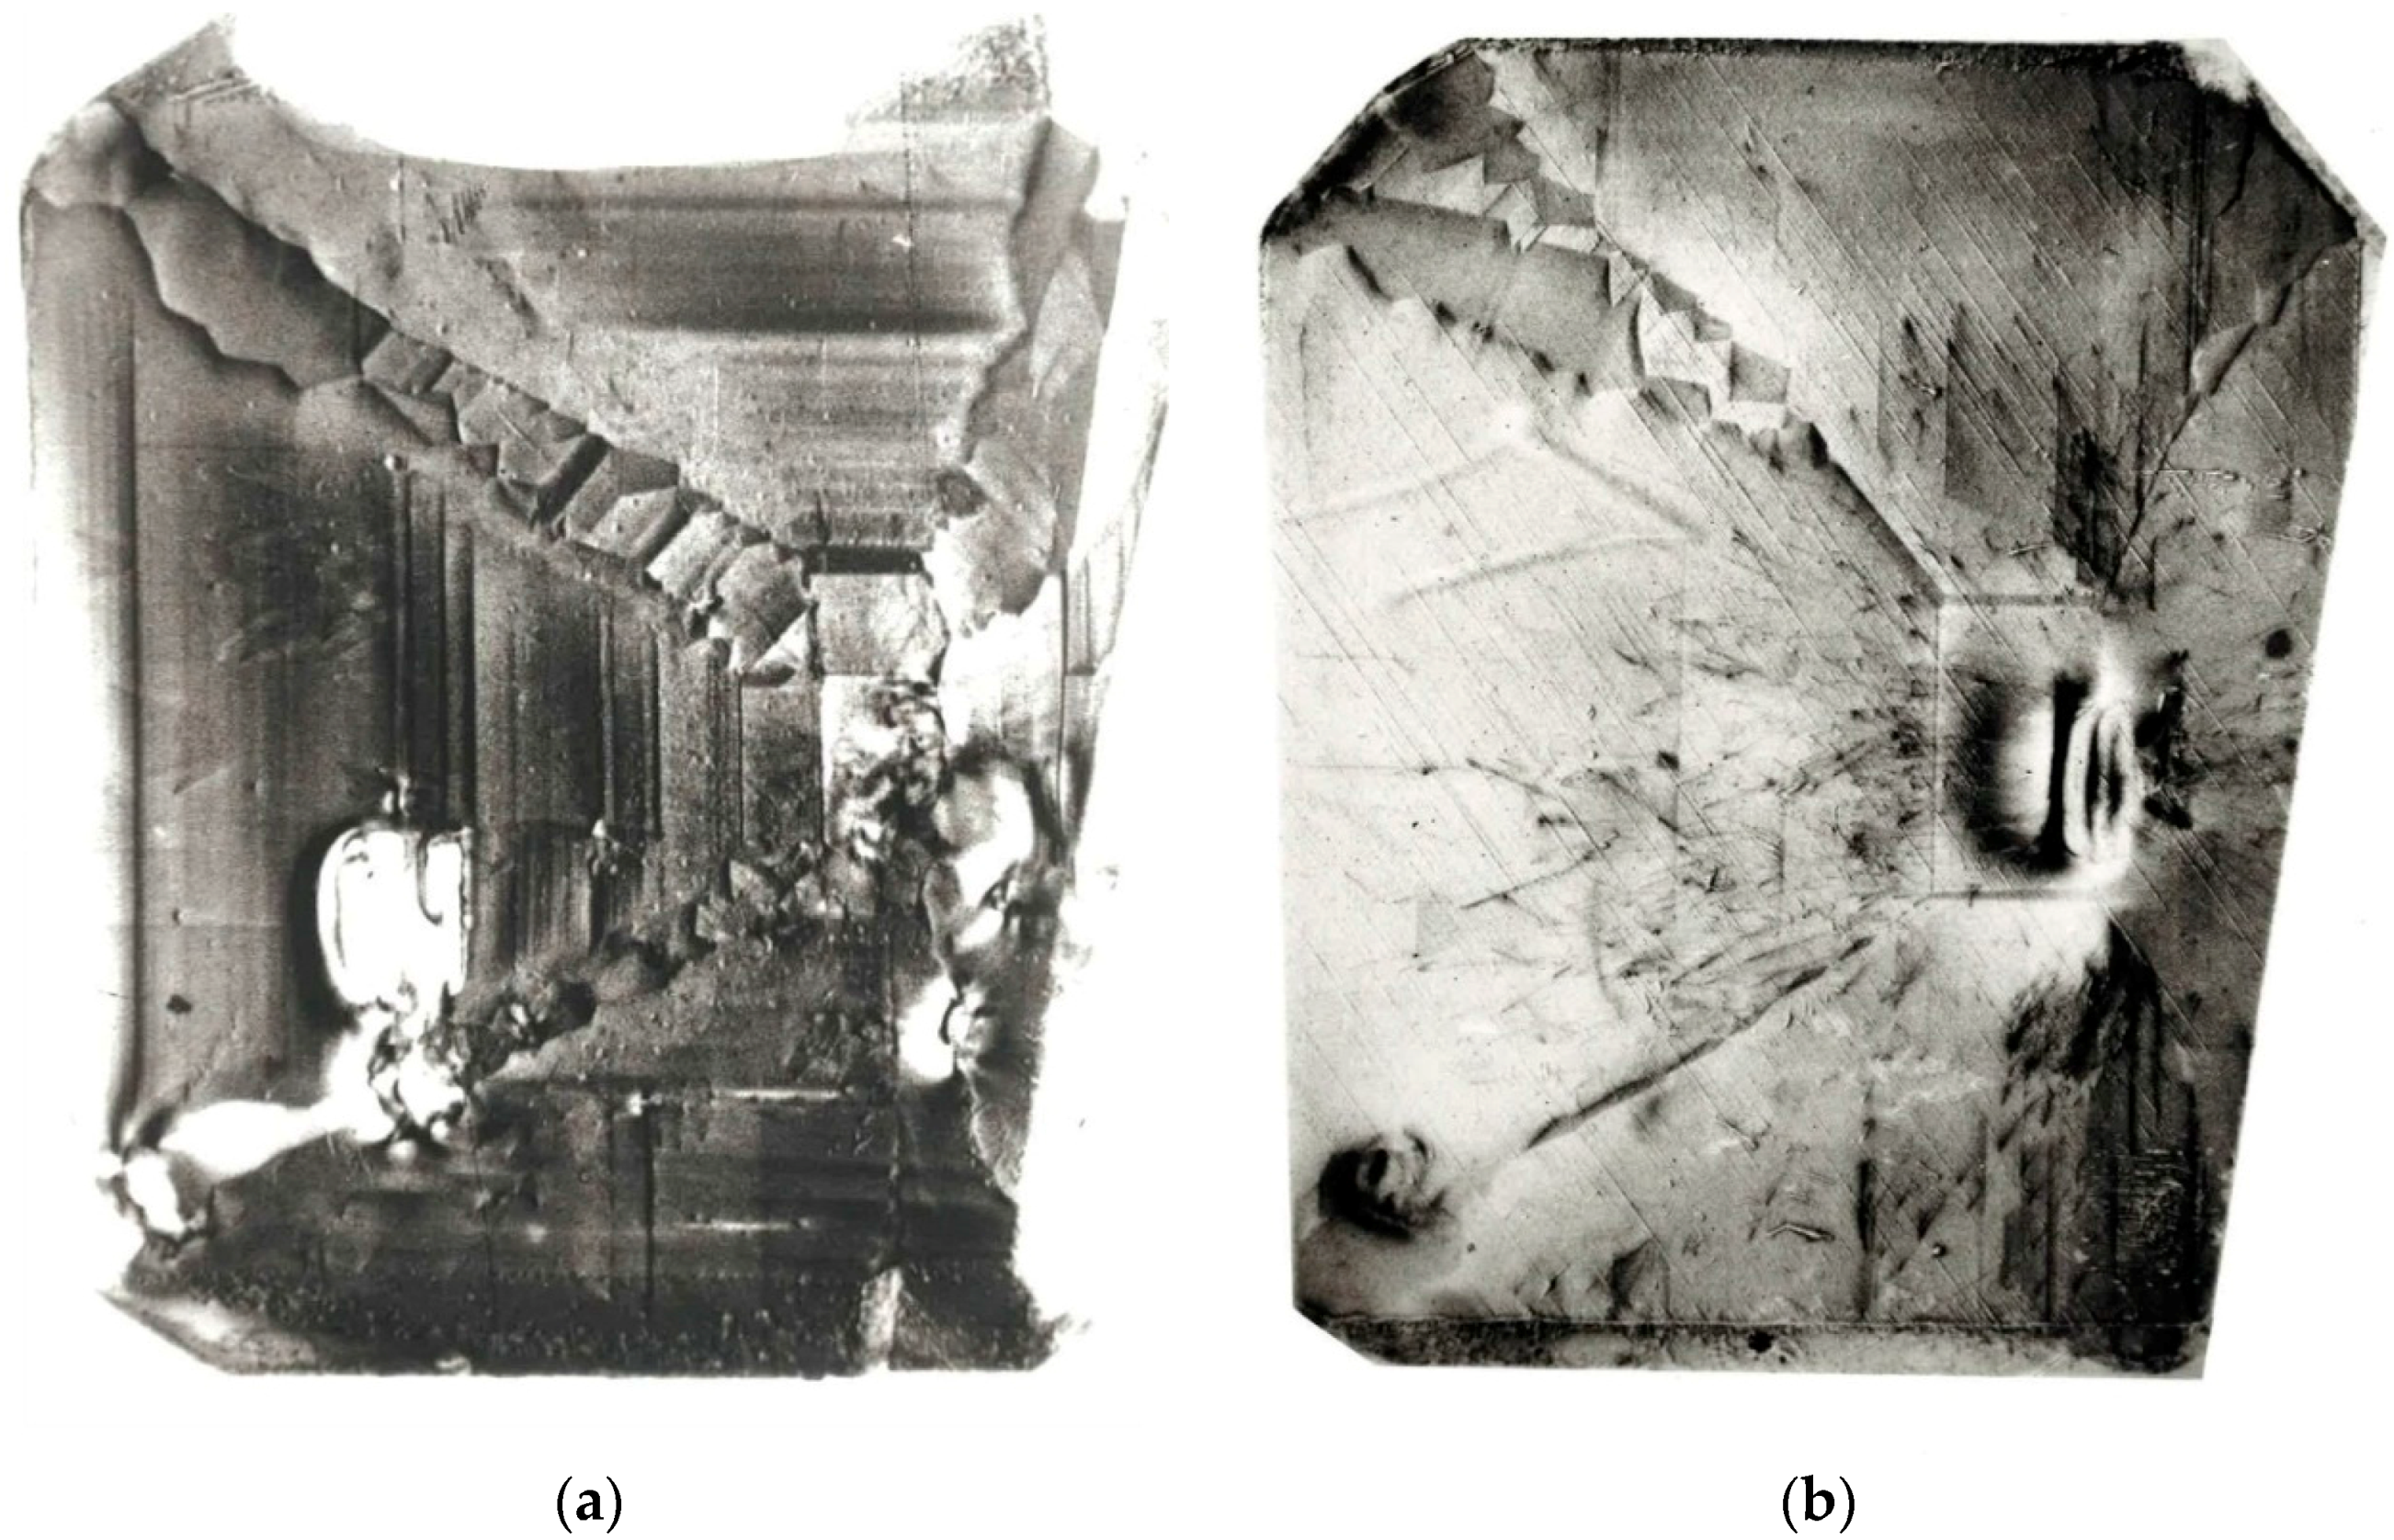
4.2. Single-Crystal and Double-Crystal X-Ray Topographic Investigations of Diamond C

An important part of the investigation was a study of dislocation structure by means of the Lang transmission method. The topographs were taken using MoKα1 radiation in 111- and 220-type reflections from equivalent crystallographic planes. The artificially introduced surfaces of the two slabs were examined with Lang back-reflection topography using 311-type reflections of CuKα1 radiation. These topographs were very useful in revealing the stacking faults close to the examined surface as well as the differences in integrated intensity from the various parts of the sample.
The two slabs were also studied using the back-reflection double-crystal method; in double-crystal 422Si − 311 and 1 3 ¯ 25 Quartz − 004 arrangements with CuKα1 radiation. The latter arrangement offered almost perfect matching of lattice spacing and negligible broadening: under 0.15 arc seconds of the rocking curve due to spectral dispersion. Some former double-crystal topographic investigations have already been described in our previous paper [13]. Several section topographs were taken in 400 and 440 symmetrical reflections using MoKα1 radiation. All topographs were recorded on 50 μm Ilford L4 nuclear emulsion plates.
The appearance of growth sectors in all four surfaces providing the successive sections of the investigated diamond have already been discussed [13]. We should note the increase of intensity in the central (001) growth sector with distance from the seed. This sector is separated from large octahedral sectors by narrow strips of {113} sectors. In the slab (C2) farther from the seed, the octahedral sectors are separated by narrow {011} sectors; only one of them is large and connected with a significant face. In the slab (C1) closer to the seed, some octahedral sectors are separated by cube sectors corresponding to side vertices and surrounded by {113} sectors. The cathodoluminescence and double-crystal topographs of the lowest artificial surface, closer to the seed, revealed narrow stripes corresponding to the {100} growth sectors from the lower hemisphere.

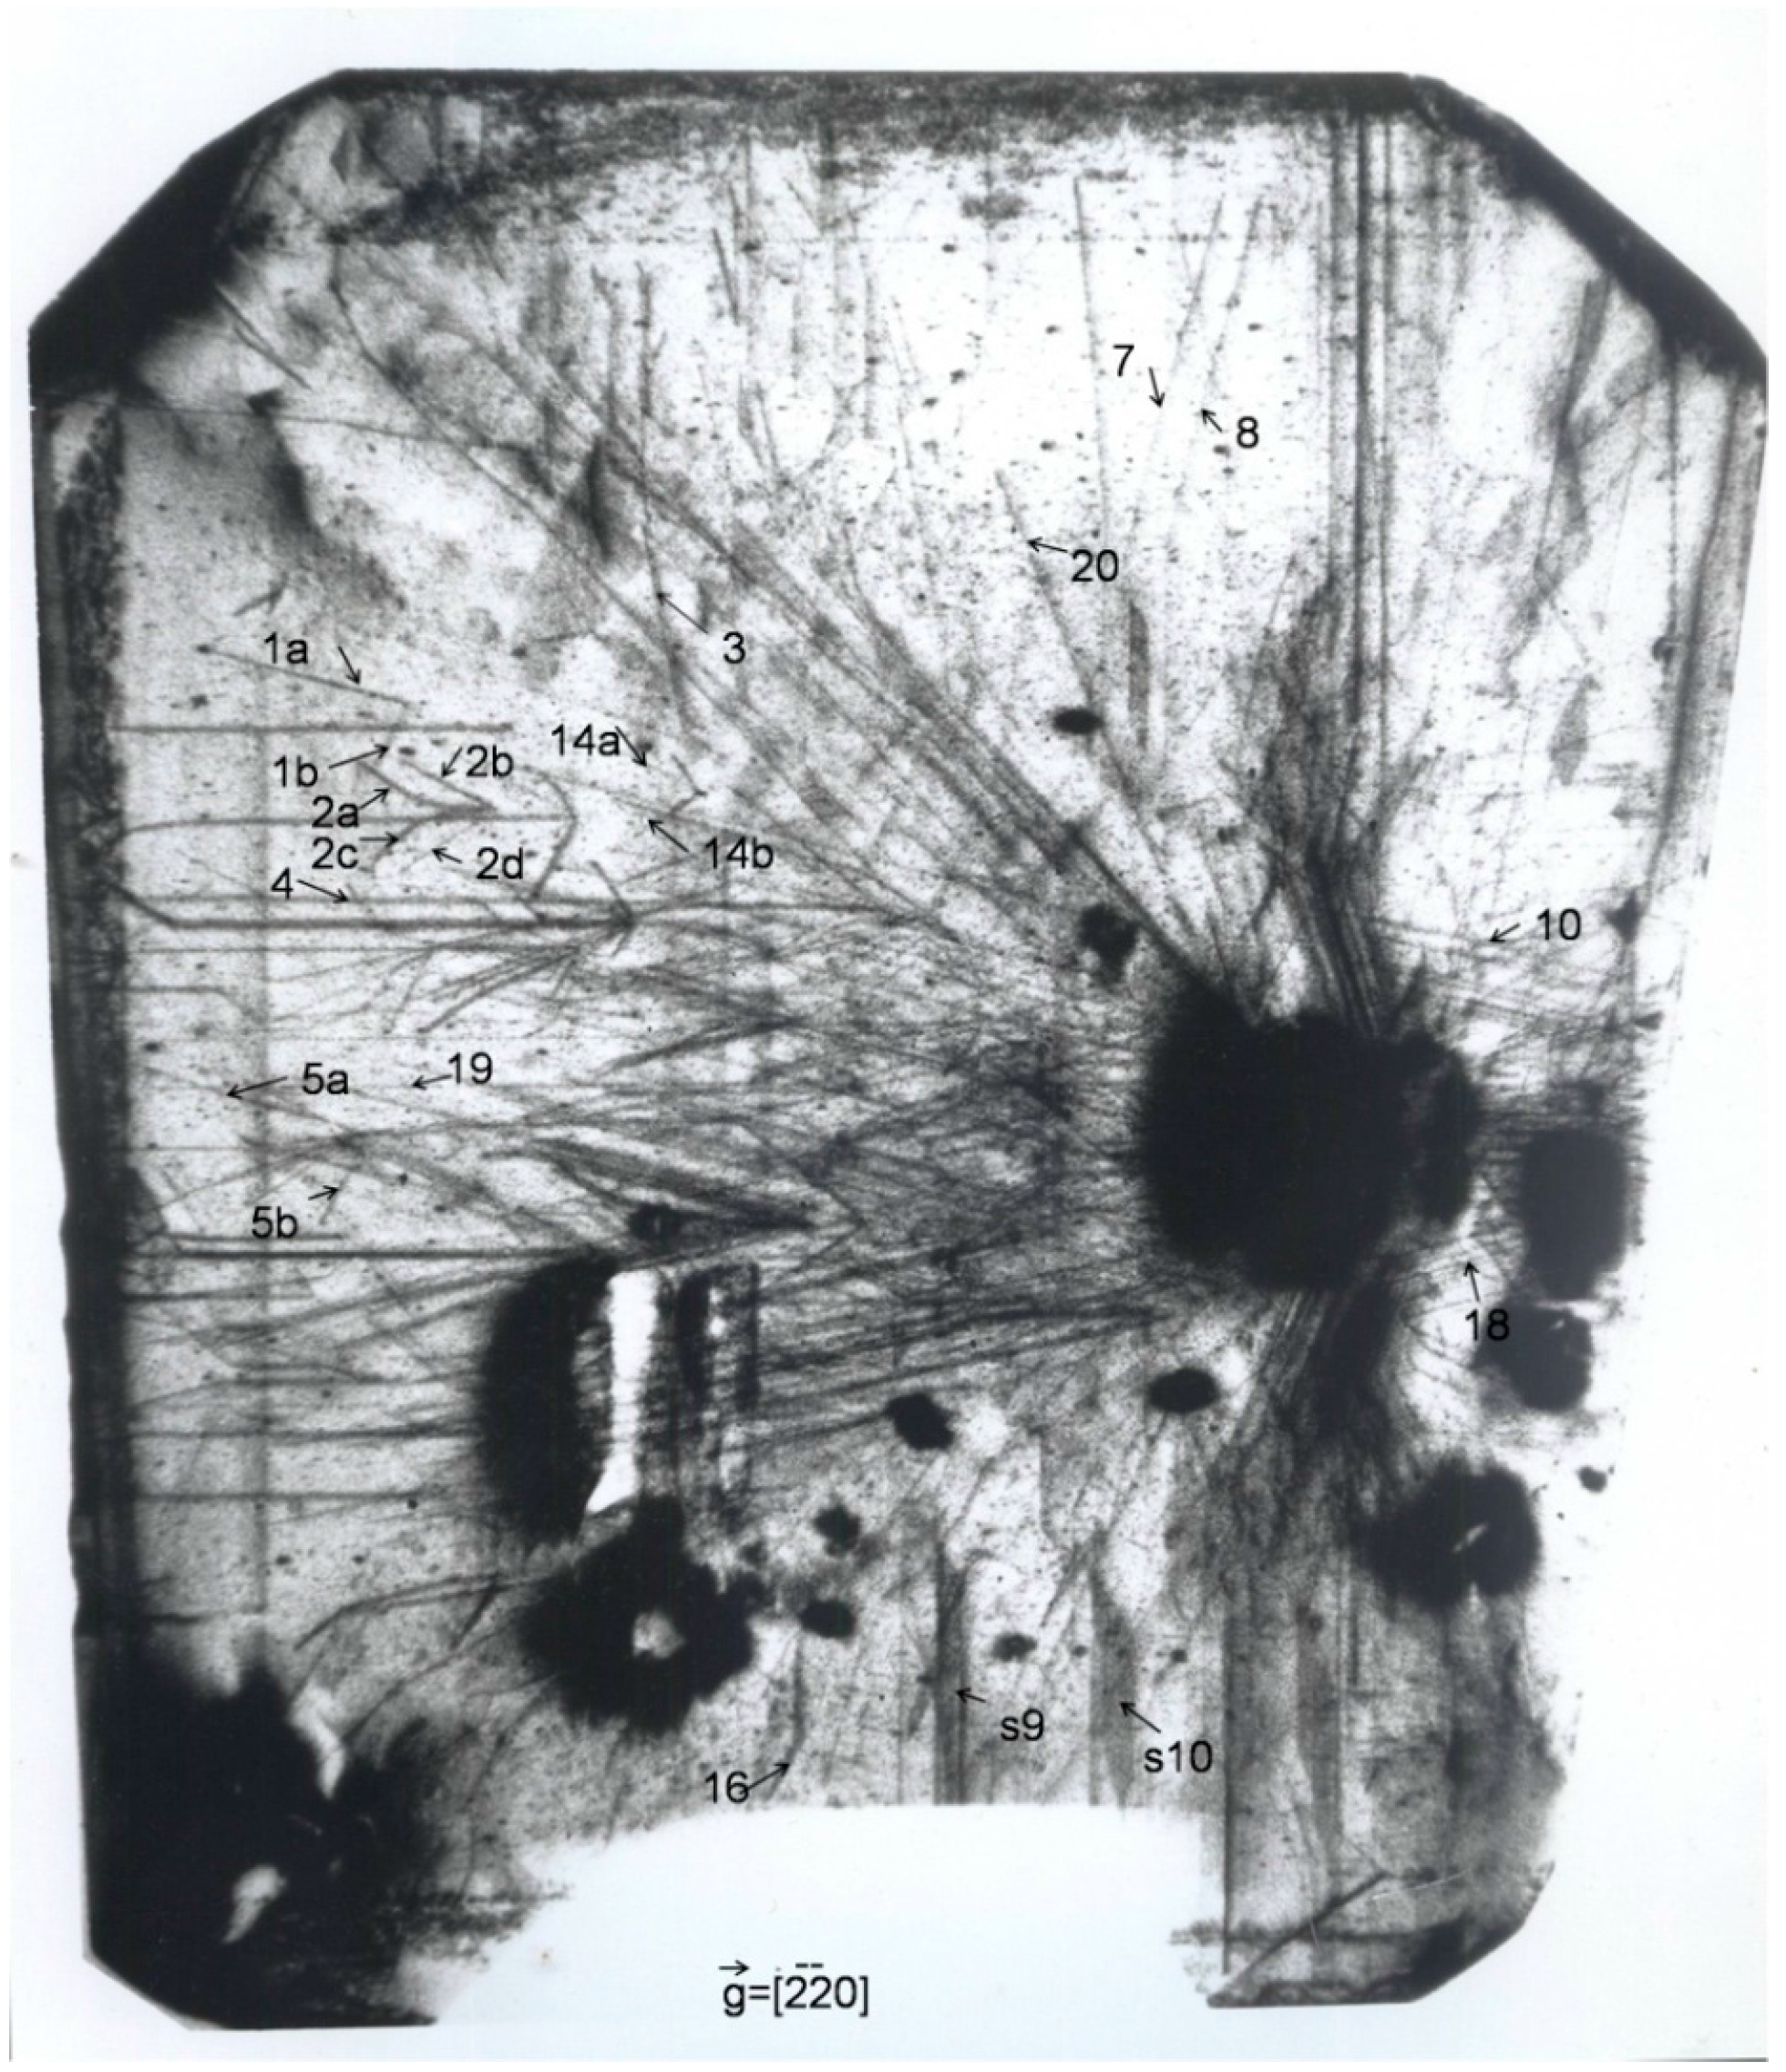
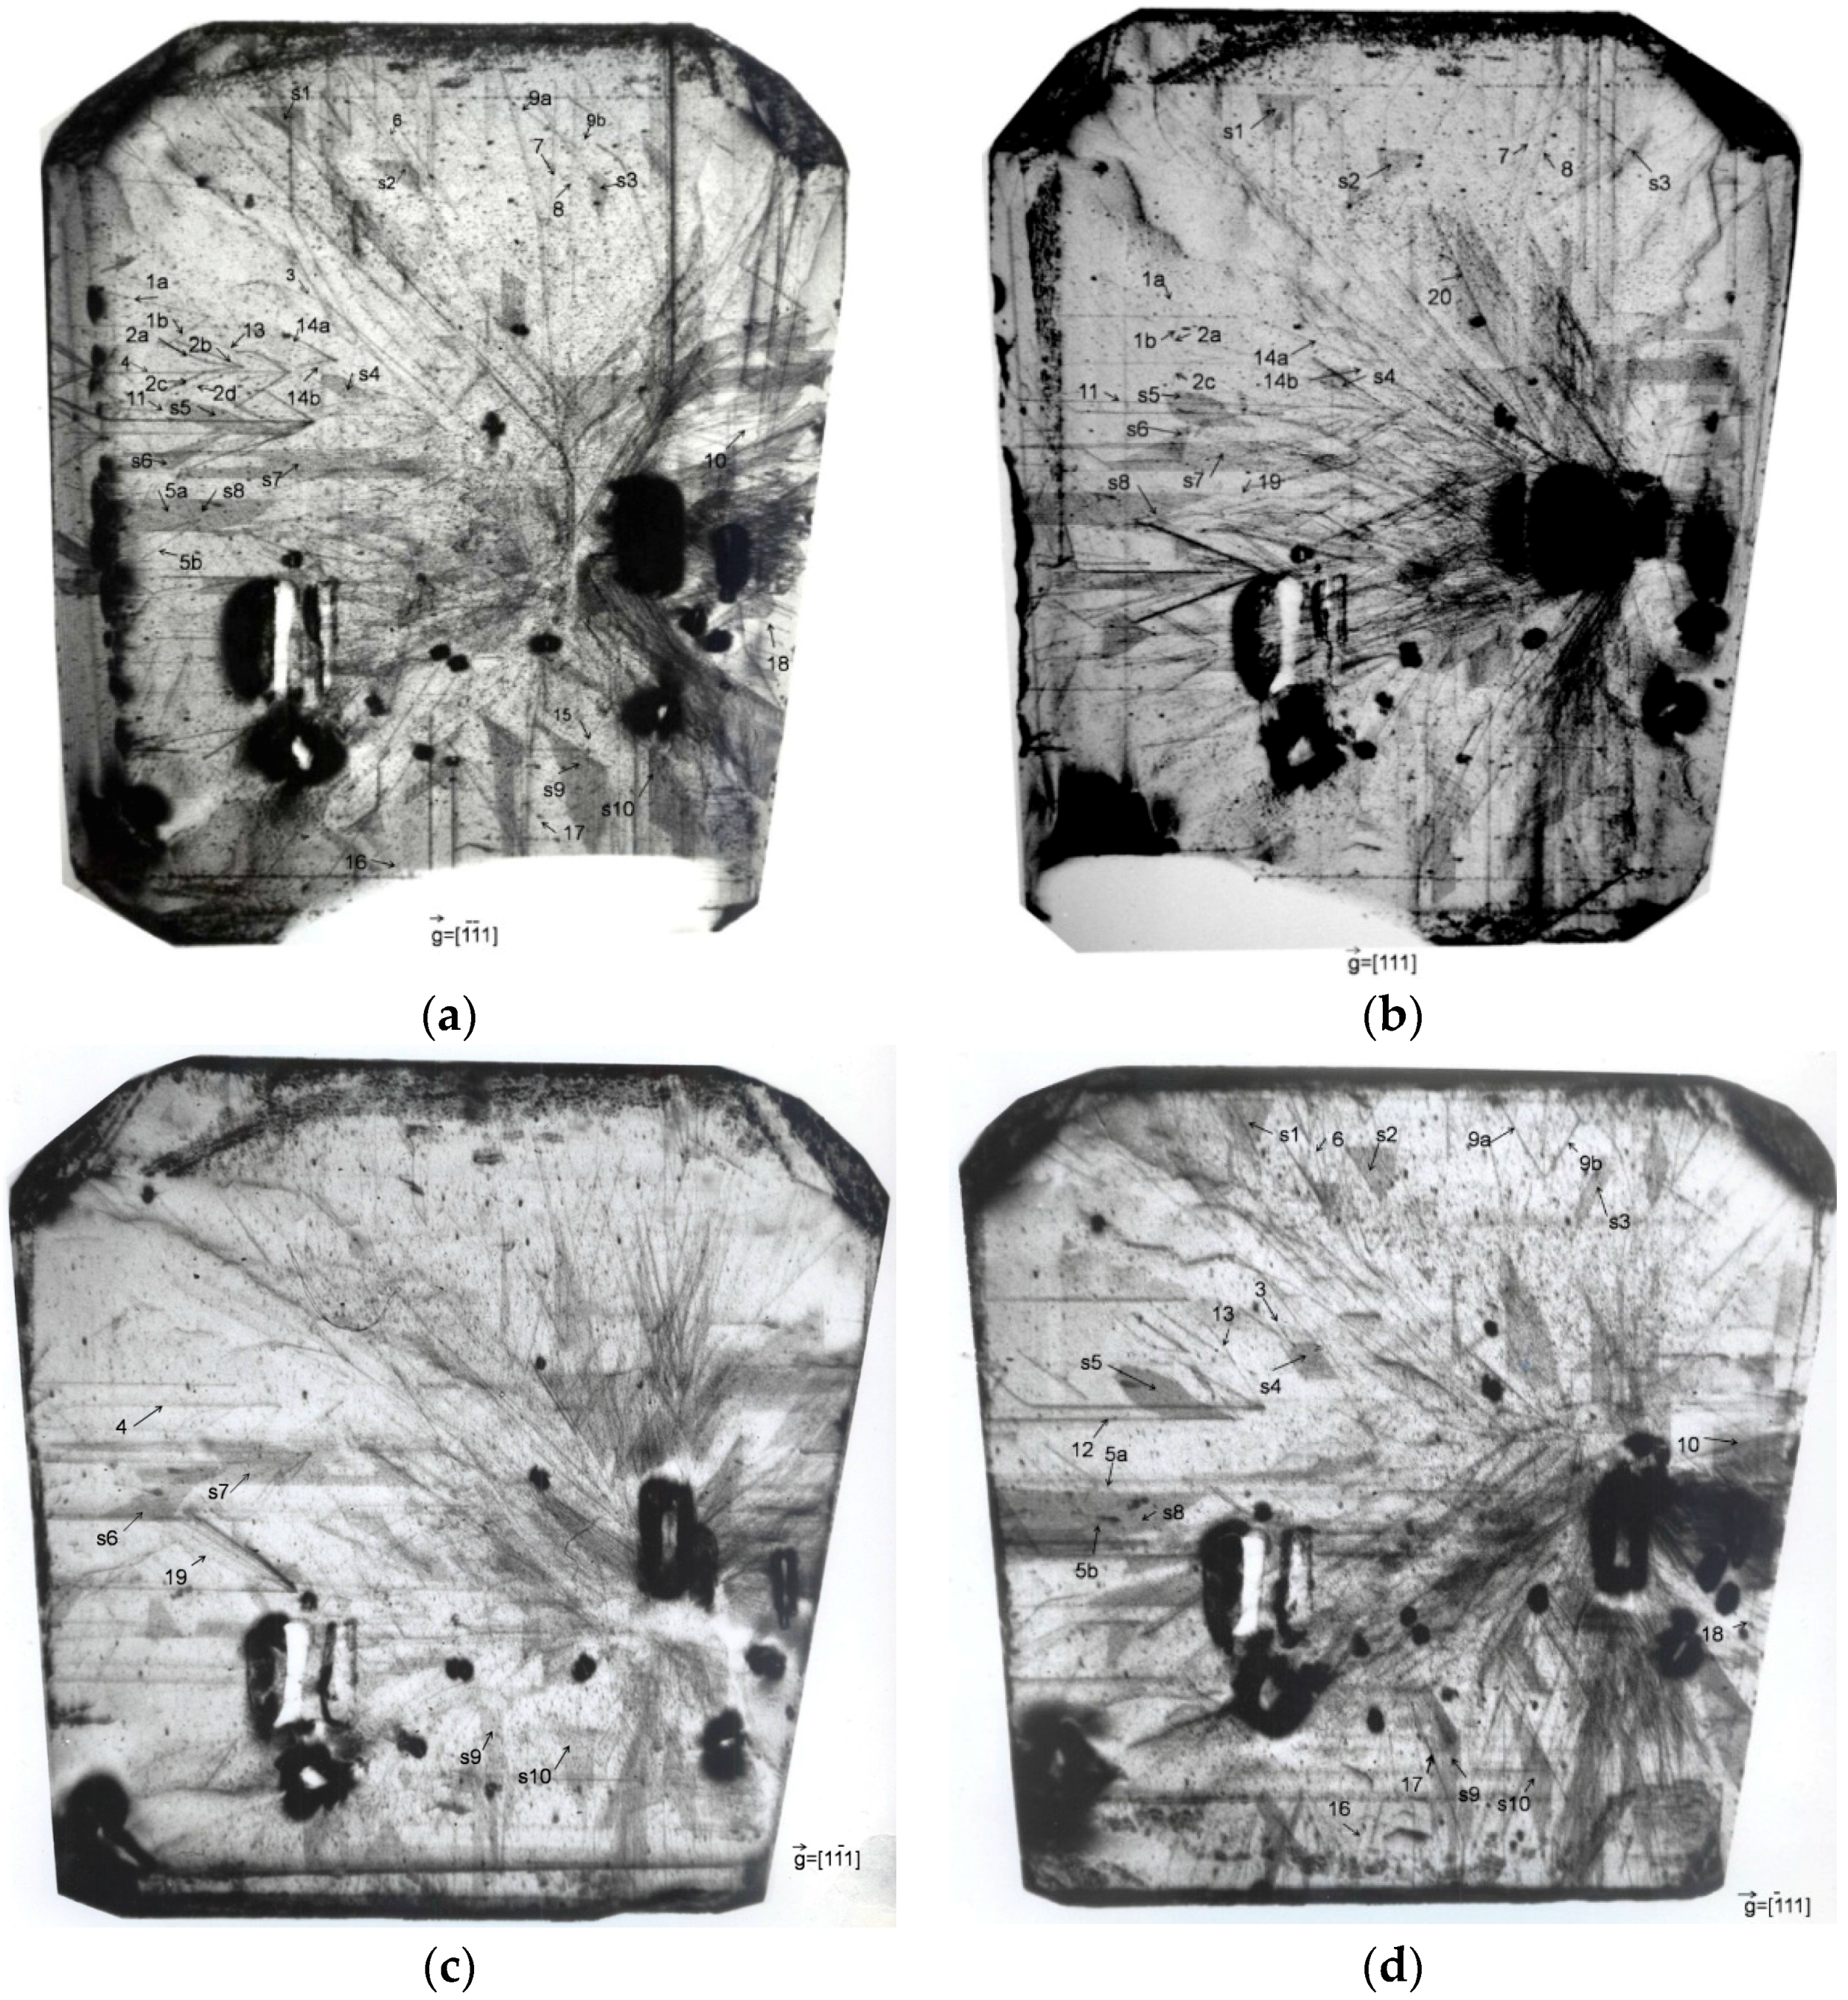
4.3. Studies of Dislocations, Inclusions, and Stacking Faults

The two diamond slabs provided a good opportunity for studies of dislocations, because both specimens contained regions in which the dislocations were in low concentrations and were well resolved. The best technique for the characterization of dislocations was Lang transmission topography, but in many cases back-reflection topographic methods were also useful. The back-reflection topographs were often more legible, revealing defects from a near-surface layer only. In some cases, we were able to obtain images of defects from the whole thickness of the slabs, also in back-reflection geometry.
To identify the dislocation type and the orientation of dislocations, we took Lang topographs of each slab in 111-type reflections from all four equivalent planes and additionally symmetrical 220-type reflections from equivalent planes. A set of 111-type reflections is usually sufficient, but several effects can make interpretation less clear. High concentrations of other dislocations or defects in the neighborhood can decrease the contrast of a particular dislocation, making it invisible even where g.b ≠ 0. On the other hand, the effect of decoration of a dislocation line by impurities can make the contrast relatively high, even where g.b = 0. Contrast of the edge component of a dislocation does not completely vanish unless the diffraction vector is parallel to the dislocation line. It was therefore reasonable to confirm the identification of Burgers vectors using also the set of more sensitive 220-type reflections and to check whether each contrast behavior was explained by a particular Burgers vector.
Representative Lang topographs are shown in Figure 8 and Figure 9. To illustrate the behavior of contrast on dislocations, we reproduce here the four 111-type topographs of the slab (C1) closer to the seed. A major difficulty in the determination of orientations and Burgers vectors of dislocations at this concentration of defects was the identification of a particular dislocation line in the various topographs. As most dislocations were located along typical <011>, <112>, and <001> directions, we found it helpful to predetermine their orientation and to localize their outcrops on the various surfaces by comparison of the topographs with prepared diagrams containing the projections of possible dislocation directions in 111- and 220-topographs (see Figure 10). Then we were able to predict the positions of these dislocations in the other topographs and to confirm the preliminary identification.
We were able to identify up to seventy best-resolved dislocations in both slabs. Eighteen of them are marked in the topographs of the sample (C1) closer to the seed, and fifteen in the topographs of the slab (C2) farther from the seed. The probable identification of the selected dislocations marked in the topographs of C1 shown in Figure 8 and Figure 9 are listed in Table 2. Some of the lines were revealed with much higher contrast, which however, behaved in the different reflections as if from a perfect dislocation. In such cases the line may be either composed of a few dislocations, or of a dislocation split into two partial dislocations and a narrow stacking fault.
The majority of dislocation lines were oriented along <211> directions and many also along <110> directions. Along <211>, the dislocations were mostly of mixed 30° type and a few were of edge type. These dislocations also dominate in the regions with the highest density of dislocations. The dislocations in these regions were unresolved in Lang topographs, but some conclusions were drawn from them, and also from back-reflection topographs taken in reflections from different crystallographic planes. Along <011>directions, 60° dislocations were common. All dominating dislocations have {111} slip planes. Quite frequently 73.3° and 54.7° mixed dislocations also occurred along <112> directions; and screw dislocations along <011> directions. We also found some 45° mixed dislocations along <001> directions. Nearly all dislocations were observed to be straight-lined, but some of them consisted of straight segments oriented along several different directions. The identified types of dislocations are in agreement with those theoretically predicted by Hornstra [39].
We found many cases of the origin of two or more dislocations at metallic inclusions; as for example, in the case of dislocations denoted 2 a,b,c,d in Figure 8a and Figure 9. The topographs revealed many metallic inclusions of different sizes in the diamond. Some of the inclusions produced characteristic extended black contrast, with the central parts not reflecting. More metallic inclusions were revealed in the transmission topographs, but many of them were visible also in the back-reflection topographs. The inclusions, especially the larger ones, were much more numerous in the slab (C1) closer to the seed. Comparing the Lang topographs with optical micrographs, also revealing major inclusions, it was noted that the dark contrast comes from a much greater volume than the real volume of the inclusion, such is the extent of the surrounding strain field.
Comparing the topographs of both slabs, and following the dislocations visible within them, we may conclude that dislocations in the more populated regions were generated at two large metallic inclusions. One of these inclusions is situated close to the seed in the topographs of slab C1. The other large inclusion is visible in the lower left part of these topographs.

4.4. Studies of Stacking Faults

The topographs also revealed numerous stacking faults. From the point of view of their geometrical appearance, stacking faults in both slabs can be divided into two categories. One consists of stacking faults of a regular triangular shape and the other of stacking faults less regularly bounded. These latter seem to be the result of splitting of some parts of dislocation lines. The configuration of the stacking faults close to the surface can be easily followed in the single-crystal back-reflection topographs, or in double-crystal topographs recorded at the slopes of the maximum. The stacking faults produced here show relatively strong contrast, while the contrast of dislocations and growth-sector boundaries is relatively faint. The contrast due to growth-sector boundaries was also very weak in Lang transmission topographs.
The identification of observed planar defects as stacking faults was confirmed by observation of their contrast in various transmission reflections. The extinction of stacking-fault contrast should occur where g.f = m, where m is an integer and f is the fault-vector. In a crystal with the diamond structure, f is either 1/3 <111> for the intrinsic type of stacking fault, or 2/3 <111> for the theoretically possible extrinsic type of stacking fault. Each fault vector is perpendicular to the corresponding {111} fault plane. A particular stacking fault is not visible in one of the four 111-type reflections and in three of the six 220-type reflections. We were able to confirm these rules, determining the orientation of fault planes from the geometrical features of the image in the case of up to forty different stacking faults. Some of them are marked in Figure 8 and listed in Table 3.
It was found from geometrical analysis of the topographs, that triangular stacking faults were bounded on two sides by partial dislocations oriented along <011> and <112> directions. On the third side the triangular stacking faults are bounded by the surfaces of the slabs. It was found that in some cases, partial dislocations were formed by the splitting of a dislocation coming to the stacking fault. In particular, such is the case of the stacking fault marked by s5 in Figure 8. We noticed triangular stacking faults generated at one point containing a metallic inclusion.
Of interest is the comparison of the discussed Lang transmission images with the double-crystal topographic images of both artificially introduced surfaces of the diamond slab, shown in Figure 11. The double-crystal topographs well reveal the structure of the growth sectors, and also the lattice parameter differences, deduced from the difference in the angular position of the rocking curve. One can note that the double-crystal topographs do not reveal some parts of the dislocations and stacking faults visible in the transmission Lang topographs, as a result of the low g.b values. Some stacking faults outcropping to the surface can be seen in Figure 11b. On the other hand, the reflection topographs well reveal the dislocations outcropping on to the surface in some dense bundles. Contrary to the situation in more highly absorbing crystals, the double-crystal images of dislocations here do not exhibit characteristic black-white rosettes; and most of their contrast is connected with the dislocation line and some additional strain component associated with the relaxation of the stress at the free surface [40].

5. Conclusions

Quantitative polarizing microscopy has been successfully applied to measure and to map the variations in birefringence across several [111]-grown synthetic HPHT diamonds. X-ray topographic methods have been employed to locate dislocations in these diamonds, which showed that the dislocations grew radially from the centre of each diamond into regions of relatively low birefringence; with the result that dislocations appeared to relieve strain.
Growth banding, caused by impurity variations from fluctuating growth conditions, in [001]-grown diamonds was revealed both in polarizing microscopy and in synchrotron X-ray topography. The latter technique imaged, in a variety of contrasts, not only this banding but also numerous clearly-resolved dislocations.
Using Lang projection topographs taken in 111- and 022-reflections from all equivalent crystallographic planes, we performed extended studies of dislocation structure in a 0.7 mm thick diamond slab (C1) cut from a large cuboctahedral diamond close to the seed. This included the identification of crystallographic orientation and type of up to 70 of the best resolved individual dislocations. The dislocations with {111} glide planes, especially those directed along <112> directions, were found to be dominant. Many of these dislocations were evidently found to be generated on metallic inclusions present in the sample. Discussing mineral inclusions in natural diamond, a recent publication [41] reproduces part of a figure from our earlier paper [13] to illustrate the fact that inclusions usually emit bundles of many dislocations.
The numerous stacking faults were identified on the basis of their extinction rules and their geometric appearance. We also confirmed the intrinsic character of observed stacking faults on the basis of comparison of fringe patterns obtained in high-resolution back-reflection double-crystal synchrotron topographs with theoretical predictions based upon an application of plane-wave dynamical theory.

Acknowledgments

The authors are greatly indebted to the Engineering and Physical Sciences Research Council and to Element Six for experimental facilities and financial support; to R.C. Burns (Diamond Research Laboratory, Johannesburg, RSA) for the interesting specimens of HPHT diamonds; to C.M. Welbourn (Diamond Trading Company Research Centre, Maidenhead, UK) for laser-sawing it into two slabs; to Michael Glazer (University of Oxford) for use of his Metripol quantitative birefringence microscope; and to Elsevier Science Publishers BV for permission to reproduce Figure 2b and Figure 8 from reference [13].

Author Contributions

Moreton Moore, Stuart G. Nailer and Wojciech K. Wierzchowski conceived and designed the experiments; Stuart G. Nailer and Wojciech K. Wierzchowski performed the experiments; Moreton Moore, Stuart G. Nailer and Wojciech K. Wierzchowski analysed the data; and Moreton Moore, Stuart G. Nailer and Wojciech K. Wierzchowski wrote the paper.

Conflicts of Interest

The authors declare no conflict of interest.

References

  1. Wentorf, R.H., Jr. Some studies of diamond growth rates. J. Phys. Chem. 1971, 75, 1833–1837. [Google Scholar] [CrossRef]
  2. Strong, H.M.; Wentorf, R.H., Jr. The growth of large diamond crystals. Naturwissenschaften 1972, 59, 1–7. [Google Scholar] [CrossRef]
  3. Burns, R.C.; Robertson, S.H.; Keddy, R.J.; Nam, T.J. Large synthetic diamonds—Their manufacture and application. In Diamond Conference Abstracts; Royal Holloway and Bedford New College: Surrey, UK, 1986; pp. 18–22. [Google Scholar]
  4. Lang, A.R. Diffraction and Imaging Techniques in Material Science; Amelinckx, S., Gevers, R., Van Landuyt, J., Eds.; North Holland: Amsterdam, The Netherlands; New York, NY, USA; Oxford, UK, 1978; Volume 2, p. 623. [Google Scholar]
  5. Lang, A.R. On the growth-sectorial dependence of defects in natural diamonds. Proc. R. Soc. Lond. A 1974, 340, 233–248. [Google Scholar] [CrossRef]
  6. Hanley, P.L.; Kiflawi, I.; Lang, A.R. On topographically identifiable sources of cathodoluminescence in natural diamonds. Phil. Trans. R. Soc. Lond. A 1977, 284, 329–368. [Google Scholar] [CrossRef]
  7. Woods, G.S.; Lang, A.R. Cathodoluminescence, optical absorption and X-ray topographic studies of synthetic diamonds. J. Cryst. Growth 1975, 28, 215–226. [Google Scholar] [CrossRef]
  8. Frank, F.C.; Lang, A.R.; Evans, D.J.F.; Rooney, M.-L.T.; Spear, P.M.; Welbourn, C.M. Orientation-dependent nitrogen incorporation on vicinals on synthetic diamond cube growth surfaces. J. Cryst. Growth 1990, 100, 354–376. [Google Scholar] [CrossRef]
  9. Lang, A.R.; Moore, M. Cathodoluminescence and X-ray topography of HPHT diamonds. In New Diamond Science and Technology, Proceeding of MRS International Conference, Boston, MA, USA, 2–6 December 1991; 1991; pp. 683–694. [Google Scholar]
  10. Burns, R.C.; Chumakov, A.J.; Connell, S.H.; Dube, D.; Godfried, H.P.; Hansen, J.O.; Härtwig, J.; Hoszowska, J.; Masiello, F.; Mkhonza, L.; et al. HPHT growth and X-ray characterization of high quality type IIa diamond. J. Phys. Condens. Matter 2009, 21, 364224. [Google Scholar] [CrossRef] [PubMed]
  11. Martineau, P.M.; Gaukroger, M.P.; Guy, K.B.; Lawson, S.C.; Twitchen, D.J.; Friel, I.; Hausen, J.O.; Summerton, C.G.; Addison, T.P.G.; Burns, R. High crystalline quality single-crystal vapour deposition diamond. J. Phys. Condens. Matter 2009, 21, 364205. [Google Scholar] [CrossRef] [PubMed]
  12. Lang, A.R.; Moore, M.; Makepeace, A.P.W.; Wierzchowski, W.; Welbourn, C. On the dilatation of synthetic type Ib diamond by substitutional nitrogen impurity. Phil. Trans. R. Soc. Lond. A 1991, 337, 497–520. [Google Scholar] [CrossRef]
  13. Wierzchowski, W.K.; Moore, M.; Makepeace, A.P.W.; Yacoot, A. X-ray topographic studies and measurement of lattice parameter differences within synthetic diamonds grown by the reconstitution technique. J. Cryst. Growth 1991, 114, 209–227. [Google Scholar] [CrossRef]
  14. Kowalski, G.; Lang, A.R.; Makepeace, A.P.W.; Moore, M. Studies of stacking-fault contrast by synchrotron X-ray section topography. J. Appl. Cryst. 1989, 22, 410–430. [Google Scholar] [CrossRef]
  15. Wierzchowski, W.K.; Moore, M. Observation of interference fringes in Bragg-case synchrotron double-crystal images of stacking faults in diamond. Acta Phys. Pol. A 1992, 82, 185–191. [Google Scholar] [CrossRef]
  16. Wierzchowski, W.K.; Moore, M. The images of dislocations in synchrotron Bragg-case section topography of diamond. Acta Phys. Pol. A 1992, 82, 193–200. [Google Scholar] [CrossRef]
  17. Wierzchowski, W.; Moore, M. Bragg-case images of stacking faults. Acta Cryst. A 1995, 51, 831–840. [Google Scholar] [CrossRef]
  18. Kowalski, G.; Moore, M.; Gledhill, G.; Maričić, Z. Synchrotron X-ray studies of strain in (100)-oriented high pressure-high temperature (HP-HT) synthetic diamonds. Diam. Relat. Mater. 1996, 4, 1254–1263. [Google Scholar] [CrossRef]
  19. Moore, M.; Golshan, M.; Kowalski, G.; Reid, J.; Collins, S.; Murphy, B. Reciprocal-space mapping of synthetic and natural diamond. J. Phys. D Appl. Phys. 1999, 32, A37–A41. [Google Scholar] [CrossRef]
  20. Moore, M.; Wierzchowski, W. Transmission double-crystal synchrotron studies of synthetic diamond using the Haruta stereo-pairs technique. Phil. Trans. R. Soc. Lond. A 1999, 357, 2671–2679. [Google Scholar] [CrossRef]
  21. Wierzchowski, W.K.; Moore, M. Bragg-case Kg and K0 beam double-crystal synchrotron studies of growth sectors and dislocations in synthetic diamonds. J. Appl. Phys. 2007, 101, 053518–053526. [Google Scholar] [CrossRef]
  22. Nailer, S.G.; Moore, M.; Chapman, J.; Kowalski, G. On the role of nitrogen in stiffening the diamond structure. J. Appl. Cryst. 2007, 40, 1146–1152. [Google Scholar] [CrossRef]
  23. Khokhryakov, A.F.; Palyanov, Y.N. Revealing of dislocations in diamond crystals by the selective etching method. J. Cryst. Growth 2006, 293, 469–474. [Google Scholar] [CrossRef]
  24. Khokhryakov, A.F.; Palyanov, Y.N. Revealing of planar defects and partial dislocations in large synthetic diamond crystals by the selective etching. J. Cryst. Growth 2007, 306, 458–464. [Google Scholar] [CrossRef]
  25. Frank, F.C.; Lang, A.R. X-ray topography of diamond. In Physical Properties of Diamond; Berman, R., Ed.; Clarendon Press: Oxford, UK, 1965; pp. 86–102 and 425–426. [Google Scholar]
  26. Khokhryakov, A.F.; Palyanov, Y.N.; Kuprianov, I. N.; Borzdov, Y.M.; Sokol, A.G.; Härtwig, J.; Masiello, F. Crystal growth and perfection of large octahedral synthetic diamonds. J. Cryst. Growth 2011, 317, 32–38. [Google Scholar] [CrossRef]
  27. Kasu, M.; Murakami, R.; Masuya, S.; Harada, K.; Sumiya, H. Synchrotron X-ray topography of dislocations in high-pressure high-temperature-grown single crystal diamond with low dislocation density. Appl. Phys. Exp. 2014, 7, 125501. [Google Scholar] [CrossRef]
  28. Tamasaku, K.; Ueda, T.; Miwa, D.; Ishikawa, D. Goniometric and topographic characterization of synthetic IIa diamonds. J. Phys. D Appl. Phys. 2005, 38, A61–A66. [Google Scholar] [CrossRef]
  29. Zhong, Y.; Krasnicki, S.; Macrander, A.T.; Chu, Y.S.; Maj, J. Bragg-case limited projection topography study of surface damage in diamond-crystal plates. J. Phys. D Appl. Phys. 2005, 38, A39–A43. [Google Scholar] [CrossRef]
  30. Gaukroger, M.P.; Martineau, P.M.; Crowder, M.J.; Friel, I.; Williams, S.D.; Twitchen, D.J. X-ray topography studies of dislocations in single crystal CVD diamond. Diam. Relat. Materi. 2008, 17, 262–269. [Google Scholar] [CrossRef]
  31. Kowalski, G.; Moore, M.; Gledhill, G.; Maričić, Z. Double-crystal diffractometric and topographic studies of (111) oriented synthetic diamonds. J. Phys. D Appl. Phys. 1996, 29, 793–800. [Google Scholar] [CrossRef]
  32. Glazer, A.M.; Lewis, J.G.; Kaminsky, W. An automatic optical imaging system for birefringent media. Proc. Roy. Soc. Lond. A 1996, 452, 2751–2765. [Google Scholar] [CrossRef]
  33. Moore, M. Synchrotron X-ray topography. Radiat. Phys. Chem. 1995, 45, 427–444. [Google Scholar] [CrossRef]
  34. Moore, M. Imaging diamond with X-rays. J. Phys. Condens. Matter 2009, 21, 364217. [Google Scholar] [CrossRef] [PubMed]
  35. Moore, M. White-beam X-ray topography. Cryst. Rev. 2012, 18, 207–235. [Google Scholar] [CrossRef]
  36. Lang, A.R. X-ray topographic and optical imaging studies of synthetic diamonds. J. Appl. Cryst. 1994, 27, 988–1001. [Google Scholar] [CrossRef]
  37. Burns, R.C.; Davies, G.J. Growth of synthetic diamond. In The Properties of Natural and Synthetic Diamond; Field, J.E., Ed.; Academic Press: London, UK, 1992; pp. 395–422. [Google Scholar]
  38. Burns, R.C.; Cvetkovic, V.; Dodge, C.N.; Evans, D.J.F.; Rooney, T.; Spear, P.M.; Welbourn, C. Growth-sector dependence of optical features in large synthetic diamonds. J. Cryst. Growth. 1990, 104, 257–279. [Google Scholar] [CrossRef]
  39. Hornstra, J. Dislocations in the diamond lattice. J. Phys. Chem. Solids 1958, 5, 129–141. [Google Scholar] [CrossRef]
  40. Shaibani, S.J.; Hazzledine, P.M. The displacement and stress fields of a general dislocation close to a free surface of an isotropic solid. Phil. Mag. A 1981, 44, 657–665. [Google Scholar] [CrossRef]
  41. Agrosi, G.; Nestola, F.; Tempesta, G.; Bruno, M.; Scandale, E.; Harris, J. X-ray topographic study of a diamond from Udachnaya: Implications for the genetic nature of inclusions. Lithos 2016, 248–251, 153–159. [Google Scholar] [CrossRef]
Figure 1. Optical images of diamond A1. (a) Optical micrograph of diamond A1 (Image width 2 mm); (b) Optical absorption map of A1 (Image width 1 mm); (c) Optical retardation (birefringence) map; (d) Optical indicatrix orientation map of A1.
Crystals 06 00071 g001
Figure 2. The colour palette for quantitative birefringence microscopy.
Crystals 06 00071 g002
Figure 3. Section topograph of diamond A1. Image width = 2 mm. 440 reflection, λ = 0.71 Å, diffraction vector g ↓.
Crystals 06 00071 g003
Figure 4. Images of [111]-grown diamonds A2, A3, and A4—Row (a) gives the sizes and measurements of birefringence far from, and near to, the growth-sector boundaries; (b) Optical micrographs; (c) Absorption maps; (d) Retardation maps; (e) Orientation maps; (f) Section X-ray topographs.
Crystals 06 00071 g004
Figure 5. Optical micrographs of diamond B1 (image width 4 mm). (a) Optical micrograph of diamond B1; (b) Micrograph through Wratten 47B blue filter; (c) Birefringence micrograph (0°); (d) Birefringence micrograph (45°).
Crystals 06 00071 g005
Figure 6. Synchrotron X-ray topographs of diamond B1—Image width 4 mm. Diffraction vector g pointing downwards. (a) 335 reflection, λ = 0.82 Å, g ↓; (b) 224 reflection, λ = 1.18 Å, g ↓.
Crystals 06 00071 g006
Figure 7. Synchrotron X-ray topographs of diamond B2, image width 4 mm. (a) Projection topograph of B2 1 ¯ 1 1 ¯ reflection, λ = 1.0 Å, g towards top left, 55° to horizontal; (b) Section topograph of B2 335 reflection, λ = 0.82 Å, g ↓.
Crystals 06 00071 g007
Figure 8. (a) Projection X-ray topograph of C1, MoKα1 radiation. Diffraction vector g = [−1 −1 1] directed horizontally towards the left; (b) Diffraction vector g = [111] directed to the left (similar to Figure 2b of reference [13] with the addition of labels); (c) Diffraction vector g = [1 −1 1]; (d) Diffraction vector g = [−1 1 1].
Crystals 06 00071 g008
Figure 9. Projection topograph of C1. Diffraction vector g = [–2 –20].
Crystals 06 00071 g009
Figure 10. Diagram showing the projections of dislocations oriented along different crystallographic directions and their relative lengths in the −1 −1 1 topograph (corresponding to Figure 8a).
Crystals 06 00071 g010
Figure 11. (a) A 1 −3 2 5 quartz—400 diamond back-reflection double-crystal topograph taken in CuKα1 radiation from the face closer to the seed. Diffraction vector horizontal, to the right; (b) A 422 silicon—311 diamond CuKα1 double-crystal topograph taken from the other large (100) face of the sample (similar to Figure 8 of reference [13]).
Crystals 06 00071 g011
Table 1. The visibility of [001] growth banding in X-ray topographs of diamond B1.
ReflectionWavelength (Å)Bragg Angle θB (°)Banding Visibility
1110.669.20I
3350.4423.7I
1111.6723.92
2240.7028.72
3370.4732.7I
3330.7834.62
3350.6838.42
2241.0043.44
3370.6447.44
1151.0248.24
3350.8249.13
2241.1854.14
3370.7458.14
1151.2262.95
1151.3273.65
A ranking system was devised for banding visibility: I = invisible, 2—only general darkening of region, 3—general darkening of region with some clear banding, 4—clear banding, 5—very strong and crisp banding. The banding visibility appeared not to be so much governed by X-ray wavelength as by the Bragg angle; and the rows in the table are ordered to emphasize this. By differentiating Bragg’s law, one can show that the sensitivity to small variations in lattice parameter is enhanced as the Bragg angle increases.
Table 2. The identification of the dislocations marked in Figure 8 and Figure 9.
No.Direction of Dislocation LineDirection of Burgers VectorDislocation Type
1a [ 2 ¯ 1 ¯ 1 ] [110]30°
1b [ 0 1 ¯ 1 ] [110]60°
2a [ 2 ¯ 1 ¯ 1 ] [110]30°
2b [ 1 ¯ 01 ] [110]60°
2c [ 1 2 ¯ 1 ] [110]30°
2d [ 0 1 ¯ 1 ] [110]60°
3 [ 2 ¯ 11 ] [ 1 ¯ 01 ] 30°
4[110] [ 01 1 ¯ ] 60°
5a [ 2 ¯ 1 ¯ 1 ] [ 1 ¯ 01 ] 30°
5b [ 0 1 ¯ 1 ] [ 1 ¯ 01 ] 60°
6 [ 2 ¯ 11 ] [ 1 ¯ 01 ] 30°
7 [ 1 ¯ 21 ] [110]73.2°
8 [ 1 ¯ 21 ] [110]73.2°
9a [ 1 ¯ 01 ] [ 1 ¯ 01 ] screw
9b[011] [ 1 ¯ 01 ] 60°
10[121] [ 1 ¯ 01 ] edge
11[110][110]screw
12[110] [ 10 1 ¯ ] 60°
13[211] [ 10 1 ¯ ] 73.2°
14a[211][110]30°
14b [ 1 ¯ 2 ¯ 1 ] [110]30°
15 [ 1 ¯ 21 ] [110]73.2
16 [ 1 ¯ 2 ¯ 1 ] [ 1 ¯ 01 ] edge
17 [ 2 ¯ 11 ] [ 1 ¯ 01 ] edge
18[211] [ 1 ¯ 01 ] 73.2
Table 3. The identification of stacking faults marked in Figure 8.
NumberFault PlaneFault Vector
s1 ( 1 1 ¯ 1 ) 1 3 [ 1 1 ¯ 1 ] or 2 3 [ 1 1 ¯ 1 ]
s2 ( 1 1 ¯ 1 ) 1 3 [ 1 1 ¯ 1 ] or 2 3 [ 1 1 ¯ 1 ]
s3 ( 1 1 ¯ 1 ) 1 3 [ 1 1 ¯ 1 ] or 2 3 [ 1 1 ¯ 1 ]
s4 ( 1 1 ¯ 1 ) 1 3 [ 1 1 ¯ 1 ] or 2 3 [ 1 1 ¯ 1 ]
s5 ( 1 1 ¯ 1 ) 1 3 [ 1 1 ¯ 1 ] or 2 3 [ 1 1 ¯ 1 ]
s6 ( 1 1 ¯ 1 ¯ ) 1 3 [ 1 1 ¯ 1 ¯ ] or 2 3 [ 1 1 ¯ 1 ¯ ]
s7 ( 1 1 ¯ 1 ¯ ) 1 3 [ 1 1 ¯ 1 ¯ ] or 2 3 [ 1 1 ¯ 1 ¯ ]
s8 ( 1 1 ¯ 1 ) 1 3 [ 1 1 ¯ 1 ] or 2 3 [ 1 1 ¯ 1 ]
s9(111) 1 3 [ 111 ]  or  2 3 [ 111 ]
s10(111) 1 3 [ 111 ]  or  2 3 [ 111 ]

