Article

Single Crystal Growth of URu2Si2 by the Modified Bridgman Technique

1
National High Magnetic Field Laboratory, Florida State University, Tallahassee, FL 32310, USA
2
Department of Physics, Florida State University, Tallahassee, FL 32310, USA
3
Department of Chemical and Biomedical Engineering, Florida State University, Tallahassee, FL 32310, USA
*
Author to whom correspondence should be addressed.
Crystals 2016, 6(10), 128; https://doi.org/10.3390/cryst6100128
Submission received: 31 August 2016 / Revised: 22 September 2016 / Accepted: 26 September 2016 / Published: 2 October 2016
(This article belongs to the Special Issue Correlated Electron Crystals)

Abstract

:
We describe a modified Bridgman growth technique to produce single crystals of the strongly correlated electron material URu2Si2 and its nonmagnetic analogue ThRu2Si2. Bulk thermodynamic and electrical transport measurements show that the properties of crystals produced in this way are comparable to those previously synthesized using the Czochralski or conventional molten metal flux growth techniques. For the specimens reported here, we find residual resistivity ratios R R R = ρ 300 K / ρ 0 as large as 116 and 187 for URu2Si2 and ThRu2Si2, respectively.

1. Introduction

Research into URu2Si2 has been fueled by interest in an unusual amalgam of phenomena that are believed to originate from a blend of local and itinerant electron behavior, including a peculiar non-magnetic low temperature broken symmetry state (“hidden order”), for which the order parameter has yet to be identified [1,2,3,4]. The fact that it also hosts unconventional superconductivity makes this material even more attractive. Recent success in producing high quality specimens [5,6,7] has resulted in a surge of experimental work, including electronic Raman spectroscopy [8], elastoresistance [9], resonant ultrasound [10], Kerr rotation [11], X-ray scattering [12], and quantum oscillation measurements [13,14,15], which have provided unprecedented insight into the electronic, ordered state, and superconducting behavior. However, progress is limited by restricted access to high quality specimens, particularly due to challenges that are inherent to the mainstream growth techniques. For instance, the highest quality specimens are produced using the Czochralski method followed by solid state electrotransport refining (CZO/SSE), which is accomplished by passing a large electrical current through the as-grown crystalline rod under ultra-high vacuum conditions. This is a challenging two-step process [6,7] that is not available in most laboratories. It was recently demonstrated that molten indium is a suitable flux to produce single crystal specimens [5]. While this approach is straightforward, so far its usefulness is limited by the small samples that are produced, low batch yields, and the long growth times. As a result, it remains attractive to develop other techniques to produce high quality single crystal specimens of URu2Si2.
Here we report the synthesis of single-crystal URu2Si2 and ThRu2Si2 specimens using a modified Bridgman method, which is based on the previous work using a molten indium flux [5]. This is an important advance in crystal growth for these materials, because it provides an alternative way to produce single crystals that are needed for a variety of experiments: e.g., not only is it possible to cleave them, but their quality is also high enough to observe quantum oscillations, as seen in other specimens of similar quality [16,17]. Furthermore, previous studies of URu2Si2 have benefitted from investigation of chemical substitution series [16,18,19,20,21,22,23]. Most such work has focused on the substitution of elements with low vapor pressures that are easily dissolved in a stoichiometric melt. This characteristic is a prerequisite for crystals grown using standard methods such as the Czochralski technique, where electrical arcs are typically used to heat the sample. The approach presented here opens the door to introduce a wider variety of substituents, including those with high vapor pressure. This is essential for the exploration of chemical substitution on the Si site, where unexplored possibilities include high vapor pressure elements such as Si → Sn, P, As, S, Se, and Te. Such work is attractive, as evidenced by recent studies of Si → P in URu2Si2 that have uncovered a fascinating phase diagram featuring an unusual disconnect between hidden order and magnetism [16]. We also expect that our technique will be useful for the production of single crystals of the related materials UT2X2 (T = transition metal and X = Si and Ge) [24].

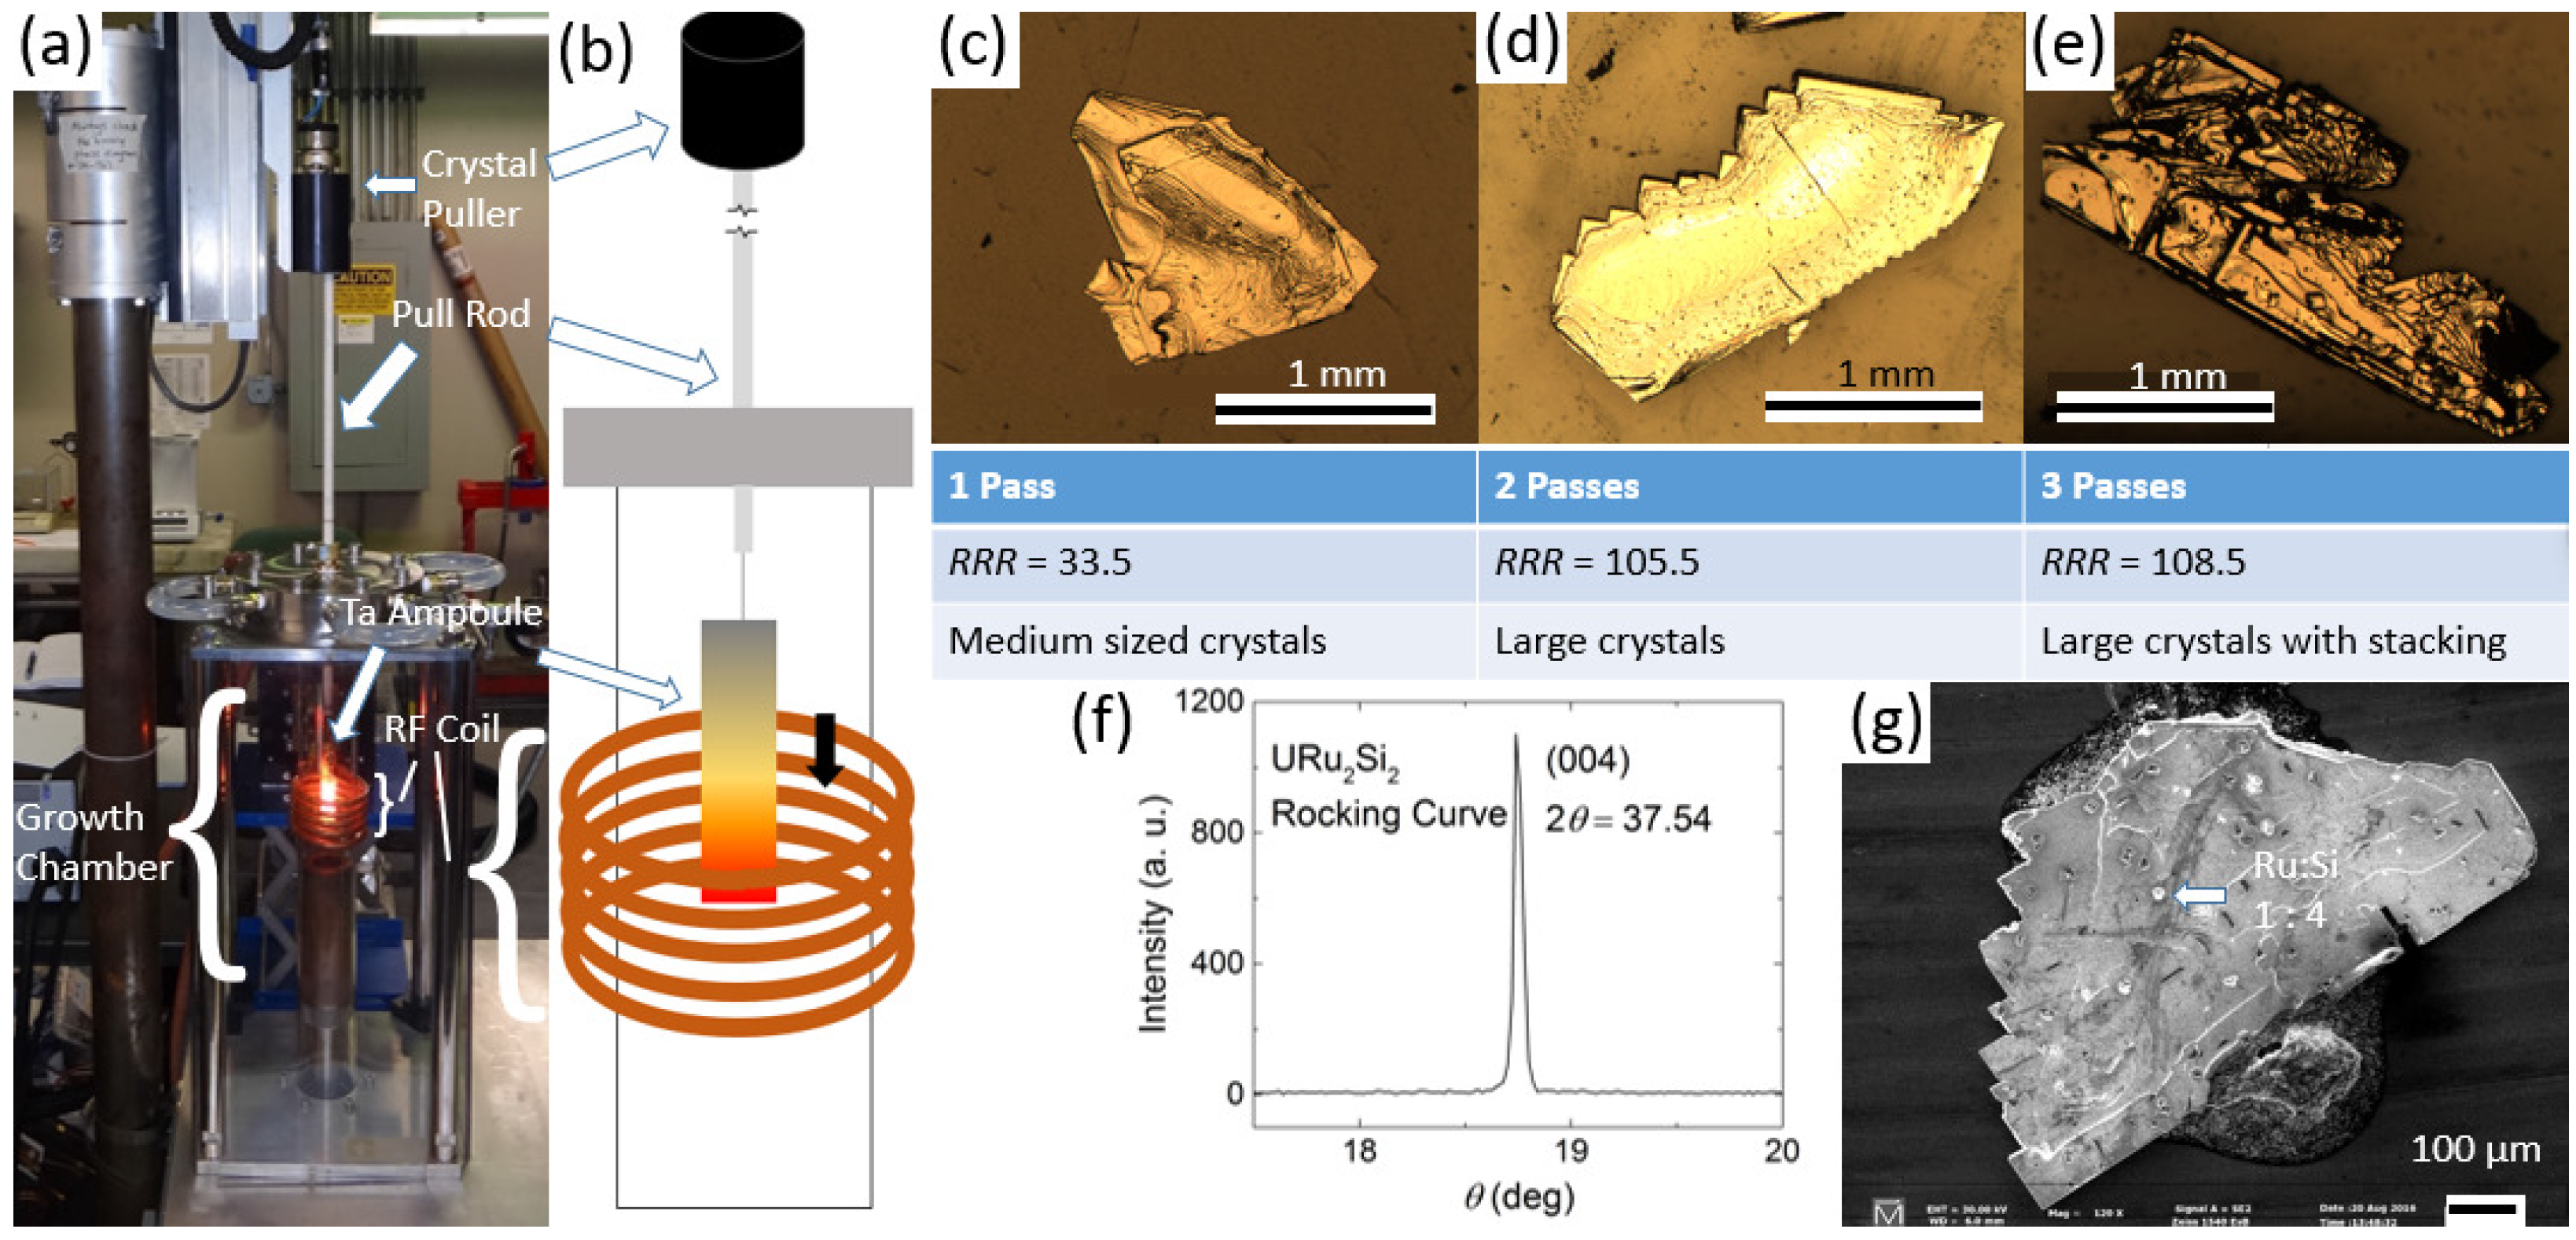
2. Experimental Methods
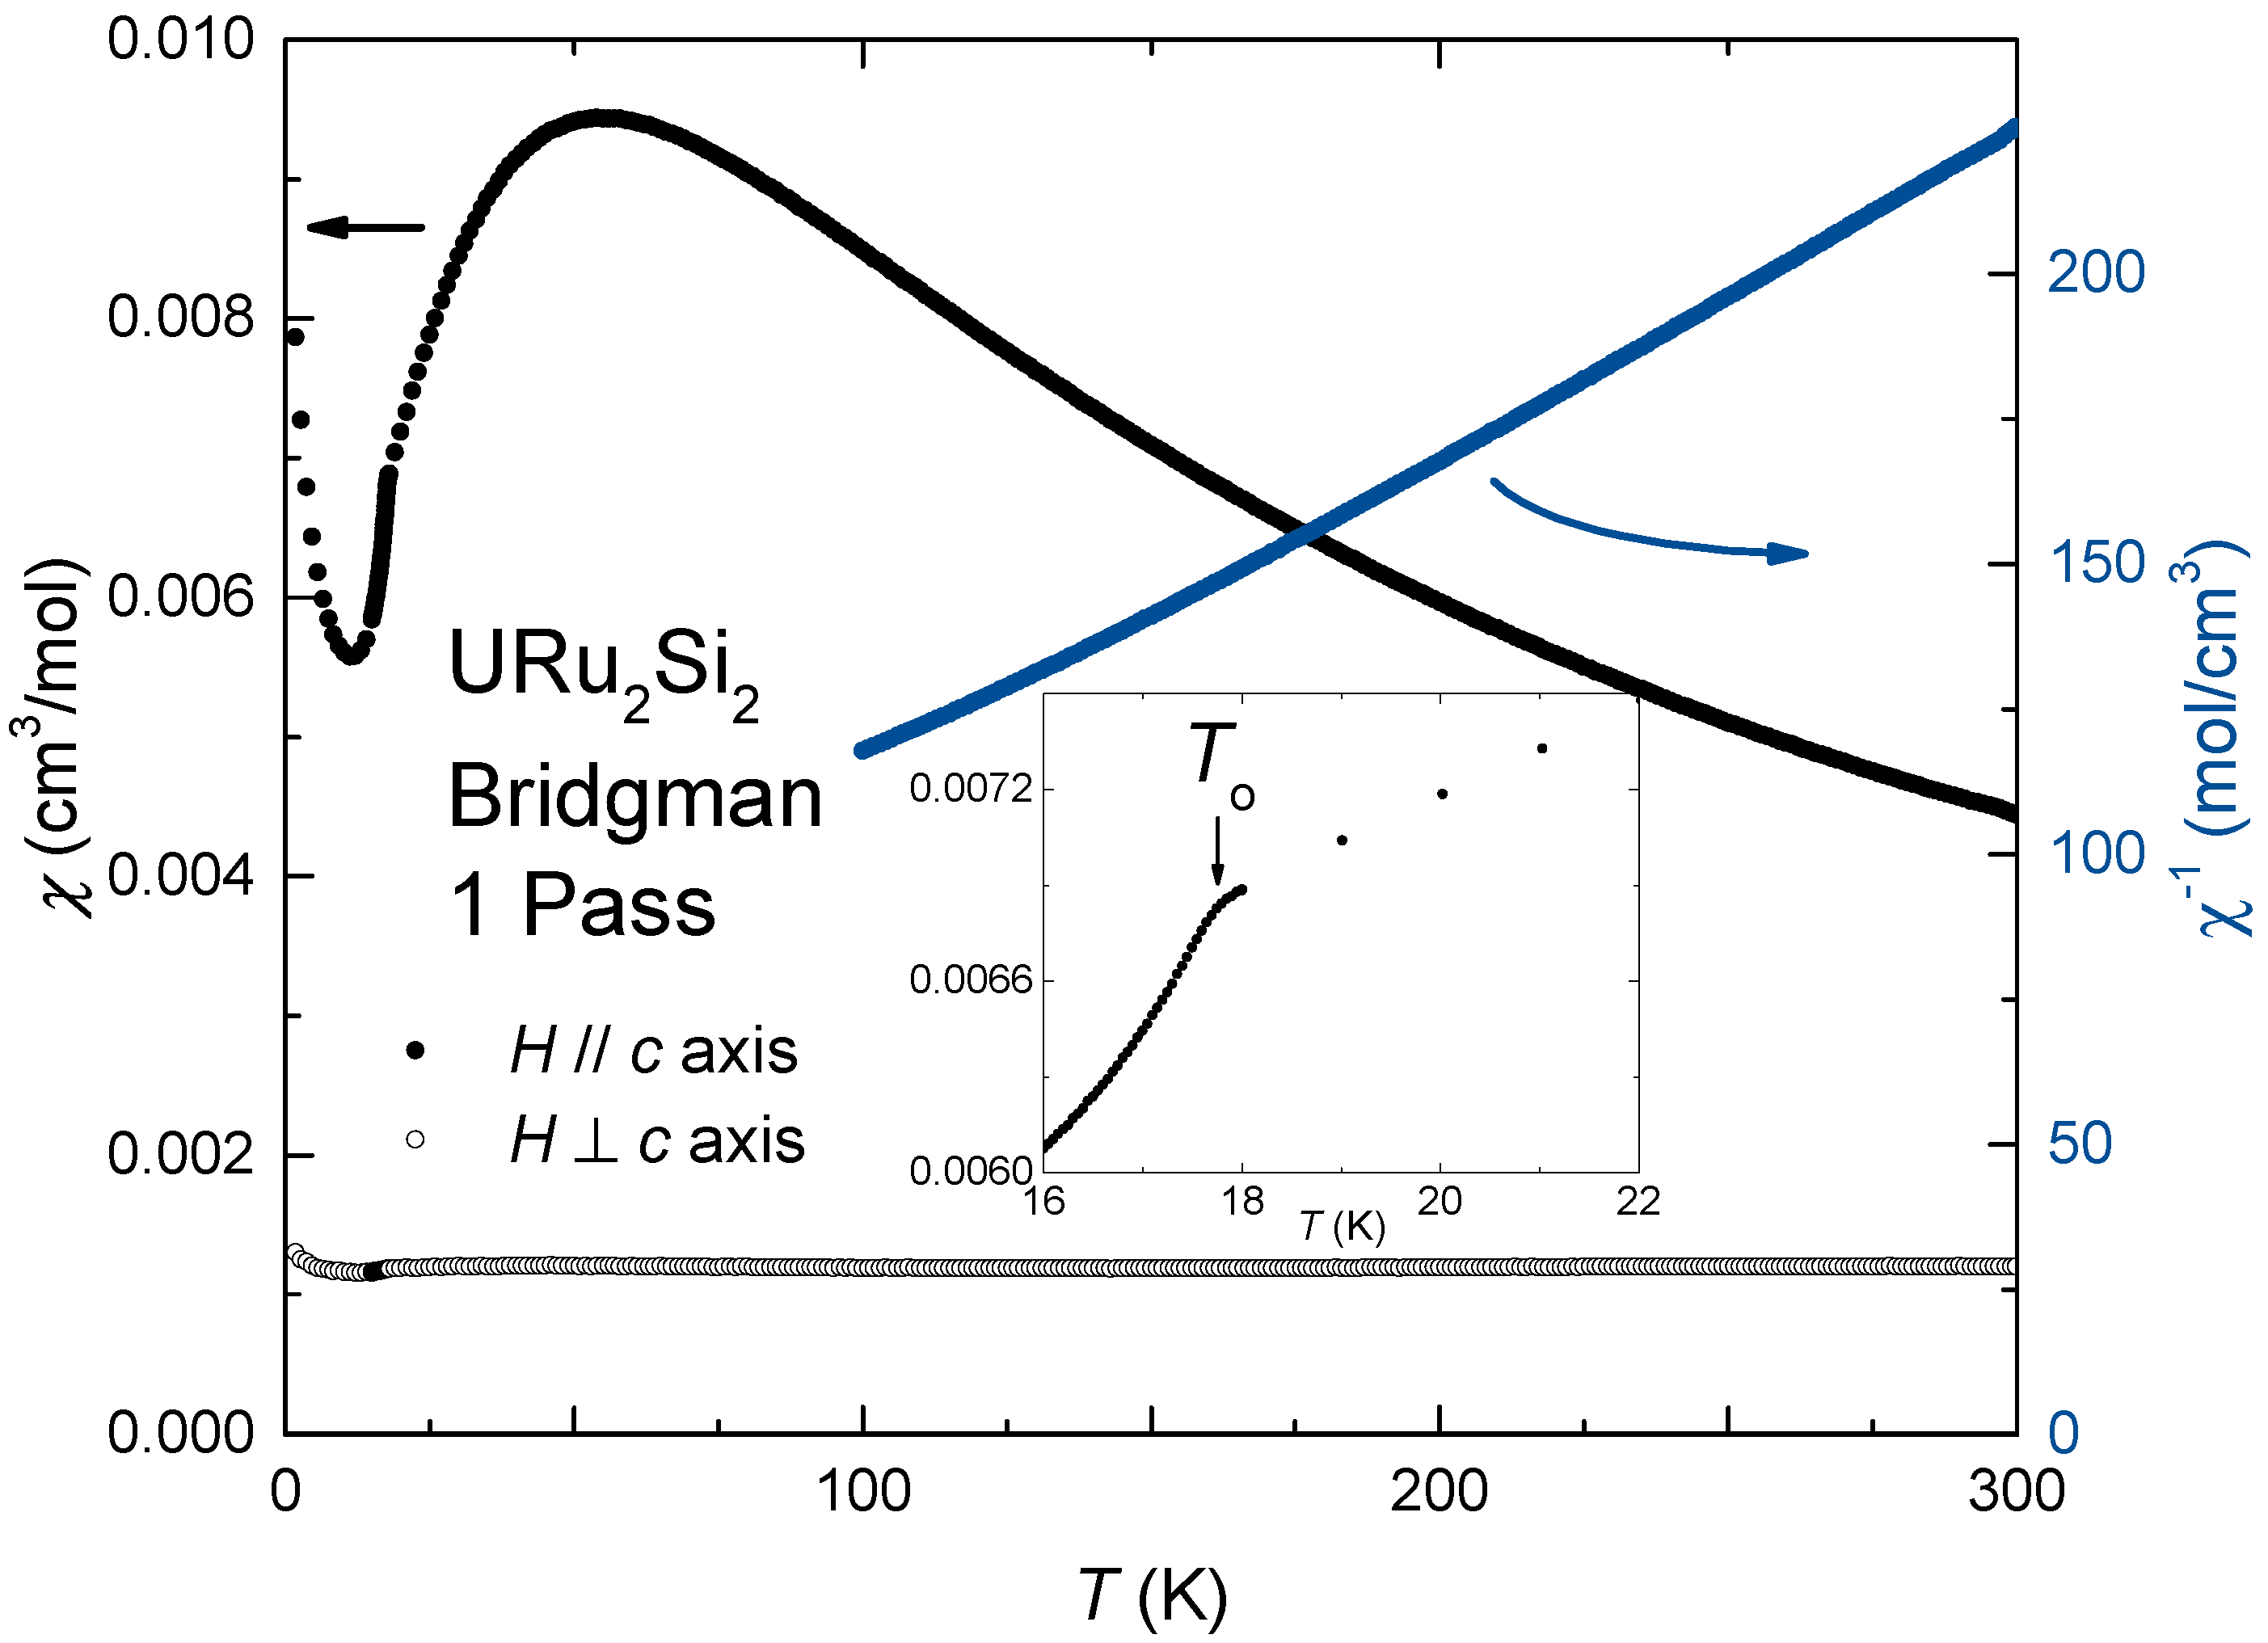
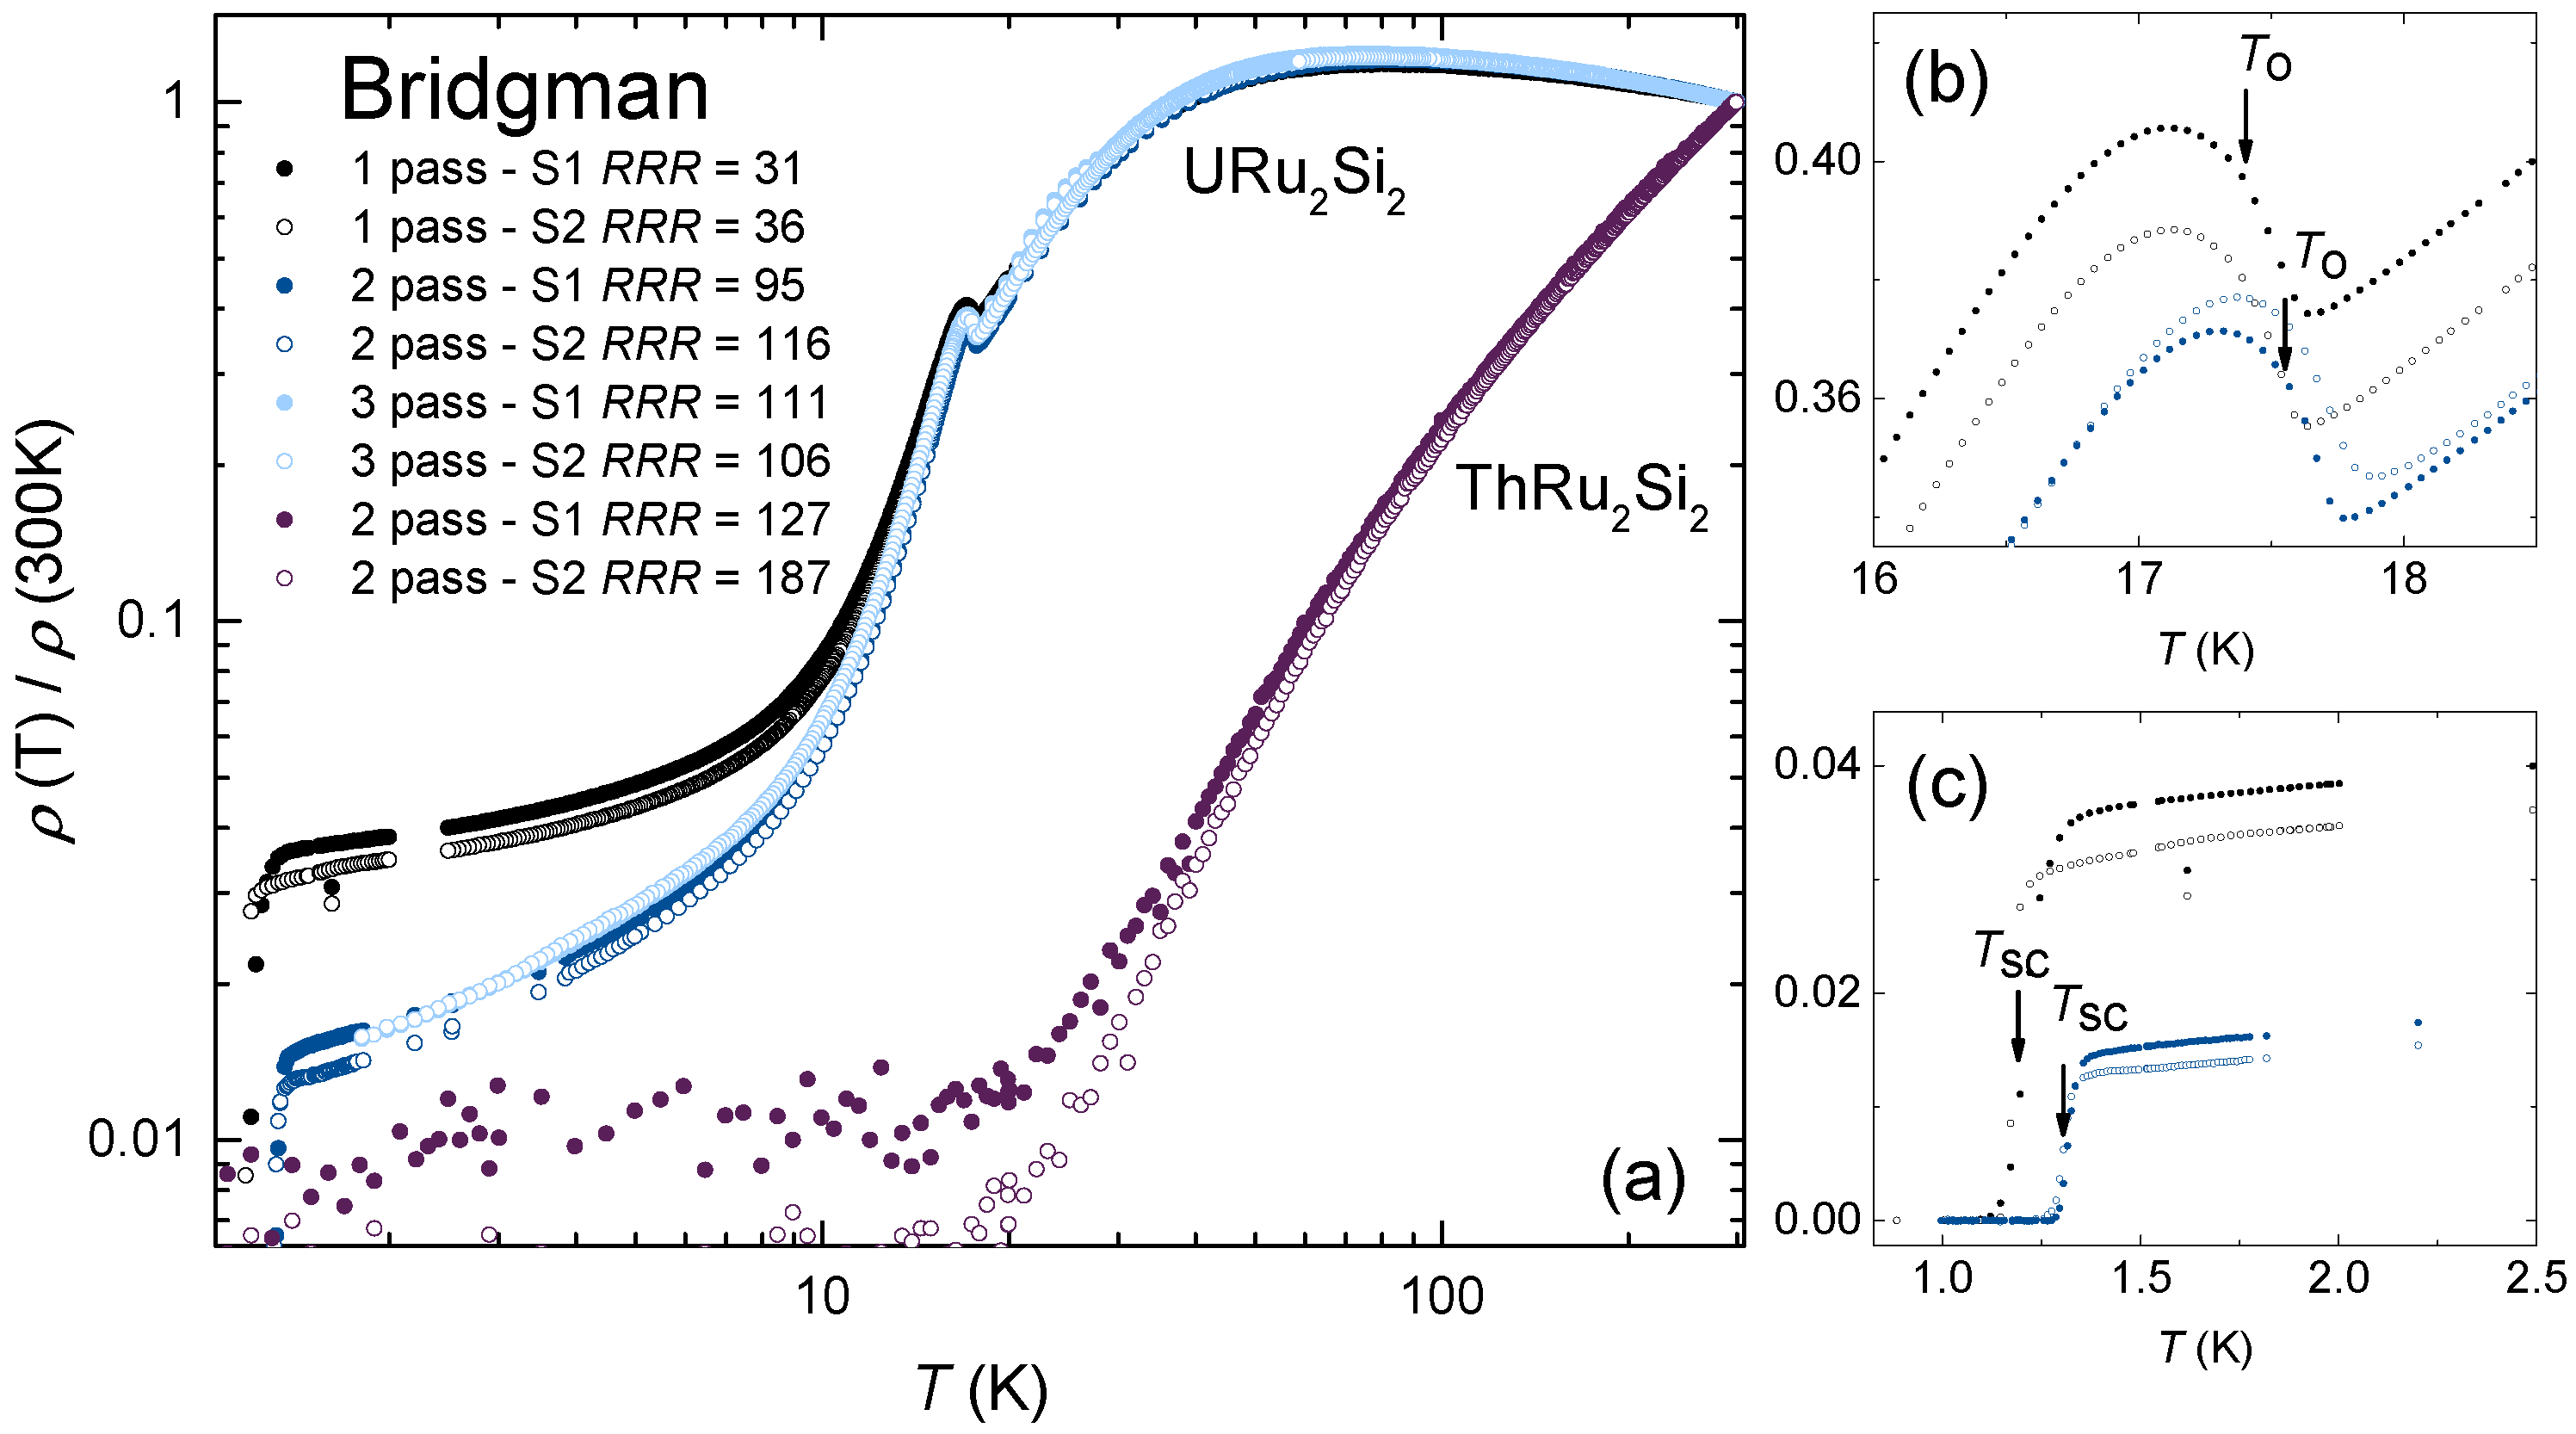
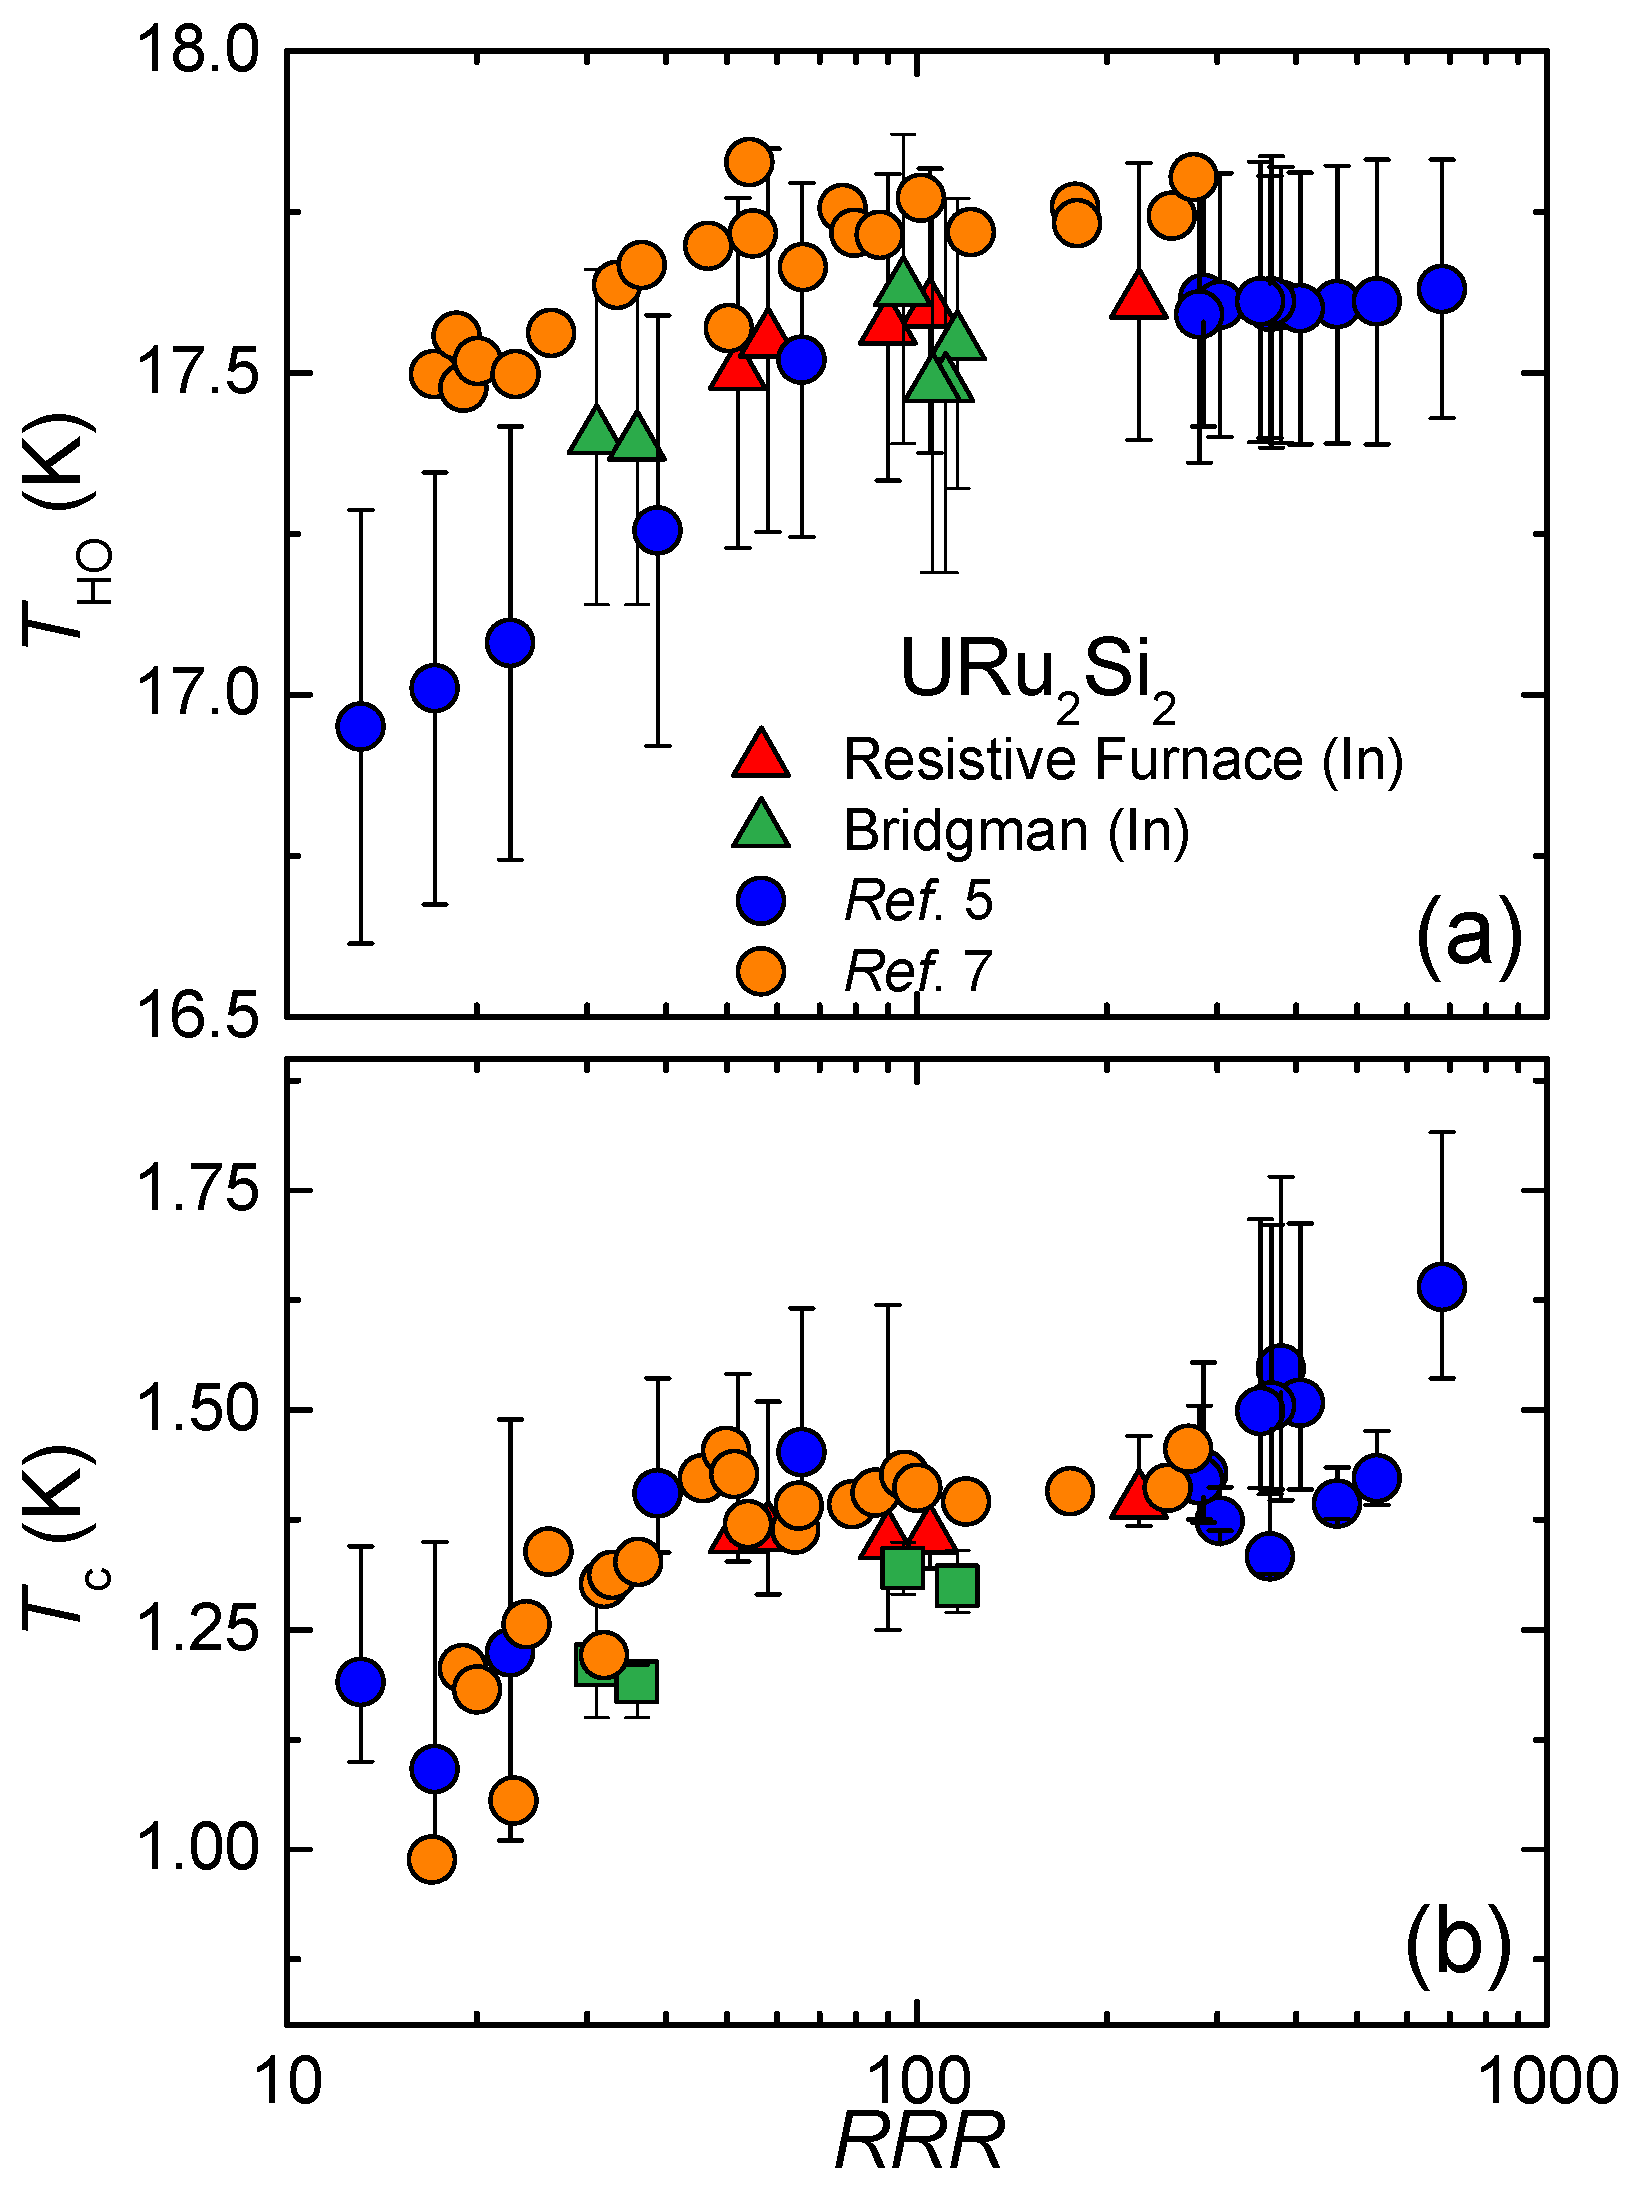
Single crystals of URu2Si2 and ThRu2Si2 were produced using a modified Bridgman growth method using the apparatus shown in Figure 1. Elemental U, Th, Ru, Si, and In were sealed in the ratio 1:2:2:22 inside a tantalum crucible using a standard arc-furnace under argon gas. This is similar to what was reported previously for molten metal flux growth of URu2Si2 in a resistive furnace [5,16]. The ampoule had an outer diameter of 1.01 cm, an inner diameter of 0.76 cm, and a length of 5 cm. The Ru, Si, and In were sourced from Alfa Aesar (metal basis) and had purities 99.95%, 99.999%, and 99.999%, respectively. The uranium was taken from a vacuum induction melted ingot that was supplied from Los Alamos National Laboratory. The thorium was taken from an unpurified rod with purity >99%. In particular, we note that the uranium was not refined using solid state electrotransport prior to use, and it is expected that it included trace impurities of iron and copper, as previously observed in similar material [25].
The ampoule was suspended from a 0.04 cm diameter tantalum wire that was attached to an alumina pull rod inside of a quartz tube in an environment of purified Ar gas. The argon pressure was maintained near one atmosphere during the growth. The coil of a 6 kW rf-furnace was wrapped around the quartz tube to provide heat during the growth. The sample was first heated to 80% of the growth temperature and held there for two hours to dissolve the starting elements into the melt, after which the power was turned off over a period of 20 min. The ampoule was subsequently lifted until 0.5 cm of its length remained in the coil and the coil power was raised such that the ampoule temperature, once fully in the coil, would be similar to that used in previous flux growth experiments ( T growth = 1400–1450 °C). Without changing the coil power or dwelling in this position, the ampoule was subsequently drawn through the coil at a rate of 0.5 cm/h until 3.5 cm of the ampoule extended out from the bottom of the coil. This process was repeated several times, depending on the batch (see Table 1). At the end of the final pull, the power was turned off over a period of twenty minutes. Cooling occurred under flowing argon. Finally, the ampoules were opened and the indium was removed by etching the resulting ingot in hydrochloric acid with a concentration near 38%. Pictures of URu2Si2 crystals produced in this way are shown in Figure 1c–e.
The crystal structure and stoichiometry were verified using single-crystal X-ray diffraction and energy dispersive spectroscopy. Magnetization M( T , H ) measurements were carried out for a mosaic of single crystals mounted in GE varnish at temperatures T = 1.8–300 K under an applied magnetic field of H = 5 kOe for H applied both parallel (∥) and perpendicular (⊥) to the c axis using a Quantum Design VSM Magnetic Property Measurement System. Electrical resistivity ρ measurements at temperatures T = 1–300 K were performed in a four-wire configuration with the electrical current applied in the ab-plane using a Quantum Design Physical Property Measurement System with a He3 insert.

3. Results

In Figure 1c–e we show URu2Si2 crystals from three different batches. The largest specimens have dimensions 2   mm × 2   mm × 0 . 04   mm , with masses near 1.25 mg. Typical masses are near 0.1–0.5 mg. We observed that the overall size and stacking along the c-axis increases with increasing number of pulls. The ThRu2Si2 crystals are smaller, with dimensions 0 . 25   mm × 0 . 25   mm × 0 . 05   mm . For most batches, 80% of the U:Ru:Si starting material was converted to single crystal specimens of URu2Si2. The batch yield for ThRu2Si2 is smaller, and an abundant secondary phase of RuIn3 also forms as separate needle-shaped crystals. Single-crystal X-ray diffraction measurements revealed the expected ThCr2Si2 type structure with lattice constants a U = 4.133 (3) Å and c U = 9.58 (1) Å and a Th = 4.189 (2) Å and c Th = 9.745 (6) Å for URu2Si2 and ThCr2Si2, respectively. These values are similar to those reported earlier [1,2,3,4,16,26]. For both materials, the direction perpendicular to the crystal surface is the c-axis, in agreement with earlier results from molten indium flux growth of URu2Si2 (Figure 1f) [16]. Energy dispersive spectroscopy (EDS) measurements further confirm the expected URu2Si2 and ThRu2Si2 stoichiometry. We note that for the URu2Si2 specimens, there is frequently a small amount of residual material that is embedded on the facet surface (Figure 1g). EDS measurements suggest that this is a mixture of Ru and Si in the ratio 1:4.
In Figure 2, we summarize magnetic susceptibility χ = M / H vs. temperature T for magnetic fields H = 5000 Oe applied parallel ∥ and perpendicular ⊥ to the c-axis for URu2Si2. χ(T) shows pronounced anisotropy where the c-axis is the easy axis, which is characteristic of the paramagnetism in URu2Si2 [3,4]. The inverse magnetic susceptibility χ−1 reveals a Curie–Weiss temperature dependence χ ( T ) = C/(Tθ), and a fit to the data yields μ eff = 3.72 μ B and θ = −90.5 K. Near T coh , Ø ≈ 55 K, χ(T) evolves through a broad hump that may be associated with the onset of Kondo coherence [1,2,3,4]. At the “hidden-order” temperature T 0 , χ(T) is abruptly reduced. All of these features are consistent with earlier results for poly- and single-crystal specimens [1,2,3,4].
Room temperature normalized electrical resistivity ρ 300 K / ρ 0 vs. T measurements are shown in Figure 3 for three different batches of URu2Si2 and a single batch of ThRu2Si2, where the only difference between these batches is the number of passes through the induction furnace hot zone (Table 1). The room temperature resistivities were ρ 300 K ≈ 450 μ Ω·cm and 100 μ Ω·cm for URu2Si2 and ThRu2Si2, respectively. For all batches, ρ ( T ) / ρ 300 K shows features that are consistent with earlier results for both materials. For URu2Si2, ρ ( T ) / ρ 300 K initially increases with decreasing T and goes through a broad maximum near T coh , æ = 75–85 K. Following T coh , æ , ρ ( T ) / ρ 300 K decreases rapidly and evolves through a sharp peak at T 0 . At low temperatures, ρ ( T ) / ρ 300 K becomes linear in temperature until the onset of superconductivity at T sc . We note that there are numerous proposals regarding the anomalous low temperature behavior of URu2Si2 [4,27], and the study of high quality single-crystal specimens is necessary to understand this behavior. ThRu2Si2 exhibits simple metallic behavior, as previously reported [26].
From Figure 3, it is evident that there is a difference in the residual resistivity ratio R R R = ρ 300 K / ρ 0 between these batches. Within a given metallic material, R R R provides an estimate of the amount of disorder, since the zero temperature resistivity ρ 0 is determined by scattering from defects such as impurities and crystal imperfections, and increases with higher occurrence of such features. Hence, a larger R R R indicates higher sample quality when comparing specimens of a given material. The differences between batches 1–3 for URu2Si2 indicate that multiple passes through the hot zone tends to improve sample quality, although R R R saturates after two pulls (Table 1). We speculate that the saturation of R R R relates to the native impurities in the starting materials which are not removed by this process. An important result that has been noted earlier is that both T 0 and T sc slightly increase with increasing R R R up to R R R ≈ 100, where they become constant [5,6,7]. The results for the samples produced using our method are consistent with this trend (Figure 4). Finally, we add that for the URu2Si2 “two-pass" batch, we have measured ρ ( T ) for ten different samples (not shown). We find that R R R varies between 95–110, revealing consistent sample quality throughout the batch.

4. Summary

We have described a modified Bridgman growth technique for the production of single crystals of the strongly correlated electron material URu2Si2 and its nonmagnetic analogue ThRu2Si2. Bulk thermodynamic and electrical transport measurements show that the properties of crystals produced in this way are comparable to those previously reported that are synthesized using the Czochralski or conventional molten metal flux growth techniques [5,6,7,16]. For our specimens, we find residual resistivity ratios R R R = ρ 300 K / ρ 0 ≈ 30–120 for URu2Si2 and 190 for ThRu2Si2. By comparison to as-cast URu2Si2 specimens grown by the Czochralski technique—where R R R typically is near 10 [28,29]—the specimens produced by our technique are of good quality. Nonetheless, it is clear that so far this technique does not produce specimens with R R R as large as that available from conventional indium flux or CZO/SSE techniques, where R R R s approaching 220 and 1000, respectively, have been reported [5,6,7]. We speculate that larger R R R might be accomplished (1) by reducing the pull rate or optimizing the temperature gradient in the hot zone; and (2) by using higher quality starting elements. In particular, it is well known that uranium contains impurities of Fe and Cu, which are significantly reduced through solid state electrotransport refining [25]. We further note that recent efforts to produce high quality ThRu2Si2 using the CZO/SSE technique yielded specimens with R R R = 120 [17]. Our specimens exhibit R R R approaching 190, which (to our knowledge) exceeds the best values for CZO/SSE specimens.
Given the difficulties associated with synthesizing high quality URu2Si2 and ThRu2Si2 using mainstream methods, we expect that the technique discussed here will accelerate progress in studies of this material by providing greater access to the good quality specimens that are required to develop our understanding of this fascinating material. Furthermore, the molten metal flux technique has the advantage that it enables chemical substitution using high vapor pressure elements. Finally, we hope that this technique will become the standard platform for the production of single-crystal specimens of other UT2X2 materials, which are still receiving strong interest. Although not reported in detail here, we have already succeeded in synthesizing UFe2Si2, UFe2Ge2, UIr2Si2, and UPt2Si2 using a molten indium flux technique, demonstrating the broad utility of this approach.

Acknowledgments

This work was performed at the National High Magnetic Field Laboratory (NHMFL), which is supported by National Science Foundation Cooperative Agreement No. DMR-0084173, the State of Florida and the DOE. A portion of this work was supported by the NHMFL User Collaboration Grant Program (UCGP).

Author Contributions

Andrew Gallagher built the crystal growth apparatus, synthesized crystals, performed chemical characterization, performed bulk transport and magnetic measurements, and contributed to writing the manuscript. William L. Nelson built the crystal growth apparatus and synthesized crystals. Kuan Wen Chen performed electrical transport measurements. Tiglet Besara and Theo Siegrist performed X-ray diffraction measurements. Ryan E. Baumbach conceived of and led the project, managed measurements, and wrote the manuscript.

Conflicts of Interest

The authors declare no conflict of interest.

References

  1. Palstra, T.T.M.; Menovsky, A.A.; van den Berg, J.; Dirkmaat, A.J.; Kes, P.H.; Nieuwenhuys, G.J.; Mydosh, J.A. Superconducting and Magnetic Transitions in the Heavy-Fermion System URu2Si2. Phys. Rev. Lett. 1985, 55, 2727. [Google Scholar] [CrossRef] [PubMed]
  2. Schlabitz, W.; Baumann, J.; Pollit, B.; Rauchschwalbe, U.; Mayer, H.M.; Ahlheim, U.; Bredl, C.D. Superconductivity and magnetic order in a strongly interacting Fermi-system: URu2Si2. Z. Phys. B 1986, 62, 171–177. [Google Scholar] [CrossRef]
  3. Maple, M.B.; Chen, J.W.; Dalichaouch, Y.; Kohara, T.; Rossel, C.; Torikachvili, M.S.; McElfresh, M.W.; Thompson, J.D. Partially gapped Fermi surface in the heavy-electron superconductor URu2Si2. Phys. Rev. Lett. 1986, 56, 185. [Google Scholar] [CrossRef] [PubMed]
  4. Mydosh, J.A.; Oppeneer, P.M. Colloquium: Hidden order, superconductivity, and magnetism: The unsolved case of URu2Si2. Rev. Mod. Phys. 2011, 83, 1301. [Google Scholar] [CrossRef]
  5. Baumbach, R.E.; Fisk, Z.; Ronning, F.; Movshovich, R.; Thompson, J.D.; Bauer, E.D. High purity specimens of URu2Si2 produced by a molten metal flux technique. Philos. Mag. 2014, 94, 3663–3671. [Google Scholar] [CrossRef]
  6. Matsuda, T.D.; Aoki, D.; Ikeda, S.; Yamamoto, E.; Haga, Y.; Ohkuni, H.; Settai, R.; Onuki, Y. Super Clean Sample of URu2Si2. J. Phys. Soc. Jpn. 2008, 77, 362–364. [Google Scholar] [CrossRef]
  7. Matsuda, T.D.; Hassinger, E.; Aoki, D.; Taufour, V.; Knebel, G.; Tateiwa, N.; Yamamoto, E.; Haga, Y.; Onuki, Y.; Fisk, Z.; et al. Details of Sample Dependence and Transport Properties of URu2Si2. J. Phys. Soc. Jpn. 2011, 80, 114710. [Google Scholar] [CrossRef]
  8. Kung, H.-H.; Baumbach, R.E.; Bauer, E.D.; Thorsmolle, V.K.; Zhang, W.-L.; Haule, K.; Mydosh, J.A.; Blumberg, G. Chirality density wave of the “hidden order” phase in URu2Si2. Science 2015, 347, 1339–1342. [Google Scholar] [CrossRef] [PubMed]
  9. Riggs, S.C.; Shapiro, M.C.; Maharaj, A.V.; Raghu, S.; Bauer, E.D.; Baumbach, R.E.; Giraldo-Gallo, P.; Wartenbe, M.; Fisher, I.R. Evidence for a nematic component to the hidden-order parameter in URu2Si2 from differential elastoresistance measurements. Nat. Commun. 2015, 6, 6425. [Google Scholar] [CrossRef] [PubMed]
  10. Yanagisawa, T.; Mombetsu, S.; Hidaka, H.; Amitsuka, H.; Akatsu, M.; Yasin, S.; Zherlitsyn, S.; Wosnitza, J.; Huang, K.; Janoschek, M.; et al. Hybridization-driven orthorhombic lattice instability in URu2Si2. Phys. Rev. B 2013, 88, 195150. [Google Scholar] [CrossRef]
  11. Schemm, E.R.; Baumbach, R.E.; Tobash, P.H.; Ronning, F.; Bauer, E.D.; Kapitulnik, A. Evidence for broken time-reversal symmetry in the superconducting phase of URu2Si2. Phys. Rev. B 2015, 91, 140506. [Google Scholar] [CrossRef]
  12. Tonegawa, S.; Kasahara, S.; Fukuda, T.; Sugimoto, K.; Yasuda, N.; Tsuruhara, Y.; Watanabe, D.; Mizukami, Y.; Haga, Y.; Matsuda, T.D.; et al. Direct observation of lattice symmetry breaking at the hidden-order transition in URu2Si2. Nat. Commun. 2014, 5, 4188. [Google Scholar] [CrossRef] [PubMed] [Green Version]
  13. Nakashima, M.; Ohkuni, H.; Inada, Y.; Settai, R.; Haga, Y.; Yamamoto, E.; Onuki, Y. The de Haas-van Alphen effect in URu2Si2 under pressure. J. Phys. Condens. Matter 2003, 15, s2011–s2014. [Google Scholar] [CrossRef]
  14. Hassinger, E.; Knebel, G.; Matsuda, T.D.; Aoki, V.; Taufour, V.; Flouquet, J. Similarity of the Fermi Surface in the Hidden Order State and in the Antiferromagnetic State of URu2Si2. Phys. Rev. Lett. 2010, 105, 216409. [Google Scholar] [CrossRef] [PubMed]
  15. Altarawneh, M.M.; Harrison, N.; Sebastian, S.E.; Balicas, L.; Tobash, P.H.; Thompson, J.D.; Ronning, F.; Bauer, E.D. Sequential Spin Polarization of the Fermi Surface Pockets in URu2Si2 and Its Implications for the Hidden Order. Phys. Rev. Lett. 2011, 106, 146403. [Google Scholar] [CrossRef] [PubMed]
  16. Gallagher, A.; Chen, K.-W.; Moir, C.M.; Cary, S.; Kametani, F.; Kikugawa, N.; Albrect-Schmitt, T.; Riggs, S.C.; Shekhter, A.; Baumbach, R.E. Unfolding the physics of URu2Si2 through Si → P substitution. Nat. Commun. 2016, 7, 10712. [Google Scholar] [CrossRef] [PubMed]
  17. Matsumoto, Y.; Haga, Y.; Tateiwa, N.; Aoki, H.; Kimura, N.; Yamamura, T.; Yamamoto, E.; Matsuda, T.D.; Fisk, Z.; Yamagami, H. Fermi Surface of ThRu2Si2 as a Reference to the Strongly Correlated Isostructural Metals Investigated by Quantum Oscillations. J. Phys. Soc. Jpn. 2016, 85, 104709. [Google Scholar] [CrossRef]
  18. Kanchanavatee, N.; Janoschek, M.; Baumbach, R.E.; Hamlin, J.J.; Zocco, D.A.; Huang, K.; Maple, M.B. Twofold enhancement of the hidden-order/large-moment antiferromagnetic phase boundary in the URu2−xFexSi2 system. Phys. Rev. B. 2011, 84, 245122. [Google Scholar] [CrossRef]
  19. Das, P.; Kanchanavatee, N.; Helton, J.S.; Huang, K.; Baumbach, R.E.; Bauer, E.D.; White, B.D.; Burnett, V.W.; Maple, M.B.; Lynn, J.W.; et al. Chemical pressure tuning of URu2Si2 via isoelectronic substitution of Ru with Fe. Phys. Rev. B. 2015, 91, 085122. [Google Scholar] [CrossRef]
  20. Yokoyama, M.; Amitsuka, H.; Itoh, S.; Kawasaki, I.; Tenya, K.; Yoshizawa, H. Neutron Scattering Study in competition between hidden order and antiferromagnetism in U(Ru1−xRhx)2Si2 (x < 0.05). J. Phys. Soc. Jpn. 2004, 73, 545–548. [Google Scholar]
  21. Kanchanavatee, N.; White, B.D.; Burnett, V.W.; Maple, M.B. Enhancement of the hidden order/large moment antiferromagnetic transition temperature in the URu2−xOsxSi2 system. Philos. Mag. 2014, 94, 3681–3690. [Google Scholar] [CrossRef]
  22. Butch, N.P.; Maple, M.B. The suppression of hidden order and the onset of ferromagnetism in URu2Si2 via Re substitution. J. Phys. Condens. Matter 2010, 22, 164204. [Google Scholar] [CrossRef] [PubMed]
  23. Dalichaouch, Y.; Maple, M.B.; Chen, J.W.; Kohara, T.; Rossel, C.; Torikachvili, M.S.; Giorgi, A.L. Effect of transition-metal substitutions on competing electronic transitions in the heavy-electron compound URu2Si2. Phys. Rev. B 1990, 41, 1829. [Google Scholar] [CrossRef]
  24. Endstra, T.; Nieuwenhuys, G.J.; Mydosh, J.A. Hybridization model for the magnetic-ordering behavior of uranium and cerium based 1:2:2 intermetallic compounds. Phys. Rev. B 1993, 48, 9595. [Google Scholar] [CrossRef]
  25. Haga, Y.; Honma, T.; Yamamoto, E.; Ohkuni, H.; Onuki, Y.; Ito, M.; Kimura, N. Purification of Uranium Metal using the Solid State Electrotransport Method under Ultrahigh Vacuum. Jpn. Soc. Appl. Phys. 1998, 37, 6A. [Google Scholar] [CrossRef]
  26. Emi, N.; Hamabata, R.; Nakayama, D.; Miki, T.; Koyama, T.; Ueda, K.; Mito, T.; Kohori, Y.; Matsumoto, Y.; Haga, Y.; et al. Magnetic and Electronic Properties of URu2Si2 Revealed by Comparison with Nonmagnetic References ThRu2Si2 and LaRu2Si2. J. Phys. Soc. Jpn. 2015, 84, 063702. [Google Scholar] [CrossRef]
  27. Mydosh, J.A.; Oppeneer, P.M. Hidden order Behaviour in URu2Si2. Philos. Mag. 2014, 94, 3642. [Google Scholar] [CrossRef]
  28. Palstra, T.T.M.; Menovsky, A.A.; Mydosh, J.A. Anisotropic electrical resistivity of the magnetic heavy fermion superconductor URu2Si2. Phys. Rev. B 1986, 33, 6527. [Google Scholar] [CrossRef]
  29. Menovsky, A.A.; Gortenmulder, T.J.; Tan, H.J.; Palstra, T.T.M. Crystal growth and characterization of MT2Si2 ternary intermetallics (M = U, RE and T = 3d, 4d, 5d transition metals). J. Cryst. Growth 1986, 79, 316–321. [Google Scholar] [CrossRef]
Figure 1. (a) Bridgman crystal growth apparatus showing the inert gas growth chamber, rf-heating coil, tantalum ampoule, pull rod, and crystal puller; (b) Schematic of the Bridgman crystal growth apparatus; (ce) Images of representative crystals of URu 2 Si 2 that were produced using different numbers of passes through the hot zone; (f) Rocking curve for a single crystal of URu 2 Si 2 , showing that the direction perpendicular to the crystalline plate is the c-axis; (g) SEM image of a typical URu 2 Si 2 specimen. The surface impurity phase is indicated.
Crystals 06 00128 g001
Figure 2. (left axis) Magnetic susceptibility χ = M / H vs. temperature T for magnetic field H = 5 kOe applied parallel ∥ and perpendicular ⊥ to the c-axis. (right axis) Inverse magnetic susceptibility χ - 1 vs. T in the paramagnetic region for URu 2 Si 2 showing Curie–Weiss behavior. (inset) χ(T) in the region near the hidden order transition.
Crystals 06 00128 g002
Figure 3. (a) Electrical resistivity ρ normalized to the value at room temperature ρ 300 K vs. temperature T for several specimens from two different batches. The typical room temperature resistivities are ρ 300 K ≈ 450 μ Ω·cm and 100 μ Ω·cm for URu 2 Si 2 and ThRu 2 Si 2 , respectively. Differences in growth parameters for the batches are shown in Table 1; (b) ρ 300 K / ρ 0 vs. T near the hidden order transition T 0 . The width of the transition is defined from the minimum (onset of kink) to the peak, with the midpoint indicated by the arrow; (c) ρ/ ρ 300 K vs. T near the superconducting transition. The width of the transition is defined as onset and termination of the step, with the midpoint indicated by the arrow.
Crystals 06 00128 g003
Figure 4. Comparison between URu 2 Si 2 crystals grown by the two-step Czochralski/zone-refining (as performed by two different groups) [5,6,7], molten indium flux [5,16], and those that were produced using the modified Bridgman growth discussed here. (a) Dependence of the hidden order transition temperature T 0 on the residual resistivity ratio R R R = ρ 300 K / ρ 0 , where R R R is defined in the main text. The bars represent the transition width as defined in Figure 3. Note that R R R is presented on a logarithmic scale. (b) The superconducting transition temperature T c vs. R R R . The bars represent the transition width.
Crystals 06 00128 g004
Table 1. Growth parameters and characteristics of two representative samples from each batch. Includes the number of times the sample was passed through the hot zone, the residual resistivity ratio R R R = ρ 300 K / ρ 0 (where ρ 300 K is the room temperature resistivity and ρ 0 is the extrapolated zero temperature resistivity), the hidden order temperature T 0 , and the superconducting transition temperature T sc . For the URu 2 Si 2 “two-pass" batch, we have measured ρ ( T ) for ten different samples (not shown). We find that R R R varies between 95–110, revealing consistent sample quality thoughout the batch.
CompoundPassesSample RRR T 0 (K) T sc (K)
URu 2 Si 2 1S13117.401.21
URu 2 Si 2 1S23617.391.19
URu 2 Si 2 2S19517.551.3
URu 2 Si 2 2S211617.631.32
URu 2 Si 2 3S111117.48
URu 2 Si 2 3S210617.48
ThRu 2 Si 2 2S1127
ThRu 2 Si 2 2S2187

