Article

Crystal Structures, Thermal Analysis, and Dissolution Behavior of New Solid Forms of the Antiviral Drug Arbidol with Dicarboxylic Acids

by
Alex N. Manin
1,
Artem O. Surov
1,2,
Andrei V. Churakov
3 and
German L. Perlovich
1,2,*
1
Department of Physical Chemistry of Drugs, Institution of Russian Academy of Sciences, G.A. Krestov Institute of Solution Chemistry of the Russian Academy of Sciences, Ivanovo 153045, Russia
2
Department of Chemistry, Lomonosov Moscow State University, 1-3 Leninskiye gory, Moscow 119991, Russia
3
Department of Crystal Chemistry and X-ray Diffraction Analysis, Kurnakov Institute of General and Inorganic Chemistry of the Russian Academy of Sciences, Leninskii Prospekt 31, Moscow 119991, Russia
*
Author to whom correspondence should be addressed.
Crystals 2015, 5(4), 650-669; https://doi.org/10.3390/cryst5040650
Submission received: 27 October 2015 / Revised: 20 November 2015 / Accepted: 1 December 2015 / Published: 4 December 2015
(This article belongs to the Special Issue Pharmaceutical Cocrystals)

Abstract

:
Salts of the antiviral drug arbidol (umifenovir) (Arb) with maleate (Mlc) and fumarate (Fum) anions have been obtained, and their crystal structures have been described. The crystal structure of arbidol maleate has been redetermined by single crystal X-ray diffraction at 180K. A new arbidol cocrystal in zwitterion form with succinic acid (Suc) has also been found and characterized. The arbidol zwitterion was not previously seen in any of the drug crystal forms, and the [Arb + Suc] cocrystal seems to be the first found instance. Analysis of the conformational preferences of the arbidol molecule in the crystal structures has shown that it adopts two types of conformations, namely “open” and “closed” ones. Thermal stability of the arbidol salts and cocrystal have been analyzed by means of differential scanning calorimetry, thermogravimetric, and mass-spectrometry analysis. The dissolution study of the arbidol salts and cocrystal performed in aqueous buffer solutions with pH 1.2 and 6.8 has shown that both the salts and the cocrystal dissolve incongruently to form an arbidol hydrochloride monohydrate at pH 1.2 and an arbidol base at pH 6.8, respectively. The cocrystal reaches the highest solubility level in both pH 1.2 and pH 6.8 solutions.

1. Introduction

Searching for the optimal method of active pharmaceutical ingredient (API) delivery is an important stage in pharmaceutical drug development. Most APIs are solids under standard conditions and are delivered in tablet form. The efficacy of a drug compound depends on the crystal form of API. There are several methods of API modification aimed at optimizing its physicochemical properties through crystal engineering [1,2]. Searching for polymorphs, hydrates, solvates, cocrystals, and salts are the most popular ways to improve pharmaceutically significant properties of drugs [3].
Salt formation often leads to a substantial improvement of API properties, such as solubility, stability, and others. Despite the fact that the usefulness of the salts is sometimes limited because of their tendency towards hygroscopicity due to the ionic nature of the crystal, salt formation is currently the most common method of improving the solubility, and today more than 50% of APIs are sold in the form of salts [4,5]. At the same time, it has been estimated that about half of the known cationic drugs are marketed as hydrochloride salts [6]. However, hydrochloride salts can have some undesirable qualities, such as a decreased solubility in the stomach due to common ion effects with physiologically occurring chloride ions. In contrast, cocrystals have recently become more popular due to their inherent stability and ability to significantly improve the solubility of APIs [7,8,9].
Arbidol (or umifenovir) (1-methyl-2-phenylthiomethyl-3-carbethoxy-4-dimetylaminomethyl-5-hydroxy-6-bromoindole) is a Russian-made indole-derivative molecule with antiviral activity [10,11] and immunomodulatory effect (Figure 1) [12,13]. Arbidol activity results from its ability to inhibit fusion of a virus lipid envelope with endosome membranes located within the cell. The antiviral efficacy of arbidol is comparable to that of some other well-known antiviral drugs, such as rimantadin (Roflual®), oseltamivir (Tamiflu®), and ribavirin [14,15,16]. One of the advantages of arbidol compared to other antiviral drugs is that arbidol belongs to the category of the least toxic drugs (LD50 > 4g/kg), which do not have adverse effects on the human body when taken orally at the recommended dosage [17,18].
However, the main problem of arbidol usage is its low solubility. Arbidol (Arb) as a free base is particularly insoluble in water. It is known that in order to maintain the concentration of active substance in the blood above the therapeutic threshold, arbidol should be taken by one dose every 3–4 h for several days, including night time, which makes effective treatment more difficult [19]. Therefore, researchers are still trying to find a new crystal form of Arb with improved solubility parameters [20,21,22].
Arb has different types of functional groups, such as a hydroxyl group, an amino group, and others, which can form a number of possible hydrogen bond synthons. However, it has been shown that in arbidol salts, there are two most common types of hydrogen bonds, forming R 2 2 ( 10 ) graph set supramolecular synthons [21]. In our previous work, salts of the antiviral drug arbidol with pharmaceutically relevant benzoate and salicylate anions have been obtained [23]. The R 2 2 ( 10 ) graph set supramolecular synthon was observed in both salts. Dicarboxylic acids were chosen as potential cocrystal or salt formers in the study because many of these acids are considered pharmaceutically acceptable and safe [24,25]. Besides, it was interesting to estimate the influence of the structural isomerism of co-formers on salt/cocrystal formation. Therefore, arbidol reacted with a series of dicarboxylic acid isomers: maleic (Mlc), fumaric (Fum), and succinic (Suc) acids (Figure 1). All the co-formers produced new crystal forms. The crystal structure of [Arb + Mlc] was previously solved by single crystal X-ray diffraction at 298 K [22]. We redetermined the salt form by single crystal X-ray diffraction at 180 K.
Figure 1. Molecular structures of arbidol, maleic, fumaric and succinic acids used in this work. The flexible torsion angles in the arbidol molecule are numbered and are indicated by τ1, τ2, τ3 and τ4.
Crystals 05 00650 g001
Herein, we report the preparation of two salts and one cocrystal with three dicarboxylic acids: arbidol-maleate salt (1:1), arbidol-fumarate salt (2:1), and arbidol-succinic acid cocrystal (1:1) with arbidol in its zwitterionic form. This paper focuses on the physicochemical properties of maleate, hemifumarate and succinic acid cocrystal, as compared to Arb free base and its hydrochloride monohydrate ([Arb + HCl + H2O]). Since the variation of pH in the stomach and digestive tract (1.2–6.8) [26] may cause changes in the physicochemical properties of neutral/zwitterionic drugs, such as solubility, stability, and permeability, we decided to study the solubility of salts and cocrystal in buffer with pH 1.2 and 6.8.

2. Results and Discussion

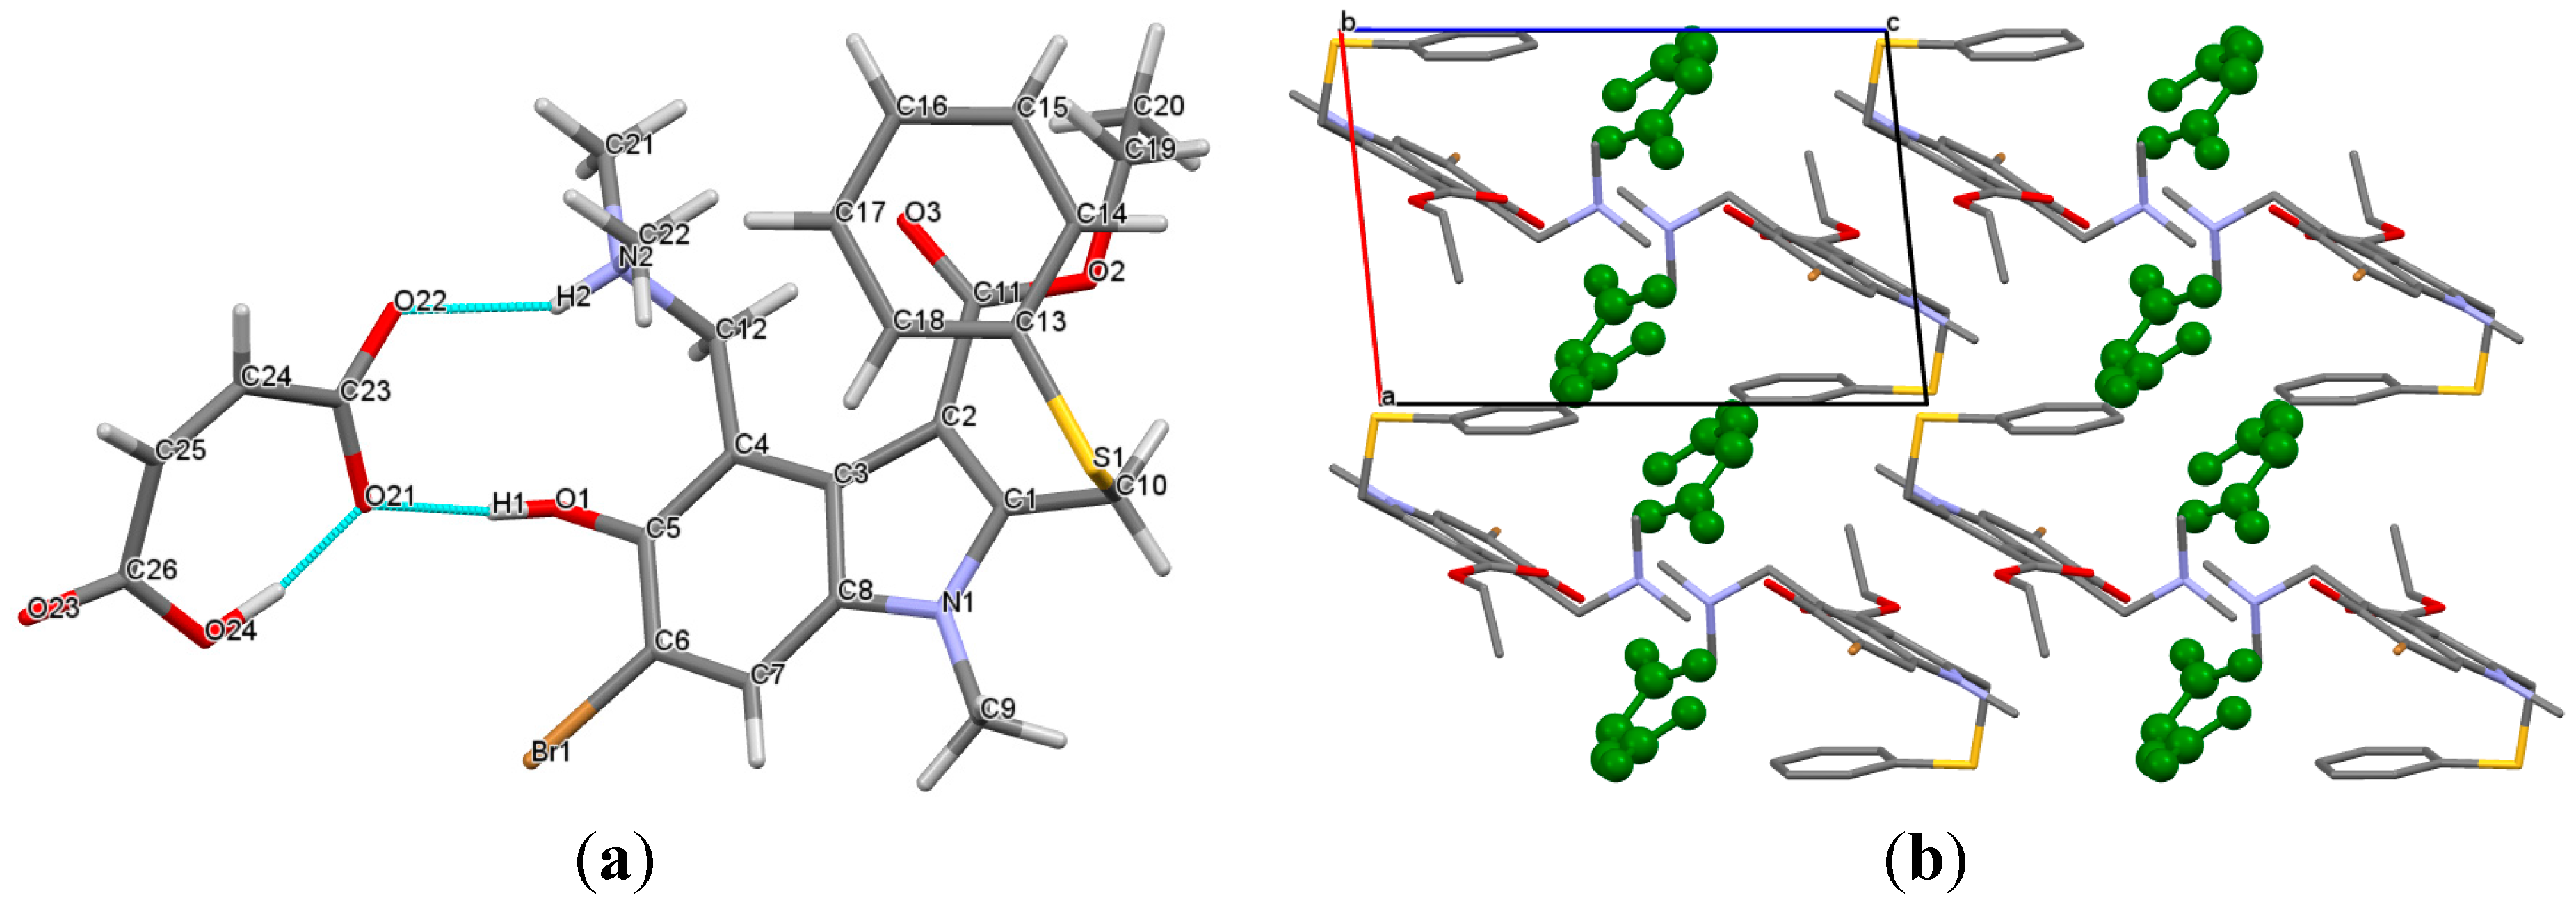
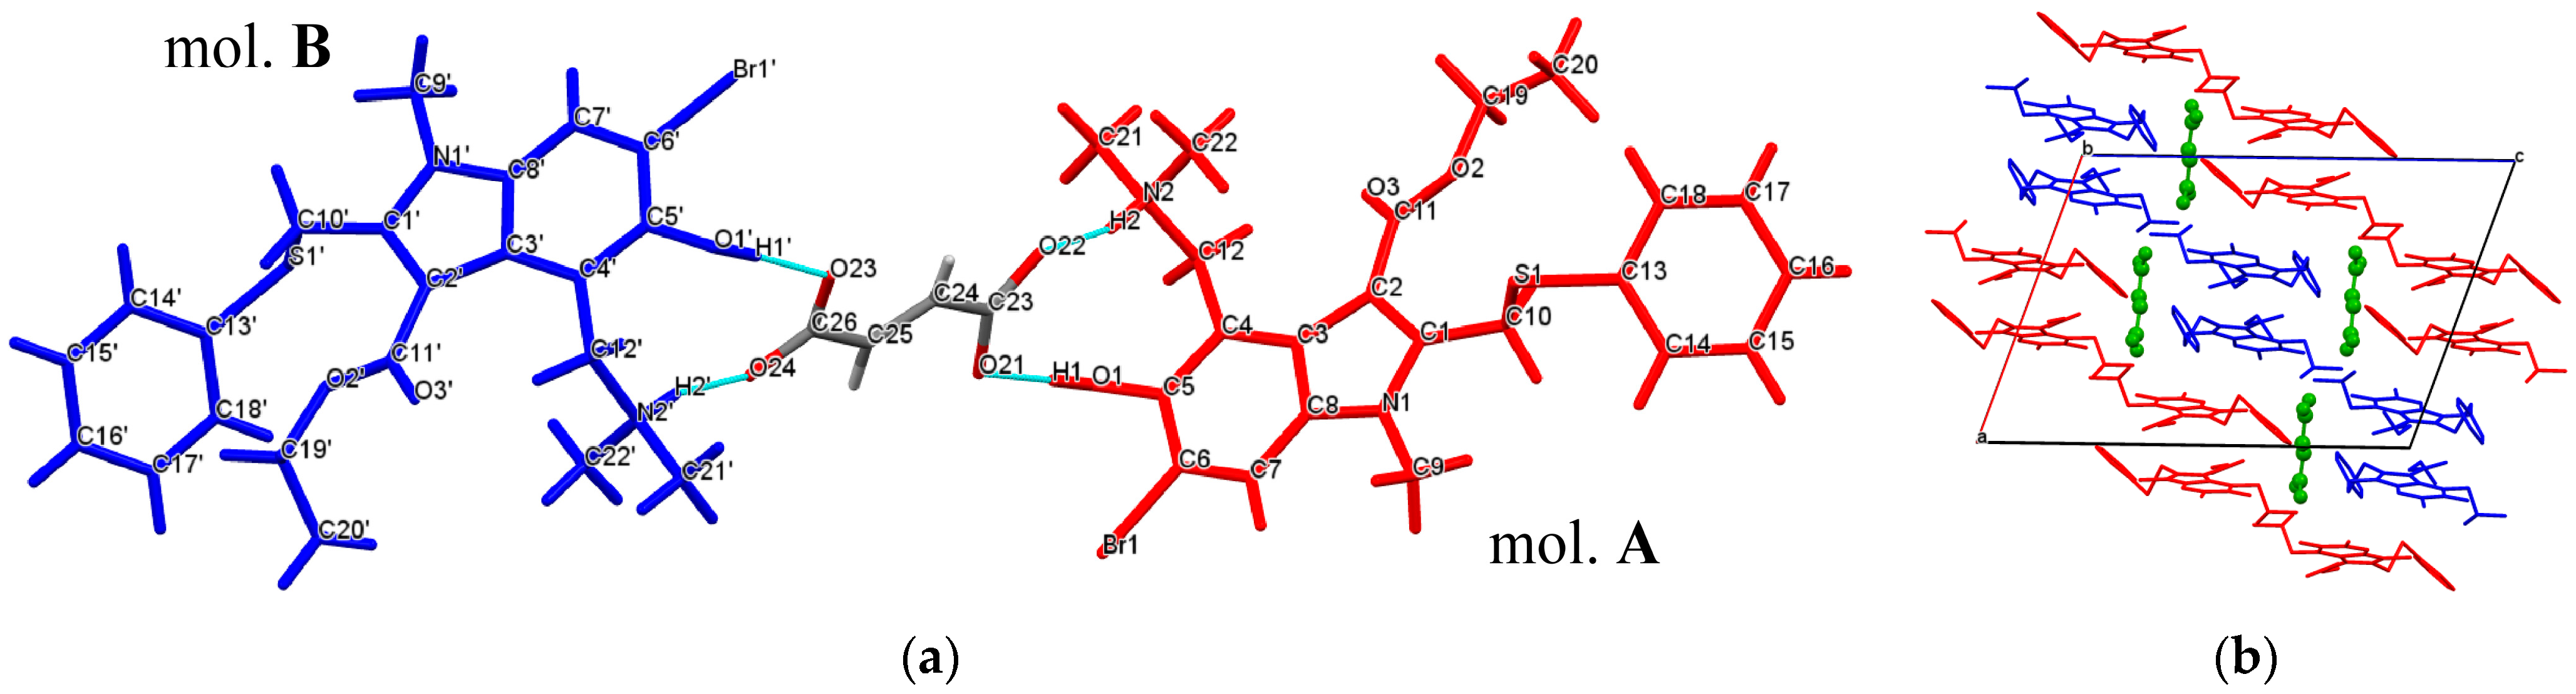
2.1. Crystal Structures
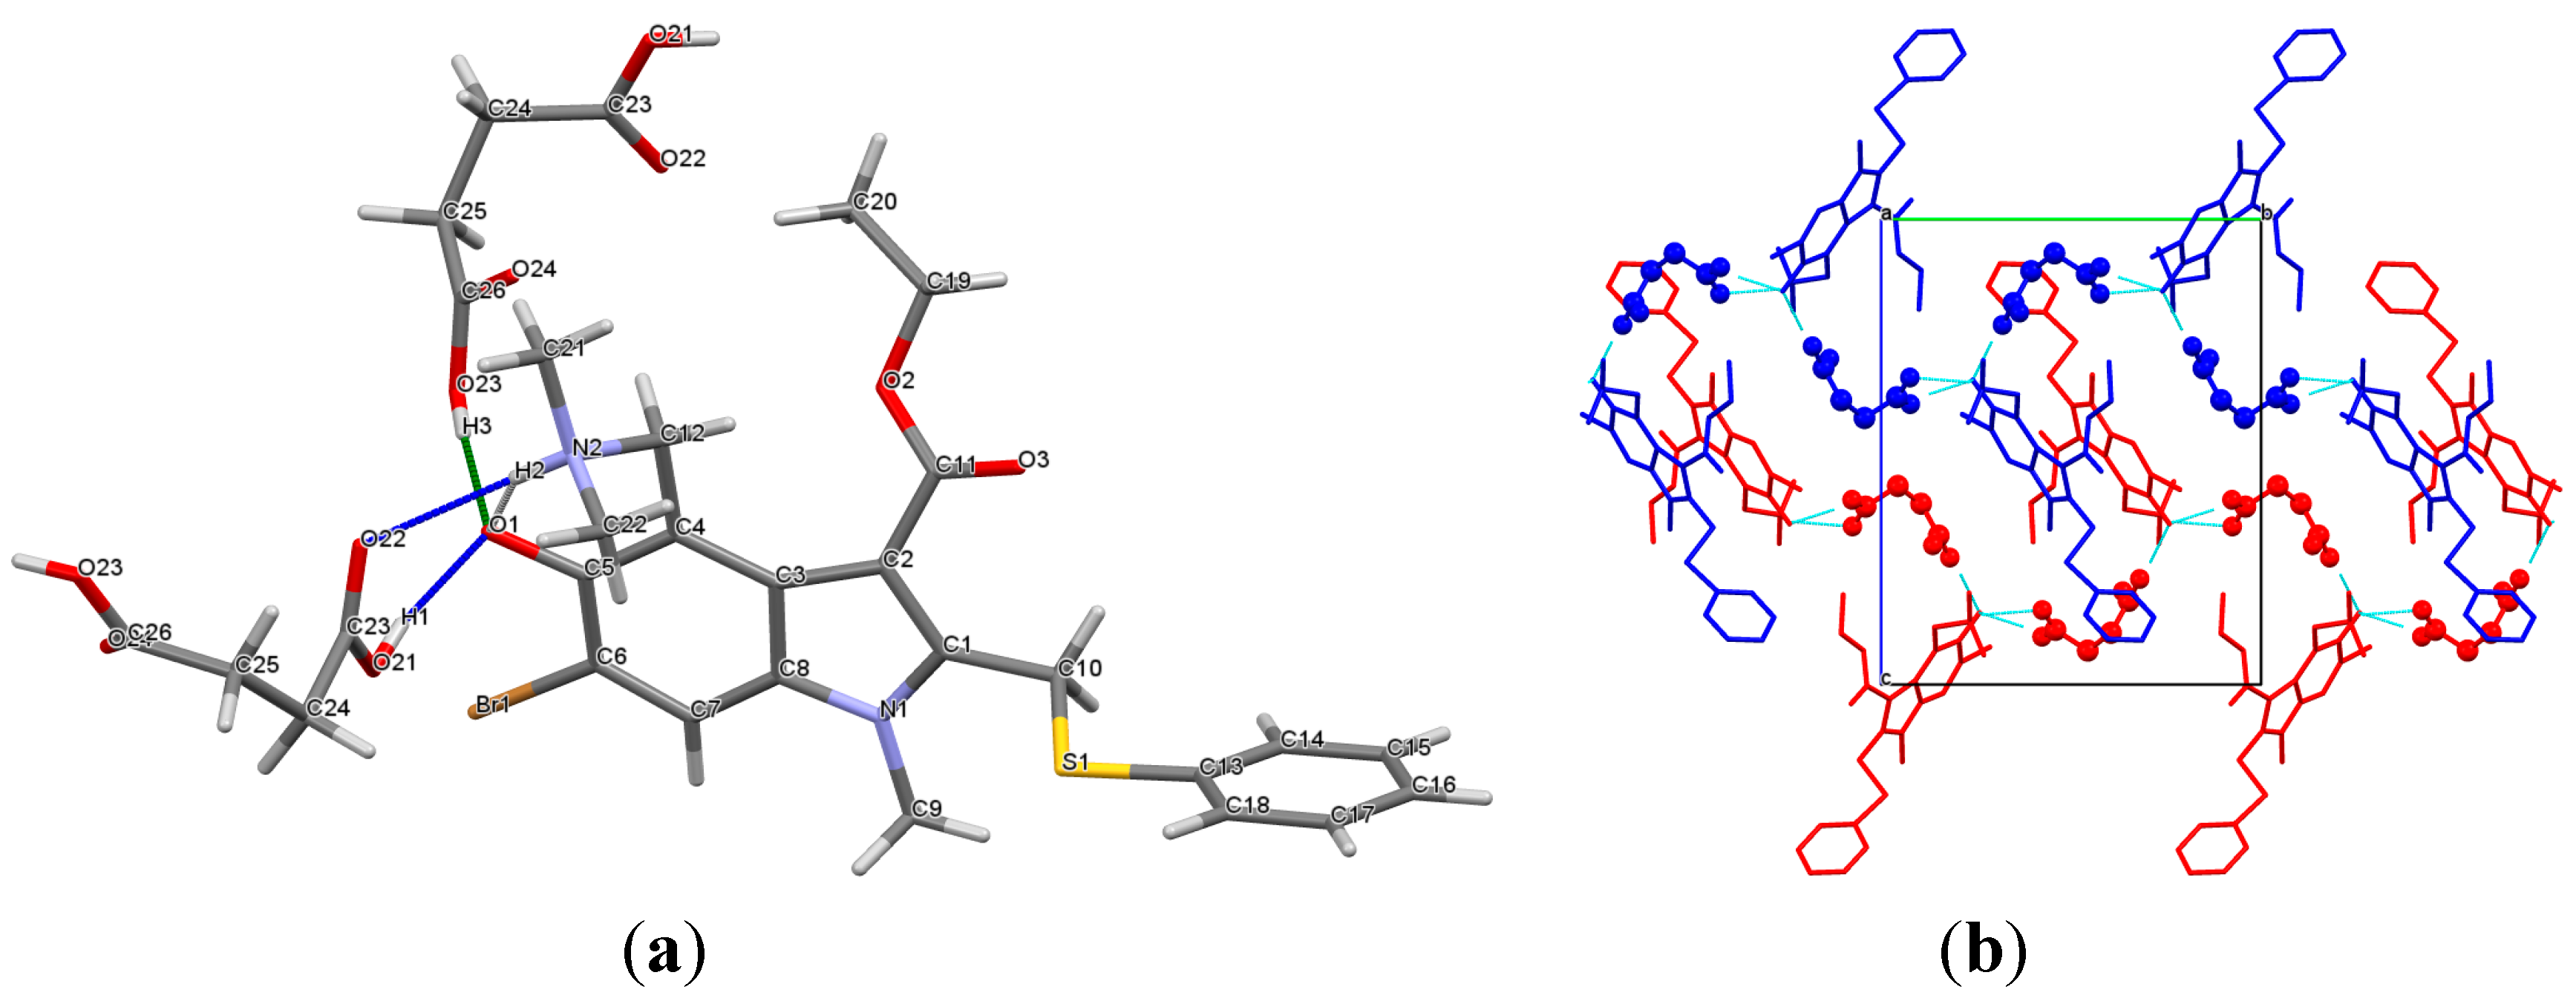
Arbidol is a relatively strong base with the pKa value equaling 6.0 (for the dimethylamino group) [27]. It is widely accepted in the literature that whether an API and a guest molecule form a salt or cocrystal can be predicted in terms of the ∆pKa rule (ΔpKa = pKa(base) − pKa(acid)) [28,29,30]. When the ΔpKa is greater than 4, the components tend to form a salt. If ΔpKa ≤ −1, a cocrystal is likely to be formed. In the ΔpKa range between −1 and 4, however, the ionization state of molecules in a crystal remains unpredictable. The difference between pKa of arbidol and first ionization constants of maleic acid (pKa,1 = 1.9; pKa,2 = 6.1) is equal to 4.1, which suggests proton transfer and salt formation. For the arbidol with fumaric acid (pKa = 3.0; pKa,2 = 4.4) and succinic acid (pKa,1 = 4.2; pKa,2 = 5.6) pairs, the ΔpKa values are found to be 3.0 and 1.8, respectively, which are inside the range of the salt−cocrystal continuum.
Crystallographic data are summarized in Table 1, and the molecular packing arrangements in the crystal forms are shown in Figure 2, Figure 3 and Figure 4 (asymmetric units with displacement ellipsoids are shown in Figure S1).
Table 1. Crystallographic data for arbidol multicomponent crystals. Arb: Arbidol; Mlc: Maleic acid; Fum: Fumaric acid; Suc: Succinic acid.
Compound Reference[Arb+Mlc] (1:1)[Arb+Fum] (2:1)[Arb+Suc] (1:1)
Chemical formulaC22H26BrN2O3S·C4H3O42(C22H26BrN2O3S)·C4H2O4C22H25BrN2O3S·C4H6O4
Formula Mass593.481070.89595.50
Crystal systemTriclinicMonoclinicMonoclinic
a8.3812(12)15.9728(12)10.4180(11)
b13.0305(18)14.0080(10)14.7052(15)
c13.2656(19)22.8933(17)17.8673(18)
α64.054(2)90.0090.00
β83.078(2)109.716(1)99.129(2)
γ86.643(2)90.0090.00
Unit cell volume/Å31293.2(3)4822.0(6)2702.6(5)
Temperature/K180(2)183(2)180(2)
Space groupP Ï P21/nP21/n
Z244
No. of reflections measured123864926525637
No. of independent reflections5634116385895
Rint0.02760.03140.0448
Final R1 values (I > 2σ(I))0.03370.03170.0303
Final wR2(F2) values (I > 2σ(I))0.07590.07150.0696
Final R1 values (all data)0.04770.05070.0419
Final wR2(F2) values (all data)0.08040.07860.0735
Goodness of fit on F21.0711.0111.055
Largest diff. peak & hole, e·Å−30.523/−0.3050.519/−0.4940.342/−0.290
CCDC number143301814330171433016
As expected, arbidol and maleic acid form a salt, which crystallizes in the triclinic Pī space group with one arbidol cation and one maleate anion in the asymmetric unit. The structure is in good agreement with that reported by Orola et al., who, however, collected diffraction data at 293 K [22]. In this work, single-crystal X-ray experiment was carried out at low temperature (180 K), and the crystal structure of the [Arb + Mlc] salt was refined. Figure 2a shows that the arbidol and maleate ions are connected by two different types of hydrogen bonds, i.e., the charge-assisted N2+–H2···O22 and conventional O1–H1···O21 H-bonds, to form a discrete dimeric unit with R 2 2 ( 10 ) graph set notation [31,32]. The packing arrangement of the Arb molecules in the crystal can be described as alternating layers containing the π-stacks of the indole moieties (3.449 Å) and phenyl rings. The latter form planar layers extended along the (100) planes (Figure 2b). The maleate ions are located between the adjacent Arb units to form layers in the (011) planes.
Figure 2. (a) Hydrogen bonded molecular unit in the [Arb + Mlc] crystal; (b) molecular packing projections for [Arb + Mlc]. Maleic acid molecules are colored in green. H atoms are omitted.
Crystals 05 00650 g002
The asymmetric unit of the [Arb + Fum] salt contains one fumarate anion and two conformationally distinct cations of arbidol (mol. A and mol. B) (Figure 3a). Each fumarate ion accepts complementary N2+–H2···O22 (N2ʹ+–H2ʹ···O24) and O1–H1···O21 (O1ʹ–H1ʹ···O23) hydrogen bonds from two Arb ions, constructing a trimeric unit assembled via R 2 2 ( 10 ) motives. It should be noted that the carboxylic groups of fumaric acid in the salt are found to be fully deprotonated, despite the fact that the second acidity of the acid is appreciably weaker than the first one, and the ΔpKa is less than three. In the [Arb + Fum] crystal, the Arb molecules are arranged into layers of symmetry-inequivalent molecules, so that each layer contains the molecules of one conformation only. Inside the layer, the Arb species are generally held by π-π interactions between the indole fragments (3.521 Å and 3.411 Å), while the neighboring layers are linked to each other through the hydrogen bonded fumarate ions (Figure 3b).
The crystal structure of 1:1 arbidol and succinic acid ([Arb + Suc]) is interesting, both chemically and crystallographically. This crystalline complex should be attributed to a cocrystal rather than a salt. Indeed, in the crystal, the Arb molecule is found to be in its zwitterionic form, while an intermolecular charge transfer between the components does not occur. To the best of our knowledge, the Arb zwitterion has not been previously seen in any of the drug crystal forms, and the [Arb + Suc] cocrystal seems to be the first found instance. Cocrystals with zwitterionic co-formers have been reported in the literature, and the most numerous examples can be found among amino acids [33]. Multicomponent crystals containing zwitterionic API molecule and neutral co-former are less frequent, but also known and described [34,35,36,37].
The formation of the Arb zwitterion is associated with an intramolecular proton transfer from the hydroxy-group to the dimethylamino fragment to form an S(6) H-bonded ring. Being released from the proton, the carbonyl O1 atom accepts two O21–H1…O1 and O23–H3…O1 hydrogen bonds from the neighboring molecules of succinic acid (Figure 4a). Meanwhile, the quaternary nitrogen atom (N2) acts as an H-bond donor, which is responsible for the R 2 2 ( 10 ) ring motive formation between the Arb and succinic acid molecules. In the [Arb + Suc] cocrystal, the hydrogen bond network between the components is extended along the b-axis to form a ribbon-like structure, assembled via the C(9) H-bond motives (Figure 4b). The neighboring ribbons are held on account of π-π contacts and other weak van der Waals interactions.
Figure 3. (a) Hydrogen bonded trimeric molecular unit in the [Arb + Fum] crystal, A and B denote two conformationally distinct cations of arbidol; (b) packing organization of [Arb + Fum]. The layers of conformationally distinct Arb molecules are shown in red and blue colors. Fumaric acid molecules are colored in green. H atoms are omitted.
Crystals 05 00650 g003
Figure 4. (a) Hydrogen-bonded molecular unit in the [Arb + Suc] crystal; (b) molecular packing arrangement of the [Arb + Suc] crystal. The neighboring ribbons of the H-bonded Arb and Suc molecules are colored in red and blue. H atoms are omitted.
Crystals 05 00650 g004

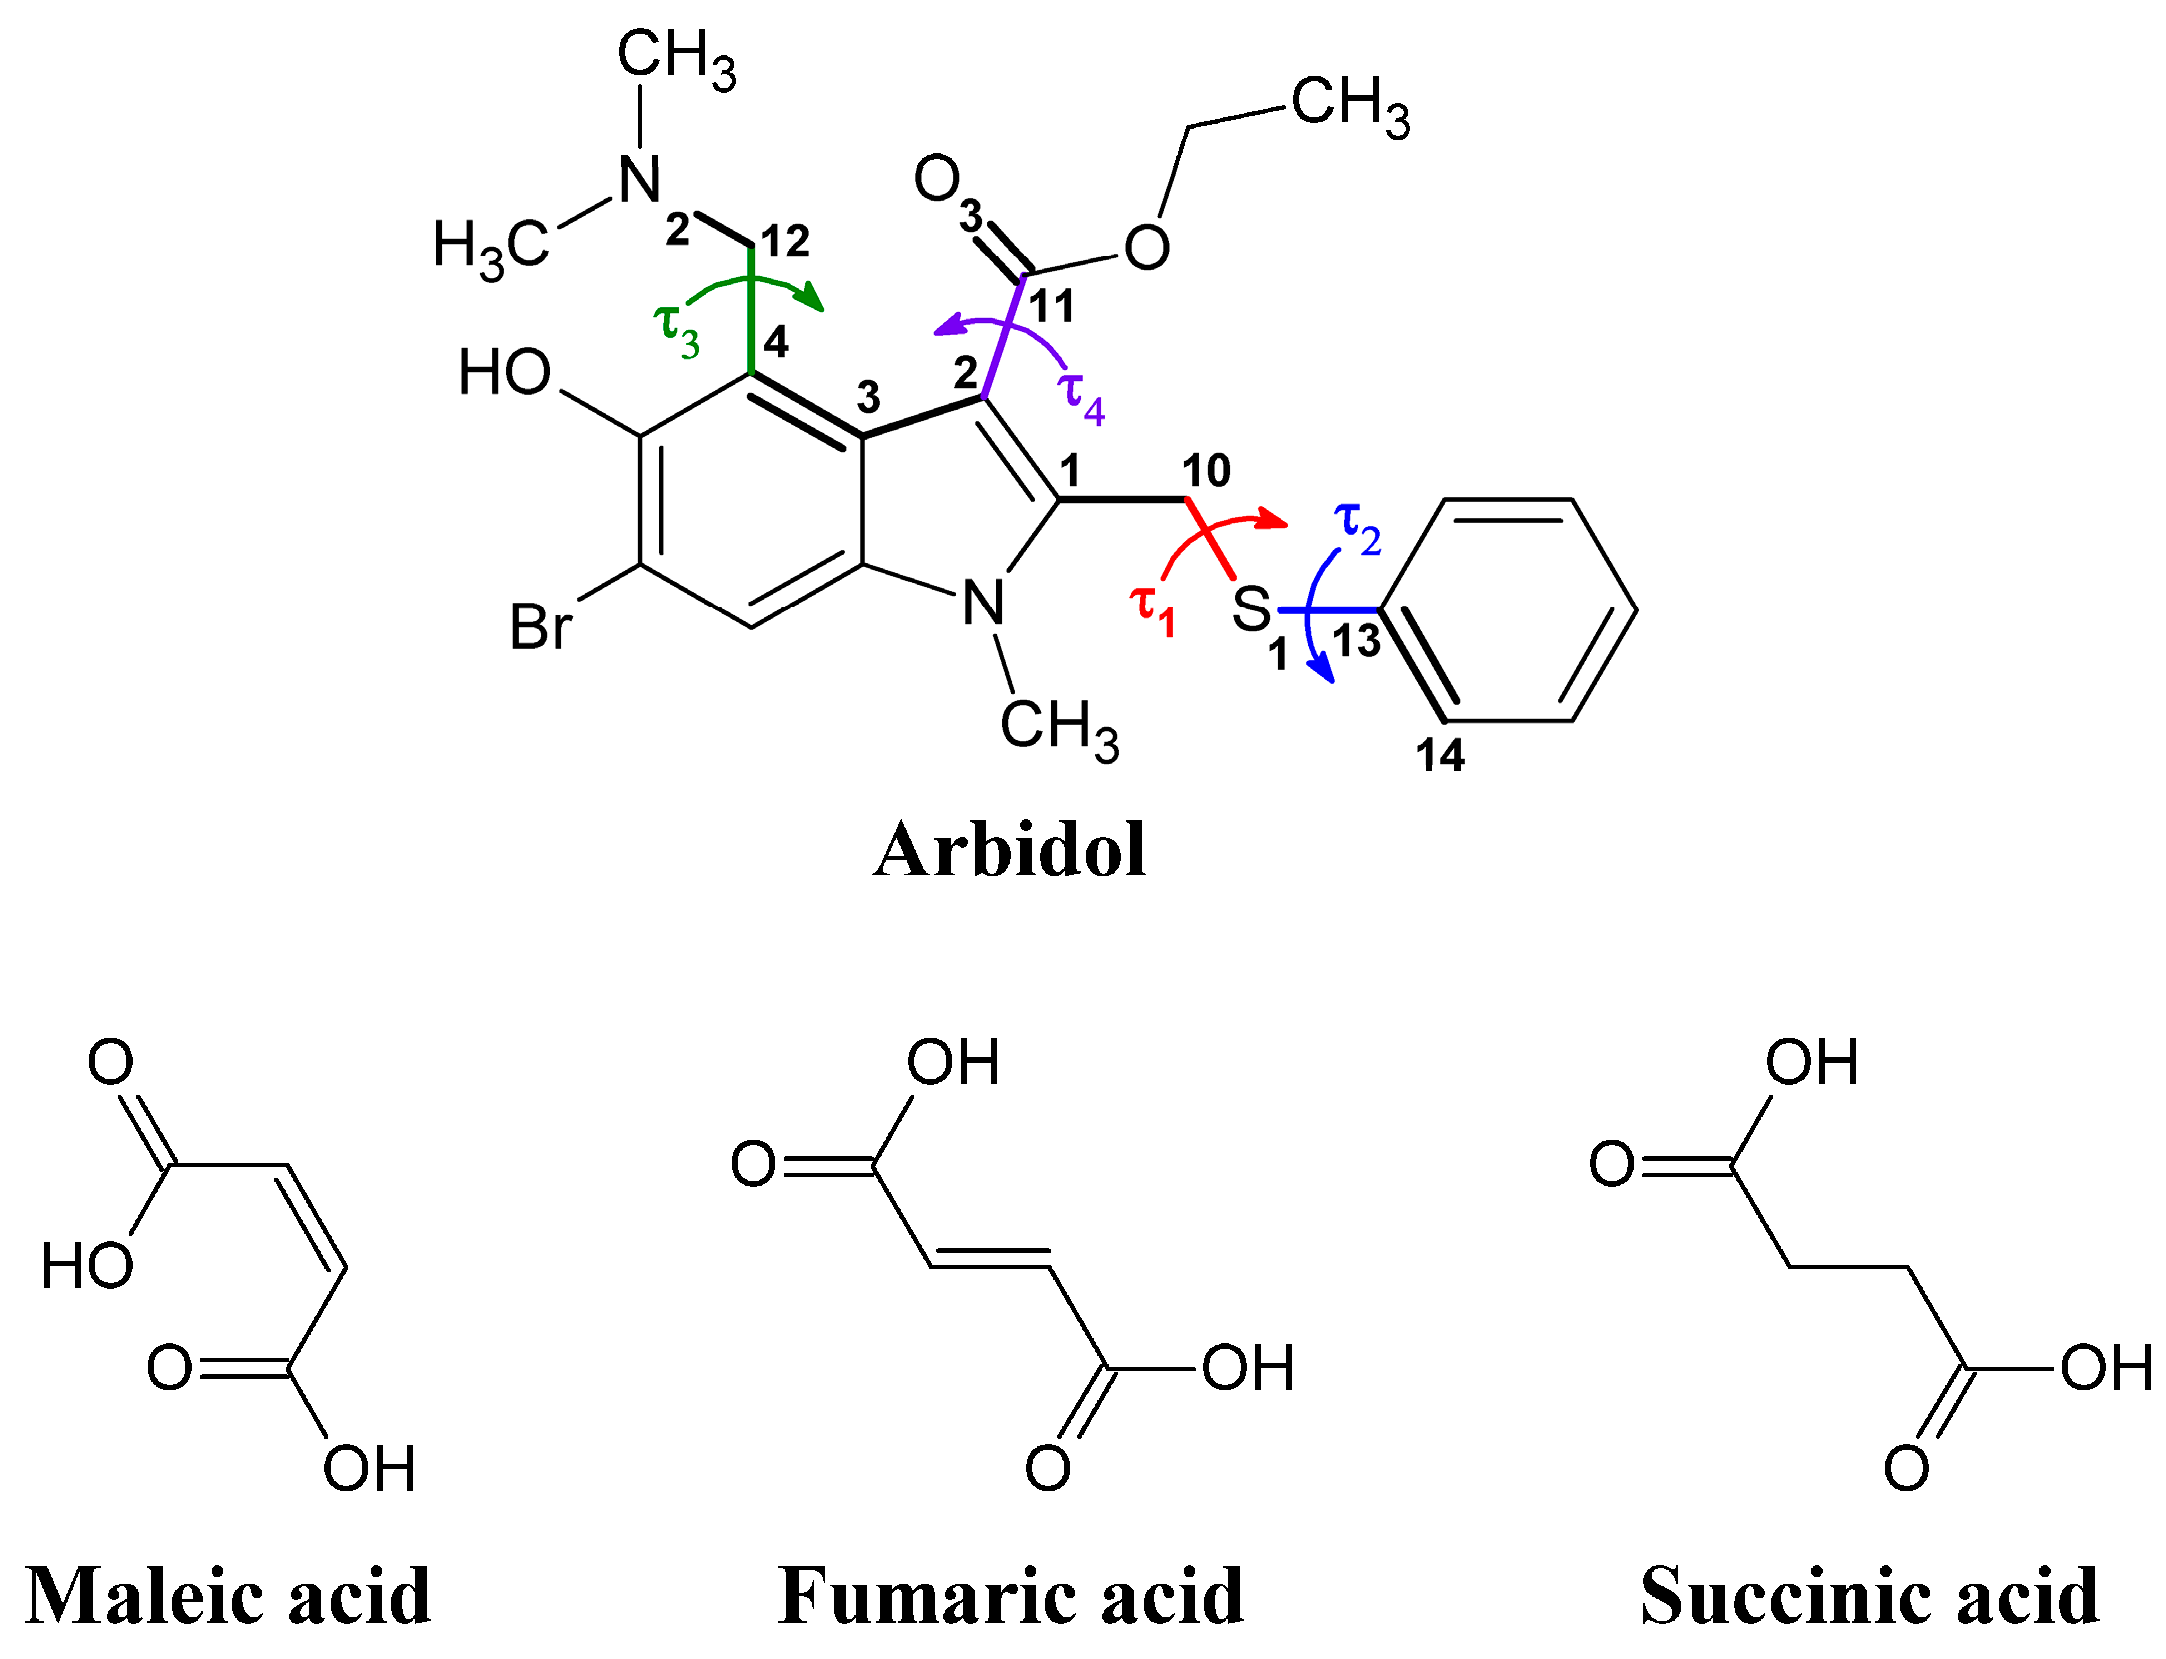
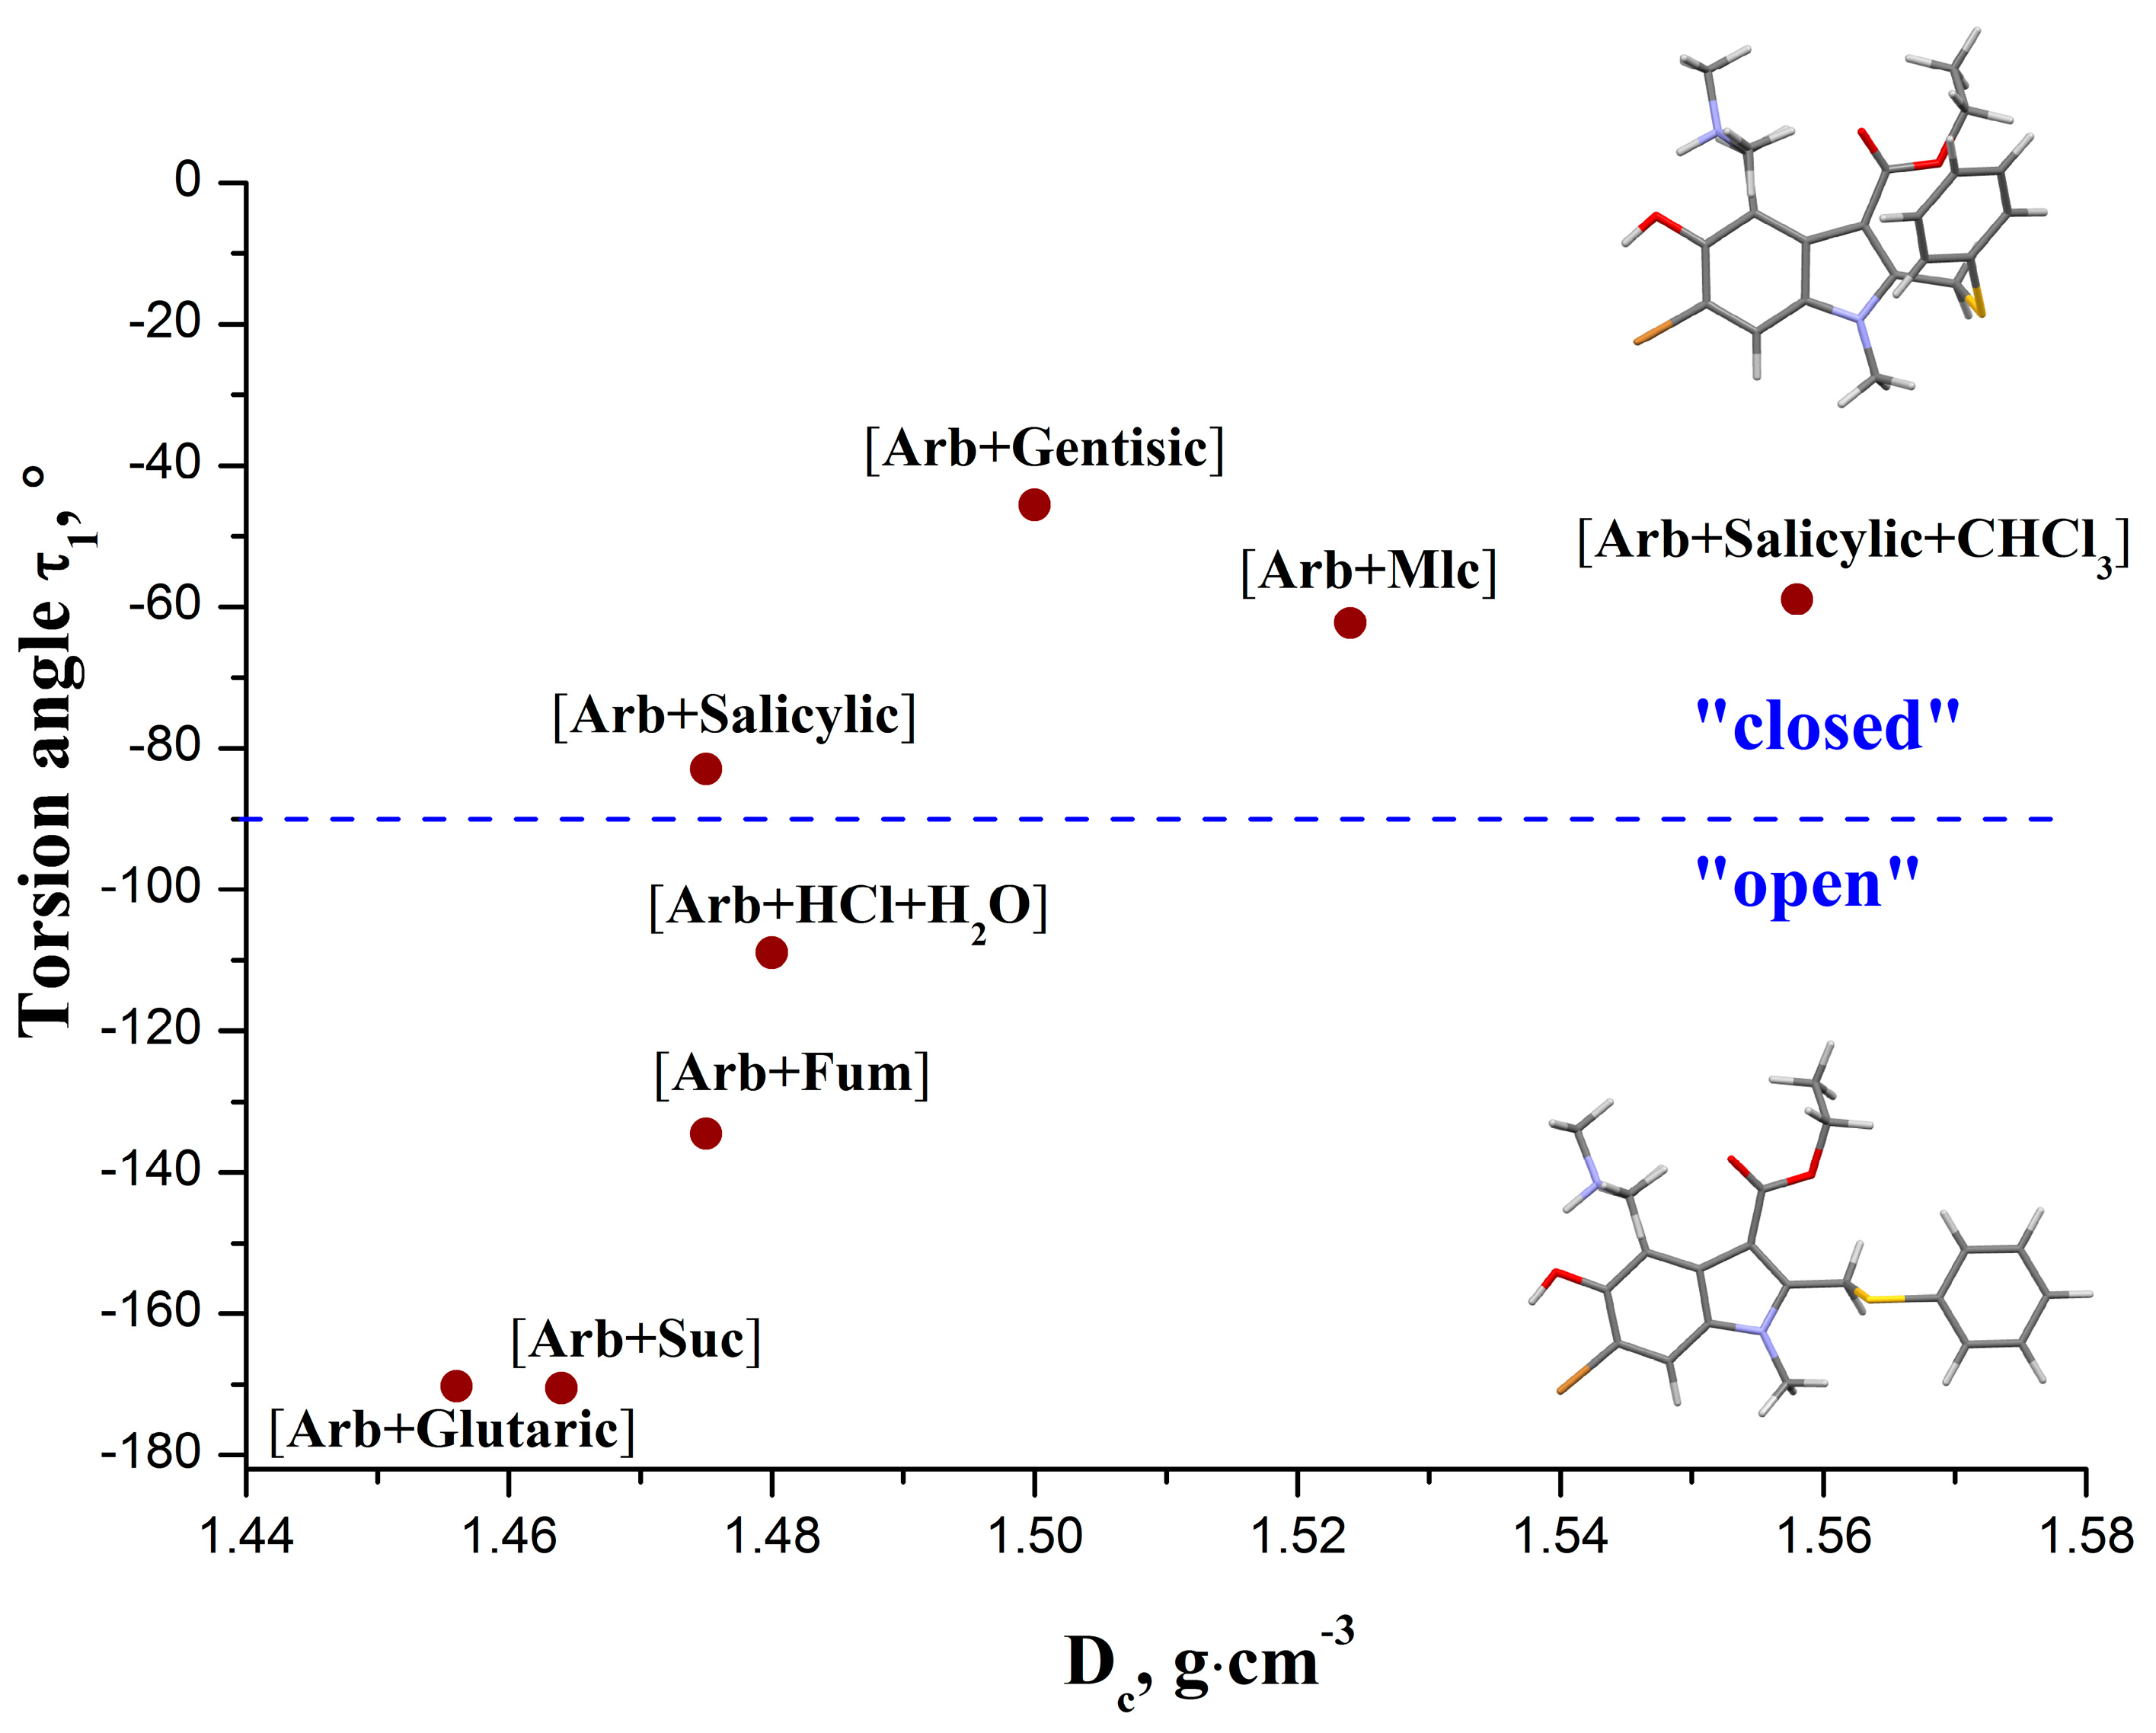
2.2. Conformational Analysis

Arbidol is considered to be a flexible molecule. The diversity of its conformational states can be described in terms of at least four torsion angles, namely τ1 (∠C1-C10-S1-C13), τ2 (∠C10-S1-C13-C14), τ3 (∠C3-C4-C12-N2), and τ4 (∠C3-C2-C11-O3) (see Figure 1). The values of the selected torsion angles for the arbidol ions in all the known solid forms are collected in Table 2.
Table 2. Selected torsion angles τ1, τ2, τ3, and τ4 for arbidol ion (zwitterion) in the known crystal forms.
--τ1a
(∠C1-C10-S1-C13)
τ2
(∠C10-S1-C13-C14)
τ3
(∠C3-C4-C12-N2)
τ4
(∠C3-C2-C11-O3)
[Arb + Mlc] (1:1)−62.3−88.9−110.518.4
[Arb + Fum] (2:1) mol. A177.0−64.4−100.6−22.4
[Arb + Fum] (2:1) mol. B−134.5−60.8−102.7−20.5
[Arb + Suc] (1:1)170.5−21.3−126.4164.0
[Arb + Salicylic acid] (1:1)b−83.0−117.5−108.321.3
[Arb + Salicylic+CHCl3] (1:1:1)b−58.9−105.7−97.9−30.9
[Arb + Gentisic acid] (1:1)b−45.6−62.8−101.330.2
[Arb + Glutaric acid] (1:1)b170.2−34.6−81.4−14.7
[Arb+HCl+H2O] (1:1)108.9141.4−78.717.7
a The numbers written in bold correspond to “closed” conformation; the numbers written in italic correspond to “open” conformation; b Data taken from ref. 22.
Table 2 indicates that the torsion angle τ1 (∠C1-C10-S1-C13), which determines the orientation of the phenyl ring in relation to the indole moiety, is the most widely varying molecule fragment. Moreover, it is the τ1 angle that determines the overall geometry of the Arb molecule, to a large extent. If |τ1| < 90°, the molecule has a “closed” conformation. This type of conformation is observed in the crystals of [Arb + Mlc acid], [Arb + Salicylic acid], [Arb + Salicylic + CHCl3], and [Arb + Gentisic acid]. On the other hand, the molecular conformations with |τ1| > 90° may be defined as “open”. The structures that adopt “open” conformation of Arb are [Arb + Fum], [Arb + Suc], [Arb + Glutaric acid], and [Arb + HCl + H2O].
A considerable variation is also found for the torsion angle τ2 (∠C10-S1-C13-C14), which is responsible for the rotation of the phenyl ring around the S1-C13 bond in general. The τ2 values change from ca. −20° to −120° (an exception is observed for [Arb + HCl + H2O]).
The third flexible torsion angle τ3 (∠C3-C4-C12-N2) in the Arb molecule refers to the conformation of the dimethylamino group. In most cases, the protonated quaternary nitrogen atom points toward the ‒O1H1 hydroxy-group, so that |τ3| > 90° ([Arb + BA], [Arb + SA], [Arb + SA + CHCl3], [Arb + SA+ ACN], [Arb + Mlc], [Arb + Gentisic acid]). However, in the [Arb + HCl + H2O] and [Arb + Glutaric acid] crystals, the dimethylamino group approaches the ethyl ester group (|τ3| < 90°) to form the N2+–H2···O3 intramolecular contacts [38].
The torsion angle τ4 (∠C3-C2-C11-O3) corresponds to the orientation of the ethyl ester group. In most structures, the C11=O3 bond of the ester groups is oriented towards the dimethylamino group, so that the τ4-angle alters in the relatively narrow range of −30° to +30°. However, in the zwitterionic form of Arb ([Arb + Suc]), the C11=O3 bond is pointed in the opposite direction, and the ester group conformation is characterized by a τ4 value of 164.0°.
The results of the above-mentioned analysis indicate that the conformation of the Arb molecule in the crystals is greatly influenced by its supramolecular surroundings. On the other hand, different conformers are embedded in a crystal environment, so that a change in molecular conformation is inevitably accompanied by a change in packing arrangement and, as a consequence, packing efficiency of a crystal. In the case of the Arb molecule, the most considerable conformational changes are observed for the torsion angle τ1 (∠C1-C10-S1-C13), which is mainly responsible for the overall shape of the Arb molecule in the crystal (“closed” or “open”). Thus, it is the most informative parameter to be analyzed. Figure 5 illustrates the τ1-values of Arb in different crystal forms as a function of the calculated density of the corresponding crystals (Dc).
Figure 5. Value of the torsion angle τ1 in the Arb molecule as a function of the calculated density of the corresponding crystals.
Crystals 05 00650 g005
It is evident that the crystals containing an “open” Arb conformation have lower density compared to those that consist of molecules with a “closed” conformation. In addition, the decrease in the absolute values of the τ1 angle is accompanied by an almost linear increase in the packing density of the crystals. However, above a Dc of ca. 1.5 g·cm−3, the τ1 angle reaches a plateau value of ≈−55°, indicating that further increasing of the crystal packing density has no influence on the geometry of the τ1 angle. This fact suggests that the conformational energy penalty of the molecule associated with the plateau value of τ1 becomes far too high to be overcome by the packing forces. Increasing of the packing efficiency in those crystals is probably achieved on account of structural adjustment of the other flexible torsion angles, namely τ2, τ3 and τ4.

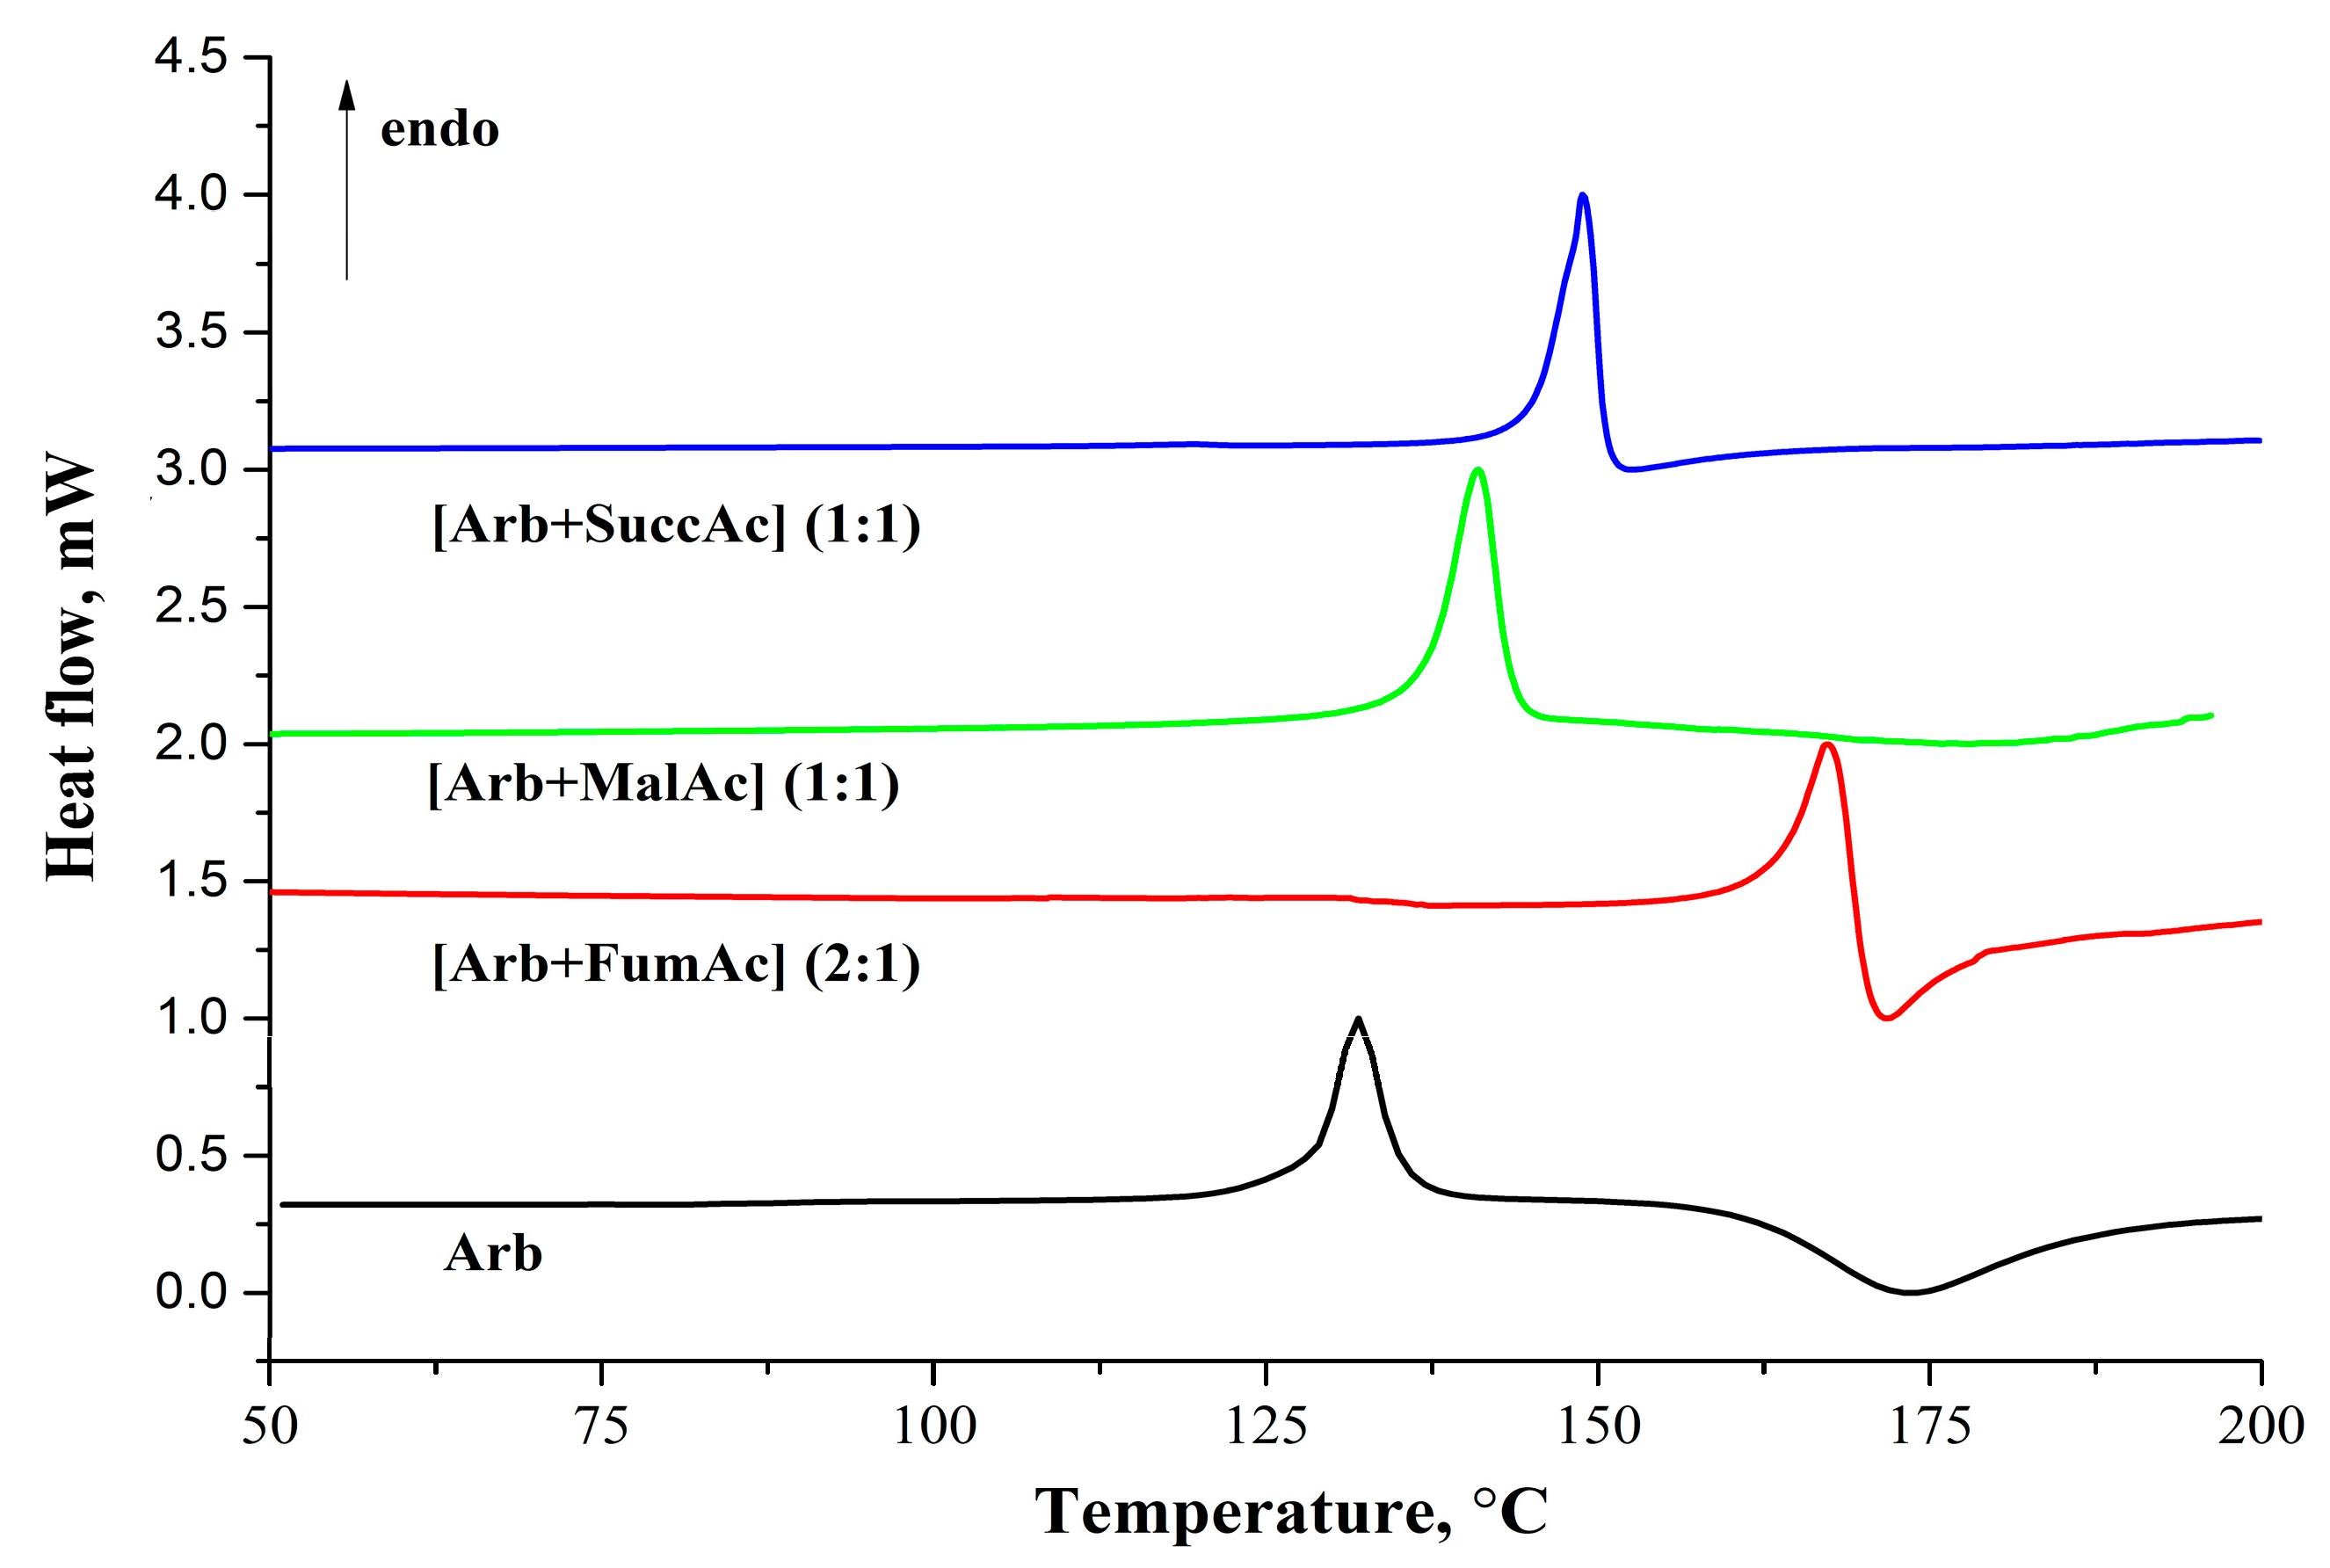
2.3. Thermal Analysis

DSC measurements were conducted to investigate the thermal properties of arbidol hemifumarate, maleate, and Arb-succinic acid cocrystal. The DSC traces for arbidol base, [Arb + Fum], [Arb + Mlc], and [Arb + Suc] are shown in Figure 6, and the thermal data are represented in Table 3.
Figure 6. DSC curves for arbidol base and its salts recorded at 10 °C·min–1 heating rate.
Crystals 05 00650 g006
Table 3. Thermophysical data for arbidol and its salts.
--Arb[Arb + Fum] (2:1)[Arb + Mlc] (1:1)[Arb + Suc] (1:1)
Tfus, K (onset)397.9 ± 1.0432.9 ± 1.0406.5 ± 1.4415.8 ± 1.0
Δ H f u s T , kJ∙mol−144.6 ± 2.847.9 ± 5.049.4 ± 4.059.3 ± 6.0
The melting temperatures of all new forms are higher than that of the arbidol base. The melting temperature growth for salts and cocrystal is similar to the changes in the melting temperatures of co-formers: [Arb + Mlc] < [Arb + Suc] < [Arb + Fum]. The salts’ fusion enthalpy values are comparable and close to the Arb fusion enthalpy value, while Δ H f u s T for [Arb + Suc] is found to be at least ca. 10 kJ·mol−1 higher than the others. It should be noted that the majority of the known cocrystals and salts (namely about 50% of all known cocrystals) belong to the melting temperature domain of 130–160 °C. [39] Moreover, the difference between the melting temperatures of API and co-former is most often (in 26.8% of cocrystals) known to vary within the range of 0–30 °C. In the studied case, only the [Arb + Mlc] salt has the difference in components melting temperatures within this temperature interval. For [Arb + Suc] cocrystal, Tfus (API) − Tfus(CF) = 59.2 °C, which is characteristic of 23.5% of cocrystals (with melting temperatures difference from 45 °C to 75 °C). The [Arb + Fum] salt is made up of components with the melting temperature difference equaling about 164 °C and is formed only in 9.1% of cases.
The distribution of cocrystals according to the difference between the melting temperatures of API and cocrystal shows that it is most typical of cocrystals to have 30–50 °C higher melting temperatures than the low-melting component does—API in this case (33.56% of all cocrystals) [39]. Only the [Arb + Fum] salt follows this trend. The melting temperature increase in [Arb + Mlc] salt and [Arb + Suc] cocrystal is not so significant, and equals 8.6 and 17.9 °C, respectively. Such systems are found 2.5 times less frequently (in 13.61% of cocrystals).
As shown by Perlovich [39], the analysis of fusion temperatures of cocrystals with fumaric, maleic, and succinic acids make it possible to find correlations between cocrystal and API melting temperatures by the following equation (where A and B are correlation coefficients):
T f u s ( C C ) = A + B T f u s ( A P I )
The correlation coefficients for cocrystals and salts of different API with fumaric, maleic, and succinic acids, to be used in Equation (1), are given in Table 4.
Table 4. Coefficients of the correlation equation (1) for multicomponent crystals with selected dicarboxylic acids, calculated values of melting temperatures ( T f u s c a l c ) for the Arb salts/co-crystal, and difference (Δfus) between calculated and experimental melting temperatures for the Arb salts/co-crystal.
CompoundAaBaSDa,b T f u s c a l c [Arb+acid], KΔfus( T f u s c a l c T f u s e x p ), K
Fumaric acid309.83 ± 23.430.324 ± 0.0538.78438.75.8
Maleic acid199.26 ± 45.760.482 ± 0.09313.90391.1−15.5
Succinic acid263.76 ± 24.560.392 ± 0.05515.79419.83.9
a Data taken from the ref. [39]; b Standard deviation.
As Table 4 shows, the calculated values of melting temperatures for [Arb + Fum] and [Arb + Suc] are in good agreement with the experimental values. The difference between T f u s c a l c and T f u s e x p of the systems under study is much smaller than the standard deviation of the correlation equation. The biggest deviation from the calculated value of the melting temperature compared to the experimental one is found in [Arb + Mlc] salt (−15.5 K), which is, however, comparable to the SD value of Equation (1) for maleic acid systems.
The melting temperature of Arb is 124.8 °C, but after further heating to 150 °C and higher, an exoeffect is observed with a peak at 175 °C (Figure 6). The exoeffect is also observed at melting of Arb salts. This effect is usually caused by compound decomposition. Thermogravimetric (TG) and mass-spectrometry analyses of compounds have been carried out to interpret the observed process. TG thermograms have shown that there is no weight loss before melting (Figure S2). All arbidol crystals have decomposition temperatures at which a weight loss is observed after melting, and the temperatures are different in every crystal.
The tallest peak in a mass spectrum (base peak) is observed at 40 m/z. This peak is characterized by the presence of argon in which the experiment took place. In addition, one of the most intense peaks is the peak at m/z = 18–20, indicating presence of water. No products of Arb decomposition are observed at 175 °C. It is only after the temperature exceeds 200 °C that peaks characteristic of Arb degradation products (for example, m/z = 110, which corresponds to thiophenol, see Scheme S1) begin to appear on the mass-spectrum (Figure S3). The presence of ethylformate (m/z = 76) can be determined on the mass spectrum. The peak near 140 indicates the presence of an Arb fragment 1,2-dimethyl-1H-indole among degradation products. Consequently, it should be assumed that the Arb decomposition process must produce trimethylamine (m/z = 59) and HBr (m/z = 81) fragments. Indeed, their characteristic peaks are present in the mass spectrum, but their intensities are very low. The intensity of the peaks, which indicates the presence of CO2 (m/z = 44) and N2 or CO (m/z = 28), is greatly enhanced. No m/z value for Arb (477.4) has been found on the mass-spectra. Note that there is no exothermic peak at 175 °C for the cocrystal of arbidol with succinic acid, but the mass-spectra are the same for salts and Arb.

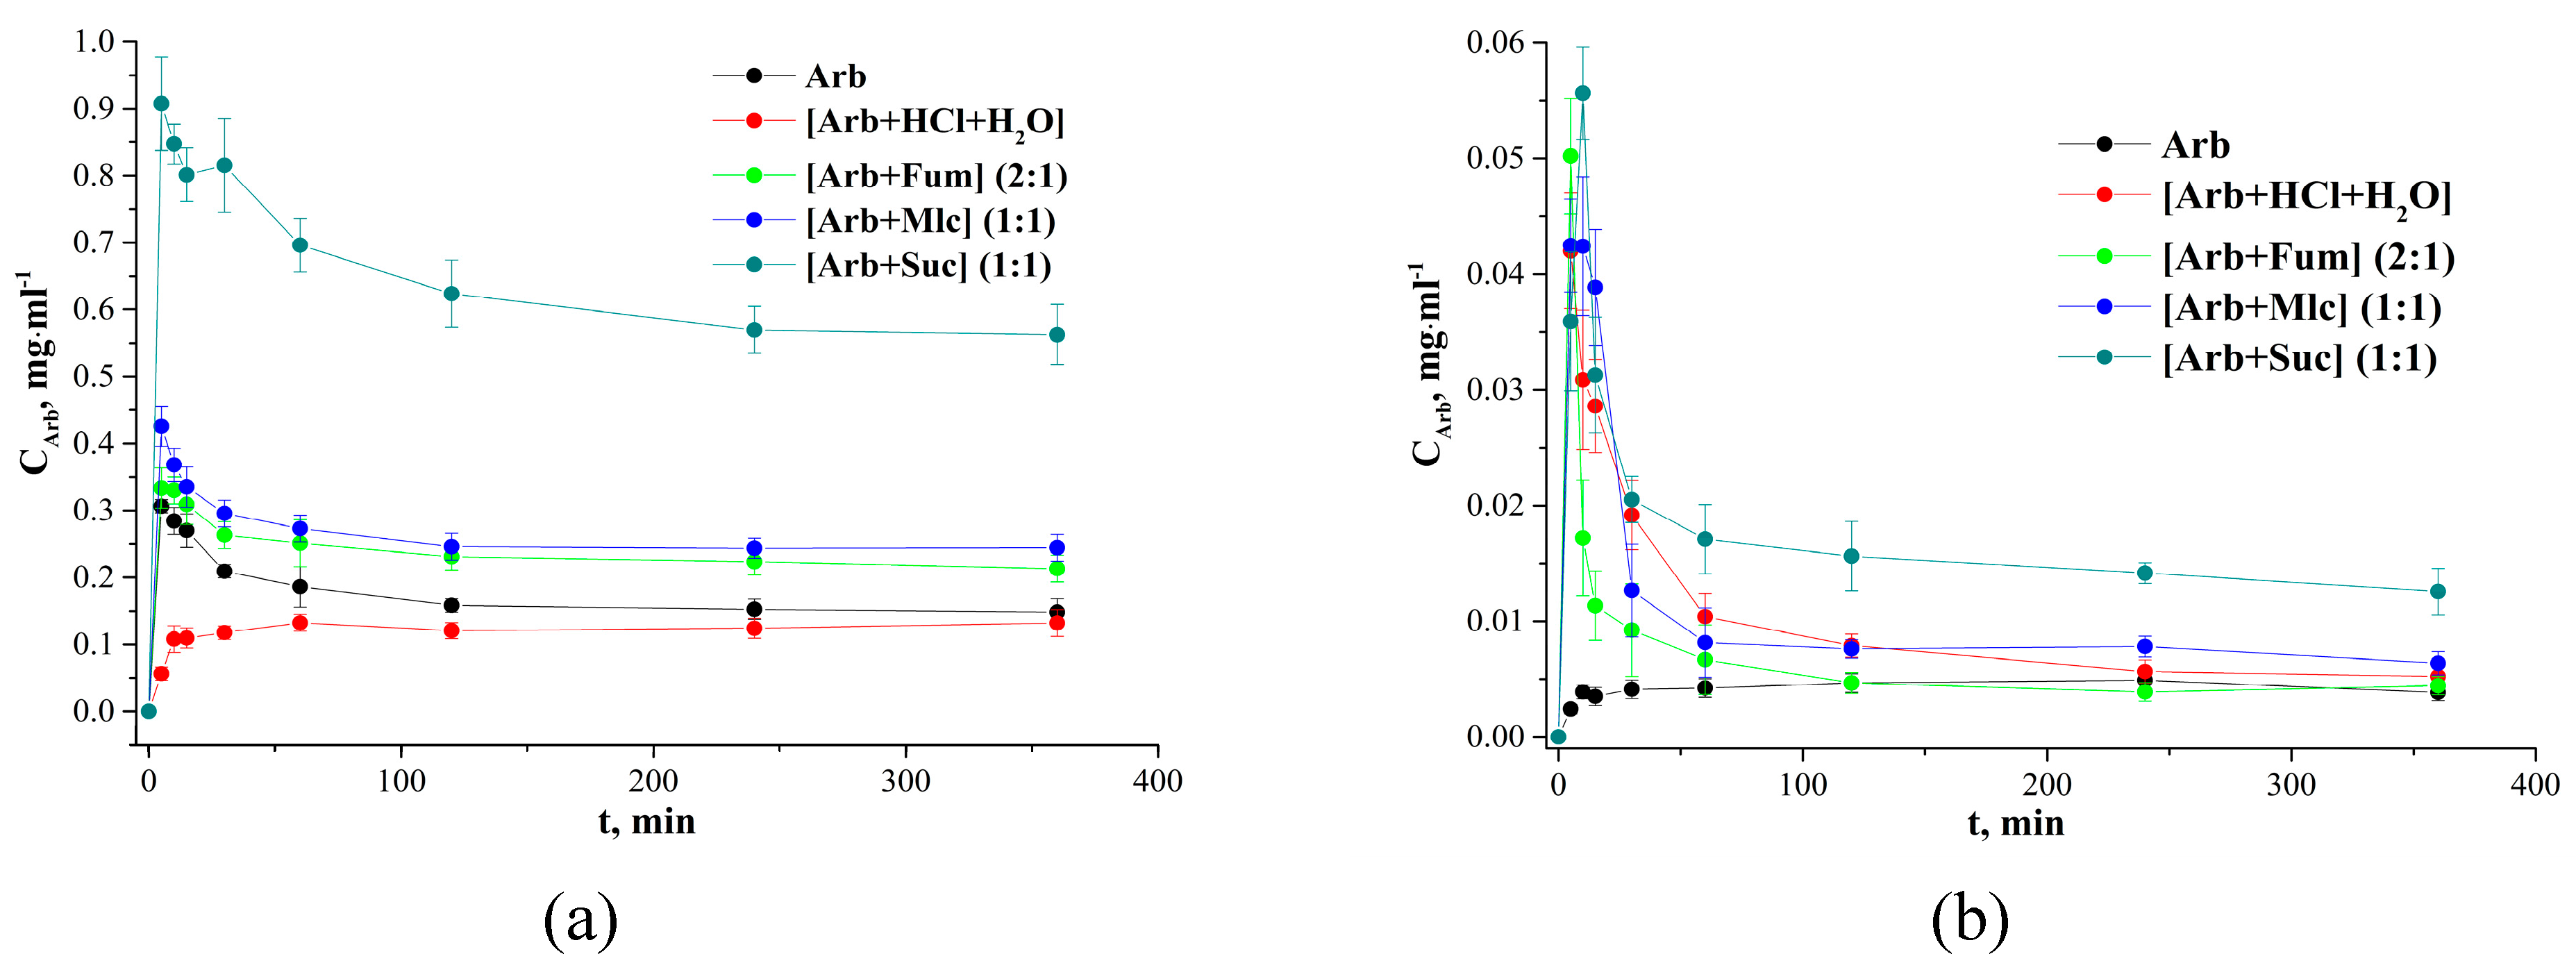
2.4. Aqueous Dissolution Study

As it has been mentioned, Arb is a relatively strong base with pKa value near 6.0 [27]. Therefore, the solubility of the drug, as well as its salts, in aqueous solutions is expected to be pH-dependent. A dissolution study has been conducted to compare the dissolution profiles of arbidol freebase, arbidol hydrochloride monohydrate, hemifumarate, maleate, and succinic acid cocrystal with arbidol zwitterion at different pH values. The solubility experiments (at 25 °C) of the salts were examined in the hydrochloric buffer with pH 1.2 and the phosphate buffer with pH 6.8. The results of the dissolution experiments are summarized in Table 5. Figure 7 shows the dissolution profiles for the salts and Arb at different pH values.
Table 5. Aqueous solubilities at 25 °C for Arb salts and pure Arb in pH 1.2 and pH 6.8 media.
--Сmax (mg·mL−1) aSolubility (mg·mL−1) bSolid Phase Recovered after Solubility Experiment c
pH 1.2
Arb0.30 ± 0.010.15 ± 0.01[Arb + HCl + H2O]
[Arb + HCl + H2O]0.13 ± 0.010.13 ± 0.01[Arb + HCl + H2O]
[Arb + Fum] (2:1)0.33 ± 0.030.21 ± 0.02[Arb + HCl + H2O]
[Arb + Mlc] (1:1)0.42 ± 0.030.24 ± 0.02[Arb + HCl + H2O]
[Arb + Suc] (1:1)0.91 ± 0.070.56 ± 0.04[Arb + HCl + H2O]
pH 6.8
Arb0.005 ± 0.0010.004 ± 0.001Arb
[Arb + HCl + H2O]0.042 ± 0.0050.005 ± 0.001Arb
[Arb + Fum] (2:1)0.050 ± 0.0050.004 ± 0.001Arb
[Arb + Mlc] (1:1)0.042 ± 0.0060.006 ± 0.001Arb
[Arb + Suc] (1:1)0.055 ± 0.0060.012 ± 0.002Arb
a maximum concentration of Arb in solution; b concentration after six h of the experiment; c The residual materials were identified by XPRD analysis (see supporting information).
Figure 7. Dissolution profiles at 25 °C for salts, cocrystal and pure Arb in pH 1.2 (a) and pH 6.8 (b).
Crystals 05 00650 g007
The maximum concentration (Cmax) of Arb in the pH 1.2 solution reaches 0.91 mg·mL−1 (for [Arb + Suc]), which is about three times higher than that of Arb pure base, and seven times higher than that of [Arb + HCl + H2O]. The maximum concentration values for Arb salts considerably exceed the solubility value of [Arb + HCl + H2O], and equal 0.33 mg·mL−1 for [Arb + Fum] and 0.42 mg·mL−1 for [Arb + Mlc]. The Arb concentration gradually decreases both in the salts and the cocrystal with time. This behavior of API alternative crystalline form in solution is known as the “spring and parachute” effect, which is normally used to describe the cocrystal solubility curves [3,40]. The decline in the drug concentration can be attributed to a solution-mediated transformation of the bottom phase during the experiment. An X-ray powder diffraction (XRPD) analysis of the bottom phase shows that all the studied systems totally transform into [Arb + HCl + H2O], which is the most thermodynamically stable form of the drug under the current conditions (Figure S4). The final concentration levels for salts and Arb are achieved in less than 4 h and they are close to the solubility value of [Arb + HCl + H2O], which is equal to ca. 0.13 ± 0.02 mg·mL−1. The [Arb + Suc] cocrystal dissolution process is a little different. The transformation process of the cocrystal to [Arb + HCl + H2O] takes more time than that for Arb salts. The concentration level of Arb for the cocrystal after 6 h is about three and a half times higher than that for the solubility value of [Arb + HCl + H2O], and is about two times higher than the maximal concentration of Arb free base. This behavior can probably be explained by the fact that the Arb molecule in cocrystal is in the zwitterion form. Kumar and Nangia have found that the solubility of the zwitterionic form is higher, even when it is a more stable modification than the neutral form [41]. The high polarity and ionic nature of acidic/basic groups promote hydrogen bonding with water (for higher solubility) as well as a tighter crystal lattice of ionized molecules (polymorph stability). The cocrystal with Arb in the zwitterionic form can improve both the solubility and the stability of API when compared to its ionic form (as salt) and the neutral form (as Arb pure base or as cocrystal). Therefore, the Arb cocrystal in the zwitterionic form is a desirable optimization in pharmaceutical development of high soluble arbidol with prolonged action.
There are considerable decreases in solubilities observed in all the systems under investigation at pH 6.8 as compared to the solubility in water with pH 1.2. The decrease in the maximum concentration values varies from 3 times (for [Arb + HCl + H2O]), to 60 times (for Arb). The maximum concentration of Arb salts and cocrystal with dicarboxylic acids fall in the following order: 6.6 times ([Arb + Fum]) < 10 times ([Arb + Mlc]) < 16.5 times ([Arb + Suc]). Nevertheless, salts and cocrystal demonstrate elevated concentration levels during the first 60 min of dissolution. However, it is obvious that the Arb concentration value in cocrystal (as for Arb salts) decreases to Arb free base solubility value, which is equal to ca. 0.004 ± 0.001 mg·mL−1. XRPD analysis of the solid phase recovered after the experiment reveals no transformation of Arb during the solubility study. All the salts, however, were seen to undergo a solution-mediated transformation to Arb during the solubility process. Thus, it can be assumed that dissolution in a pH 6.8 buffer leads to Arb salts transformation into pure Arb in the bottom phase. This assumption has been confirmed by the XRPD analysis of solid phases recovered after the experiment (Figure S5). As in buffer with pH 1.2, the cocrystal dissolution process in buffer pH 6.8 differs from salt dissolution. The Arb concentration level for cocrystal [Arb + Suc] is still two times higher than the solubility values for the other systems after 6 h of the experiment. However, the Arb concentration values decrease faster in the phosphate buffer with pH 6.8 than in the hydrochloric buffer with pH 1.2.
The melting temperatures of single-component molecular crystals are normally used to describe/evaluate/imitate the energy of crystal lattice, as in the general solubility equation of Yalkowsky and Valvani [42]. In addition, it has been shown previously that there is a linear correlation between the sublimation Gibbs energy and the melting temperatures of structurally similar compounds [39,43]. An increase in the melting temperature leads to the sublimation Gibbs energy growth, which must reduce the solubility values. Thus, it can be assumed that in multicomponent crystals (cocrystals and salts) a melting temperature increase lowers the solubility values. To prove this assumption, we analyzed the known cocrystals and salts of different API with dicarboxylic acids. Figure 8 shows the analysis results as a diagram in coordinates of the melting temperature ratio (Tfus(CC)/Tfus(API)) versus their maximal solubility ratio (Cmax(CC)/Cmax(API))).
Figure 8. Diagram of the influence of API melting temperature change in cocrystals and salts with dicarboxylic acids on their solubility. The cocrystals and salts with different acids as co-formers are represented by the following symbols: with oxalic (♦); with malonic (+); with fumaric (■); with maleic (●); with succinic (▲); with tartaric ( Crystals 05 00650 i001
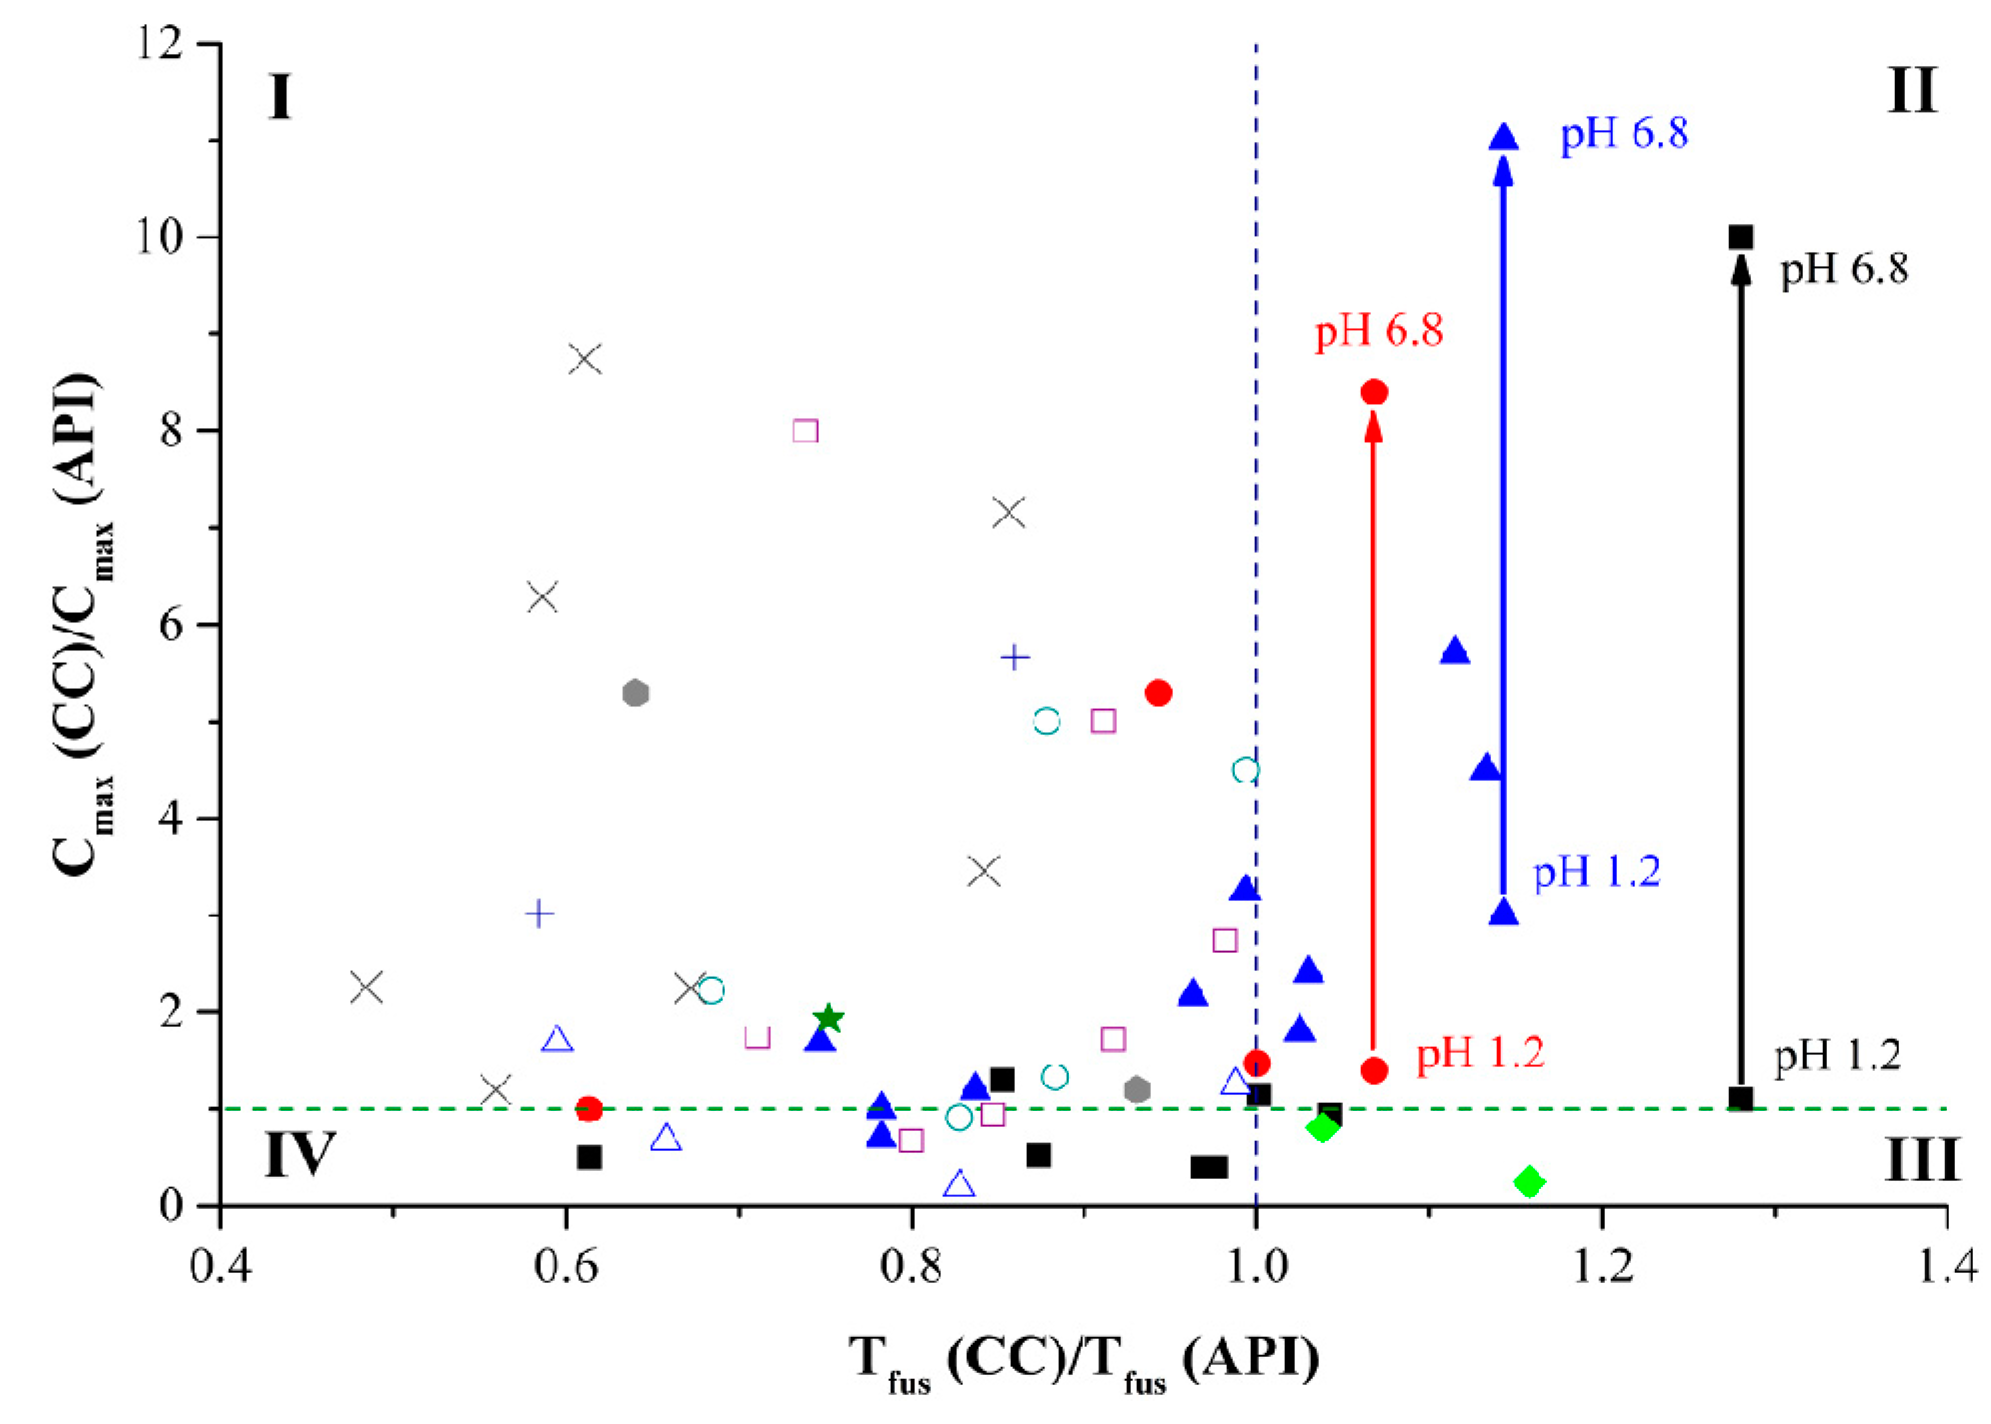
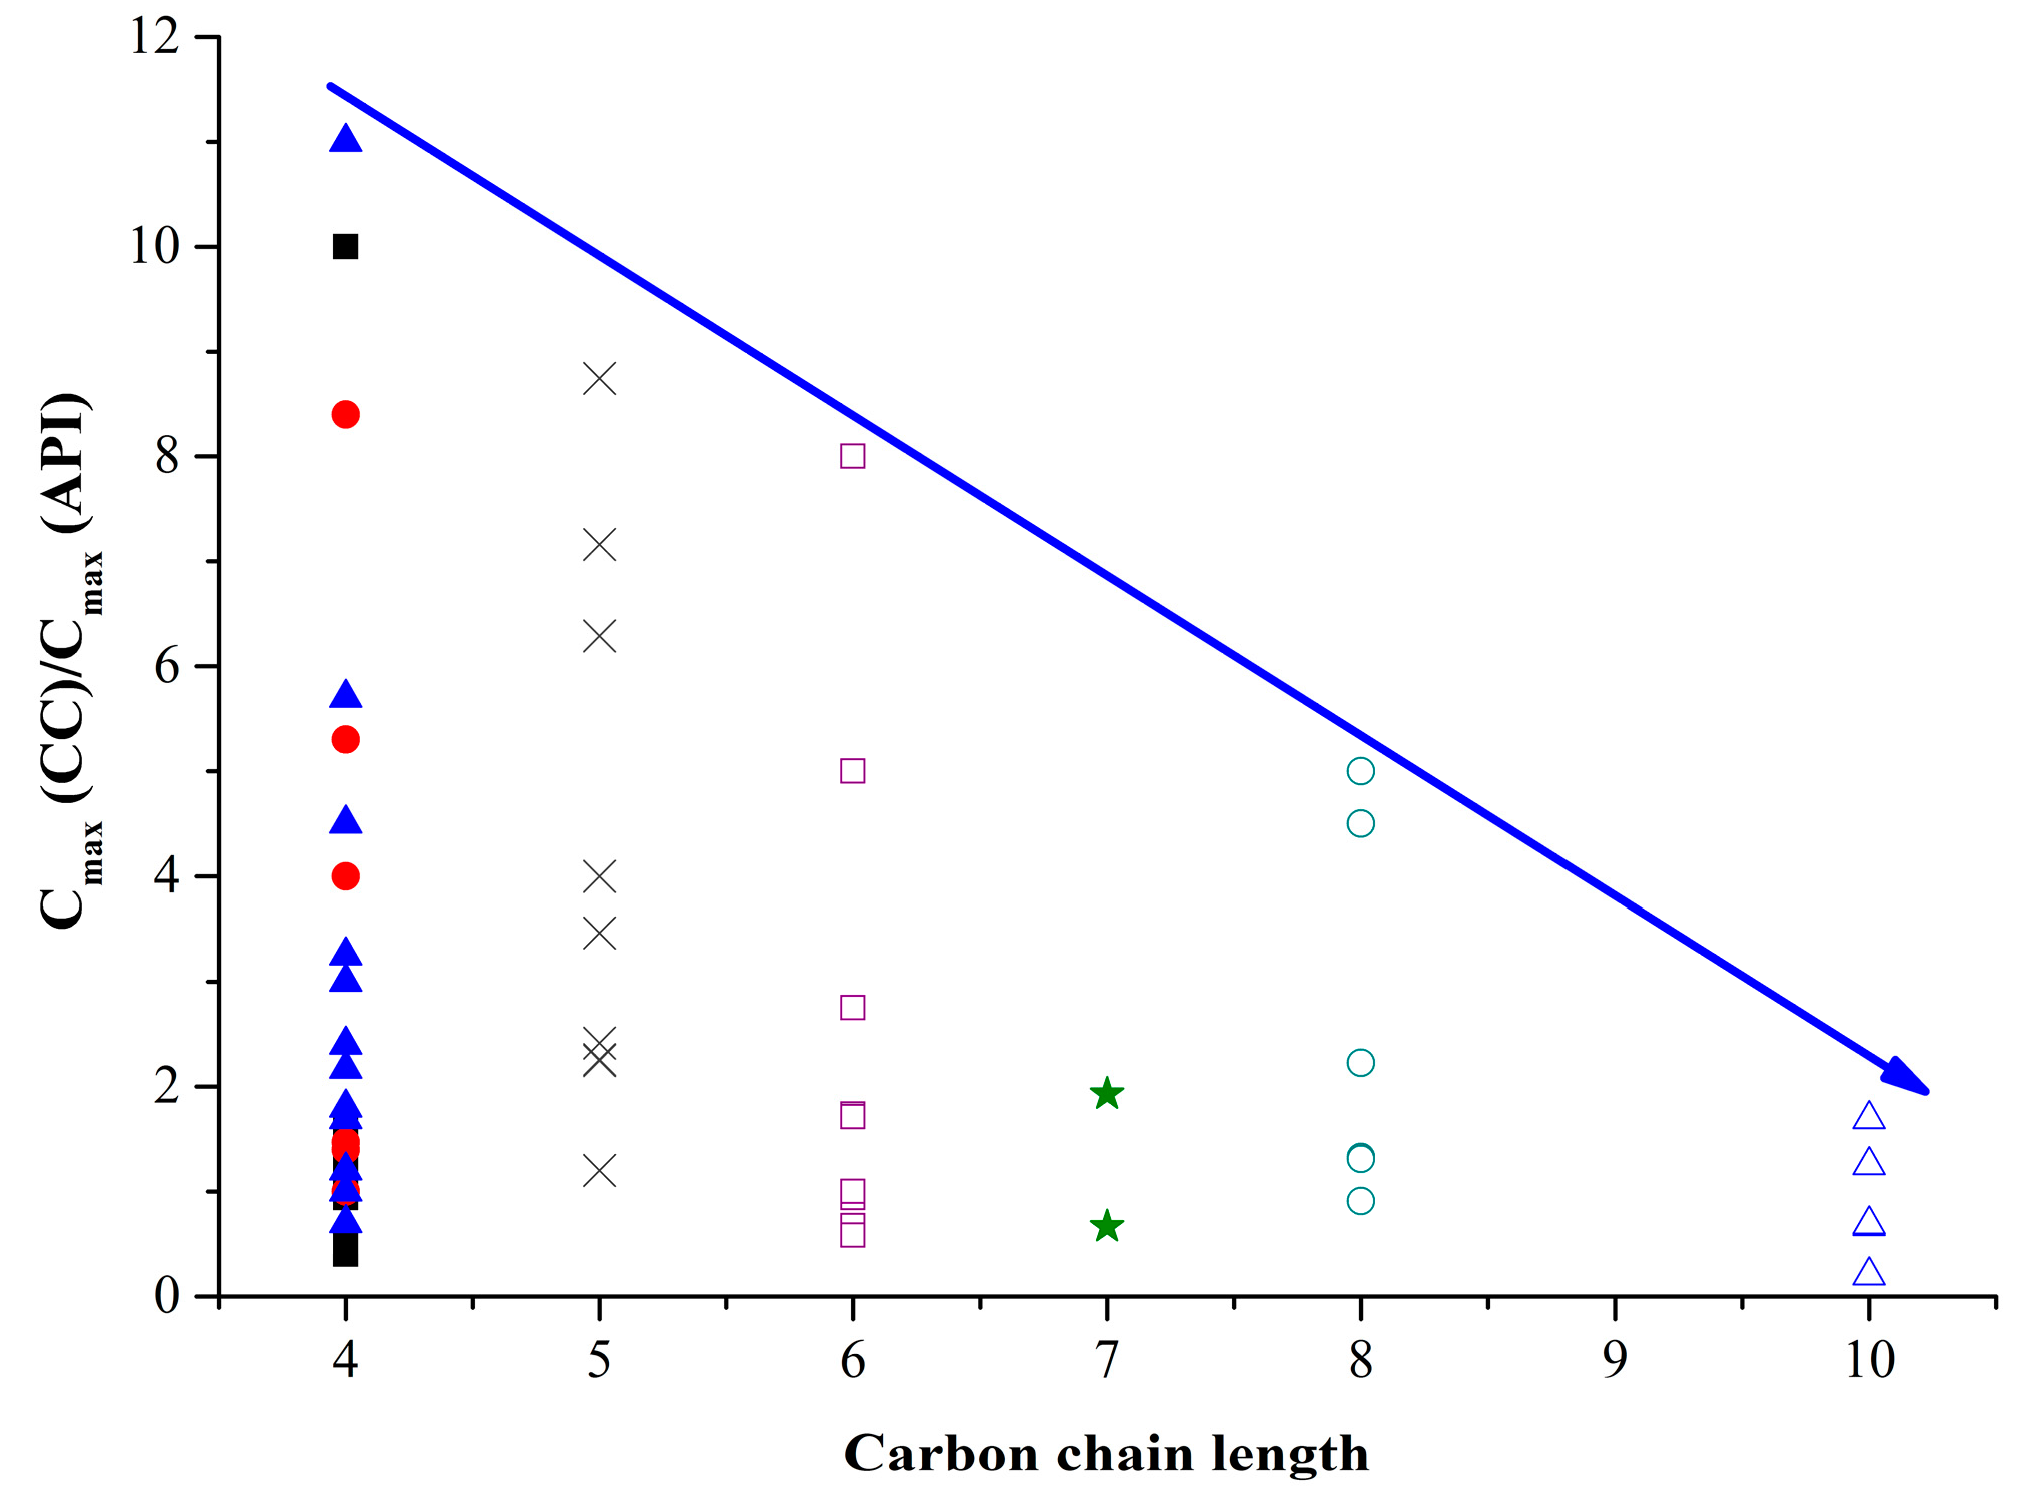
); with glutaric (×); with adipinic (□); with pimelic (★); with suberic (○); with sebacic (△) acids. The green dash line corresponds to the cases when the cocrystal/salt solubility is equal to API solubility. The blue dash line corresponds to the case when the cocrystal/salt melting temperatures are equal to the API one.
Crystals 05 00650 g008
The diagram is divided into four zones. Zone I contains compounds in which cocrystal formation results in a melting temperature decrease and a solubility increase. As the diagram shows, most of the compounds under study belong to this zone. Zone II contains compounds in which cocrystal/salt formation leads to API solubility increase and a simultaneous growth of T f u s ( C C ) compared to the API value. It should be noted that six out of ten points in zone II represent solubility values of the arbidol salts and arbidol cocrystal in its zwitterionic form in media with different acidity values. It is known that it is more difficult to predict behavior of salts than that of cocrystals [44]. Most likely, it is the ion form of co-formers of these multicomponent systems that causes the significant deviation from the general trend. Zone III includes cocrystals with melting temperatures higher than in pure API, which, as expected, reduces their solubility. This group includes salts with oxalic acid, sildenafil, and sulfamethizole. The melting temperatures of dicarboxylic acids rarely exceed 200 °C. That is why the melting temperatures of the shown cocrystals and salts are unlikely to exceed that of API. The highest melting temperature is registered in fumaric (287 °С) and succinic (185 °С) acids, which affects their cocrystals/salts as well. For example, cocrystals/salts with fumaric acid often have lower solubility than API, while cocrystal formation with succinic acid often leads to a melting temperature increase accompanied by a solubility growth. Zone IV includes cases when a decrease in the melting temperature of a cocrystal/salt does not result in their solubility growth. This zone mostly contains cocrystals with sebacic, suberic, and adipic acids. Carbon aliphatic chain lengthening enhances the molecule hydrophobicity and reduces its acidity, which negatively affects the ability of dicarboxylic acids to increase API solubility. Indeed, analysis of the influence of the carbon chain length of the salts and cocrystals under study on their solubility parameters indicates that the increased number of carbons in chain narrows the interval of potential API solubility growth (Figure 9).
Figure 9. Cocrystal-API solubility ratio as a function of carbon chain length of dicarboxylic acids. The cocrystals and salts with different acids as co-formers are represented by the following symbols: with fumaric (■); with maleic (●); with succinic (▲); with glutaric (×); with adipinic (□); with pimelic (★); with suberic (○); and sebacic (△) acids.
Crystals 05 00650 g009

3. Experimental Section

3.1. Compounds and Solvents

Arbidol hydrochloride monohydrate (C22H28BrClN2O4S, 98%) was purchased from Sichuan Baili Pharmaceutical Co., Ltd. (China). Arbidol base was prepared according to the procedure described by Orola et al. [22]. Maleic acid (C4H4O4, 99%), fumaric acid (C4H4O4, 99%), and succinic acid (C4H6O4, 99%) were purchased from Acros Organics. All the solvents were available commercially and used as received without further purification.

3.2. Crystallization Procedure

Arbidol base (50 mg, 0.1 mM) was dissolved with maleic, succinic acids in the 1:1 and with fumaric acid in the 2:1 molar ratio in 10 mL of acetonitrile and stirred at 50–60 °C until a clear solution was obtained. The solution was slowly cooled and kept in a fume hood at room temperature. Diffraction quality crystals of the arbidol salts were grown over a period of 2–3 days. The bulk samples of the salts were obtained by slurring equimolar amounts of arbidol base (100 mg, 0.2 mM) and the corresponding acid in acetonitrile for 3 h at room temperature.

3.3. X-Ray Diffraction Experiments

Single-crystal X-ray diffraction data were collected on a Bruker SMART APEX II diffractometer using graphite-monochromated MoKα radiation (λ = 0.71073 Å). Absorption corrections based on measurements of equivalent reflections were applied [45]. The structures were solved by direct methods and refined by full matrix least-squares on F2 with anisotropic thermal parameters for all non-hydrogen atoms [46]. All carbon hydrogen atoms were placed in calculated positions and refined using a riding model. All amino and hydroxy hydrogen atoms were found from difference Fourier synthesis and refined isotropically. In the structure [Arb + Suc], one carboxyl oxygen atom of succinic acid was found to be disordered over two closely-spaced positions O24/O25 with occupancy ratio 0.56/0.44.
X-ray powder diffraction (XRPD) data were recorded under ambient conditions in Bragg-Brentano geometry with a Bruker D8 Advance diffractometer with CuKα1 radiation (λ = 1.5406 Å).

3.4. Differential Scanning Calorimetry (DSC)

Thermal analysis was carried out using a Perkin Elmer DSC 4000 differential scanning calorimeter with a refrigerated cooling system (USA). The sample was heated in sealed aluminum sample holders at the rate of 10 °C∠min−1 in a nitrogen atmosphere. The unit was calibrated with indium and zinc standards. The accuracy of the weighing procedure was ± 0.01 mg.

3.5. TG/Mass-Spectrometry Experiment

TGA and mass-spectrometry experiments were carried out using a NETZSCH STA 409 CD/7/G + Skimmer DSC/DTA/TG with a Skimmer mass-spectrometric vapor analysis system (Eion = 70 eV) in the argon flow at the rate of 70 mL/min. The powder sample was placed into a platinum crucible and heated at the rate of 10 K/min. The temperature was measured with a Pt10%-Pt-Rh thermocouple. The temperature calibration of the equipment was performed against eight high-purity substances: biphenyl (99.5%), КNO3 (99.999%), RbNO3 (99.99%), KClO4 (≥99%), Ag2SO4 (99.999%), CsCl (99.999%), K2CrO4 (≥99%), BaCO3 (99.98%).

3.6. Aqueous Dissolution Experiments

Dissolution measurements were carried out by the shake-flask method in the hydrochloric buffer with pH 1.2 and the phosphate buffer with pH 6.8 at 25 ± 0.1 °C. The media at pH 1.2 was prepared with 0.1 N aqueous hydrochloric acid solution and potassium chloride. For the phosphate buffer, 0.05 M solution of Na2HPO4 was adjusted to pH 6.8 with sodium hydroxide.
The excess amount of each sample was suspended in the respective buffer solution in Pyrex glass tubes. The amount of the drug dissolved was measured by taking aliquots of the respective media. The solid phase was removed by isothermal filtration (Rotilabo® syringe filter, PTFE, 0.2 μm). The concentration was determined by HPLC. The results are stated as the average of at least three replicated experiments. HPLC was performed on Shimadzu Prominence model LC-20AD equipped with a PDA detector and a C-18 column (150 mm × 4.6 mm i.d., 5 μm particle size and 100 Å pore size). Elution was achieved by mobile phase consisting of water—0.1% trifluoroacetic acid (A) and acetonitrile (B). The flow rate of the mobile phase was 1 mL∙min−1. To analyze the samples from the hydrochloric buffer, gradient elution was performed by changing the mobile phase from 20% to 50% B for the first 5 min, then it was maintained for the next 6 min, and then the percentage of the mobile phase component B was decreased from 50% to 20% for the next 3 min. The arbidol retention time was found to be 9 min. To analyze the samples from the phosphate buffer, gradient elution was performed by changing the mobile phase from 20% to 40% B for the first 5 min, then it was maintained for the next 5 min, and then the percentage of the mobile phase component B was decreased from 50% to 20% for the next 4 min. The retention time of arbidol was found to be ~11.5 min. The detection of arbidol was carried out at a wavelength of 314 nm for both buffers: pH 1.2 and pH 6.8. The concentrations were calculated according to an established calibration curve.

4. Conclusions

Salts of antiviral drug arbidol with fumarate and maleate anions and new cocrystal arbidol in its zwitterionic form and succinic acid have been obtained and their crystal structures have been determined. The Arb zwitterion was not previously seen in any of the drug crystal forms, and the [Arb + Suc] cocrystal seems to be the first found instance. The conformational analysis of the arbidol in different crystal forms has revealed that the most widely varying torsion angle in the molecule is ∠C1-C2-S1-C31), which determines the orientation of the phenyl ring in relation to the indole moiety. With respect to the τ1-values, all the Arb conformations can be conventionally divided into two groups: “open” and “closed”. In addition, the decrease in the absolute values of the τ1 angle is accompanied by an almost linear increase in the packing density of the crystals.
TG and mass-spectrometry analyses of compounds were carried out to study the Arb degradation process in pure and new crystal forms.
Dissolution study of the arbidol salts and cocrystal was conducted in aqueous buffer solutions with pHs 1.2 and 6.8 and showed that both salts dissolved incongruently to form arbidol hydrochloride monohydrate at pH 1.2 and arbidol base at pH 6.8, respectively. In the acidic media, the amount of Arb reached the concentration level, which was found to be ca. 3 times higher than the solubility of the commercially available form ([Arb + HCl + H2O]). In the pH 6.8 solution, the salts demonstrated a moderate solubility enhancement due to low stability under the current condition. The most stable Arb form was found in the cocrystal with succinic acid. The cocrystal showed higher values of maximum solubility and solubility level after six hours of dissolution than those in all the other crystal forms of Arb. Cocrystal formation with arbidol in zwitterion form may be the most promising way to obtain a new drug form of arbidol with prolonged action.

Supplementary Materials

The results of TG/MS analyses for Arb, [Arb + Fum], [Arb + Mlc] and [Arb + Suc], XRPD patterns of the residual materials after salts and cocrystal dissolution in buffer solutions with pHs 1.2 and 6.8 are available in supplementary file.

Acknowledgments

This work was supported by the Russian Scientific Foundation (No. 14-33-00017). We thank “the Upper Volga Region Center of Physicochemical Research” for technical assistance with XRPD and TG/Mass-spectrometry experiments.

Author Contributions

Alex Manin and Artem Surov performed the experimental work (single crystals preparation, aqueous dissolution tests, and DSC, XRPD experiments) and wrote the bulk of the manuscript. Andrei Churakov carried out single X-ray diffraction experiments. German Perlovich supervised the work and conceived the idea.

Conflicts of Interest

The authors declare no conflict of interest.

References

  1. Desiraju, G.R. Crystal engineering: a holistic view. Angew. Chem. Int. Ed. 2007, 46, 8342–8356. [Google Scholar] [CrossRef] [PubMed]
  2. Blagden, N.; Matas, M.D.; Gavan, P.T.; York, P. Crystal engineering of active pharmaceutical ingredients to improve solubility and dissolution rates. Adv. Drug Delivery Rev. 2007, 59, 617–630. [Google Scholar] [CrossRef] [PubMed]
  3. Schultheiss, N.; Newman, A. Pharmaceutical cocrystals and their physicochemical properties. Cryst. Growth Des. 2009, 9, 2950–2967. [Google Scholar] [CrossRef] [PubMed]
  4. Stahl, P.H.; Wermuth, C.G. Handbook of Pharmaceutical Salts: Properties, Selection and Use; Wiley-VCH: Zurich, Switzerland, 2002; p. 388. [Google Scholar]
  5. Sacchetti, M. General equations for in situ salt screening of multibasic drugs in multiprotic acids. Pharm. Dev. Technol. 2000, 3, 579–582. [Google Scholar] [CrossRef] [PubMed]
  6. Childs, S.L.; Chyall, L.J.; Dunlap, J.T.; Smolenskaya, V.N.; Stahly, B.C.; Stahly, G.P. Crystal engineering approach to forming cocrystals of amine hydrochlorides with organic acids. molecular complexes of fluoxetine hydrochloride with benzoic, succinic, and fumaric acids. J. Am. Chem. Soc. 2004, 126, 13335–13342. [Google Scholar] [CrossRef] [PubMed]
  7. Trask, A.V. An overview of pharmaceutical cocrystals as intellectual property. Mol. Pharm. 2007, 4, 301–309. [Google Scholar] [CrossRef] [PubMed]
  8. Trask, A.V.; Motherwell, W.D.; Jones, W. Pharmaceutical cocrystallization: Engineering a remedy for caffeine hydration. Cryst. Growth Des. 2005, 5, 1013–1021. [Google Scholar] [CrossRef]
  9. Vishweshwar, P.; McMahon, J.A.; Bis, J.A.; Zaworotko, M.J. Pharmaceutical co-crystals. J. Pharm. Sci. 2006, 95, 499–516. [Google Scholar] [CrossRef] [PubMed]
  10. Archakov, A.I.; Guseva, M.K.; Uchaykin, V.F.; Ipatova, O.M.; Dochshitsin, Y.F.; Tikhonova, Y.G.; Medvedeva, N.V.; Prozorovsky, V.N.; Strekalova, O.S.; Shironin, A.V. Pharmaceutical composition containing arbidol in the form of phospholipid nanoparticles. U.S. Patent 20120052099 A1, 1 March 2012. [Google Scholar]
  11. Brooks, M.J.; Burtseva, E.J.; Ellery, P.J.; Marsh, G.A.; Lew, A.M.; Slepushkin, A.N.; Crowe, S.M.; Tannock, G.A. Antiviral activity of arbidol, a broad-spectrum drug for use against respiratory viruses, varies according to test conditions. J. Med. Virol. 2012, 84, 170–181. [Google Scholar] [CrossRef] [PubMed]
  12. Semenenko, T.A.; Sel’kova, E.P.; Gotvianskaia, T.P.; Gaidarenko, A.D.; Polezhaeva, N.A.; Evseeva, L.F.; Nikolaeva, O.G. Characteristics of the immune status in specific and nonspecific prophylaxis of influenza in elderly persons. Zhurnal Mikrobiologii Epidemiologii I Immunobiologii 2005, 6, 24–28. (in Russian). [Google Scholar]
  13. Blaising, J.; Polyak, S.J.; Pécheur, E.-I. Arbidol as a broad-spectrum antiviral: An update. Antiviral Res. 2014, 107, 84–94. [Google Scholar] [CrossRef] [PubMed]
  14. Gatich, R.Z.; Kolobukhina, L.V.; Vasil’ev, A.N.; Isaeva, E.I.; Burtseva, E.I.; Orlova, T.G.; Voronina, F.V.; Kol’tsov, V.D.; Malinovskaia, V.V. Viferon suppositories in the treatment of influenza in adult. Antibiot. Khimioter. 2008, 53, 13–17. (in Russian). [Google Scholar] [PubMed]
  15. Kolobukhina, L.V.; Malinovskaia, V.V.; Gatich, R.Z.; Merkulova, L.N.; Burtseva, E.I.; Isaeva, E.I.; Parshina, O.V.; Guseva, T.S.; Orlova, T.G.; Voronina, F.V. Evaluation of the efficacy of viferon and arbidol in adult influenza. Vopr. Virusol. 2008, 53, 31–33. (in Russian). [Google Scholar] [PubMed]
  16. Leneva, I.A.; Shuster, A.M. Antiviral etiotropic chemicals: Efficacy against influenza A viruses A subtype H5N1. Vopr. Virusol. 2006, 51, 4–7. (in Russian). [Google Scholar] [PubMed]
  17. Arastoo, M.; Khorram Khorshid, H.R.; Radmanesh, R.; Gharibdoust, F. Combination of IMOD™ and Arbidol to increase their immunomodulatory effects as a novel medicine to prevent and cure influenza and some other infectious diseases. J. Med. Hypotheses Ideas 2014, 8, 53–56. [Google Scholar] [CrossRef]
  18. Glushkov, R.G. Arbidol antiviral, immunostimulant, interferon inducer. Drug Future 1992, 17, 1079–1081. [Google Scholar] [CrossRef]
  19. Vorobei, A.M.; Pokrovskiy, O.I.; Ustinovich, K.B.; Krotova, L.I.; Parenago, O.O.; Lunin, V.V. Effect of solvent type and concentration on size and morphology of arbidol microparticles obtained by supercritical antisolvent precipitation. Supercrit. Fluids Theory Pract. 2015, 10, 51–59. (in Russian). [Google Scholar]
  20. Eropkin, M.Y.; Solovskii, M.V.; Smirnova, M.Y.; Bryazzhikova, T.S.; Gudkova, T.M.; Konovalova, N.I. Synthesis and biological activity of water-soluble polymer complexes of arbidol. Pharm. Chem. J. 2009, 43, 563–567. [Google Scholar] [CrossRef]
  21. Babkin, V.A.; Kiselev, O.I. Method for Preparing Antiviral Water-Soluble Polymer Complexes of Arbidol. RU Patent 2475255C1, 20 February 2013. [Google Scholar]
  22. Orola, L.; Sarcevica, I.; Kons, A.; Actins, A.; Veidis, M.V. Conformation of the umifenovir cation in the molecular and crystal structures of four carboxylic acid salts. J. Mol. Struct. 2014, 1056–1057, 63–69. [Google Scholar] [CrossRef]
  23. Surov, A.O.; Manin, A.N.; Churakov, A.V.; Perlovich, G.L. New solid forms of the antiviral drug arbidol: Crystal structures, thermodynamic stability, and solubility. Mol. Pharm. 2015, 12, 4154–4165. [Google Scholar] [CrossRef] [PubMed]
  24. Childs, S.L.; Hardcastle, K.I. Cocrystals of piroxicam with carboxylic acids. Cryst. Growth Des. 2007, 7, 1291–1304. [Google Scholar] [CrossRef]
  25. Tsutsumi, S.; Iida, M.; Tada, N.; Kojima, T.; Ikeda, Y.; Moriwaki, T.; Higashi, K.; Moribe, K.; Yamamoto, K. Characterization and evaluation of miconazole salts and cocrystals for improved physicochemical properties. Int. J. Pharm. 2011, 421, 230–236. [Google Scholar] [CrossRef] [PubMed]
  26. Tong, W.-Q. Salt screening and selection: New challenges and considerations in the modern pharmaceutical research and development paradigm. In Developing Solid Oral Dosage Forms. Pharmaceutical Theory and Practice; Qiu, Y., Chen, Y., Zhang, G.G.Z., Eds.; Academic Press: New York, NY, USA, 2009; pp. 75–86. [Google Scholar]
  27. Berendsen, B.J.A.; Wegh, R.S.; Essers, M.L.; Stolker, A.A.M.; Weigel, S. Quantitative trace analysis of a broad range of antiviral drugs in poultry muscle using column-switch liquid chromatography coupled to tandem mass spectrometry. Anal. Bioanal. Chem. 2012, 402, 1611–1623. [Google Scholar] [CrossRef] [PubMed]
  28. Bhogala, B.R.; Basavoju, S.; Nangia, A. Tape and layer structures in cocrystals of some di- and tricarboxylic acids with 4,4′-bipyridines and isonicotinamide. From binary to ternary cocrystals. CrystEngComm 2005, 7, 551–562. [Google Scholar] [CrossRef]
  29. Childs, S.L.; Stahly, G.P.; Park, A. The salt-cocrystal continuum: the influence of crystal structure on ionization state. Mol. Pharm. 2007, 4, 323–338. [Google Scholar] [CrossRef] [PubMed]
  30. Cruz-Cabeza, A.J. Acid-base crystalline complexes and the pKa Rule. CrystEngComm 2012, 14, 6362–6365. [Google Scholar] [CrossRef]
  31. Etter, M.C. Encoding and Decoding Hydrogen-Bond Patterns of Organic Compounds. Acc. Chem. Res. 1990, 23, 120–126. [Google Scholar] [CrossRef]
  32. Bernstein, J.; Davis, R.E.; Shimoni, L.; Chang, N.-L. Patterns in Hydrogen Bonding: Functionality and Graph Set Analysis in Crystals. Angew. Chem. Int. Ed. Engl. 1995, 34, 1555–1573. [Google Scholar] [CrossRef]
  33. Tilborg, A.; Norberg, B.; Wouters, J. Pharmaceutical salts and cocrystals involving amino acids: A brief structural overview of the state-of-art. Eur. J. Med. Chem. 2014, 74, 411–426. [Google Scholar] [CrossRef] [PubMed]
  34. Li, Z.J.; Abramov, Y.; Bordner, J.; Leonard, J.; Medek, A.; Trask, A.V. Solid-State Acid-Base Interactions in Complexes of Heterocyclic Bases with Dicarboxylic Acids: Crystallography, Hydrogen Bond Analysis, and 15N NMR Spectroscopy. J. Am. Chem. Soc. 2006, 128, 8199–8210. [Google Scholar] [CrossRef] [PubMed]
  35. Reddy, L.S.; Bethune, S.J.; Kampf, J.W.; Rodríguez-Hornedo, N. Cocrystals and Salts of Gabapentin: pH Dependent Cocrystal Stability and Solubility. Cryst. Growth Des. 2009, 9, 378–385. [Google Scholar] [CrossRef]
  36. Patel, J.R.; Carlton, R.A.; Needham, T.E.; Chichester, C.O.; Vogt, F.G. Preparation, structural analysis, and properties of tenoxicam cocrystals. Int. J. Pharm. 2012, 436, 685–706. [Google Scholar] [CrossRef] [PubMed]
  37. Thomas, L.H.; Klapwijk, A.R.; Wales, C.; Wilson, C.C. Intermolecular hydrogen transfer and solubility tuning in multi-component molecular crystals of the API piroxicam. CrystEngComm 2014, 16, 5924–5932. [Google Scholar] [CrossRef] [Green Version]
  38. Chernyshev, V.V.; Davlyatshin, D.I.; Shpanchenko, R.V.; Nosyrev, P.V. Structural Characterization of Arbidol®. Z. Kristallogr. 2011, 226, 832–836. [Google Scholar] [CrossRef]
  39. Perlovich, G.L. Thermodynamic characteristics of cocrystal formation and melting points for rational design of pharmaceutical two-component systems. CrystEngComm 2015, 17, 7019–7028. [Google Scholar] [CrossRef]
  40. Babu, N.J.; Nangia, A. Solubility advantage of amorphous drugs and pharmaceutical cocrystals. Cryst. Growth Des. 2011, 11, 2662–2679. [Google Scholar] [CrossRef]
  41. Kumar, S.S.; Nangia, A. A solubility comparison of neutral and zwitterionic polymorphs. Cryst. Growth Des. 2014, 14, 1865–1881. [Google Scholar] [CrossRef]
  42. Yalkowsky, S.H.; Valvani, S.C. Solubility and partitioning I: Solubility of nonelectrolytes in water. J. Pharm. Sci. 1980, 69, 912–922. [Google Scholar] [CrossRef] [PubMed]
  43. Perlovich, G.L.; Ryzhakov, A.M.; Tkachev, V.V.; Hansen, L.Kr.; Raevsky, O.A. Sulfonamide molecular crystals: structure, sublimation thermodynamic characteristics, molecular packing, hydrogen bonds network. Cryst. Growth Des. 2013, 13, 4002–4016. [Google Scholar] [CrossRef]
  44. Aakeröy, C.B.; Fasulo, M.E.; Desper, J. Cocrystal or salt: does it really matter? Mol. Pharm. 2007, 4, 317–322. [Google Scholar] [CrossRef] [PubMed]
  45. Sheldrick, G.M. A Short History of SHELX. Acta Crystallogr. Sect. A Found. Crystallogr. 2008, 64, 112–122. [Google Scholar] [CrossRef] [PubMed]
  46. Sheldrick, G.M. SADABS, Program for Scaling and Correction of Area Detector Data; University of Göttingen: Göttingen, Germany, 1997. [Google Scholar]

