Article

Novel S = 1/2 Kagome Lattice Materials: Cs2TiCu3F12 and Rb2TiCu3F12

by
Lewis J. Downie
1,
Elena I. Ardashnikova
2,
Chiu C. Tang
3,
Alexandre N. Vasiliev
4,5,6,
Peter S. Berdonosov
2,
Valery A. Dolgikh
2,
Mark A. De Vries
7 and
Philip Lightfoot
1,*
1
School of Chemistry and EaStChem, University of St Andrews, St Andrews KY16 9ST, UK
2
Department of Chemistry, M. V. Lomonosov Moscow State University, 119991 GSP-1 Moscow, Russia
3
Diamond Light Source Ltd., Harwell Science and Innovation Campus, Didcot OX11 0DE, UK
4
Department of Low Temperature Physics and Superconductivity, Physics Faculty, M. V. Lomonosov Moscow State University, 119991 GSP-1 Moscow, Russia
5
Theoretical Physics and Applied Mathematics Department, Ural Federal University, 620002 Ekaterinburg, Russia
6
National University of Science and Technology "MISiS", 119049 Moscow, Russia
7
School of Chemistry and EaStChem, University of Edinburgh, Edinburgh EH9 3JZ, UK
*
Author to whom correspondence should be addressed.
Crystals 2015, 5(2), 226-243; https://doi.org/10.3390/cryst5020226
Submission received: 18 March 2015 / Revised: 16 April 2015 / Accepted: 21 April 2015 / Published: 5 May 2015

Abstract

:
Two new members of the A2B′Cu3F12 family of kagome-related materials have been prepared, in order to further understand the crystal-chemical relationships, phase transitions and magnetic behaviour within this family of potentially frustrated S = ½ two-dimensional quantum magnets. Cs2TiCu3F12 adopts a crystal structure with the ideal kagome lattice topology (space group R 3 ¯ m) at ambient temperature. Diffraction studies reveal different symmetry-lowering structural phase transitions in single crystal and polycrystalline forms at sub-ambient temperatures, with the single crystal form retaining rhombohedral symmetry and the powder form being monoclinic. In both cases, long-range antiferromagnetic order occurs in the region 16–20 K. Rb2TiCu3F12 adopts a distorted triclinic structure even at ambient temperatures.

Graphical Abstract

1. Introduction

Magnetic materials adopting crystal structures based on the kagome lattice are of interest as model systems for the study of geometric magnetic frustration [1,2]. Particular interest has been focused on kagome lattice compounds containing S = ½ ions [3,4,5,6]—for example, Cu2+ and V4+—since quantum fluctuations can often compete with the tendency towards long-range magnetic order, leading to unusual magnetic ground states such as quantum spin-liquids (QSLs) or valence-bond solids (VBS). A family of mixed metal fluorides of general composition A2B′B3F12 (B = Cu2+, B′ = a tetravalent cation) [7] has recently received attention due to the observation of an exotic VBS ground state in Rb2SnCu3F12 [8]. The first members of this family to be reported were Cs2ZrCu3F12 and Cs2HfCu3F12, which were found to be structurally analogous to the aristotype Cs2NaAl3F12 at room temperature [9]. This structure type may be considered as a derivative of the pyrochlore structure, with 1:3 ordering of cations on the B-site leading to a layered structure with kagome layers of composition [B3F12] isolated from each other by the tetravalent cations. The aristotype structure has rhombohedral symmetry, space group R 3 ¯ m, and exhibits a structurally “perfect” kagome lattice of co-planar, corner-shared equilateral triangles (Figure 1).
Figure 1. View along the ab-plane (a) and down the c-axis (b) of the aristotype structure of Cs2NaAl3F12.
Crystals 05 00226 g001
The range of substitutions possible at the A and B′ sites of A2B′Cu3F12 have so far been limited to A = Rb+ or Cs+ and B′ = Zr4+, Hf4+, Sn4+ and Ce4+. Earlier crystallographic studies [10] have shown that, although Cs2ZrCu3F12 adopts the aristotype structure at room temperature, a first-order structural phase transition occurs in cooling (~225 K), which may trigger the observed onset of a canted antiferromagnetic state at low temperatures (~24 K) rather than a QSL or other unconventional magnetic ground state. Magnetic studies have also shown long-range order rather than quantum-delocalised states for other members of the family, Cs2HfCu3F12 and Cs2SnCu3F12 [11]. In the case of Cs2ZrCu3F12, the structural phase transition, which breaks the perfection of the S = ½ kagome lattice and leads to a monoclinic unit cell, is related to the increase in Zr4+ coordination from six to seven.
Cs2SnCu3F12 is also found to adopt the aristotype structure at room temperature but again the magnetic data suggest some form of structural transition below ambient temperature (~185 K). The nature of this transition was originally suggested, from single crystal X-ray diffraction (SCXD), to be a doubling of the unit cell a and b parameters [11] (hexagonal setting of the rhombohedral cell) leading to a unit cell similar to that found for Rb2SnCu3F12 (see below). However, a recent powder diffraction study has shown that although there is indeed a distortion of the kagome lattice, the adoption of a monoclinic unit cell occurs. This distortion is different from that found for Cs2ZrCu3F12 and is unrelated to an increase in coordination number at the B′ site; Sn4+ retains octahedral coordination, but an optimisation of bonding at the Sn4+ site is suggested to be the driver [12]. It should be noted that differences have been reported for structural transitions in powder and single crystal samples of Rb2SnCu3F12 [13] and so it is difficult to state whether the inconsistencies between the single crystal and powder studies on Cs2SnCu3F12 are genuine; indeed, as will be seen, this is one of the interesting aspects of this family.
Rb2SnCu3F12 has been previously found [14] to display an imperfect kagome lattice at room temperature. In this case, the unit cell is rhombohedral, space group R 3 ¯ , but doubled in the ab-plane when compared to that reported for Cs2NaAl3F12. This distortion leads to four different Cu2+–Cu2+ distances being present and thus a loss in the perfectly frustrated triangular environment. The reasons behind this slightly different structure are most likely related to the smaller size of Rb+ as compared to Cs+. There is also a disorder relating to the positions some of the F ions, which is found to be independent of temperature [13] Magnetically, Rb2SnCu3F12 has generated the most interest as it shows a very unusual VBS ground state reminiscent of a “pinwheel” [8]. Structurally, Rb2SnCu3F12 shows particularly unusual behaviour; for powder samples at temperatures below ambient, a structurally re-entrant phase transition is observed, with the intermediate phase being a complex triclinic unit cell. This is not the case for single crystals, however, making the exact nature of the intermediate phase challenging to ascertain [13].
The largest reported B′ cation is Ce4+ [15]. At room temperature, there is a major “corrugation” distortion of the kagome layer, caused by the coordination requirements of the larger Ce4+, which in this case is eight-coordinated. This inherent distortion leads to a complex ferromagnetically-ordered structure that is far removed from the highly frustrated ground state of interest.
As this brief review of the A2B′Cu3F12 family shows, there is a large degree of substitutional flexibility in this structure type that leads to a number of significantly different structural (and magnetic) behaviours. Further variation of the constituent ions may lead to a material that retains its ideal kagome lattice down to the lowest temperatures, thus improving the chances of finding exotic magnetic ground states related to extreme frustration. When B′ increases in size (for Cs2 B′Cu3F12, B′ = Zr4+, Hf4+ and Ce4+), it is clear that the perfect kagome lattice is lost, due to the coordination demands of such large cations. When B′ is relatively large, but cannot support greater than six-coordinate environments (Cs2SnCu3F12), there appear to be other more subtle factors that encourage symmetry-breaking of the kagome lattice. On the contrary, if A is too small (Rb2SnCu3F12) there is also the presence of a distortion. This complex interplay of cation size matching, which apparently dictates structural distortion away from the ideal kagome geometry, with subsequent loss of magnetic frustration, has motivated us to expand the range of known members of this family. By decreasing the size of the B′ cation further, i.e., by incorporation of Ti4+, we have now produced the two novel materials Cs2TiCu3F12 and Rb2TiCu3F12. These represent the extremes of A/B′ cation size ratio and minimum A and B′ absolute cation size, respectively.

2. Results and Discussion

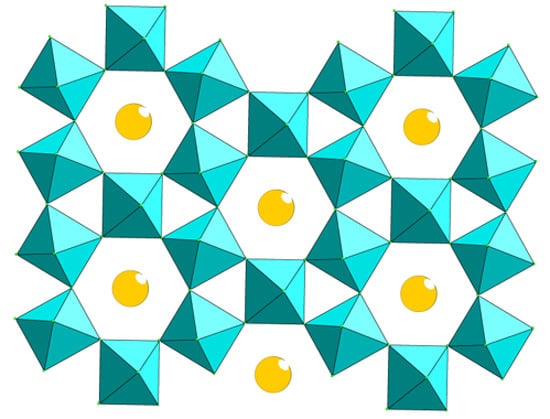
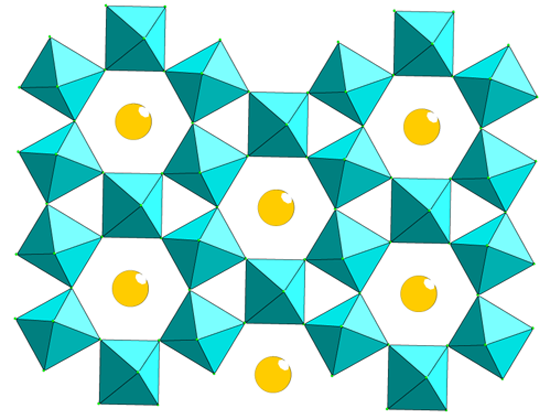
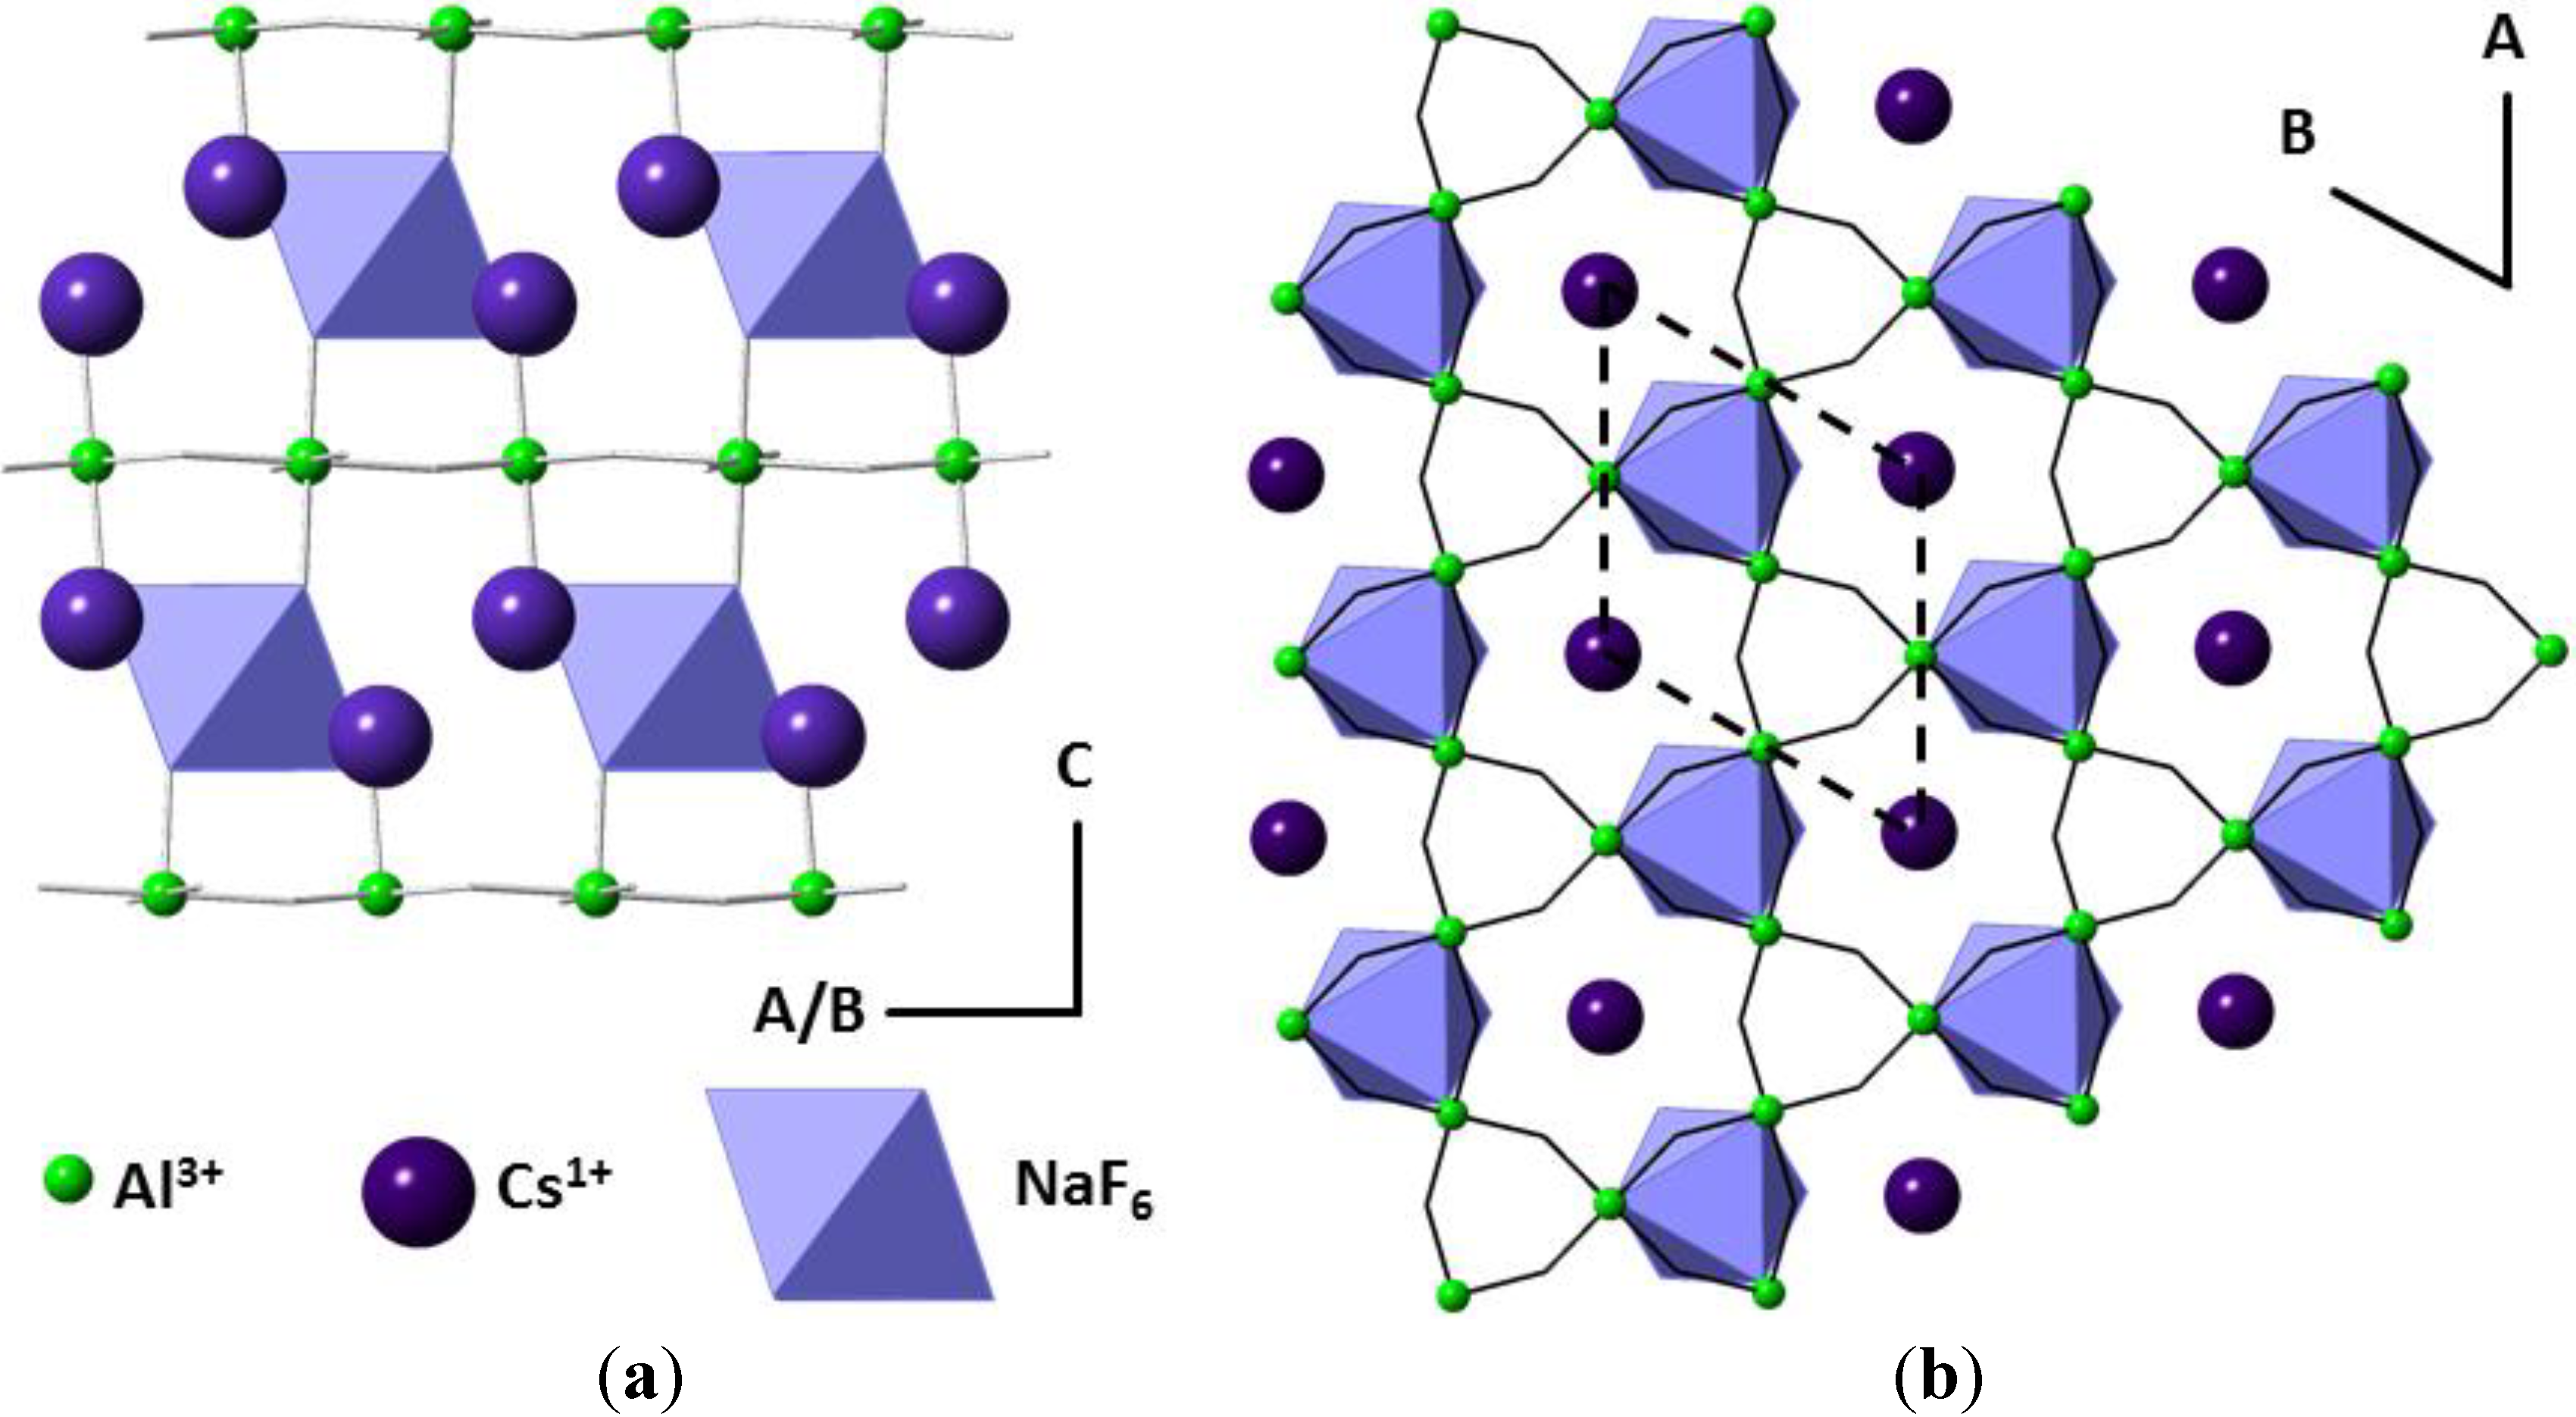
2.1. Single Crystal X-ray Diffraction of Cs2TiCu3F12

Cs2TiCu3F12 was obtained in the form of single crystals, and these were subject to SCXD analysis (further details are provided in ESI, Table S1). As expected, the lattice parameters are smaller than those found for other members of the Cs2 B′Cu3F12 family and there is a particular reduction in the c-axis direction (Table 1).
Table 1. Lattice parameters (and Shannon radii) for the title compound and the three other reported members of the Cs2 B′Cu3F12 family, in space group R 3 ¯ m at room temperature.
M4+Ionic Radius [16]a (Å)c (Å)
Ti4+0.6057.1014(14)19.955(2)
Sn4+ (11)0.697.142(4)20.381(14)
Hf4+ (11)0.717.16320.49
Zr4+ (11)0.727.16620.46
At room temperature, the structure is found to be similar to that described for single crystals of Cs2SnCu3F12 (Table S2 in ESI). A comparison of bonding geometries (Table 2) reveals that the accommodation of the significantly smaller TiF6 octahedron causes only small changes in CuF6 geometry, but does lead to a significant shift of the Cs+ cation of approximately 0.1 Å along the c-axis, i.e., the Cs+ ion moves out of the hexagonal kagome “pore” and towards the smaller TiF6 octahedron (Figure 2). The Cs–Cs distance for the Ti4+ case is 4.4220(12) Å and for Sn4+ it is 4.317(3) Å.
Table 2. Metal—fluorine bonds and Cu–Cu distances (Å) for Cs2TiCu3F12 and Cs2SnCu3F12 (R 3 ¯ m model at room temperature).
BondCs2TiCu3F12Cs2SnCu3F12 [11]
Cs–F1 (×3)3.101(4)3.124(2)
Cs–F2 (×3)3.352(4)3.411(2)
Cu–F1 (×4)1.9037(14)1.8969(11)
Cu–F2 (×2)2.333(4)2.346(2)
M4+–F2 (×6)1.864(4)1.9527(15)
Cu–Cu (×4)3.5513.571
On cooling to 125 K, it is found that a phase transition has occurred. The unit cell is found to have doubled in the ab-plane and the symmetry reduced to R 3 ¯ (comparative refinements in the higher symmetry R 3 ¯ m gave significantly poorer fits), which is similar to that reported previously in reduced temperature single crystal studies of Cs2SnCu3F12 [11]. It was indeed anticipated that there would be a greater similarity between the Ti4+ system and the Sn4+ system, rather than the Zr4+ analogue, as the phase transition in the latter is driven by a requirement for Zr4+ to attain seven-coordination. This was not expected for either of the smaller B′ cations. This observed low-temperature superlattice is similar to that reported for Rb2SnCu3F12 at room temperature; however, in the present case there is no disorder of the fluorine atoms, as is found for Rb2SnCu3F12 (ESI, Figure S1).
Figure 2. Hexagonal pore through the kagome lattice; the dashed line links the two opposing Cs+ ions.
Crystals 05 00226 g002
We suggested that for Cs2SnCu3F12 the low temperature phase transition was motivated by Sn4+ being over-bonded; through the phase transition the Sn–F bond length increased thus partially relieving this over-bonding. For Cs2TiCu3F12 this is also found to be partially the case—some Ti–F bond lengths are longer for the 125 K structure. For the coordination sphere of Ti1, there has been a small decrease in bond length but for the more prevalent Ti2 (3 × per unit cell) there has been an increase (Table 3). This leads to an overall slight decrease in BVS (also, Table 3).
Table 3. Ti–F bond distances for Cs2TiCu3F12 as found from SCXD at room temperature (R 3 ¯ m) and 125 K (R 3 ¯ ) and BVS for Ti4+ atoms at both room temperature and 125 K, calculated using VaList [17].
RT125 K
BondDistance (Å)BondDistance (Å)
Ti1–F2 (×6)1.864(4)Ti1–F5 (×6)1.863(9)
Ti2–F7 (×2)1.871(9)
Ti2–F6 (×2)1.871(7)
Ti2–F8 (×2)1.872(8)
AtomBVSAtomBVS
Ti14.53Ti14.72
Ti24.33
Average4.53Average4.43
Qualitatively, there is a skewing of the kagome lattice which gives rise to two different Cu sites (1:1 ratio) and two different Cu3 triangles (3:1 ratio), one of which remains strictly equilateral (Cu···Cu = 3.551 Å; equal to that at room temperature), and the other with to three distinct Cu···Cu distances (range 3.51–3.57 Å). The degree of distortion is therefore not as great as that seen in Rb2SnCu3F12. This is correlated with the rotations of the TiF6 octahedra around the c-axis; 3/4 are rotated one way and 1/4 are rotated in the opposite sense (Figure 3). This octahedral rotation lowers the symmetry from R 3 ¯ to R 3 ¯ m.
Figure 3. Structure of Cs2TiCu3F12 in the low-temperature R 3 ¯ phase. Note the rotations of the TiF6 octahedra (foreground) against Cu–F kagome background; a quarter of TiF6 octahedra are rotated in a contrary sense.
Crystals 05 00226 g003

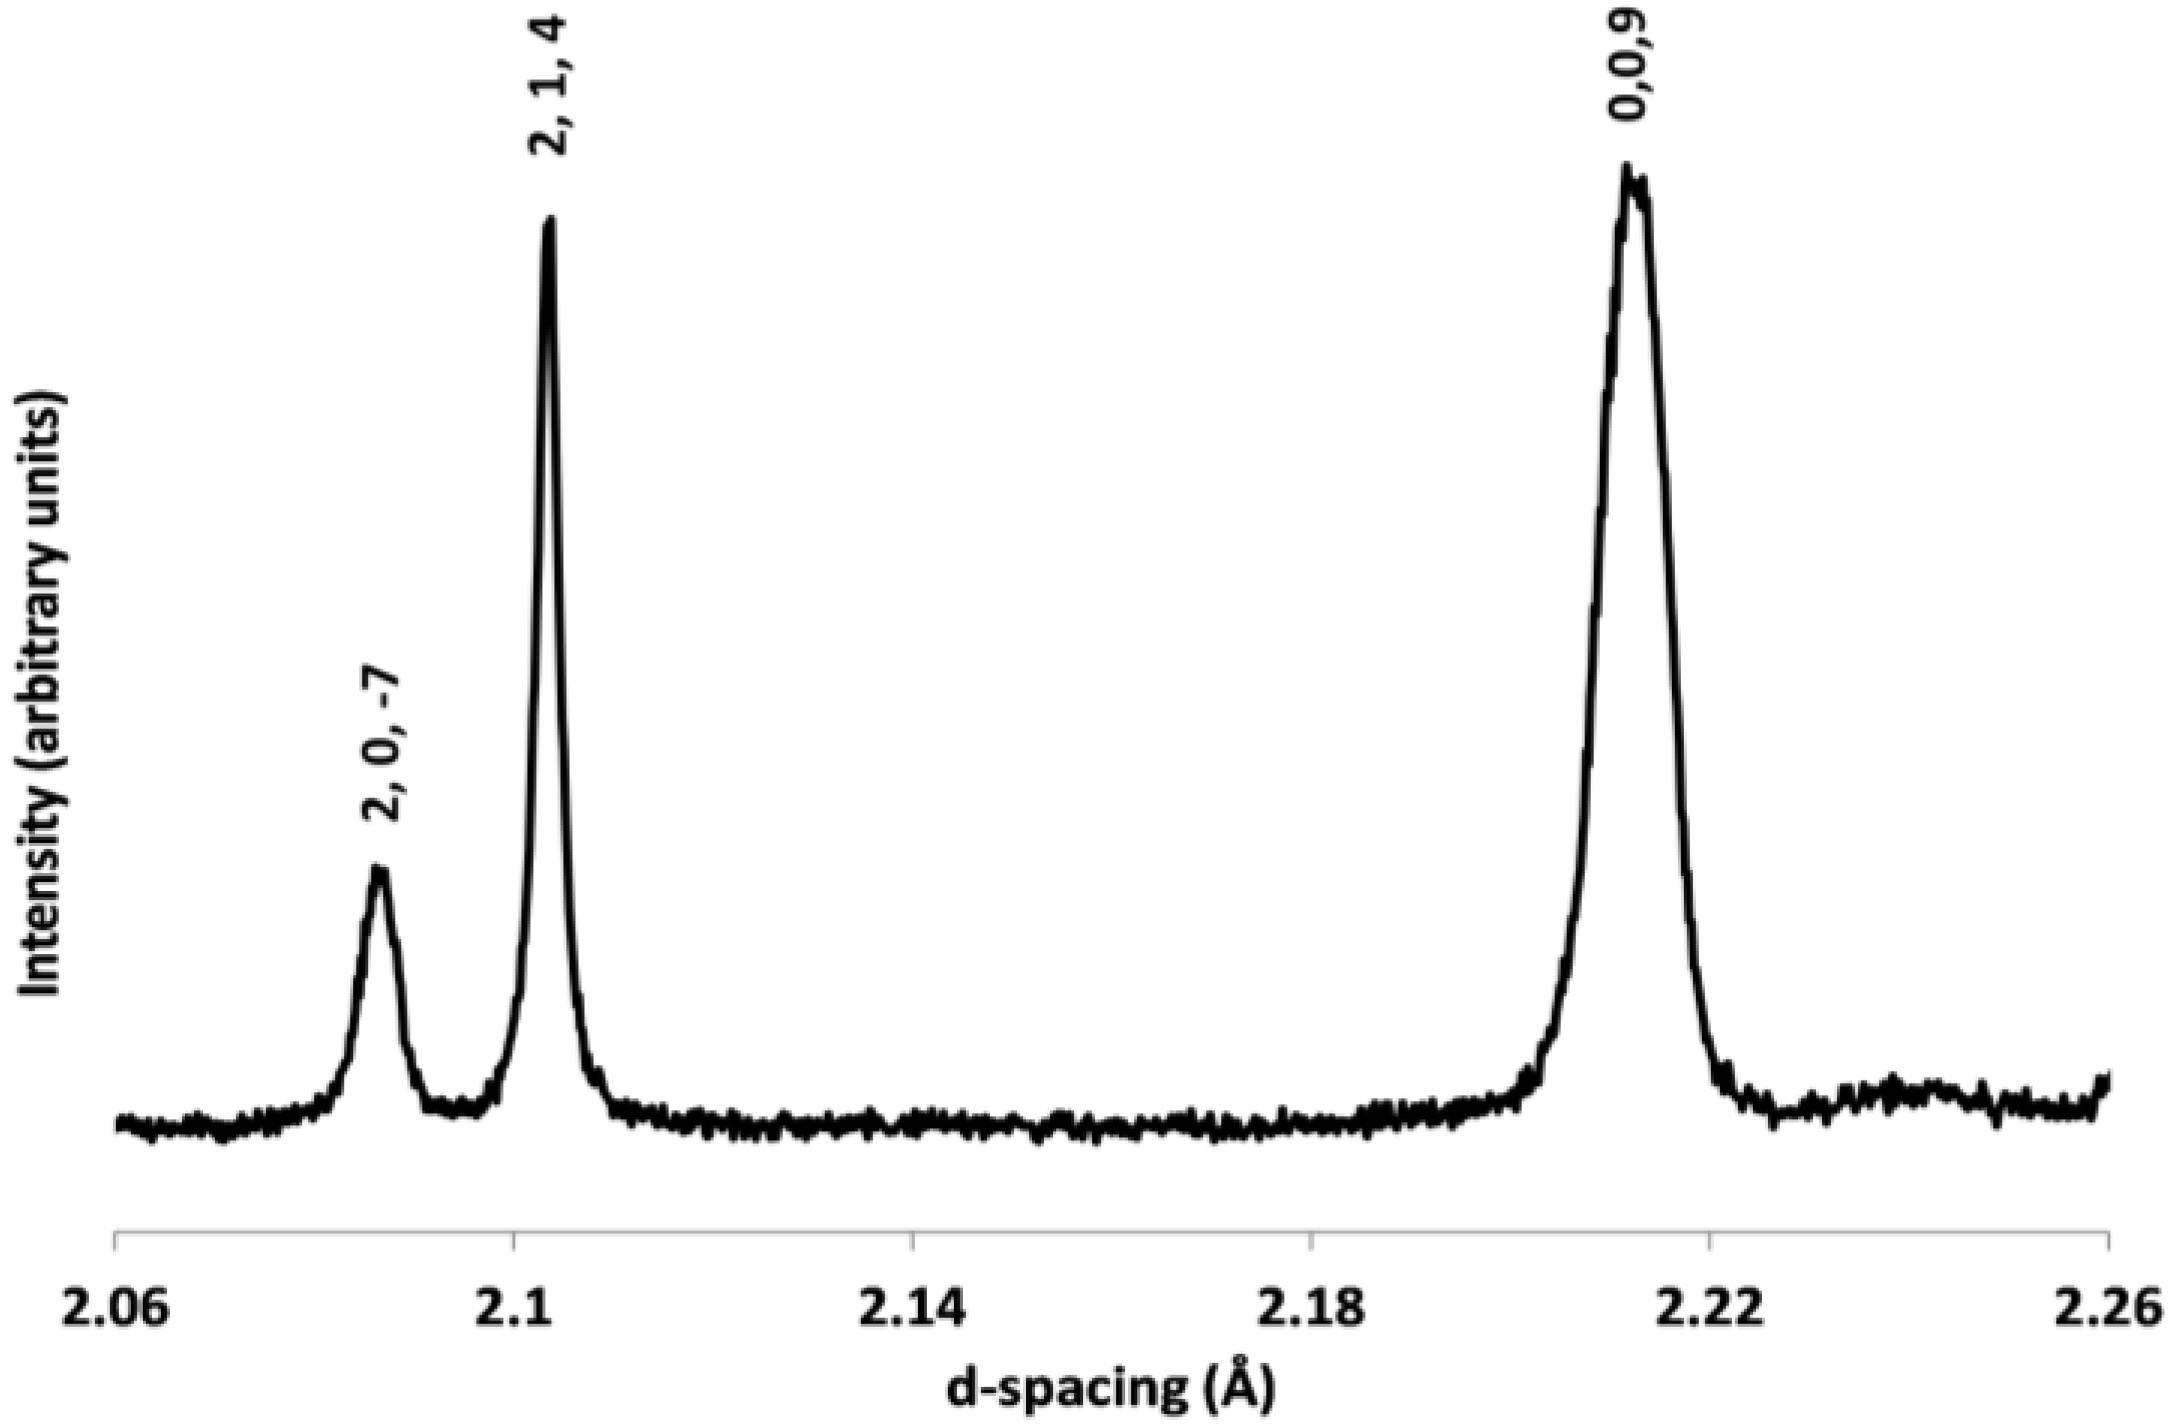
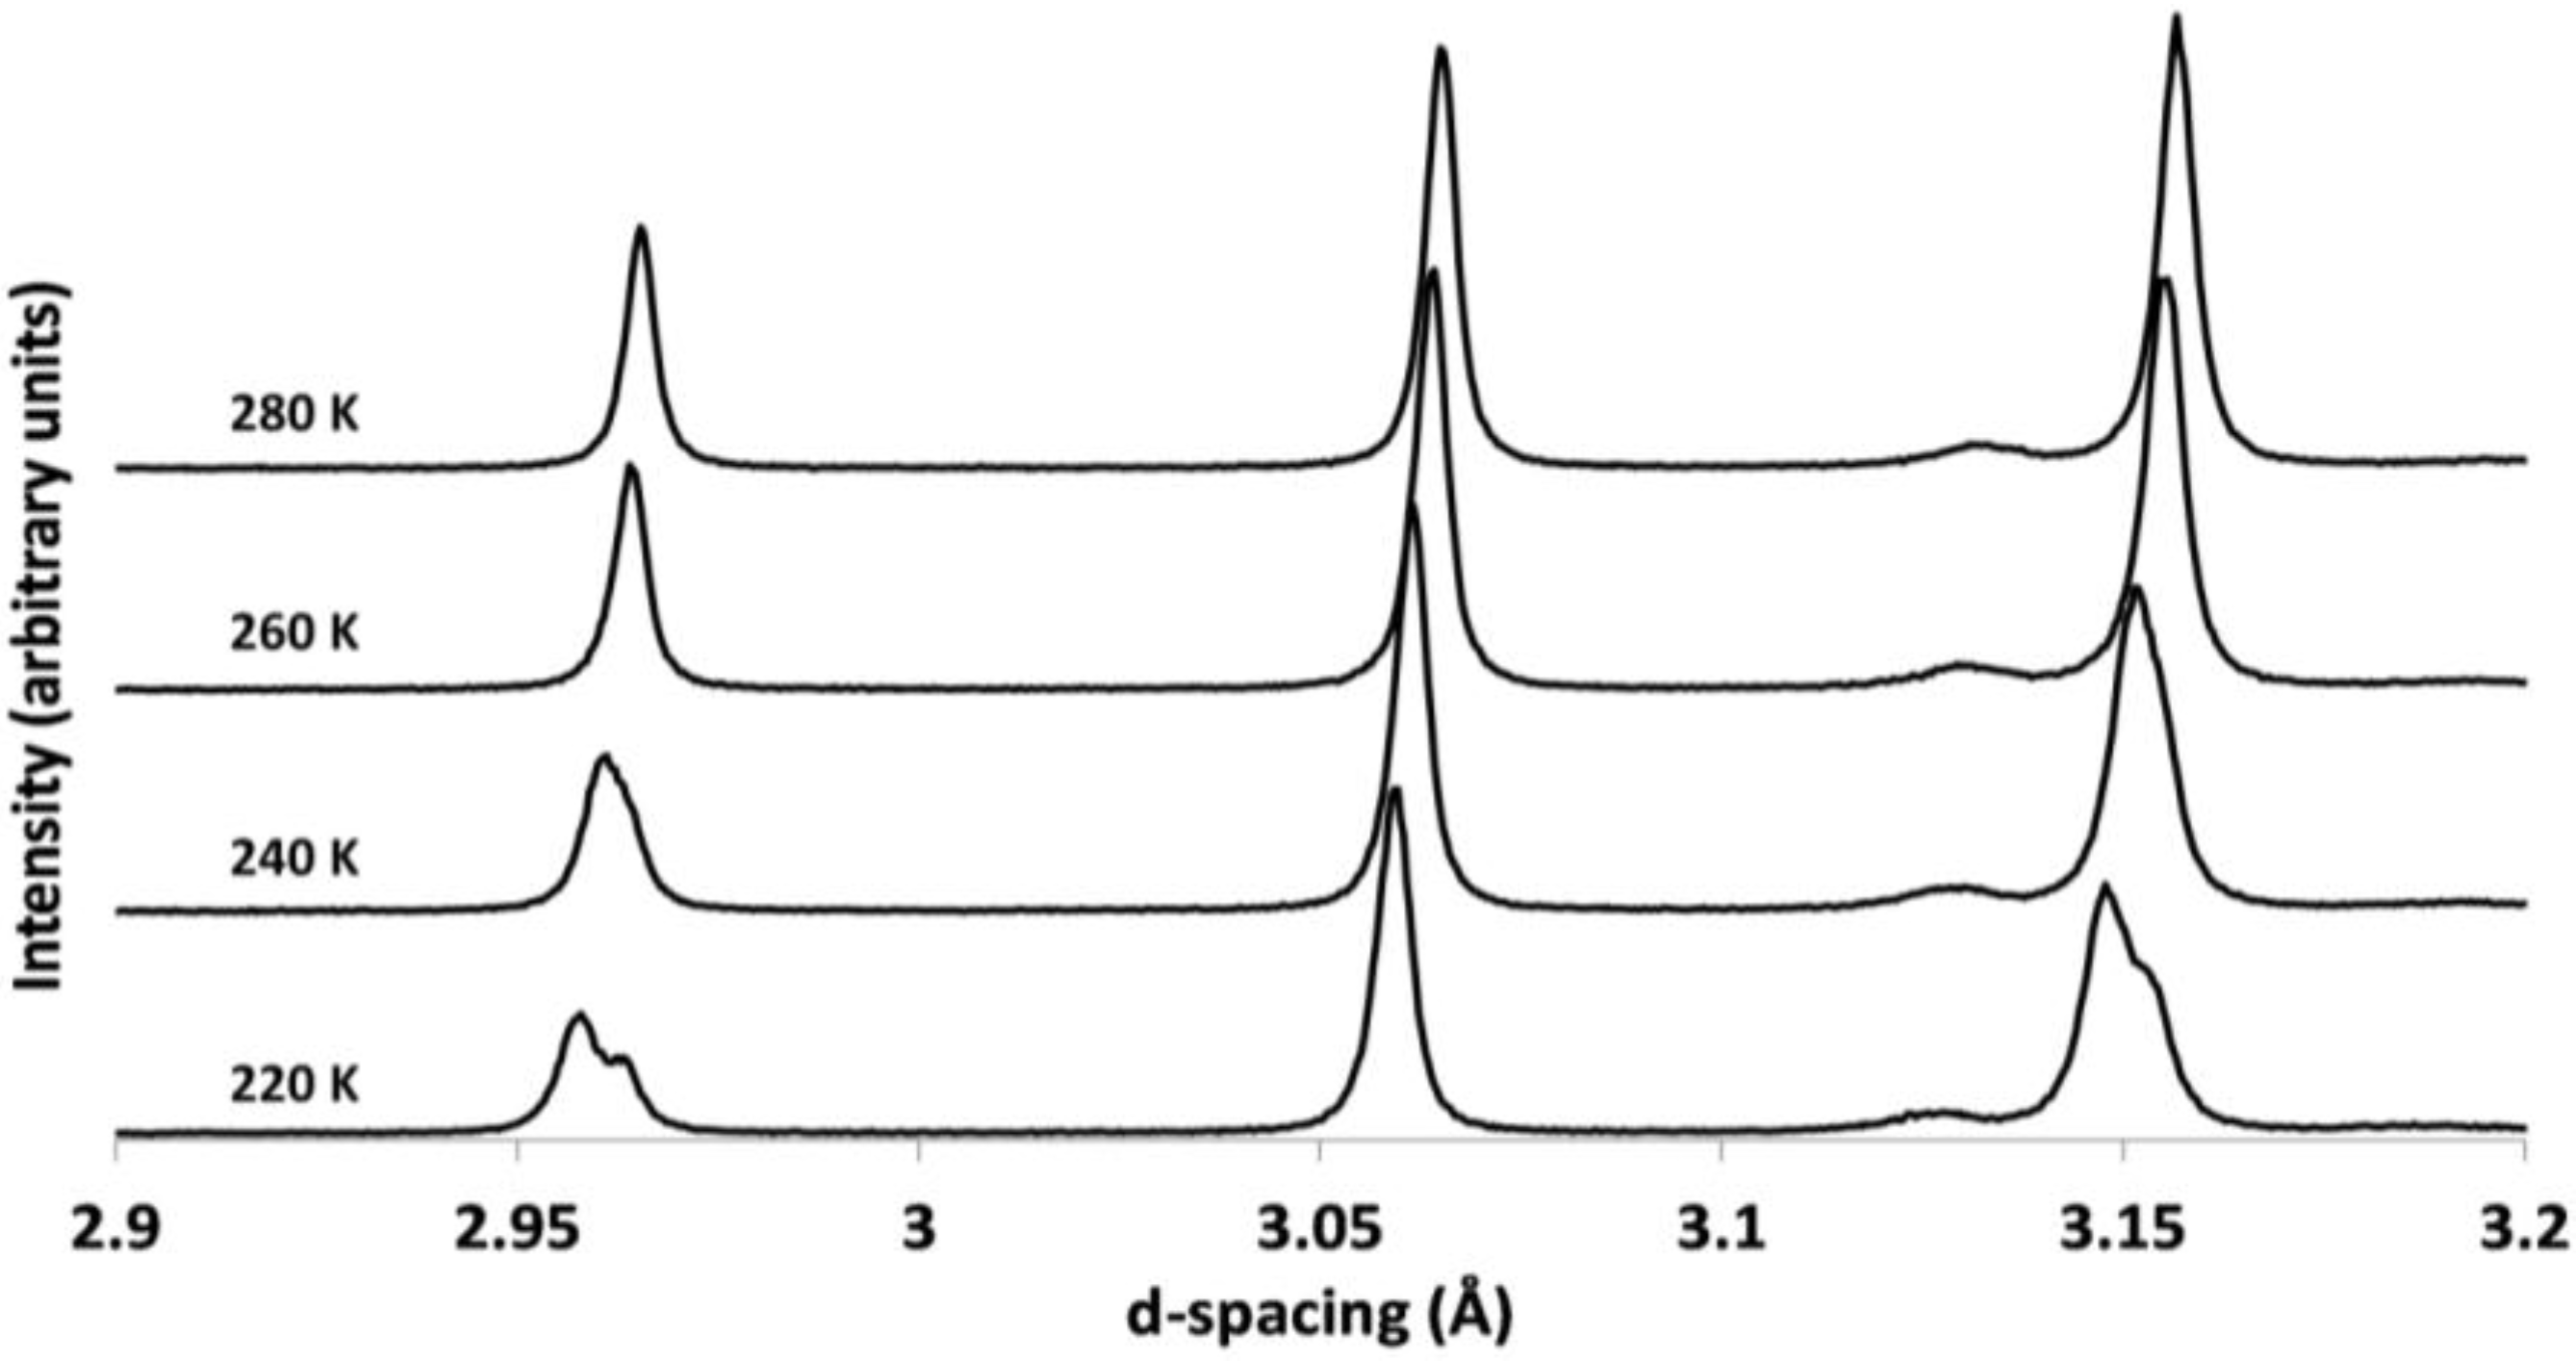
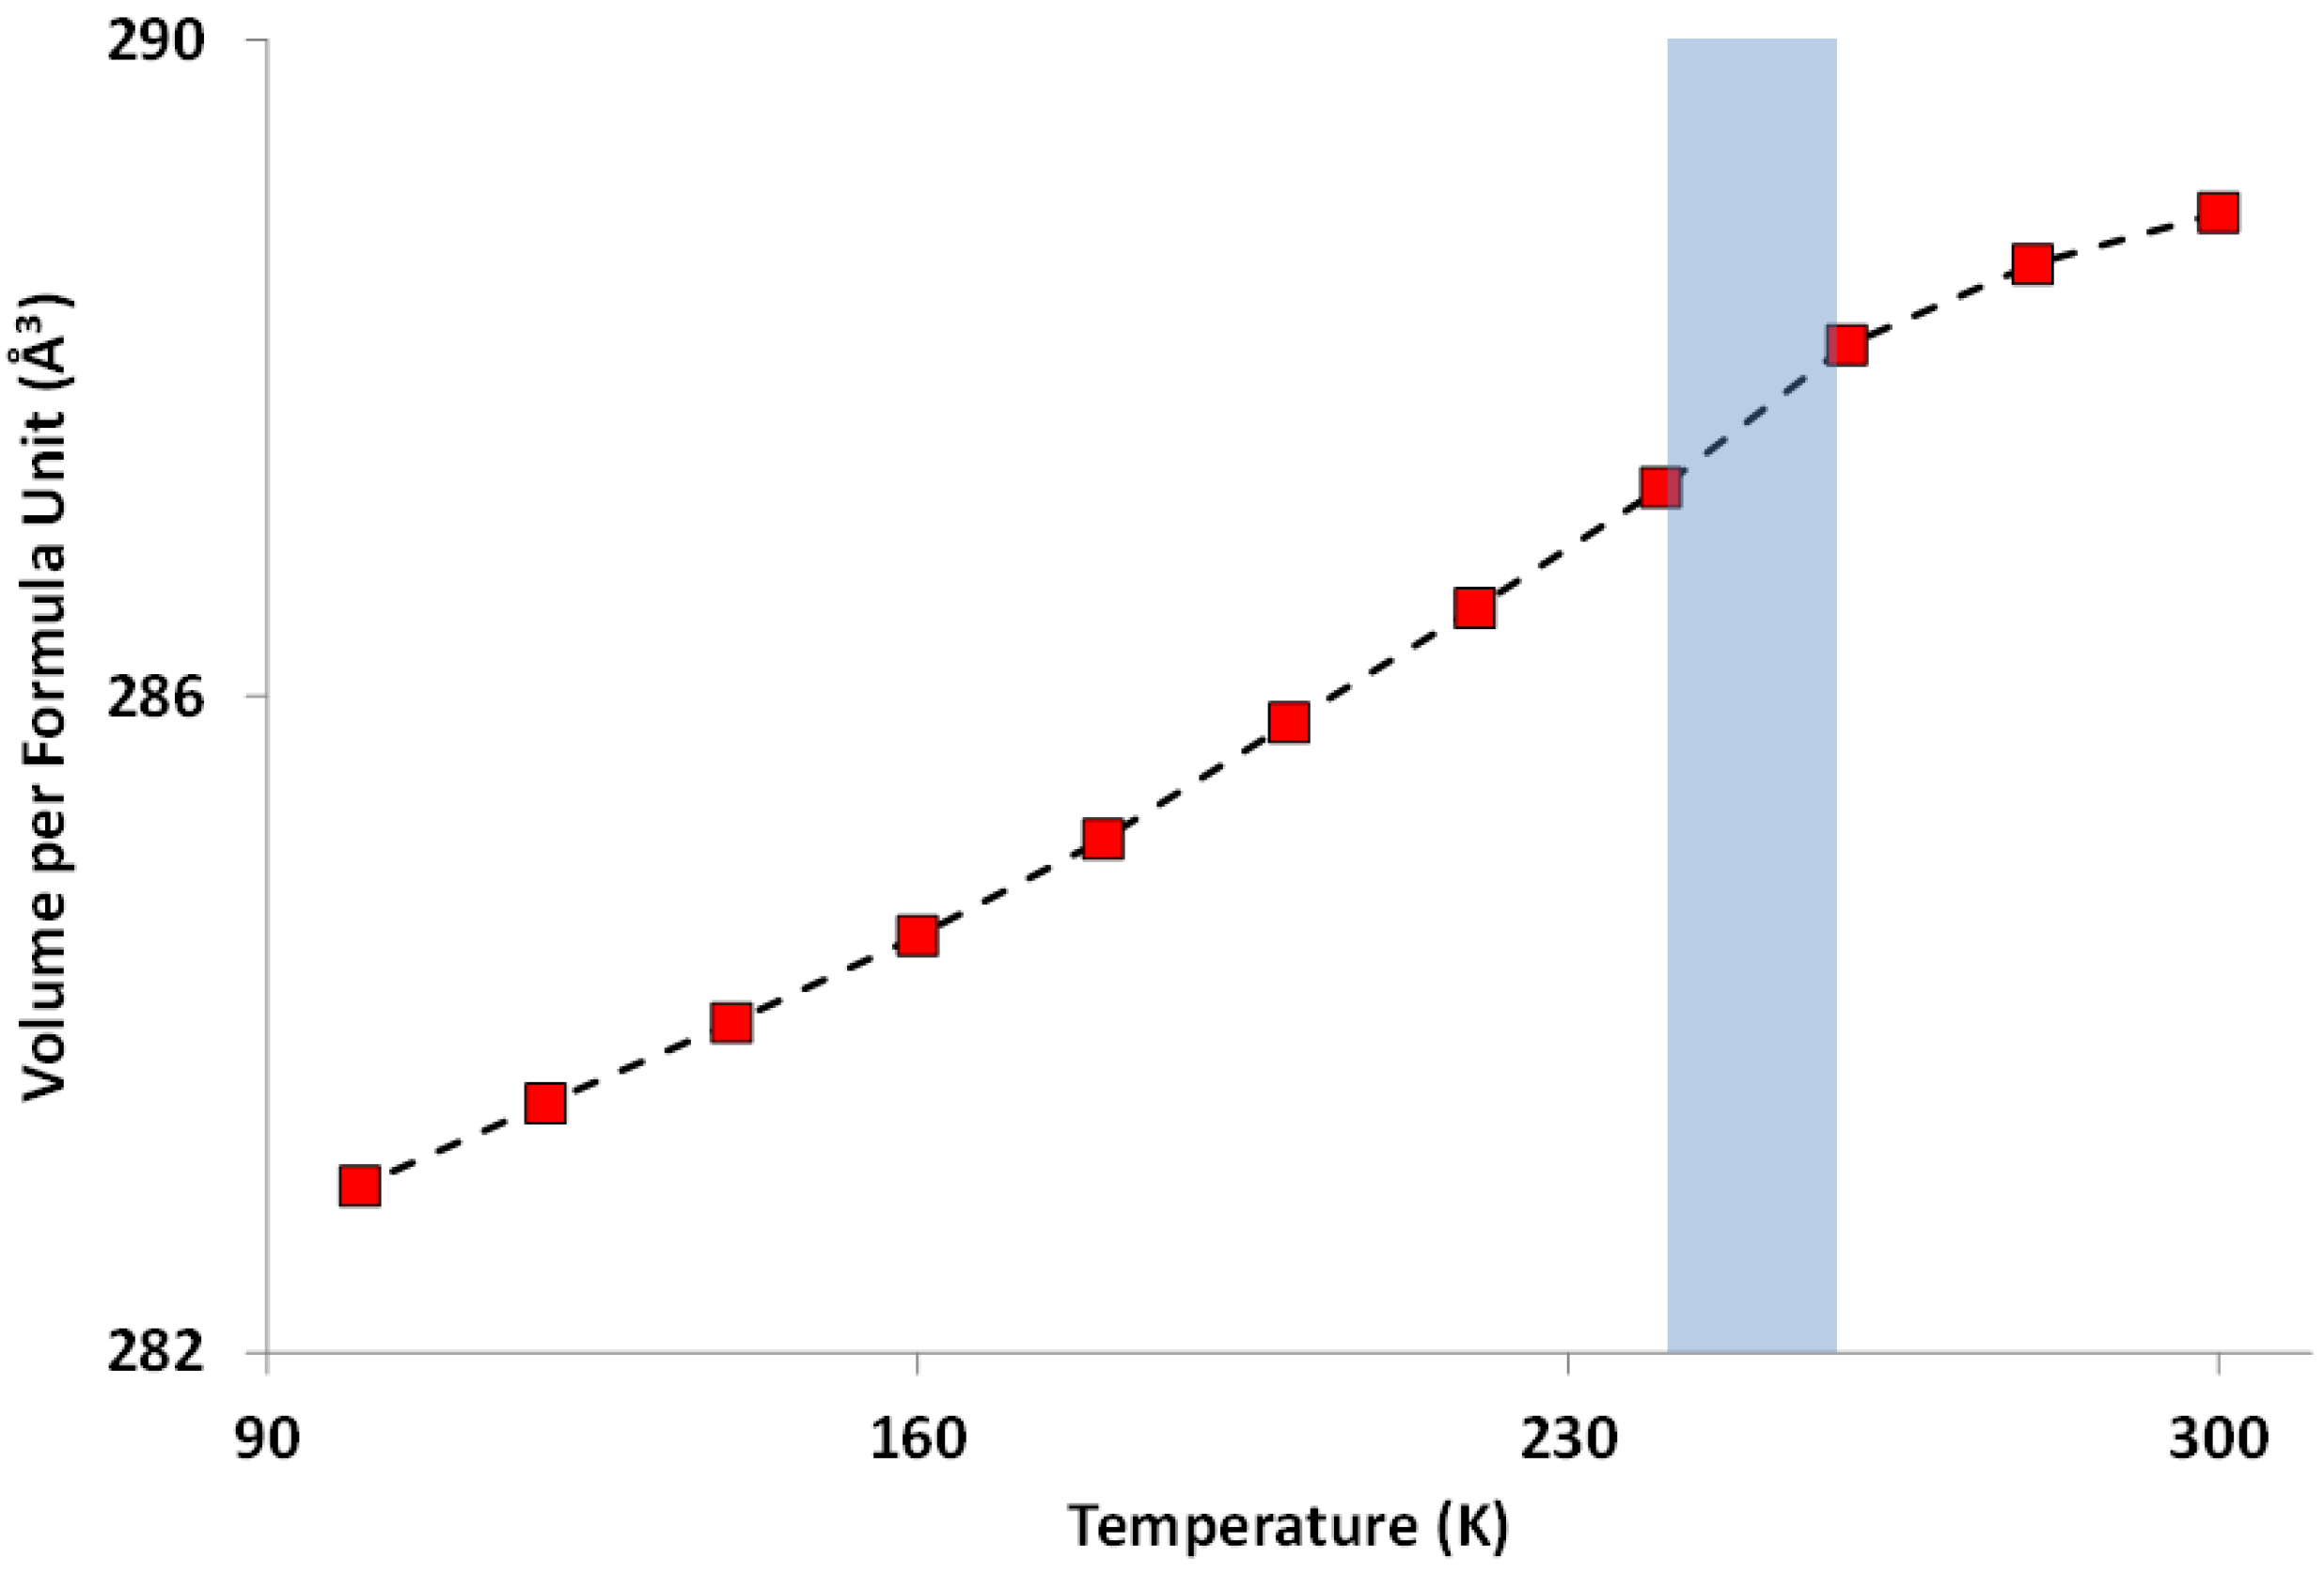
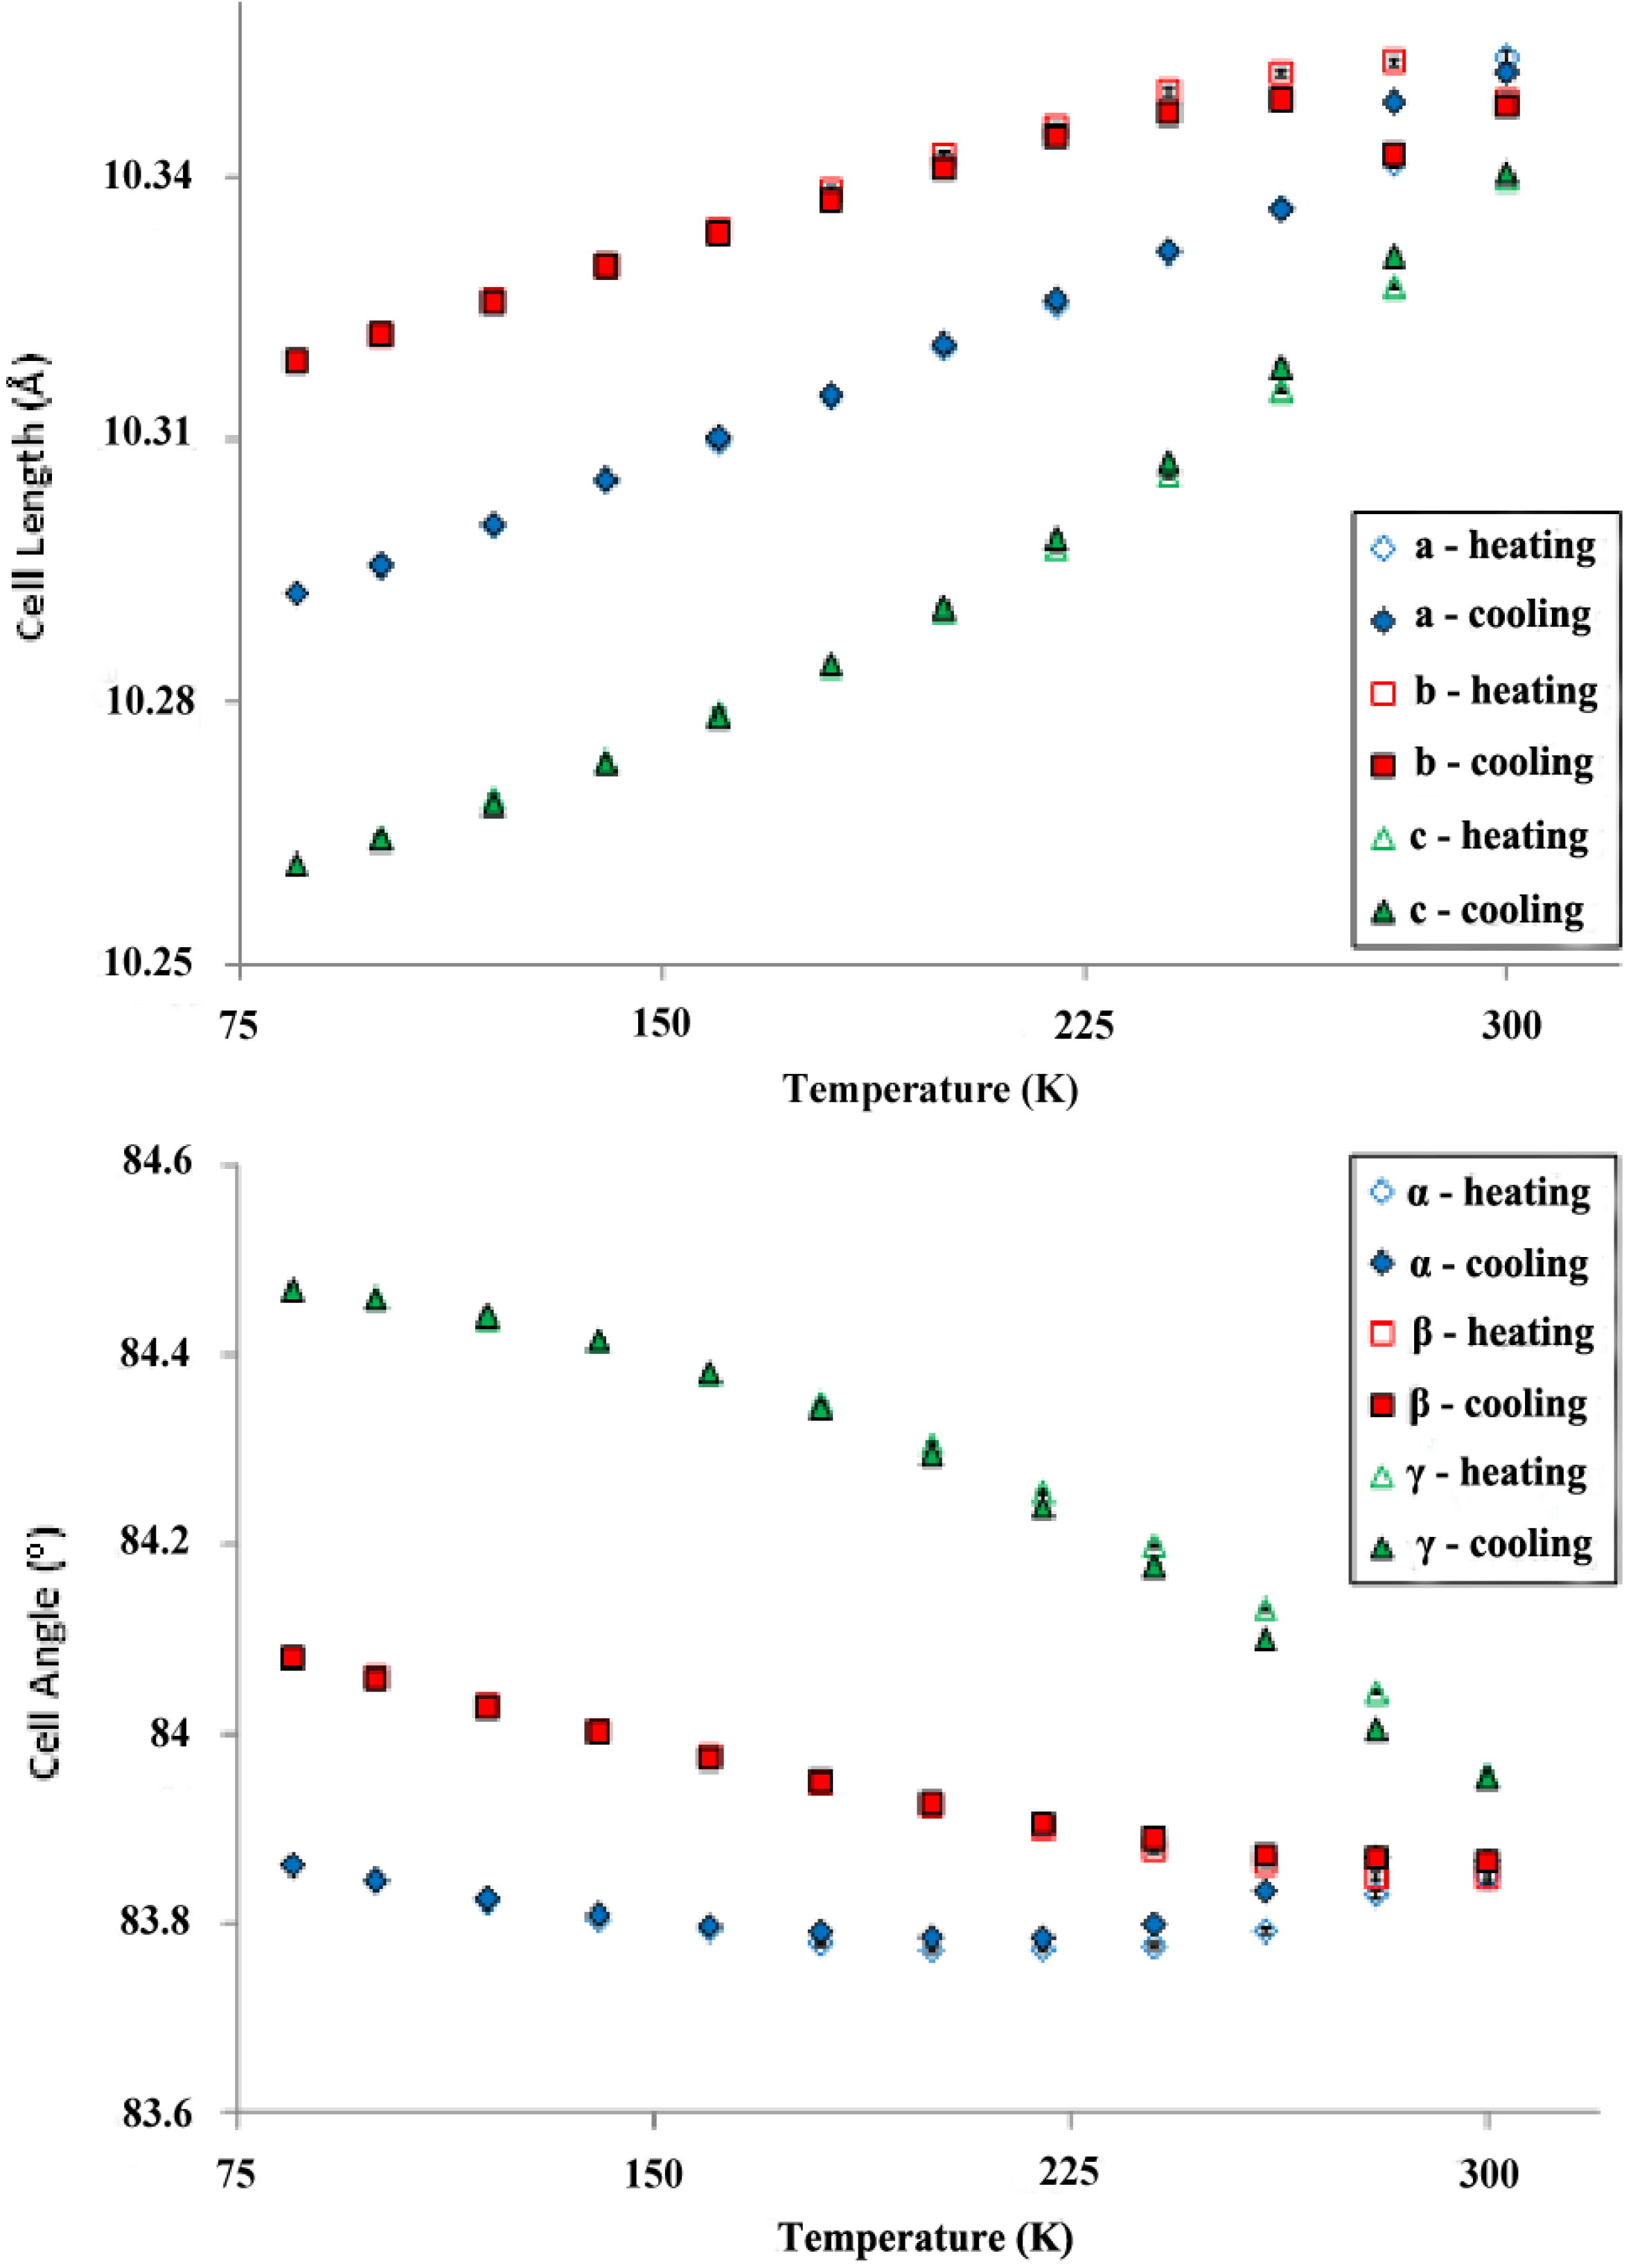
2.2. Powder Diffraction Study of Cs2TiCu3F12

In order to reveal further details about the nature of the phase transition found for the single crystal, a powder X-ray diffraction (PXRD) study was carried out. At room temperature, the single crystal model of Cs2TiCu3F12, as reported above was confirmed, with lattice parameters, from PXRD, a = 7.090321(18) Å and c = 19.91021(9) Å. This model also provides an excellent fit to the neutron powder diffraction (NPD) data. Details of these refinements, and examples of Rietveld fits, are presented in Table S3 and Figure S2. There is very little difference in the structures determined by the three diffractometry methods used. Synchrotron X-ray powder diffraction (SXPD), however, shows some interesting artefacts relating to the sample morphology. Anisotropic peak broadening is apparent (Figure 4) and has been taken into account using a technique developed by Stephens [18] and implemented using the GSAS program. The broadening is particularly accentuated on the (003), (006) and (009) peaks which is indicative of a platy morphology Use of the Scherrer formula allows the calculation of an approximate particle size; from the (003) peak it is found the particle size is ~1200 Å and from the (110) peak the particle size is found to be ~2000 Å.
On reducing the sample temperature to 100 K, there is a clear splitting of some peaks in the SXPD patterns, indicating that there has been a lowering of symmetry. Indexing, using the DICVOL91 program, [19] suggests a monoclinic unit cell with the metrics a ≈ 10.44 Å, b ≈ 7.04 Å, c ≈ 7.76 Å, β ≈ 96.9°. There are a number of possible distortions of the parent rhombohedral cell that lead to a monoclinic cell of these metrics. Use of the ISODISTORT program [20] leads to five key possibilities (space groups I2/m, P2/m, P21/m, P2/n, P21/n) although this is quickly narrowed down to P21/n or P2/n due to the presence of reflections indexable as h + k + l = 2n (eliminating body-centred cells) and all h0l satisfying h + l = 2n (n-glide plane). From these, P21/n is selected due to superior statistics in Rietveld refinement (Table S4).
Assessment of the model produced by Rietveld refinement of the low temperature data (Table S5) suggests that it is isostructural to that found for Cs2SnCu3F12 at low temperature. Bond distances are reported in Table 4. In this model, there are also two distinct Cu sites (this time in a 2:1 ratio), but only one type of Cu3 triangle, leading to three different Cu···Cu distances (range 3.51–3.57 Å).
Figure 4. A selection of SXPD reflections for Cs2TiCu3F12 at 300 K. Note the broadening of the (0,0,9) reflection compared to (2,1,4), indicative of an anisotropy in crystallite shape.
Crystals 05 00226 g004
Table 4. Selected metal-fluoride distances for Cs2TiCu3F12 at 100 K as derived from SXPD data (P21/n model).
Metal—Fluoride BondBond Length (Å)
Cs–F3 3.051(4)
Cs–F1 3.086(5)
Cs–F2 3.102(5)
Cs–F4 3.185(5)
Cs–F53.201(5)
Cs–F53.242(5)
Cs–F63.275(5)
Cu1–F2 (×2) 1.912(6)
Cu1–F1 (×2)1.917(6)
Cu1–F6 (×2)2.310(6)
Cu2–F31.875(5)
Cu2–F11.903(6)
Cu2–F21.921(6)
Cu2–F31.952(5)
Cu2–F42.319(6)
Cu2–F52.325(6)
Ti–F6 (×2)1.835(4)
Ti–F4 (×2)1.843(5)
Ti–F5 (×2)1.896(5)
On analysis of the full temperature range (Table S6), it is found that the phase transition occurs between 240 and 260 K and can be tracked by comparing SXPD patterns at different temperatures (Figure 5) and also by observing the change of unit cell volume as a function of temperature (Figure 6). The transition is characterised by a direct reduction in symmetry at 240 K from rhombohedral to monoclinic, with no evidence of a mixed phase region. This transition is analogous to that observed in powder samples of Cs2SnCu3F12 but occurs at a higher temperature (240 K versus 170 K) [12] possibly as a result of the smaller B-site cation. This transition leads to a “tilting” of the TiF6 octahedra out of the ab plane, into layers in an A-B-A-B pattern (Figure 7). A closer analysis of the structural details gives a possible motivation for this—as in the single crystal case (above), the powder shows an over-bonded Ti4+ at room temperature and down to 260 K. On crossing the transition—and losing symmetry—the Ti4+ shows a sudden drop in BVS, while the Cs+ shows a sudden increase (Table 5).
Figure 5. SXPD patterns for Cs2TiCu3F12 at a range of temperatures; note peak splittings appearing below 260 K.
Crystals 05 00226 g005
Figure 6. Unit cell volume per formula unit vs. temperature for Cs2TiCu3F12 powder as derived from SXPD data. Note the change in gradient indicated by the shaded area.
Crystals 05 00226 g006
Figure 7. Tilting of TiF6 octahedra (foreground) in an A-B-A-B fashion against a Cu–F kagome background as found in Cs2TiCu3F12 below the rhombohedral → monoclinic transition temperature.
Crystals 05 00226 g007
Table 5. Bond valence sums for the cations in Cs2TiCu3F12 as a function of temperature (VaList. [17]). Bond lengths derived from SXPD data.
Temperature (K)BVS
Ti4+Cu12+Cu22+Cs+
3004.8842.0160.858
2804.8842.0120.867
2604.8842.0140.870
2404.9341.9902.0370.919
2204.7141.9502.0090.946
2004.6761.9542.0020.961
1004.6161.9701.9751.019
The suggestion in this case is that, again, the transition is motivated by the need for both Ti4+ and Cs+ to attain a more optimal bonding environment, and the high temperature phase is stabilized by entropy effects.

2.3. Comparison of Single Crystal and Powder Samples of Cs2TiCu3F12

It is clear from the above that single crystal and powder samples of Cs2TiCu3F12 show differing behaviours with respect to their lower temperature phase transitions, suggesting some form of crystallite size dependence to the phase transition behaviour. For the powder at low temperatures, the doubled rhombohedral cell found for the single crystal is not compatible with the SXPD data: i.e., key splittings are not accounted for (Figure S3). A similar analysis can be performed for the single crystal data: using a selection of images it can be seen that the smaller, primitive monoclinic unit cell is not adequate to fit all the reflections, whereas the doubled rhombohedral model is found to fit well (Figure S4). The differing natures of the distortions of the underlying Cu–Cu kagome frameworks for the two polymorphs are illustrated graphically in Figure S5.
The reasons for this particular morphology dependent polymorphism are unknown, although the general theme has come under scrutiny in the past. There have been a number of studies that have correlated surface energy to phase transition temperature/pressure and polymorphism [21,22,23]. These have focused on comparing bulk and nano-particulate systems and suggest that surface energy is a dominant factor and this may be the case for Cs2TiCu3F12. Another consideration is the platy nature of the powdered crystallites—this may allow extra degrees of freedom and the adoption of a lower energy polymorph that is not available to the single crystal. Differing degrees of minor disorder (e.g., on the fluoride sublattice), which are not detectable at the limit of powder diffraction, might also be involved. Purely kinetic effects can also not be ruled out. A computational study of the energetics of these different polymorphs would be of interest.

2.4. Powder X-ray Diffraction of Rb2TiCu3F12

Synthesis of diffraction quality single crystals of Rb2TiCu3F12 proved challenging and so our results for this novel material will be based on SXPD and NPD data (Figure S6).
At room temperature, Rb2TiCu3F12 is found to adopt a triclinic unit cell, space group P 1 ¯ . This is related to the doubled rhombohedral cell (as reported for Rb2SnCu3F12 at room temperature [14]) by the transformation matrix (2/3, 1/3, 1/3),(−1/3, 1/3, 1/3),(−1/3, −2/3, 1/3) where a = b = c and α = β = γ, for the ideal case. This primitive triclinic unit cell is similar to that reported for the intermediate phase of Rb2SnCu3F12 [13]. Lattice parameters are as shown in Table 6, showing slight discrepancies between the two techniques. The lattice parameters determined for the impurity phases, from the same datasets, also differ slightly (Tables S7 and S8); the inclusion of the impurities in the Rietveld refinements impedes the extraction of accurate values for the parameters of all phases, and this is the likely to be the main cause of the discrepancies, although we cannot rule out our temperature variations or other minor systematic errors.
Table 6. Comparison of room temperature lattice parameters of Rb2TiCu3F12 from SXPD and NPD data.
Unit Cell ParameterSXPDNPD
a (Å)10.3592(8)10.3703(15)
b (Å)10.3506(9)10.3521(19)
c (Å)10.3440(3)10.3369(14)
α (°)83.838(8)83.717(17)
β (°)83.832(8)83.635(14)
γ (°)83.9111(15)83.921(8)
Due to the complex triclinic model used (38 unique atoms, Table S9) it is not possible to refine the atomic coordinates reliably and so detailed comment on the atomic structure is not appropriate. Despite this, there are still some conclusions that may be drawn from the variation in unit cell metrics versus temperature. On cooling it can be seen that the unit cell further diverges from the pseudo-rhombohedral ideal case (i.e., where a = b = c and α = β = γ) indicating that the sample is becoming more distorted from the parent rhombohedral phase (Tables S10 and S11). Hence, we propose that Rb2TiCu3F12 will transform to the rhombohedral form at a temperature above the highest measured; by extrapolation it is suggested that this transition may occur between 320 and 350 K (Figure 8).
Figure 8. Lattice parameters derived from SXPD data for Rb2TiCu3F12 powder as a function of temperature (error bars included).
Crystals 05 00226 g008
Another feature notable in the data is a hysteresis between ~150 and 300 K; the lattice parameters on heating and cooling cycles are not superimposable, as they are at lower temperatures. This indicates that the phase transition may be first order. It should be noted that there is no observable hysteresis in the unit cell volume parameter, however.

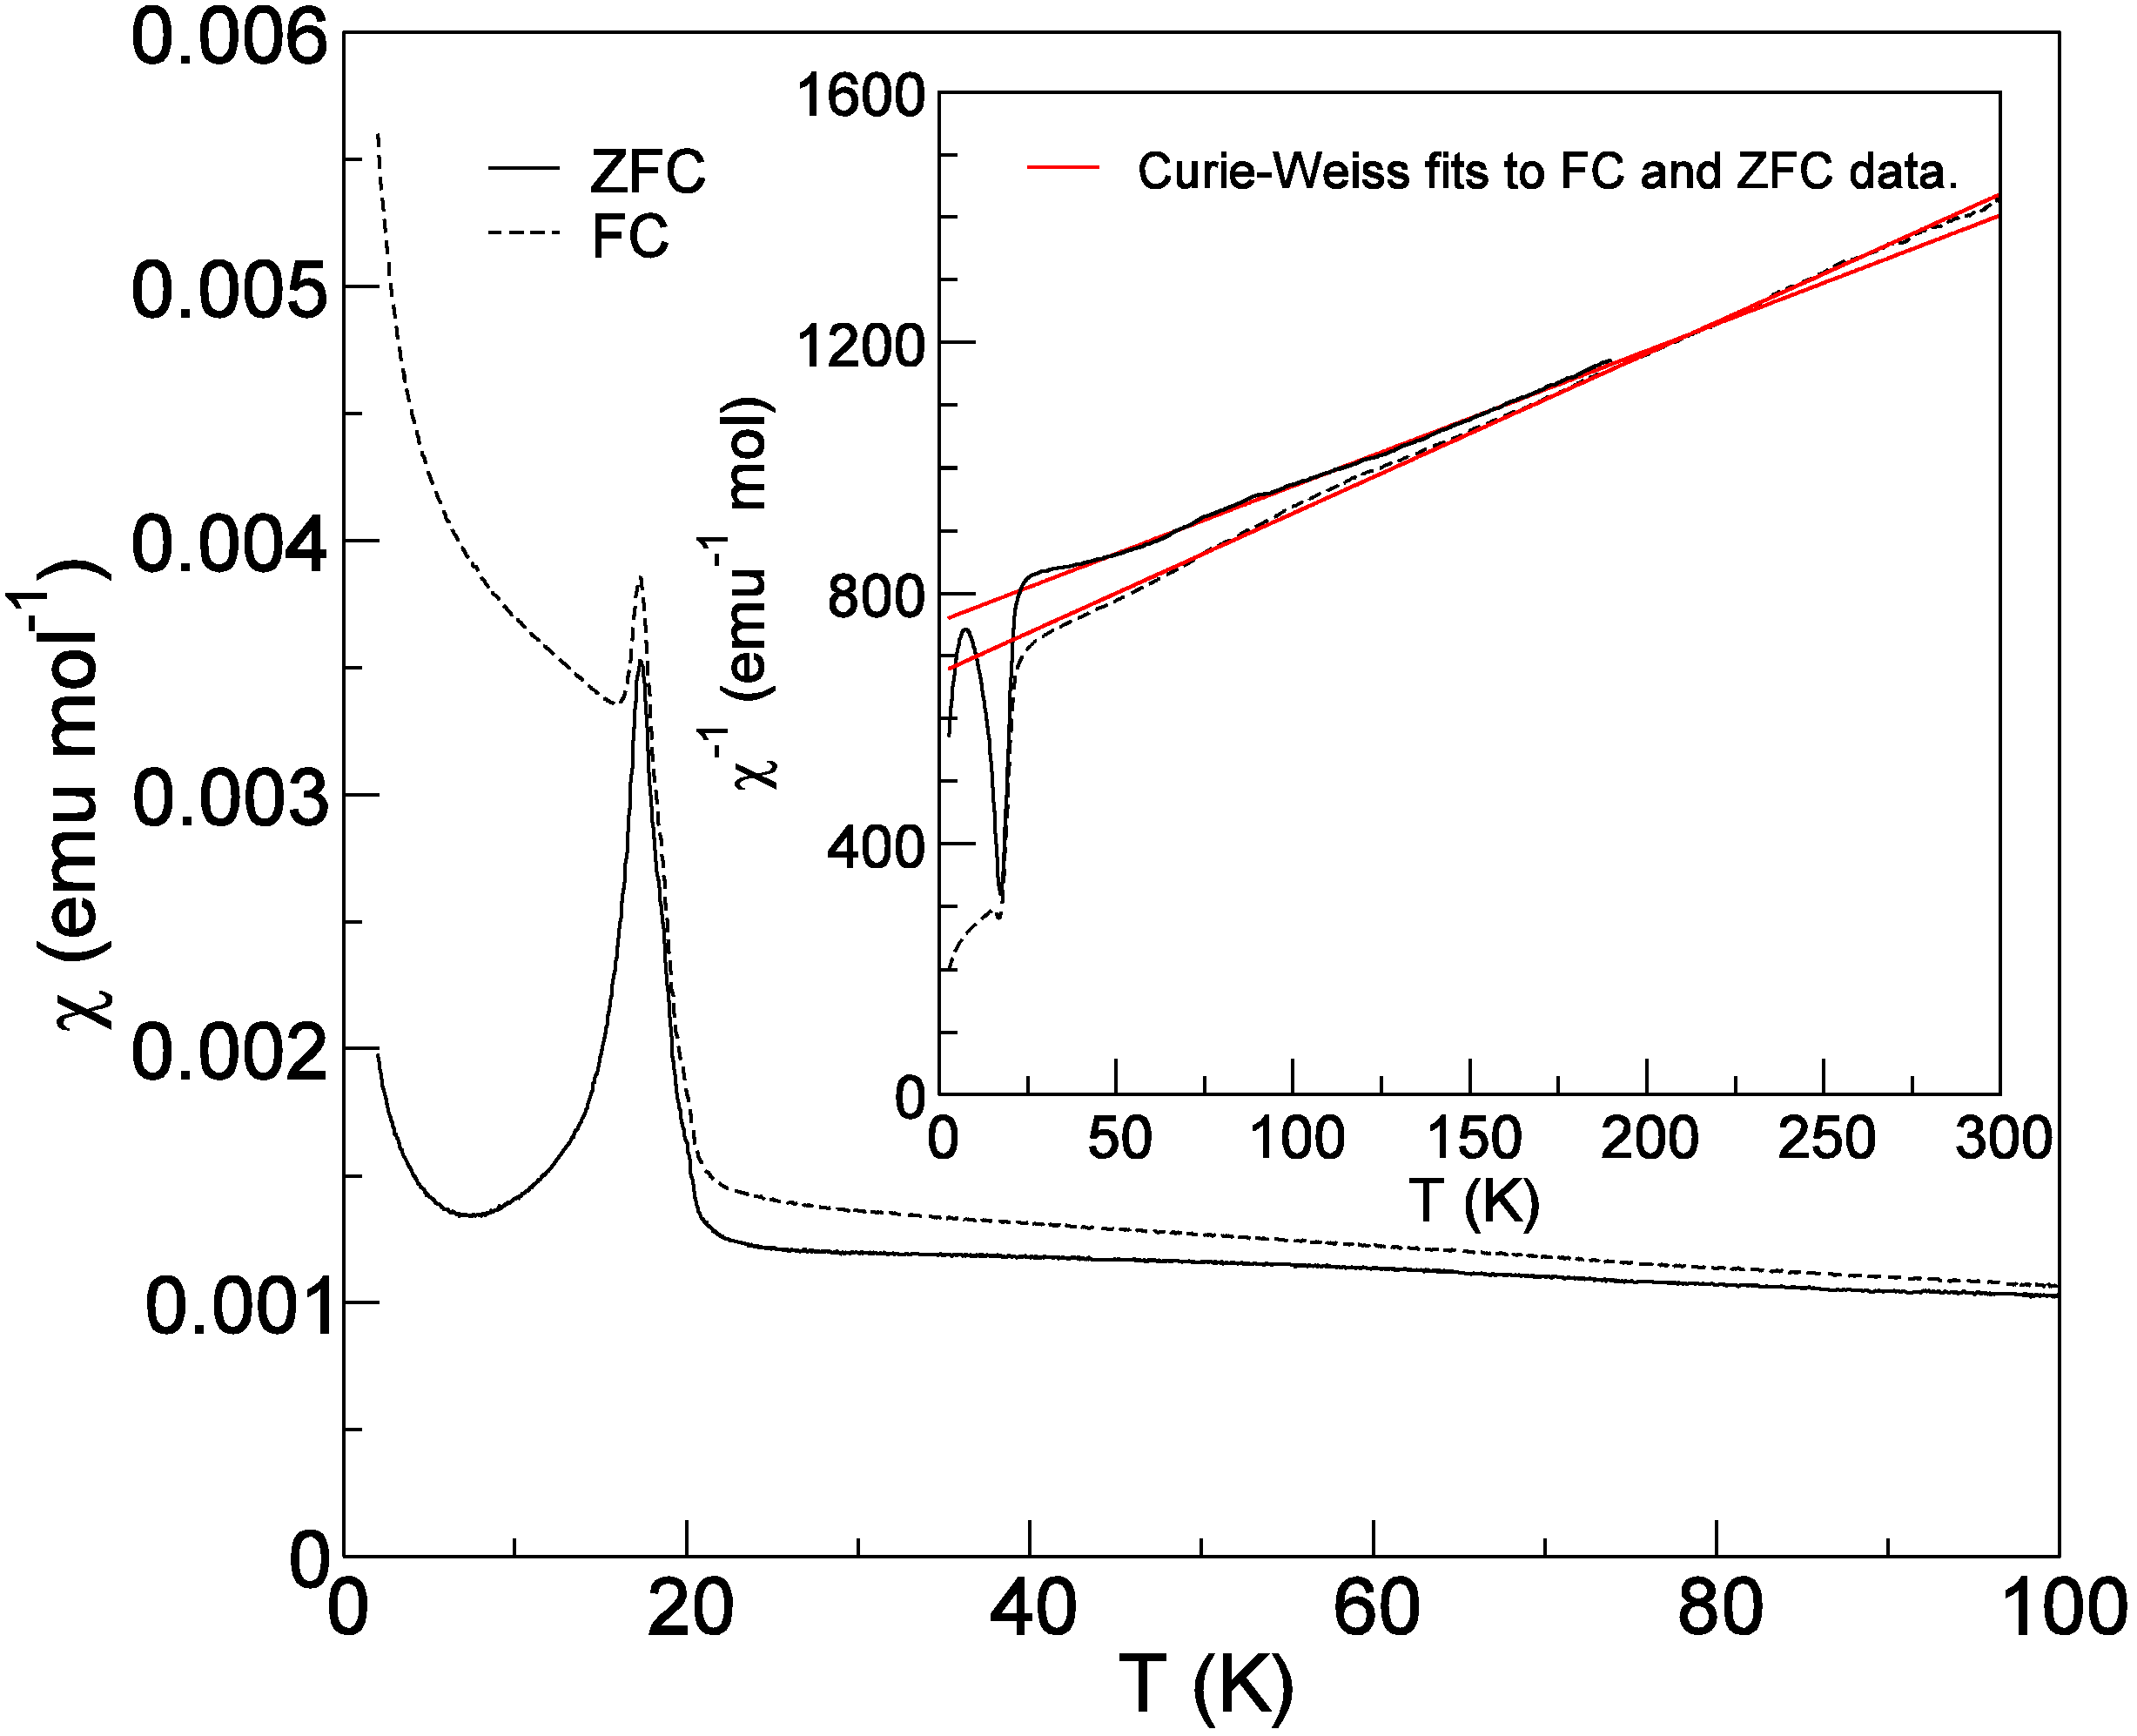
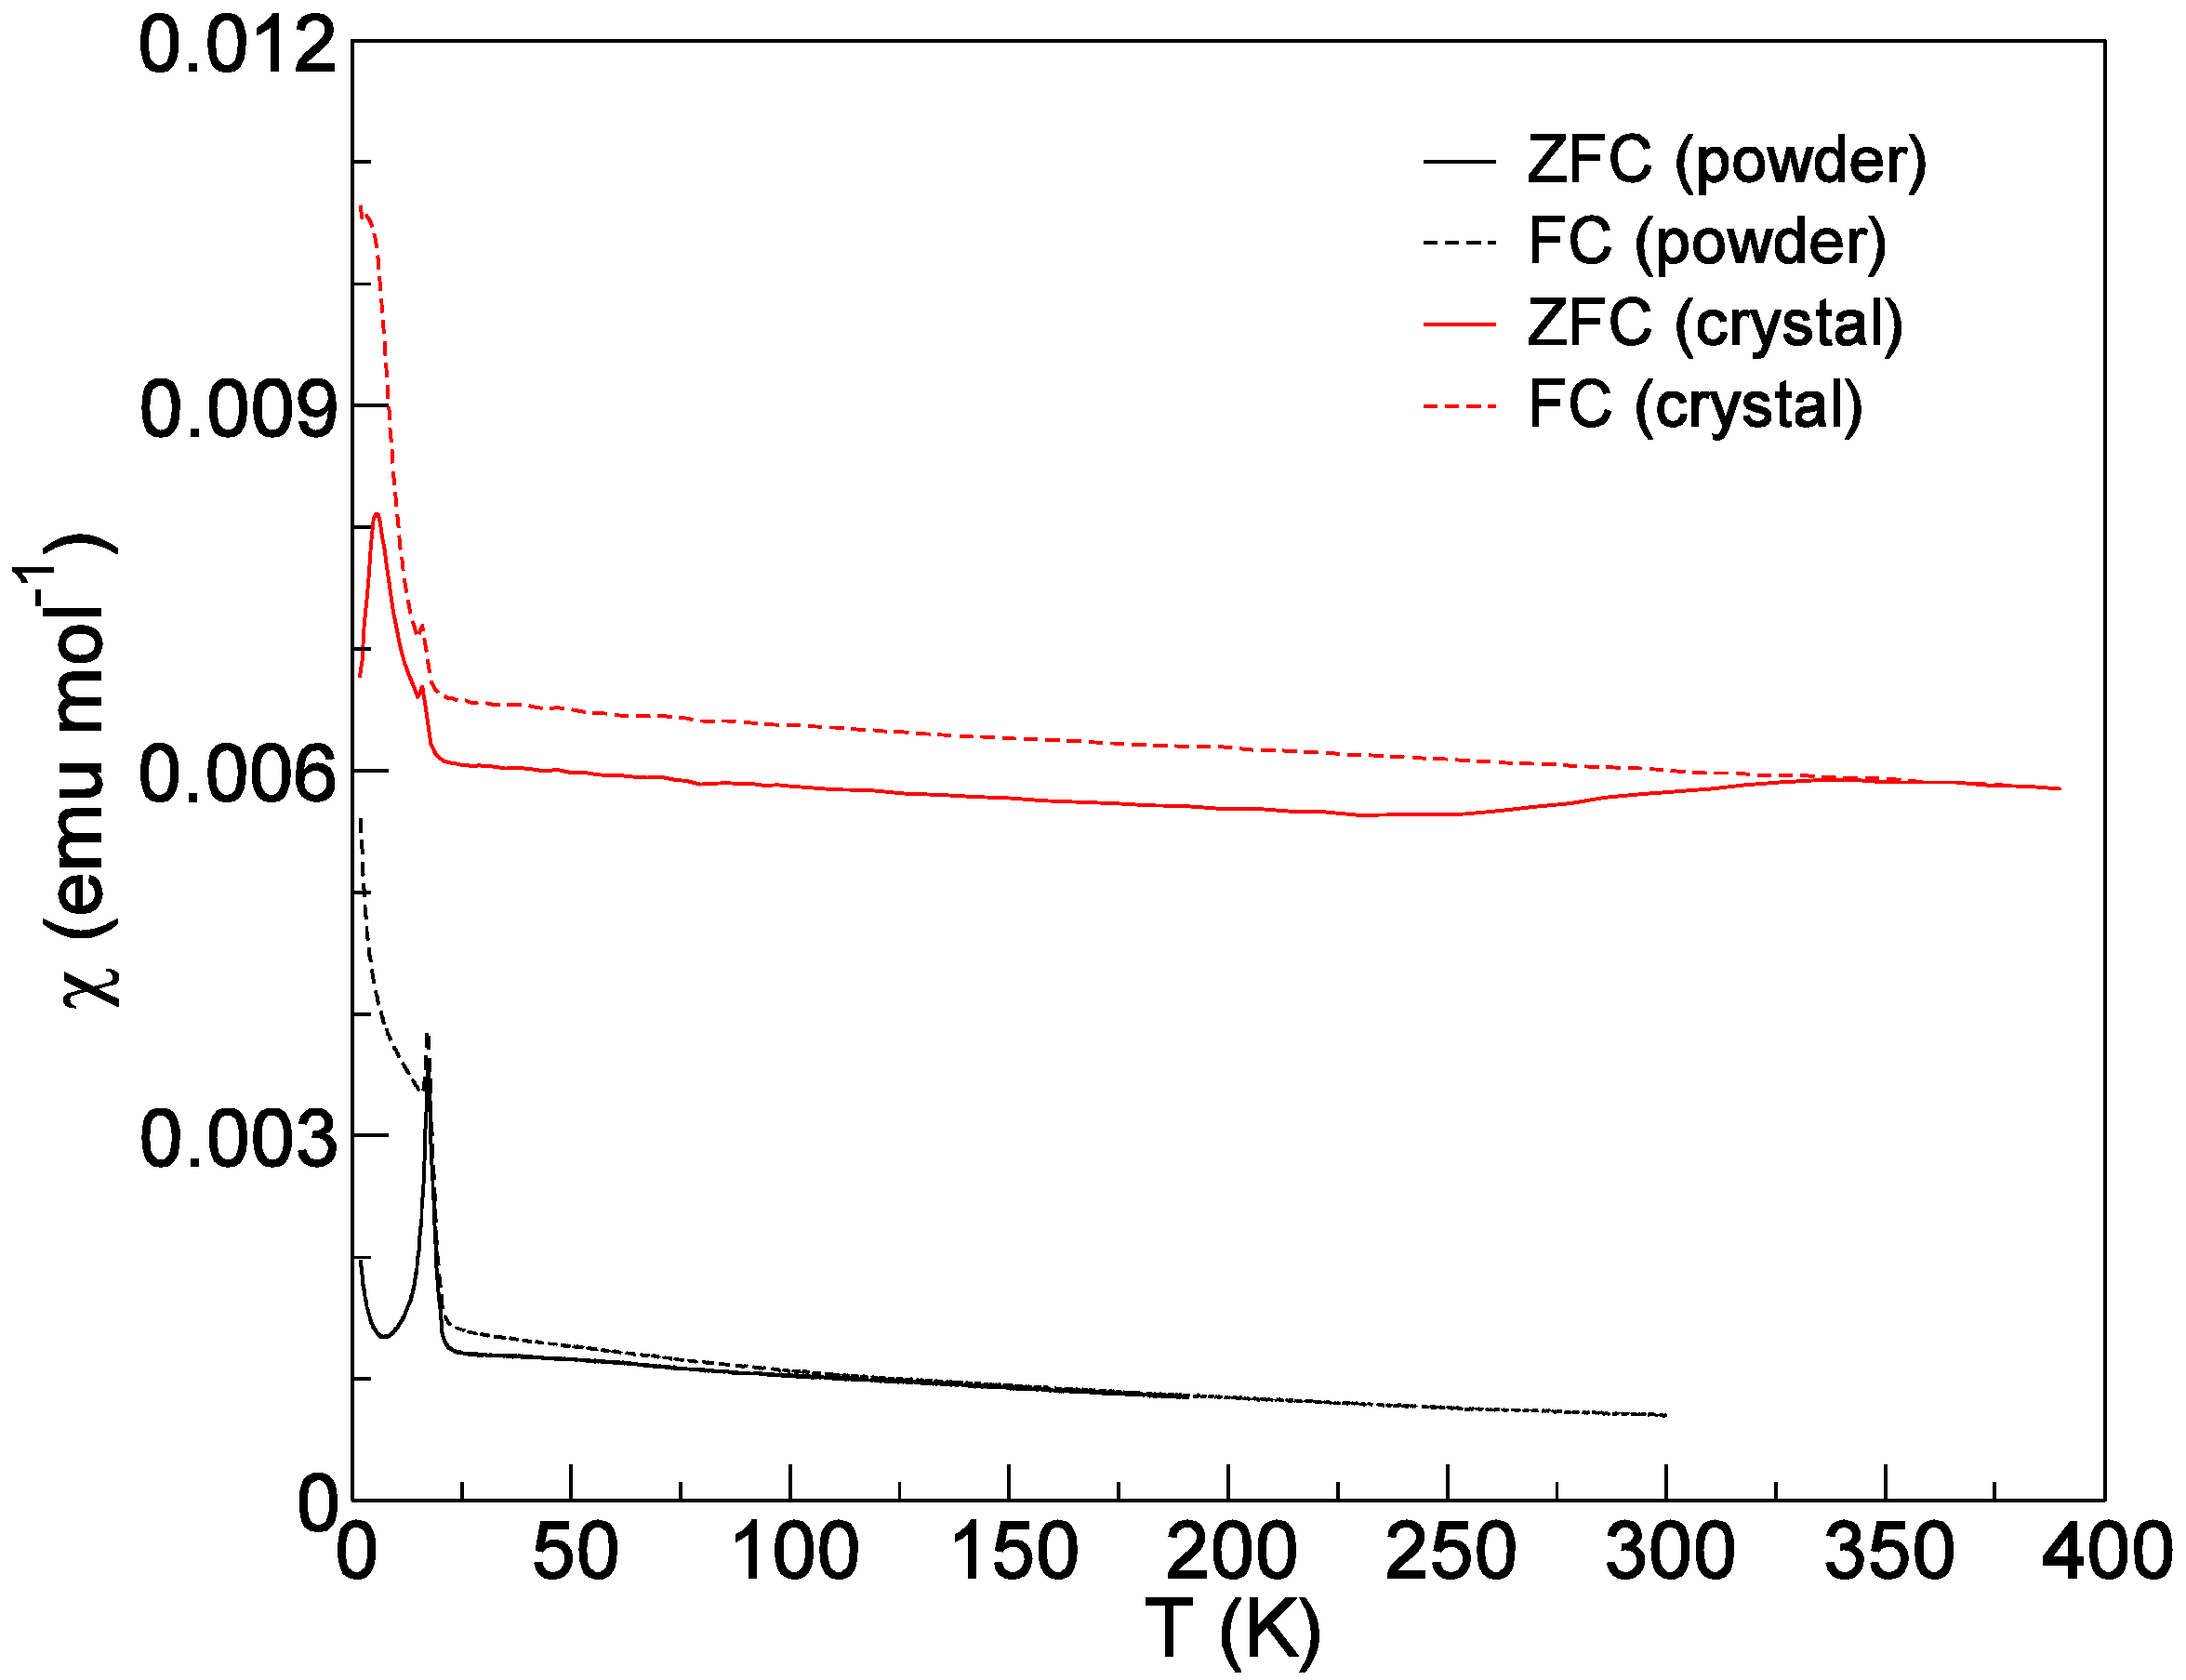
2.5. Magnetic Properties of Cs2TiCu3F12

0.01774 g of Cs2TiCu3F12 powder of approximately 80% purity (0.0581 mM Cu2+) was synthesised especially for magnetic measurements (see Experimental Section). The sample was cooled to 2 K and a field of 2 kOe applied before heating to 190 K while measuring the magnetisation (zero field cooled, ZFC). The sample was then re-cooled in the 2 kOe external field to 2 K before heating to 300 K and measuring the magnetisation (field cooled, FC). Both ZFC and FC data (Figure 9) show a large anomaly beginning at ~21 K and peaking at ~16 K. There is some discrepancy between the ZFC and FC data, probably due to the presence of a magnetically-ordered impurity phase. Linear behaviour was observed for 1/χm versus T between 150 and 300 K and a Curie-Weiss fit yielded an effective moment of 1.77 to 1.84 μB, as expected for Cu2+ in octahedral environments (see, for example, [24]). The Curie-Weiss temperature was found to be −264 to −350 K, indicating strong antiferromagnetic interactions.
Figure 9. The zero-field cooled (ZFC) and field-cooled (FC) magnetic susceptibility data for a powder sample of Cs2TiCu3F12. The inset shows the inverse susceptibility with Curie-Weiss fits (red) to the linear sections of the data.
Crystals 05 00226 g009
The variation of structural properties with particle size in these samples, as discussed above, is also reflected in the magnetic properties. ZFC and FC magnetic susceptibility data were measured in a magnetic field of 2 kOe, on a collection of unground single crystals (0.003 g, 0.0123 mM Cu2+). These data are clearly different from those of the powder sample; there is a divergence between the ZFC and FC susceptibility below 340 K, but also what at first sight appears to be a large temperature independent paramagnetic contribution (TIP) (Figure 10). These data show two low temperature anomalies; one at 16 K and one at 4.8 K. The higher temperature anomaly is slightly lower in temperature, and much smaller in magnitude, than that found for the powder. Attempts to model the data with a combination of TIP and a single Curie-Weiss contribution, i.e., with the equation:
χ m =   χ 0 +   C ( T + T cw )
do not lead to satisfactory fits. It therefore is likely that even in these samples composed of a small number of discrete crystallites, more than one magnetic phase is present and it is not possible to identify their individual contributions.
Figure 10. The zero-field cooled (ZFC) and field-cooled (FC) magnetic susceptibility data for a single crystal sample of Cs2TiCu3F12 (red) compared to the powder-sample susceptibility (black), both measured in an applied magnetic field of 2 kOe.
Crystals 05 00226 g010

3. Experimental Section

Syntheses were performed in a number of ways depending on whether powder or single crystalline samples were required. For powder crystallographic studies, solid-state synthesis via reaction under flowing argon was performed. As TiF4 is volatile below the reaction temperature, the precursor A2TiF6 (A = Cs, Rb) was first synthesised, by a route similar to that described in [25]. CsCl (2 mM, Sigma Aldrich, 99%, Dorset, UK) or RbCl (2 mM, Sigma Aldrich, 99.8%) and TiO2 (1 mM, ~99%) were mixed with deionised water (4 mL) in a 40 mL Teflon lined autoclave. Ethylene glycol (5 mL, Fisher Scientific, >99%) and HF(aq) (1 mL, 48%–51%, Alfa Aesar, Heysham, UK) were then added to the autoclave, which was then sealed and heated under autogenous pressure at 433 K overnight. The resulting crystalline powders were then isolated by filtration, washing with water:ethylene glycol (1:1) and then dried overnight at ~330 K in air. The resulting A2TiF6 powders were then dried at 390 K and ~10−4 mbar for 24 h.
The A2TiF6 powders were then mixed with CuF2 (Sigma Aldrich, 98%) in stoichiometric amounts (1:3) in an argon filled glove box. This mixture was ground and sealed in a gold tube by crimping the ends. The gold tube was then heated under flowing argon in the following manner: 20 K·min−1 373–873 K, 12 h at 873 K, 20 K·min−1 873–373 K. The resulting grey coloured powder was typically found to be 94% pure in the case of Cs2TiCu3F12 and 88% pure for Rb2TiCu3F12. Notable impurities (all <5% by powder XRD) were found to be A2TiF6, CuO and, for A = Rb, evidence of the further phases RbCuF3 and Cu2O was found.
A similar process could be adapted for the formation of single crystals; in this case the A2TiF6:CuF2ratio was adjusted to 1:2 and the heating rates in the furnace applied as follows: 20 K·min−1 373–1073 K, 12 h at 1073 K, ~3 K·min−1 1073–823 K and then 20 K·min−1 823–373 K. This method yielded colourless, platy crystals. Diffraction quality single crystals were only isolated for Cs2TiCu3F12; the crystals of Rb2TiCu3F12 seemed to suffer from a large degree of non-merohedral twinning that aggravated any meaningful single crystal X-ray diffraction study.
Samples that were synthesised for use in magnetic measurements underwent a slightly different synthesis process. CsF (or RbF), TiF4 and CuF2 were ground in stoichiometric amounts (2:1:3 molar ratio), pelletised inside an argon filled glove box and placed in a copper tube with a small crystal of XeF2, added to supply a fluorine rich atmosphere on decomposition. The tube was hermetically sealed by welding. For Cs2TiCu3F12 the tube was heated to 423 K for 24 h then 873 K for 72 h. The tube was then breached in an argon filled glove box, the contents reground, repelletised and sealed in a new copper tube with a small amount of XeF2. This new tube was then heated to 873 K for 48 h. A similar procedure was followed for Rb2TiCu3F12. For Cs2TiCu3F12 the only identifiable impurity was Cs2TiF6. For Rb2TiCu3F12 evidence of Rb2TiF6 was found and a small amount of RbCuF3 (<1%) was also identified.
Laboratory based powder X-ray diffraction (PXRD) for the purpose of phase identification was performed on a PANalytical Empyrean X-ray diffractometer (PANalytical Ltd., Cambridge, UK) using Cu Kα1 radiation and operating in either Bragg-Brentano geometry or transmission mode at the University of St Andrews and a Stoe Stadi-P diffractometer using Cu Kα1 radiation and operating in transmission mode at Moscow State University.
Synchrotron X-ray powder diffraction (SXPD) was performed at beamline I11, Diamond Light Source Ltd., Harwell, UK [26]. This utilised glass capillaries and operated in Debye-Scherrer mode typically with radiation of λ ≈ 0.82 Å (precisely predetermined using a known standard). For analysis of A2TiCu3F12, a multi-analysing crystal based detector was used in order to collect the highest resolution data possible. Datasets were collected for 15 or 30 min at a range of temperatures; for A = Rb upon cooling from 300 to 100 K in 20 K steps followed by further cooling to 85 K before heating from 100 to 300 K in 20 K steps. For A = Cs, data were collected from 300 to 100 K in 20 K steps. On reaching the required temperature, a brief period (5–10 min) was employed in order ensure that the sample was equilibrated appropriately.
Neutron powder diffraction (NPD) was performed at beamline HRPD (High resolution powder diffraction), ISIS facility, Harwell, UK. Samples of ~2 g were mounted in 8 mm cylindrical vanadium cans before loading into the diffractometer in the standard manner. Patterns were collected at room temperature.
Rietveld refinement was performed using GSAS [27] and the EXPGUI interface [28]. This analysis sought to fit lattice parameters, phase fractions, peak profile shape (both Gaussian and Lorentzian and, in the case of A = Cs, anisotropic peak broadening), thermal parameters (grouped by atom type) and, in the case of A = Cs, atomic coordinates.
Single crystal X-ray diffraction (SCXD) was performed on a Rigaku SCXmini diffractometer using Mo Kα1 radiation. Indexing and data processing was performed with Rigaku CrystalClear 2.0 (Rigaku Americas, Woodlands, TX, USA) and the model was solved using Shelxs-97 [29] and the WinGX [30] add-on. Single crystal data collection was performed both at room temperature and 125 K.
At Edinburgh University, magnetometry used a Quantum Designs MPMS-XL SQUID. Single crystal magnetometry measurements were carried out with the aid of Kapton adhesive tape to support a number of small single crystals, which were then covered in another layer of Kapton tape. The resulting sample was then suspended securely in a plastic straw. The diamagnetic susceptibility of the kapton tape was measured separately and confirmed to be insignificant compared to the signal from the samples. In both cases multiple readings were taken at different temperatures (1.9–390 K) and different fields (±70,000 Oe). At Moscow State University, the magnetic measurements were taken using a Quantum Designs PPMS using a VSM add-on unit. Samples were mounted in plastic holders which were provided by the manufacturer for use. The specifics of measurements and analysis will be referred to in the following section.

4. Conclusions

In conclusion, we have prepared two new members of the A2B′Cu3F12 family, with B′ = Ti4+, A′ = Cs+ or Rb+. These compositions represent new extremes of both A/B′ cation size ratio and B′ absolute cation size within this family. By this size-directed crystal engineering, it was hoped that a perfect kagome lattice might be retained at low temperatures, thus prompting retention of a magnetically-frustrated ground state. However, it is found that Rb2TiCu3F12 adopts a highly distorted, triclinic structural variant even at room temperature; detailed magnetic studies of this compound were thwarted by the presence of minor magnetic impurities. Cs2TiCu3F12, on the other hand, does adopt the ideal kagome structure at ambient temperature, in common with the other Cs-containing members of this family. However, it undergoes a symmetry-lowering structural phase transition upon cooling. The nature of this phase transition differs for single crystal versus polycrystalline samples: a phenomenon that has previously been observed in Rb2SnCu3F12 and is also probable, though unconfirmed, in Cs2SnCu3F12. Although the deviations from ideal kagome symmetry in both single crystal and powder cases are much smaller than those in either Rb2SnCu3F12 or Cs2ZrCu3F12, they are sufficient to break down the magnetic frustration, inhibiting the potential for realising a QSL or VBS ground state, and promoting long-range antiferromagnetic order. The possibilities for stabilising an ideal kagome geometry at low temperatures is this family therefore seem limited. The symmetry-lowering distortions of the kagome lattices in these materials seem to be driven by purely geometrical effects, i.e., requirements to optimize bonding at the cation sites. Might it be possible to stabilise the ideal kagome geometry by introducing larger cations at the A-site? This will require the use of complex organo-cations such as protonated amines, and correspondingly different synthetic methods. The use of such templating cations is widespread in metal-organic frameworks and also in hybrid perovskites, for example. However, such materials usually do display symmetry-lowering structural phase transitions at lower temperatures, often mediated by hydrogen-bonding interactions [31]. Hence, although this family does not appear promising for the realisation of a QSL ground state, it does display rich and varied structural chemistry and, in particular, the unusual phenomenon of differing behaviour between single crystal and powder samples within several members of this family is worthy of further study.
Further details of the crystal structures may be obtained from Fachinformationszentrum (FIZ) Karlsruhe, 76344 Eggenstein-Leopoldshafen, Germany (e-mail: [email protected]) on quoting deposition numbers 429373, 429374, 429375.

Acknowledgments

Aziz Daoud-Aladine is thanked for assistance with NPD measurements at ISIS. The collaboration between the University of St Andrews and Moscow State University was funded by a Royal Society International Exchanges grant, in collaboration with the Russian Foundation for Basic Research (12-03-92604). Lewis Downie thanks the EPSRC for a Ph.D. studentship via a Doctoral Training grant (EP/P505097/1). This work was carried out with the support of the Diamond Light Source, beamtime application EE7980. Alexandre Vasiliev acknowledges support of RFBR through grants Numbers 13-02-00174, 14-02-92002 and 14-02-92693.

Author Contributions

Lewis Downie carried out all the synthesis, with the assistance of Elena Ardashnikova and Peter Berdonosov. Alexandre Vasiliev and Mark de Vries carried out the magnetic measurements and assisted with their interpretation. Chiu Tang assisted with collection of synchrotron diffraction data. Lewis Downie carried out the crystallographic experiments and analysis, with the assistance of Philip Lightfoot. Philip Lightfoot conceived and coordinated the project, with the collaboration of Valery Dolgikh.

Conflicts of Interest

The authors declare no conflict of interest.

References

  1. Harrison, A. First catch your hare: The design and synthesis of frustrated magnets. J. Phys. 2004, 16, S553–S572. [Google Scholar]
  2. Anderson, P.W. Resonating valence bonds: A new kind of insulator? Mater. Res. Bull. 1973, 8, 153–160. [Google Scholar] [CrossRef]
  3. Mendels, P.; Bert, F.; de Vries, M.A.; Olariu, A.; Harrison, A.; Duc, F.; Trombe, J.C.; Lord, J.S.; Amato, A.; Baines, C. Quantum magnetism in the paratacamite family: Towards an ideal kagome lattice. Phys. Rev. Lett. 2007, 98. [Google Scholar] [CrossRef] [PubMed]
  4. Fak, B.; Kermarrec, E.; Messio, L.; Bernu, B.; Lhuillier, C.; Bert, F.; Mendels, P.; Koteswararao, B.; Bouquet, F.; Ollivier, J.; et al. Kapellasite: A kagome quantum spin liquid with competing interactions. Phys. Rev. Lett. 2012, 109. [Google Scholar] [CrossRef] [PubMed]
  5. Aidoudi, F.H.; Aldous, D.W.; Goff, R.J.; Slawin, A.M.Z.; Attfield, J.P.; Morris, R.E.; Lightfoot, P. An ionothermally-prepare S = ½ vanadium oxyfluoride kagome lattice. Nat. Chem. 2011, 3, 801–806. [Google Scholar] [CrossRef] [PubMed] [Green Version]
  6. Clark, L.; Orain, J.C.; Bert, F.; de Vries, M.A.; Aidoudi, F.H.; Morris, R.E.; Lightfoot, P.; Lord, J.S.; Telling, M.T.F.; Bonville, P.; et al. Gapless spin liquid ground state in the S = ½ vanadium oxyfluoride kagome antiferromagnet [NH4]2[C7H14N][V7O6F18]. Phys. Rev. Lett. 2013, 110. [Google Scholar] [CrossRef] [PubMed]
  7. Courbion, G.; Jacoboni, C.; Depape, R. Crystal structure of Cs2NaAl3F12. Acta Crystallogr Sect. B 1976, 32, 3190–3193. [Google Scholar] [CrossRef]
  8. Matan, K.; Ono, T.; Fukumoto, Y.; Sato, T.J.; Yamaura, J.; Yano, M.; Morita, K.; Tanaka, H. Pinwheel valence-bond solid and triplet excitations in the two-dimensional deformed kagome lattice. Nat. Phys. 2010, 6, 865–869. [Google Scholar] [CrossRef]
  9. Müller, M.; Müller, B.G. Cs2M(IV)Cu3F12 (M(IV) = Zr, Hf)—Crystal structure and magnetic behaviour. Z. Anorg. Allg. Chem. 1995, 621, 993–1000. [Google Scholar] [CrossRef]
  10. Reisinger, S.A.; Tang, C.C.; Thompson, S.P.; Morrison, F.D.; Lightfoot, P. Structural phase transition in the S = ½ kagome system Cs2ZrCu3F12 and a comparison to the valence-bond solid phase in Rb2SnCu3F12. Chem. Mater. 2011, 23, 4234–4240. [Google Scholar] [CrossRef]
  11. Ono, T.; Morita, K.; Yano, M.; Tanaka, H.; Fujii, K.; Uekusa, H.; Narumi, Y.; Kindo, K. Magnetic susceptibilities in a family of S = ½ kagome antiferromagnets. Phys. Rev. B 2009, 79. [Google Scholar] [CrossRef]
  12. Downie, L.J.; Black, C.; Ardashnikova, E.I.; Tang, C.C.; Vasiliev, A.N.; Golovanov, A.N.; Berdonosov, P.S.; Dolgikh, V.A.; Lightfoot, P. Structural phase transitions in the kagome lattice based materials Cs2−xRbxSnCu3F12 (x = 0, 0.5, 1.0, 1.5). CrystEngComm 2014, 16, 7419–7425. [Google Scholar] [CrossRef]
  13. Downie, L.J.; Thompson, S.P.; Tang, C.C.; Parsons, S.; Lightfoot, P. Re-entrant structural phase transition in a frustrated kagome magnet, Rb2SnCu3F12. CrystEngComm 2013, 15, 7426–7429. [Google Scholar] [CrossRef] [Green Version]
  14. Morita, K.; Yano, M.; Ono, T.; Tanaka, H.; Fujii, K.; Uekusa, H.; Narumi, Y.; Kindo, K. Singlet ground state and spin gap in the of S = ½ kagome antiferromagnet Rb2SnCu3F12. J. Phys. Soc. Jpn. 2008, 77, 043707:1–043707:4. [Google Scholar]
  15. Amemiya, T.; Yano, M.; Morita, K.; Umegaki, I.; Ono, T.; Tanaka, H.; Fujii, K.; Uekusa, H. Partial ferromagnetic ordering and indirect exchange interaction in the spatially anisotropic kagome antiferromagnet Cs2Cu3CeF12. Phys. Rev. B 2009, 80. [Google Scholar] [CrossRef]
  16. Shannon, R.D. Revised effective ionic-radii and systematic studies of interatomic distances in halides and chalcogenides. Acta Crystallogr. Sect. A Found Crystallogr. 1976, 32, 751–767. [Google Scholar]
  17. Wills, A.S. Program VaList for Windows. Available online: http://www.ccp14.ac.uk/ (accessed on 1 October 2014).
  18. Stephens, P.W. Phenomenological model of anisotropic peak broadening in powder diffraction. J. Appl. Crystallogr. 1999, 32, 281–289. [Google Scholar] [CrossRef]
  19. Boultif, A.; Louer, D. Indexing of powder diffraction patterns for low-symmetry lattices by the successive dichotomy method. J. Appl. Crystallogr. 1991, 24, 987–993. [Google Scholar] [CrossRef]
  20. Campbell, B.J.; Stokes, H.T.; Tanner, D.E.; Hatch, D.M. ISODISPLACE: A web-based tool for exploring structural distortions. J. Appl. Crystallogr. 2006, 39, 607–614. [Google Scholar] [CrossRef]
  21. Zhang, H.Z.; Banfield, J.F. Thermodynamic analysis of phase stability of nanocrystalline titania. J. Mater. Chem. 1998, 8, 2073–2076. [Google Scholar] [CrossRef]
  22. Tolbert, S.H.; Alivisatos, P. Size dependence of a first-order solid-solid phase transition: The wurzite to rock-salt transformation in CdSe nanocrystals. Science 1994, 265, 373–376. [Google Scholar] [CrossRef] [PubMed]
  23. McHale, J.M.; Auroux, A.; Perrotta, A.J.; Navrotsky, A. Surface energies and thermodynamic phase stability in nanocrystalline aluminas. Science 1997, 277, 788–791. [Google Scholar] [CrossRef]
  24. Ardelean, I.; Peteanu, M.; Burzo, E.; Ciorcas, F.; Filip, S. EPR and magnetic susceptibility studies of Cu2+ ions in TeO2-B2O3-PbO glasses. Solid State Commun. 1996, 98, 351–355. [Google Scholar] [CrossRef]
  25. Aldous, D.W. Solvothermal Chemistry of Early Transition Metal Fluorides. Ph.D. Thesis, University of St Andrews, St Andrews, UK, 2008. [Google Scholar]
  26. Thompson, S.P.; Parker, J.E.; Potter, J.; Hill, T.P.; Birt, A.; Cobb, T.M.; Yuan, F.; Tang, C.C. Beamline I11 at Diamond: A new instrument for high resolution powder diffraction. Rev. Sci. Instrum. 2009, 80. [Google Scholar] [CrossRef]
  27. Larson, A.C.; von Dreele, R.B. General Structure Analysis System (GSAS); Report No. 88–748; Los Alamos Natl. Lab.: Los Alamos, NM, USA, 1994. [Google Scholar]
  28. Toby, B.H. EXPGUI, a graphical user interface for GSAS. J. Appl. Cryst. 2001, 34, 210–213. [Google Scholar] [CrossRef]
  29. Sheldrick, G.M. A short history of SHELX. Acta Crystallogr. Sect. A Found. Crystallogr. 2008, 64, 112–122. [Google Scholar] [CrossRef]
  30. Farrugia, L.J. J. WinGX and ORTEP for Windows: an update. Appl. Crystallogr. 2012, 45, 849–854. [Google Scholar] [CrossRef]
  31. Jain, P.; Dalal, N.S.; Toby, B.H.; Kroto, H.W.; Cheetham, A.K. Order-disorder antiferroelectric phase transition in a hybrid inorganic-organic framework with the perovskite architecture. J. Am. Chem. Soc. 2008, 130, 10450–10451. [Google Scholar] [CrossRef] [PubMed]

