3.1. Material Processing
In
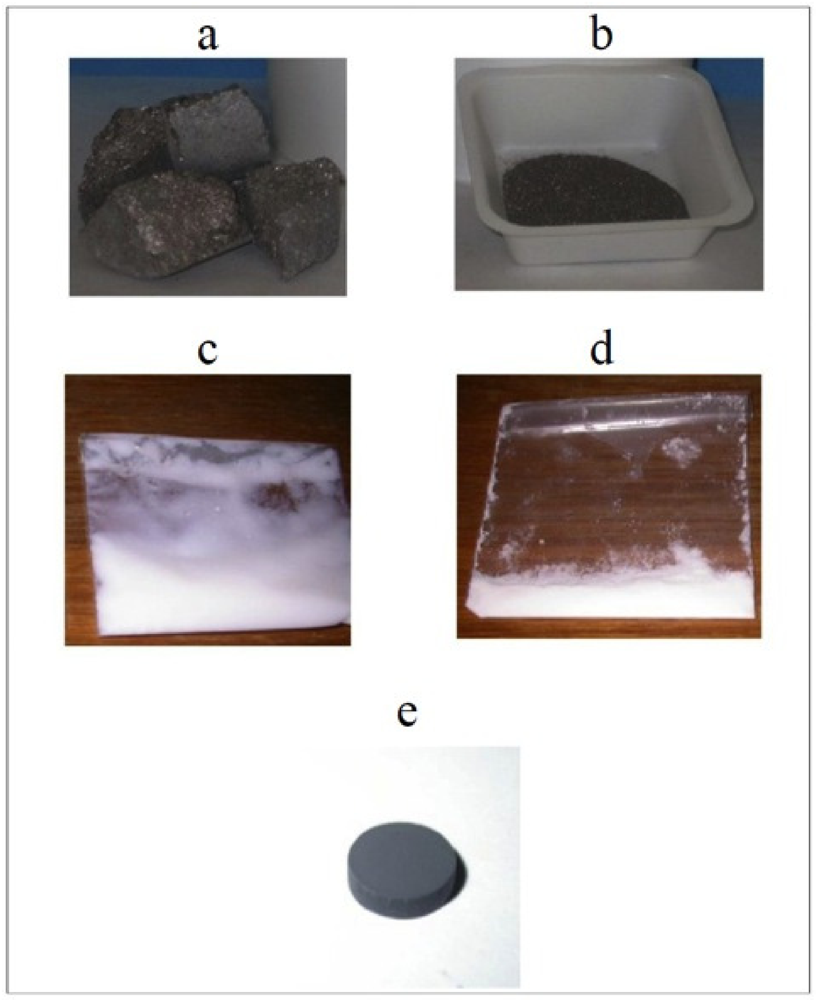
Figure 1, a view of the starting and processed materials is shown.
Figure 1.
A view of the starting and processed materials. Intermetallic alloy: (a) after cast; (b) after 15 min HEBM processing. Pyrogenic silica; (c) as received; (d) after HEBM processing; (e) Consolidated composite sample.
Figure 1.
A view of the starting and processed materials. Intermetallic alloy: (a) after cast; (b) after 15 min HEBM processing. Pyrogenic silica; (c) as received; (d) after HEBM processing; (e) Consolidated composite sample.
In
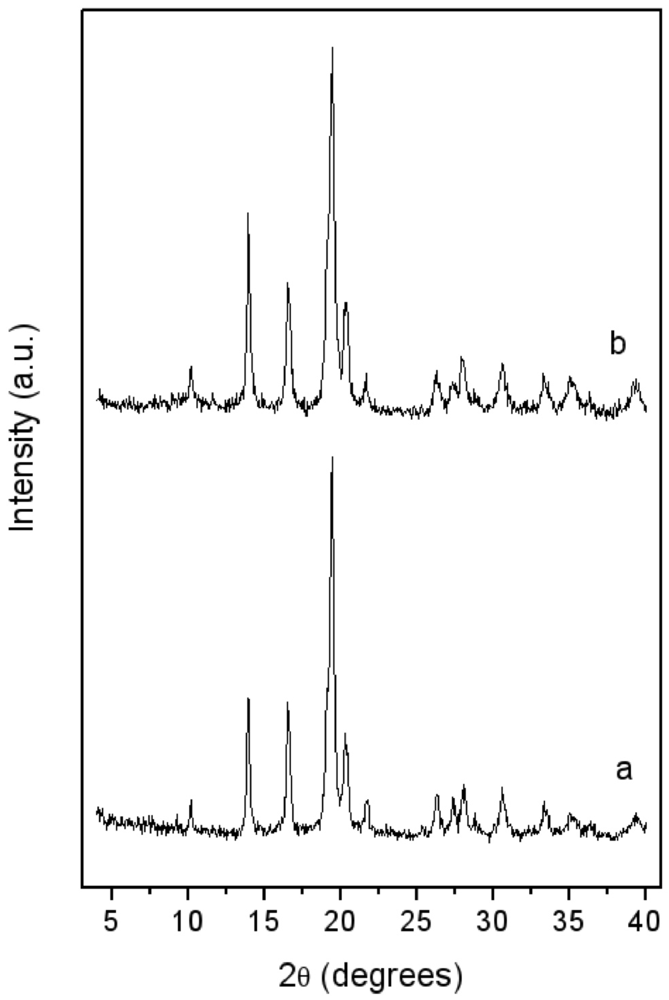
Figure 2, the XRD patterns of the LaNi
5 before and after 15 min blending with pyrogenic silica are reported. In both, only the patterns of the features of the metal phase are evident. An evaluation of crystallite size—as performed by the Sherrer law—on the (101) isolated peak gave about 20 nm for both the unblended and blended alloys. The blending by milling process did not promote the formation of any new phase. The applied milling conditions, in particular the low milling time (2 min), prevented the occurrence of unwanted mechanochemical effects [
17], so that silica just acts as an inert dispersion media.
Figure 2.
X-ray Diffraction (XRD) patterns of: (a) LaNi5 powder after 15 min high energy ball milling under vacuum; (b) LaNi5-SiO2 blend after 15 min milling.
Figure 2.
X-ray Diffraction (XRD) patterns of: (a) LaNi5 powder after 15 min high energy ball milling under vacuum; (b) LaNi5-SiO2 blend after 15 min milling.
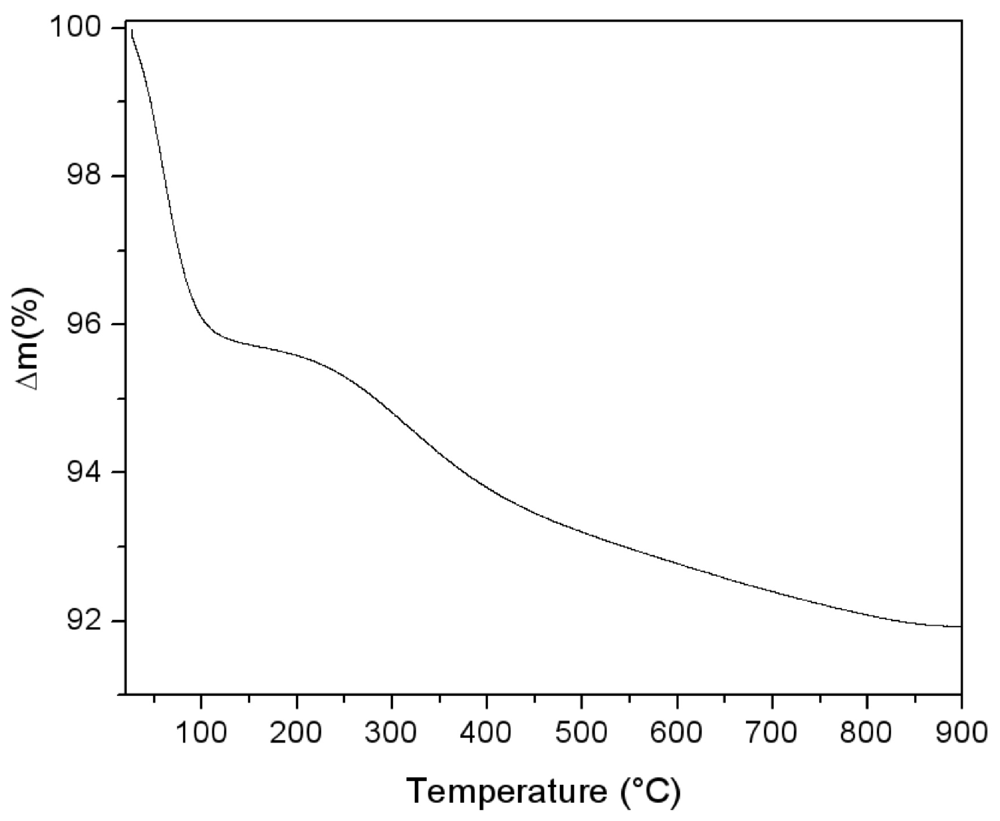
The thermal behaviour of the silica powder was followed by TGA analysis in order to study the particle reticulation by condensation of surface silanol groups. In
Figure 3, the obtained thermogravimetric curve is reported. The first mass loss immediately starts with the heating process. It can be assigned to surface bonded water desorption. Starting from about 150 °C, a second water loss process appears with a maximum rate around 300 °C. This process is due to interparticular siloxane bridge formation. Pyrogenic silica nanoparticles are arranged in aggregates in the 200–500 nm range [
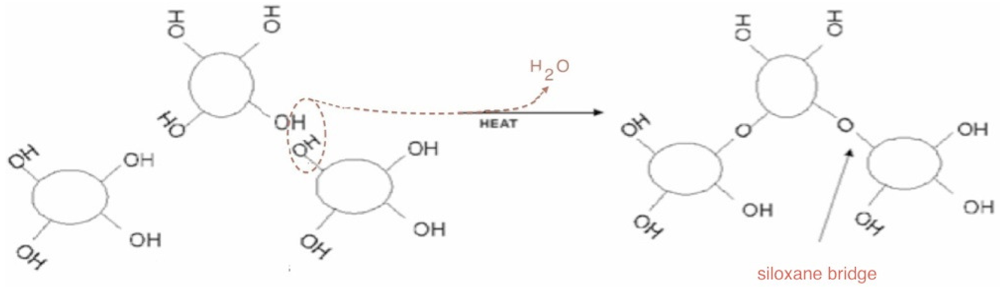
18]. The start of water loss is due to the formation of new siloxane bridges between nanoparticles, as sketched in the simplified scheme reported in
Figure 4. The interparticles condensation through siloxane bridge formation continues within the range 500–800 °C with an almost constant rate.
Figure 3.
Thermogravimetric analysis performed on pyrogenic silica under argon atmosphere (5 °C/min).
Figure 3.
Thermogravimetric analysis performed on pyrogenic silica under argon atmosphere (5 °C/min).
Figure 4.
A representation of inter-particles condensation through siloxane bridge formation.
Figure 4.
A representation of inter-particles condensation through siloxane bridge formation.
Figure 5.
.XRD patterns of LaNi5-SiO2|300 composite.
Figure 5.
.XRD patterns of LaNi5-SiO2|300 composite.
On the basis of these results, the temperature of 300 °C was chosen to perform the annealing of the LaNi5-SiO2 blend under Argon atmosphere.
The XRD spectrum of the consolidated composite LaNi
5-SiO
2|
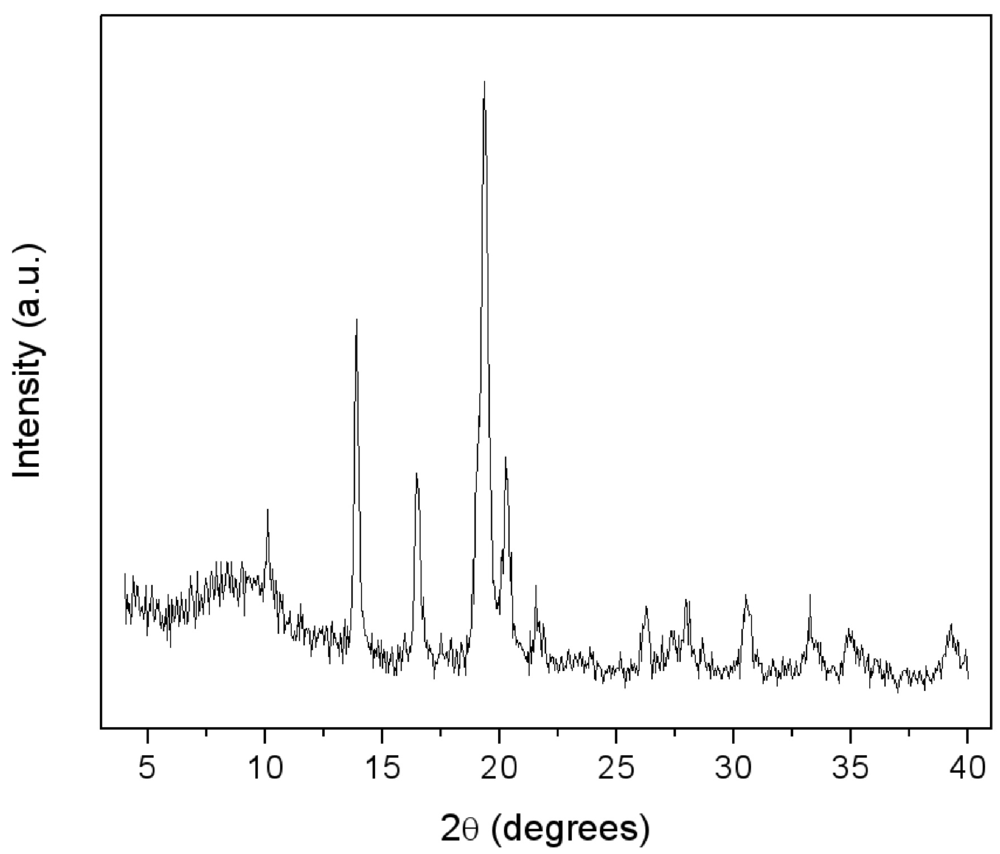
300 is reported in
Figure 5. Again, the growth of new crystalline phases possibly induced by the thermal treatment is not detectable and the crystallite dimensions of the LaNi
5 alloy remained unchanged. A more evident halo appeared at low angles, typical of amorphous compounds.
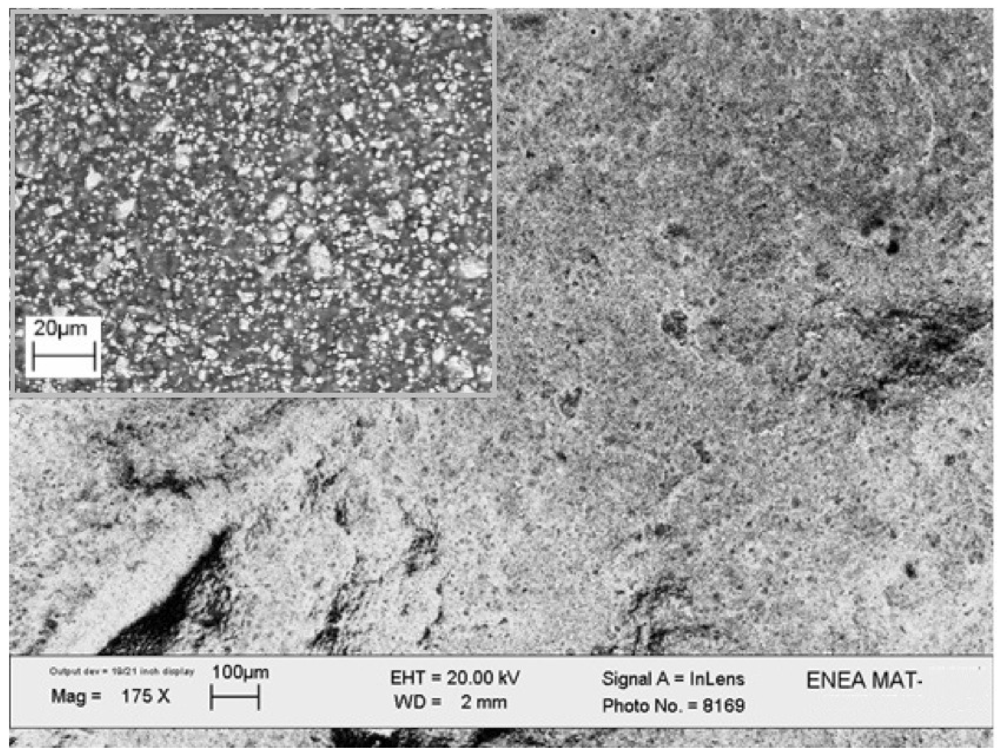
3.2. Morphological Characterizations
SEM images of the consolidated sample are reported in
Figure 6. The microscopy analysis demonstrates the porous surface of the composite, with metal particles uniformly embedded within the matrix (see the backscattered image in the inset).
Figure 6.
SEM image of the LaNi5-SiO2|300 composite. The inset shows the image acquired in the backscattered mode.
Figure 6.
SEM image of the LaNi5-SiO2|300 composite. The inset shows the image acquired in the backscattered mode.
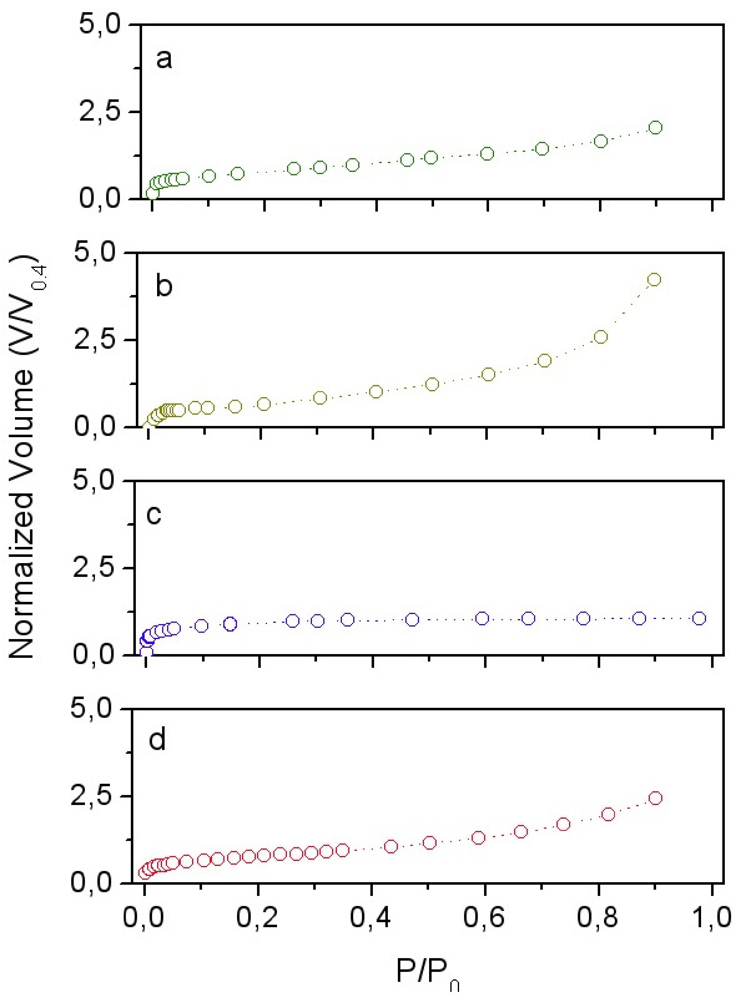
In
Figure 7 the nitrogen adsorption isotherms obtained for the SiO
2 powder at 77 K, the LaNi
5 powder, the consolidated pure silica matrix at 300 °C and the LaNi
5-SiO
2|
300 are reported. In
Table 1, data resulting from isotherm analyses are summarized. By applying the BET equation, the surface area (
SBET) of pristine pyrogenic silica resulted 245 m
2/g, corresponding to an average equivalent spherical diameter
d ≈ 10 nm (the overall powder surface is considered as the sum of single spherical particle surfaces).
Figure 7.
Normalized nitrogen adsorption isotherms at 77K for: (a) LaNi5-SiO2|300; (b) LaNi5 powder; (c) SiO2|300 consolidated sample; (d) SiO2. V0.4 are: (a) 12cm3/g; (b) 3.6cm3/g; (c) 70 cm3/g; (d) 84.6cm3/g.
Figure 7.
Normalized nitrogen adsorption isotherms at 77K for: (a) LaNi5-SiO2|300; (b) LaNi5 powder; (c) SiO2|300 consolidated sample; (d) SiO2. V0.4 are: (a) 12cm3/g; (b) 3.6cm3/g; (c) 70 cm3/g; (d) 84.6cm3/g.
Table 1.
.Samples surface (S) pores dimension (L0) and equivalent particle diameter (d) resulting from nitrogen adsorption analysis.
Table 1.
.Samples surface (S) pores dimension (L0) and equivalent particle diameter (d) resulting from nitrogen adsorption analysis.
| | SBET (m2/g) | α-plot Sext (m2/g) | DR Method | d (nm) |
|---|
| Smic (m2/g) | L0 (nm) |
|---|
| SiO2 | 245 | --- | --- | --- | 10 |
| (SiO2)|300 | --- | 65 | 82 | 1.6 | --- |
| LaNi5 | 0.5 | --- | --- | --- | 1500 |
| LaNi5-SiO2|300 | --- | 17 | 17 | 1.6 | --- |
The effect of the network formation on sample surface area and pore size can be deduced from the annealed silica pellet analysis. The obtained isotherm (see
Figure 7c) falls in type I IUPAC classification [
16], which is typical of microporous systems. The evidenced microporosity is mainly brought by the silica phase and especially by the residual internal void volume of the aggregates. By applying the DR analysis to the SiO
2|
300 data, a microporous surface (
Smic) of 82 m
2/g and an average pore dimension
L0 ≈ 1.6 nm (slit-like shape model) result. The external surface (
Sext) was evaluated by using the α-plot method, obtaining a dimension of ~65 m
2/g, the total surface area (
Stot) being ~147 m
2/g. The decrease of the total surface from 245 to 147 m
2/g due to the heating treatment, as well as the presence of micropores, indicate that condensation occurred among the silica particles. The LaNi
5 isotherm (type II) exhibits a very low surface area, (
SBET~0.5 m
2/g), corresponding to particles with an equivalent spherical diameter
d of 1.5 μm.
Analysis of the final composite LaNi
5-SiO
2|
300 isotherm (type I + II), performed by using DR and α-plot methods, gives 17 m
2/g for the micropores surface, pore size ~1.6 nm, 18 m
2/g external surface and a total surface area of 35 m
2/g, a value very close to the one resulting from BET elaboration. It is worthy to note that both the annealed samples (LaNi
5-SiO
2|
300 and SiO
2|
300) possess identical pore size, a consequence of the identical reticulation phenomenon. The measured
Stot (35 m
2/g) is lower than the expected area as can be calculated by linear combination of total surfaces of single components of the blend (~50 m
2/g by considering LaNi
5:/SiO
2 mass ratio). The observed decrease in surface area can arise from the interpenetration of alloy particles into silica aggregate structure. However, the surface area loss can also derive from metal-silica adhesive interfaces growth, due to the formation of metal silicate compounds, as reported in the following paragraph. The observed amorphous signal increase after thermal treatment supports the latter hypothesis (see
Figure 5 and
Figure 2b).
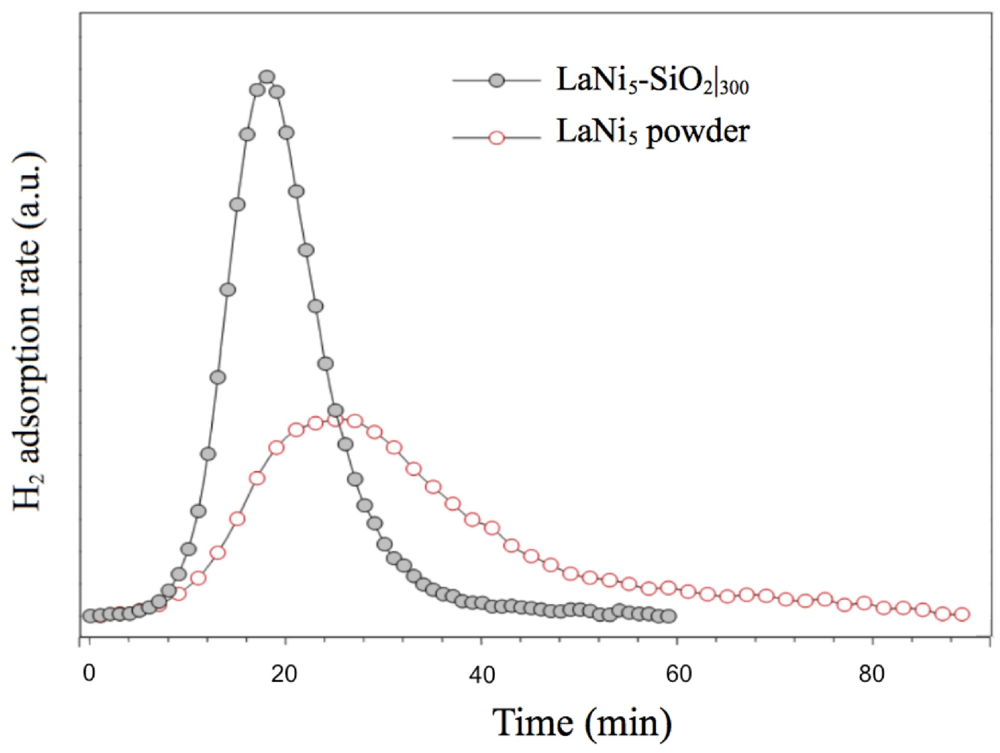
3.3. Material Behaviour to the Hydrogen Adsorption/Desorption Process
In
Figure 8, low H
2 pressure (0.03 atm) TPD/TPR analysis of LaNi
5-SiO
2 composite in comparison with LaNi
5 powder are reported. The hydrogenation kinetics show significant differences. The hydrogenation rate of the LaNi
5-SiO
2 sample is clearly faster than that of pure LaNi
5 alloy, since the signal areas represent the total amount of chemisorbed gas comparable. The faster kinetics of the composite cannot simply be derived from microstructural and morphological features of the metallic phase, as the pure alloy is processed in very similar way. A possible explanation can be found in the nucleation of oxides and silicates during the consolidating thermal treatment of the composite.
Figure 8.
Activation by low H2 pressure (0.03 atm) of LaNi5-SiO2 composite and LaNi5 powder. The TPD/TPR analysis shows the H2 adsorption isotherms at 100 °C.
Figure 8.
Activation by low H2 pressure (0.03 atm) of LaNi5-SiO2 composite and LaNi5 powder. The TPD/TPR analysis shows the H2 adsorption isotherms at 100 °C.
Indirect evidence of the formation of oxidised metal compounds, not detected in the XRD diffractograms (see
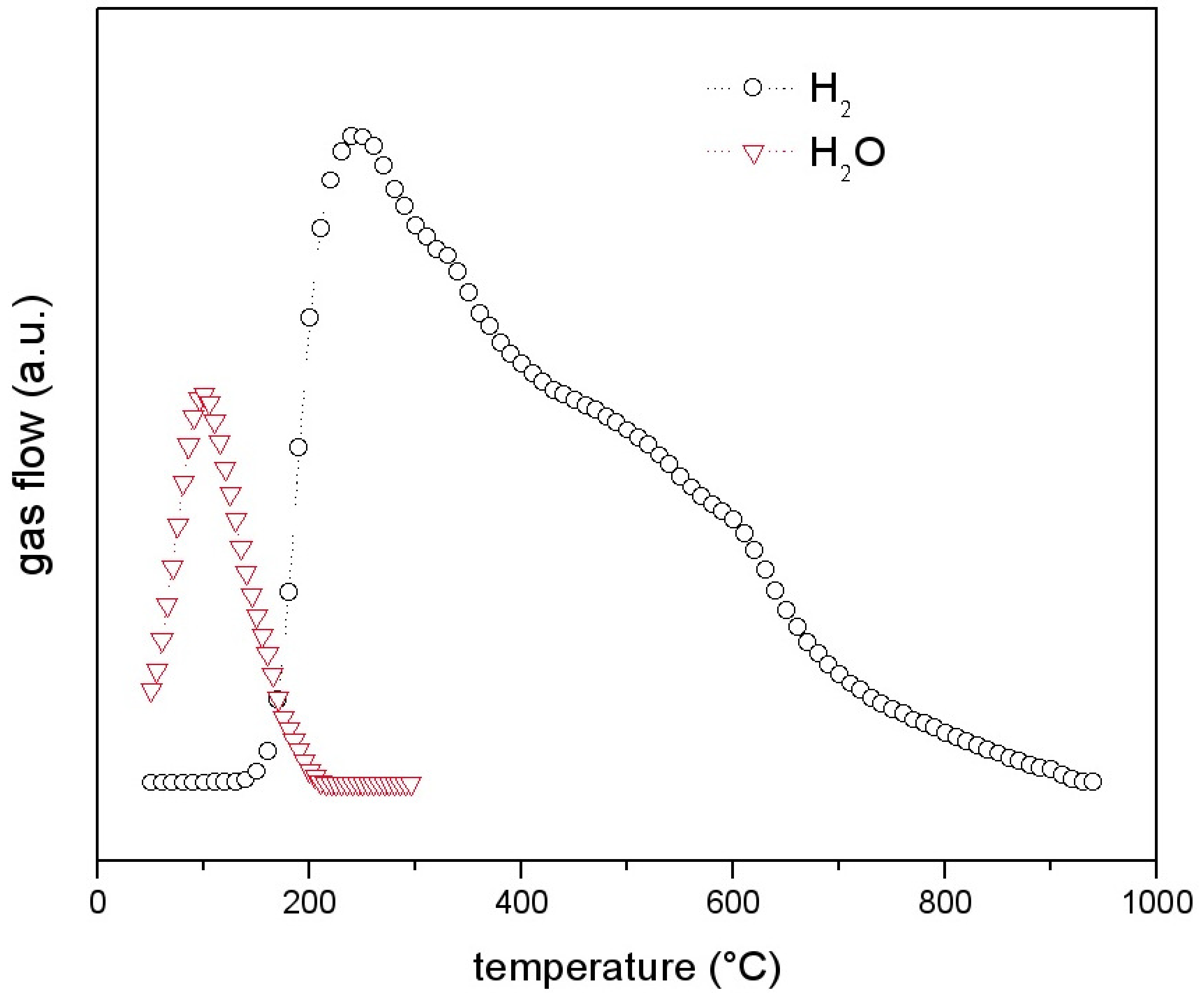
Figure 5), is given by the Thermal Programmed Desorption (TPD) analysis of a simple compressed powder mixture in pure argon flux. In
Figure 9 the gas evolution from the LaNi
5-SiO
2 substrate is reported. The TPD signal is formed by two different contributions. The first one corresponds to desorption of non bonded water from silica, while the second one, starting at about 150 °C up to the end of the analysis, corresponds to hydrogen emission.
As compacted pure silica can desorb only water, hydrogen necessarily derives from metal oxidation, due to the water. Condensation of silanol groups to form siloxane bridges can promote metal oxidation according to the following reaction (1, 2, 3):
2M + H2O → M2O+H2 (1)
2M + 2SiOH →M2O+SiOSi+H2 (2)
2M + 2SiOH → 2MOSi +H2 (3)
Silicate formation reactions (3), in particular, gives a substantial contribution to the surface area decrease evidenced by the N
2 adsorption analysis (see
Table 1).
Figure 9.
Thermal Programmed Desorption (TPD) analysis of LaNi5-SiO2|300. The signal consists in a low temperature (<300 °C) water flow followed by a consistent H2 flow.
Figure 9.
Thermal Programmed Desorption (TPD) analysis of LaNi5-SiO2|300. The signal consists in a low temperature (<300 °C) water flow followed by a consistent H2 flow.
As reported by Uchida [
19] the H
2 dissociation in atomic form is a fundamental step for the hydride phase formation. The process is strongly accelerated by the presence of surface oxides and by the porosity brought by the incorporation of the porous silica aggregates, which facilitates the diffusion of the hydrogen inside the mix.
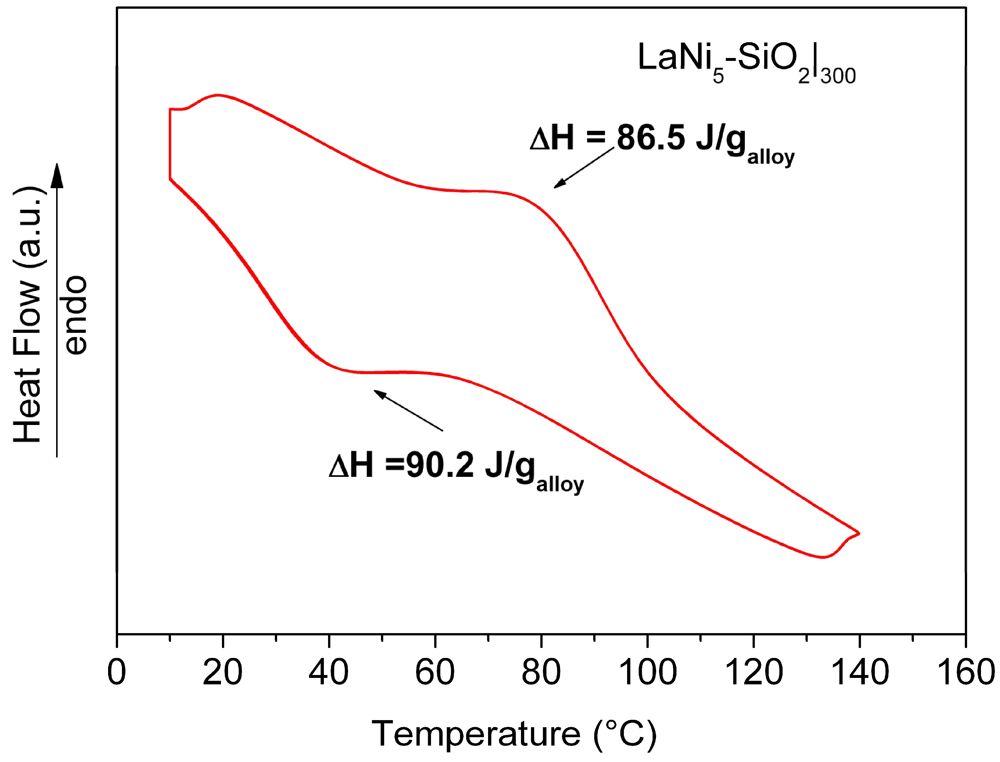
Results of HPDSC measurements performed on the LaNi
5-SiO
2|
300 pellet at 10 atm H
2 pressure, are reported in
Figure 10. The obtained thermograms do not show significant differences concerning the adsorption-desorption temperatures. The curves relative to the hydrogenation (exothermic signal) and dehydrogenation (endothermic signal) for LaNi
5-SiO
2|
300 show a maximum in heat evolution at 40 °C and 80 °C for the adsorption and desorption reactions, respectively. In comparison with data obtained for a pure LaNi
5 sample, no differences in the peak temperature values were found. However, the total amount of the measured heat fluxes (both in the desorption and adsorption stages), are lower than expected (86.6 J/g
vs. 93 J/g in the desorption stage and 90.2 J/g
vs. 99 J/g in the adsorption stage for LaNi
5-SiO
2|
300 and LaNi
5, respectively).
Figure 10.
HPDSC analysis of the consolidated LaNi5-SiO2|300 composite. Each thermal trace consists of perfectly overlapped 4 run signals.
Figure 10.
HPDSC analysis of the consolidated LaNi5-SiO2|300 composite. Each thermal trace consists of perfectly overlapped 4 run signals.
Since the obtained value is directly dependent on the exchanged hydrogen amount, a reduction of the storage capability of the alloy in the composite sample should be observed. The amount of hydrogen absorbed by the embedded metal was estimated to be around 93% with respect to the LaNi5 one. The lower hydrogen storage capability observed for the LaNi5-SiO2|300 confirms the above reported hypothesis about the formation of oxide and silicate nuclei on the metallic surface.
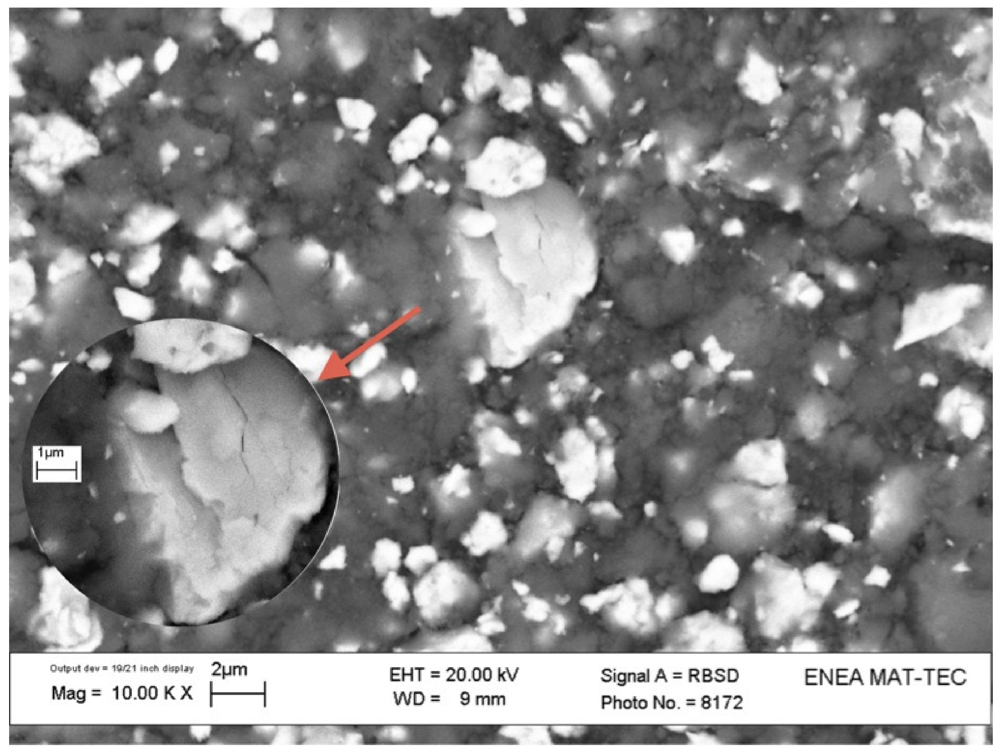
After 40 hydrogenation-dehydrogenation cycles the material showed no visible morphological and structural modifications. In
Figure 11 the SEM analysis shows that the silica matrix suitably acts as a dimensional stabilizer. The metallic particles size appears to be in the same range as the prepared material (1–1.5 μm) and the observed particle fractures were well contained within the silica matrix.
Figure 11.
Pictures of LaNi5-SiO2|300 composite pellet after 40 hydrogenation/dehydrogenation cycles (pH2 = 10 bar). In the inset, a fractured metal particle is fixed in the bed.
Figure 11.
Pictures of LaNi5-SiO2|300 composite pellet after 40 hydrogenation/dehydrogenation cycles (pH2 = 10 bar). In the inset, a fractured metal particle is fixed in the bed.


