2.1. Structural Characterization of the Hexa-ammines, Mn(NH3)6X2 (X = Cl, Br)
Reaction of MnCl
2 and MnBr
2 with ammonia gas at room temperature led to white air-sensitive powders of the ammine complexes,
1 and
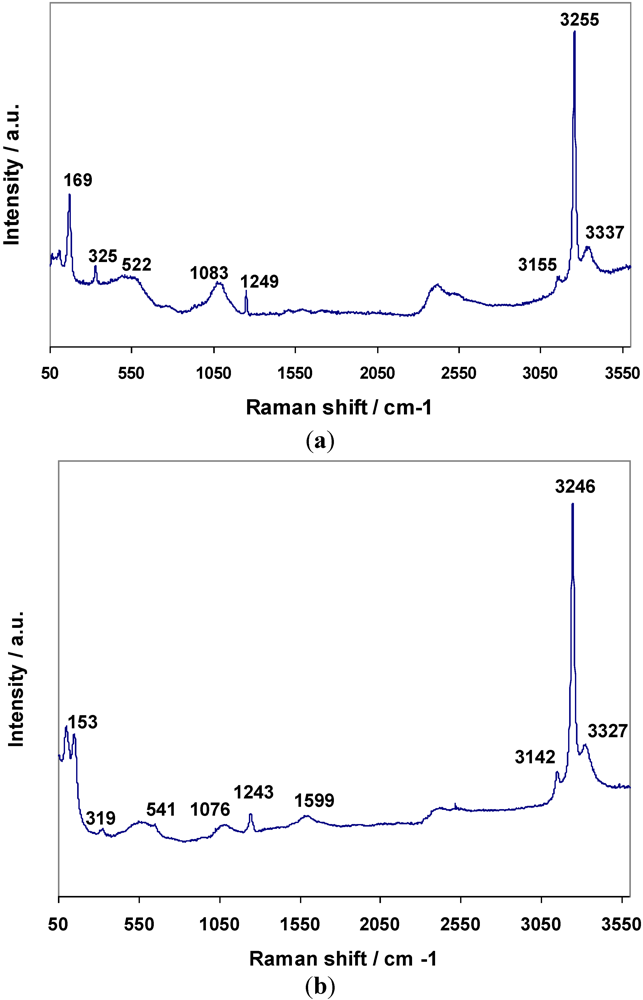
2 respectively. Raman spectra for
1 and
2 are shown in
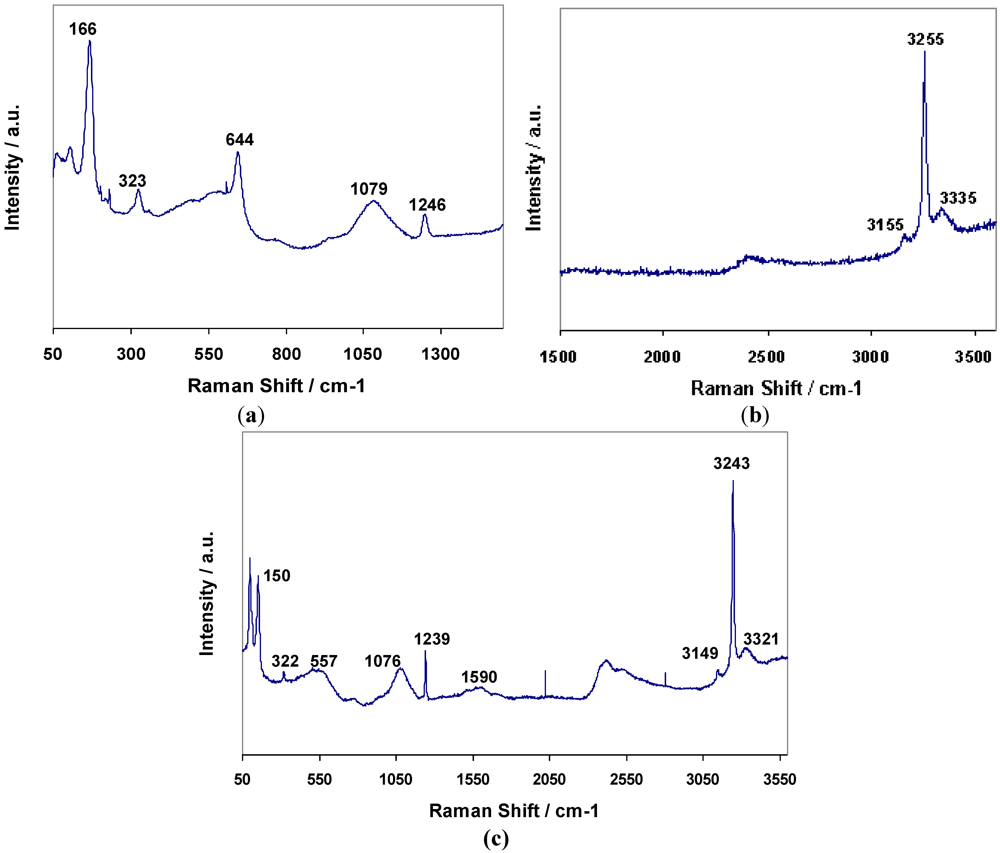
Figure 2 By comparison with published data for transition metal hexa-ammine complexes, the bands for
1 and
2 could be fully assigned to N–H and Mn–N vibrations (
Table 3) [
29,
30,
31,
32,
33]. Previous IR studies on the
M(NH
3)
6I
2 (
M = Mn, Fe) complexes have suggested that the rotation of ammonia molecules about the M-N axis is possible [
34]. From the results presented here we can establish that this is also the case at least for Mn(NH
3)
6Br
2 owing to the degenerate (
δd) band observed in the Raman spectra at 1590 cm
−1 and also the large H-H bond lengths suggested from XRD refinements (
Table 3,
Table 4,
Table 5 and
Table 6). Despite the apparent absence of the equivalent
δd band in the Raman spectrum of 1, there are sizeable intermolecular distances between neighbouring H atoms in the ammonia molecules (indeed the partially occupied H positions in the model assume dynamic disorder) and no obvious structural reason why rotation should not occur, suggesting that the band is simply too weak in the spectrum of
1 to be observed. This is consistent with the study by Eβmann
et al. who infer that the rotation of the ammonia molecules about the M-N axis in a number of transition metal ammine chlorides and bromides is free at room temperature [
25]. Further, the rotational effects observed for the ammonia molecules in single crystals of Ni(N
Y3)
6X2 (
Y = H, D and
X = Br, I, NO
3, PF
6) as investigated by neutron diffraction are described in more detail by Schiebel
et al. [
35,
36].
Table 3.
Raman data for Mn(NH3)6X2 (X = Cl, Br).
Table 3.
Raman data for Mn(NH3)6X2 (X = Cl, Br).
| Compound | Raman Shift/cm−1 |
|---|
| νas | νs | νs | δd | δs | δas | ρr | ν | δ |
|---|
| (NH3) | (NH3) | (NH3) | (HNH) | (HNH) | (HNH) | (NH3) | (MN) | (MNM) |
|---|
| 1 | 3335 | 3255 | 3155 | - | 1246 | 1079 | 644 | 323 | 166 |
| 2 | 3321 | 3243 | 3149 | 1590 | 1239 | 1076 | 557 | 322 | 150 |
Table 4.
Crystallographic data for hexa-ammines 1 and 2.
Table 4.
Crystallographic data for hexa-ammines 1 and 2.
| Compound | 1 | 2 |
|---|
| Formula | Mn(NH3)6Cl2 | Mn(NH3)6Br2 |
| Crystal System | Cubic | Cubic |
| Space Group | Fm-3m | Fm-3m |
| a/Å | 10.2742(6) | 10.528(1) |
| Volume/Å3 | 1084.5(2) | 1166.8(4) |
| Z | 4 | 4 |
| Formula Weight/g | 912.120 | 1267.728 |
| Calculated density, ρX/g·cm−3 | 1.397 | 1.804 |
| No of data | 4018 | 4137 |
| No of parameters | 29 | 36 |
| Rwp | 0.055 | 0.073 |
| Rp | 0.043 | 0.058 |
| χ2 | 1.101 | 1.073 |
Table 5.
Atomic parameters for 1 and 2 from Rietveld refinement against PXRD data.
Table 5.
Atomic parameters for 1 and 2 from Rietveld refinement against PXRD data.
| Atom | Mn(NH3)6Cl2 (1) | Mn(NH3)6Br2 (2) |
|---|
| Mn, 4a (0,0,0) | | |
| Uiso × 100/Å2 | 5.7(4) | 3.3(3) |
| X, 8c (¼, ¼, ¼) | | |
| Uiso × 100/Å2 | 5.4(4) | 5.0(2) |
| N, 24e (x, 0, 0) | | |
| X | 0.218(1) | 0.220(2) |
| Uiso × 100/Å2 | 6.0(7) | 6.3(9) |
| H, 96k (x, x, z) | | |
| X | 0.066(4) | 0.055(3) |
| Z | 0.265(3) | 0.248(5) |
| Uiso × 100/Å2 | 2.5 | 2.5 |
| Occupancy | 0.75 | 0.75 |
Figure 2.
Raman spectra for 1; (a) 50–1500 cm−1, (b) 1500–3600 cm−1, and 2 (c) 50–3600 cm−1.
Figure 2.
Raman spectra for 1; (a) 50–1500 cm−1, (b) 1500–3600 cm−1, and 2 (c) 50–3600 cm−1.
Table 6.
Interatomic distances and angles for 1 and 2.
Table 6.
Interatomic distances and angles for 1 and 2.
| Distance or angle/Å or ° | Mn(NH3)6Cl2 (1) | Mn(NH3)6Br2 (2) |
|---|
| 8 × Mn–X/Å | 4.44886(19) | 4.5586(4) |
| 6 × Mn–N/Å | 2.239(15) | 2.313(18) |
| N–H/Å | 1.07(5) | 0.88(6) |
| 3.183(34) × 5 |
| 3.210(26) × 6 | 3.94(5) × 2 |
| 4.05(4) × 4 | 4.99(4) × 3 |
| H1–H1/Å | 2.89(8) × 2 | 2.86(8) × 2 |
| 3.97(4) × 2 |
| 4.19(5) × 2 | 3.78(8) × 2 |
| 4.81(7) × 2 | 3.95(8) × 2 |
| 4.83(7) | 4.51(10) × 2 |
| X–Mn–X/° | 70.529(2) × 2 | 109.471(5) × 3 |
| 70.529(4) | 70.529(5) × 2 |
| 109.471(4) × 3 | 180.000 |
| 179.972(1) | |
Initial search-matching procedures for the PXRD powder pattern of
1 revealed a match with that of the corresponding Mg analogue (PDF card No: 01-075-6756) and the pattern could be indexed to a cubic cell with
a = 10.442 Å [
9]. Although there is no refined crystal structure for Mn(NH
3)
6Br
2, Watt and Manhas reported XRD data (and elemental analysis) for the hexa-ammine formed by the reaction of MnBr
2 with liquid ammonia [
37]. The PXRD data obtained for
2 matched well with the pattern of Fe(NH
3)
6Br
2 (PDF card No: 01-085-2095), which was generated using the Powdercell software package from single crystal structural data, and could thus be indexed to a cubic unit cell with
a = 10.249 Å [
25,
38]. From the observed reflections, it was thus deduced that Mn(NH
3)
6Br
2 and Mn(NH
3)
6Cl
2 were isostructural. Subsequent Rietveld refinements for
1 and
2 were performed taking the previous single crystal X-ray structure of Mn(NH
3)
6Cl
2 and isostructural Fe(NH
3)
6Br
2 as the respective starting models [
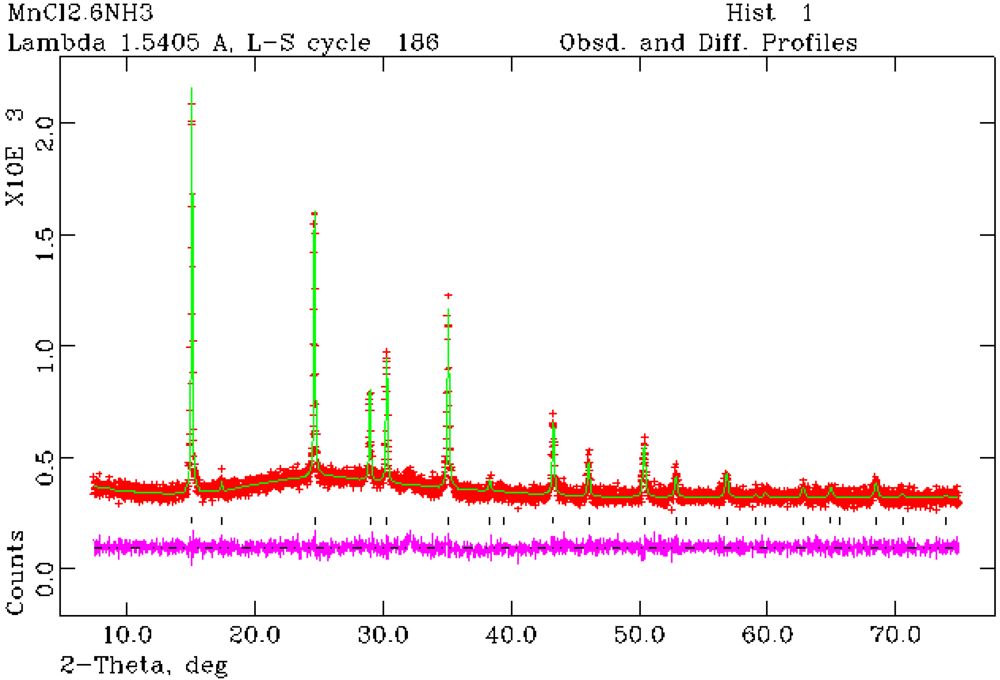
25]. The refinements of 1 and 2 were performed following an identical strategy in which the background coefficients (GSAS Function 8, a reciprocal interpolation function), scale factor and the unit cell parameters were varied in the initial cycles. The atomic parameters, peak profile parameters and isotropic displacement parameters (for non-hydrogen atoms) were varied subsequently. Modeling of the peak shapes used function 2, the Thompson-Cox-Hastings pseudo-Voigt function. The final crystallographic results for
1 and
2 are presented in
Table 4, atomic parameters in
Table 5 and interatomic distances angles in
Table 6. Profile plots for the refinements are shown in
Figure 3 and
Figure 4.
Figure 3.
Rietveld refinement profile for 1 from PXRD data. Crosses indicate the observed data, the upper continuous line shows the calculated profile and the lower continuous line the difference profile. Tick marks show reflection positions for cubic Mn(NH3)6Cl2.
Figure 3.
Rietveld refinement profile for 1 from PXRD data. Crosses indicate the observed data, the upper continuous line shows the calculated profile and the lower continuous line the difference profile. Tick marks show reflection positions for cubic Mn(NH3)6Cl2.
Figure 4.
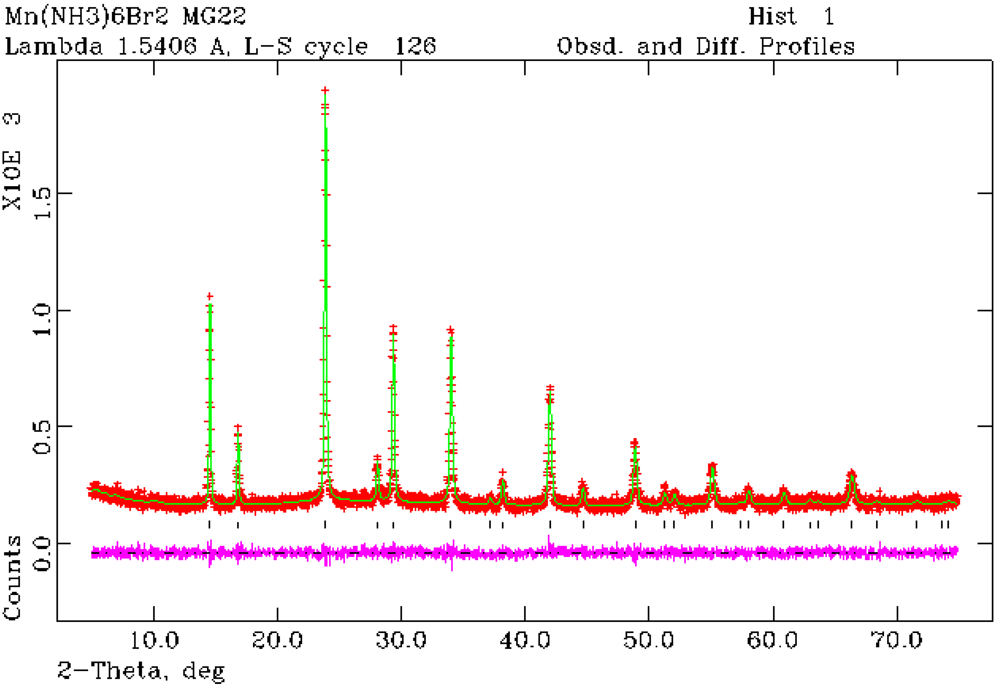
Rietveld refinement profile for 2 from PXRD data. Crosses indicate the observed data, the upper continuous line shows the calculated profile and the lower continuous line the difference profile. Tick marks show reflection positions for cubic Mn(NH3)6Br2.
Figure 4.
Rietveld refinement profile for 2 from PXRD data. Crosses indicate the observed data, the upper continuous line shows the calculated profile and the lower continuous line the difference profile. Tick marks show reflection positions for cubic Mn(NH3)6Br2.
Structure refinement against PXRD data confirmed that Mn(NH
3)
6Cl
2 (
1) forms with the cubic K
2[PtCl
6]-type structure as previously reported from single crystal X-ray analysis [
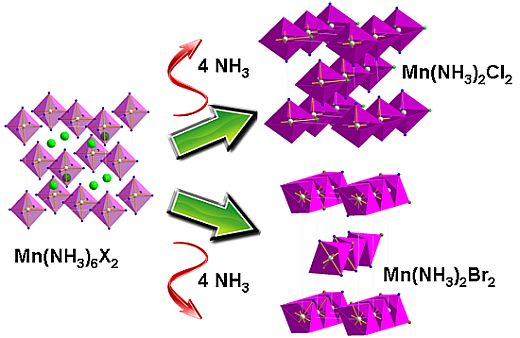
24]. Rietveld refinement has also established for the first time that Mn(NH
3)
6Br
2 also crystallizes with the K
2[PtCl
6]-type structure and is thus isostructural with the chloride and Fe(NH
3)
6Br
2 (
Figure 4) [
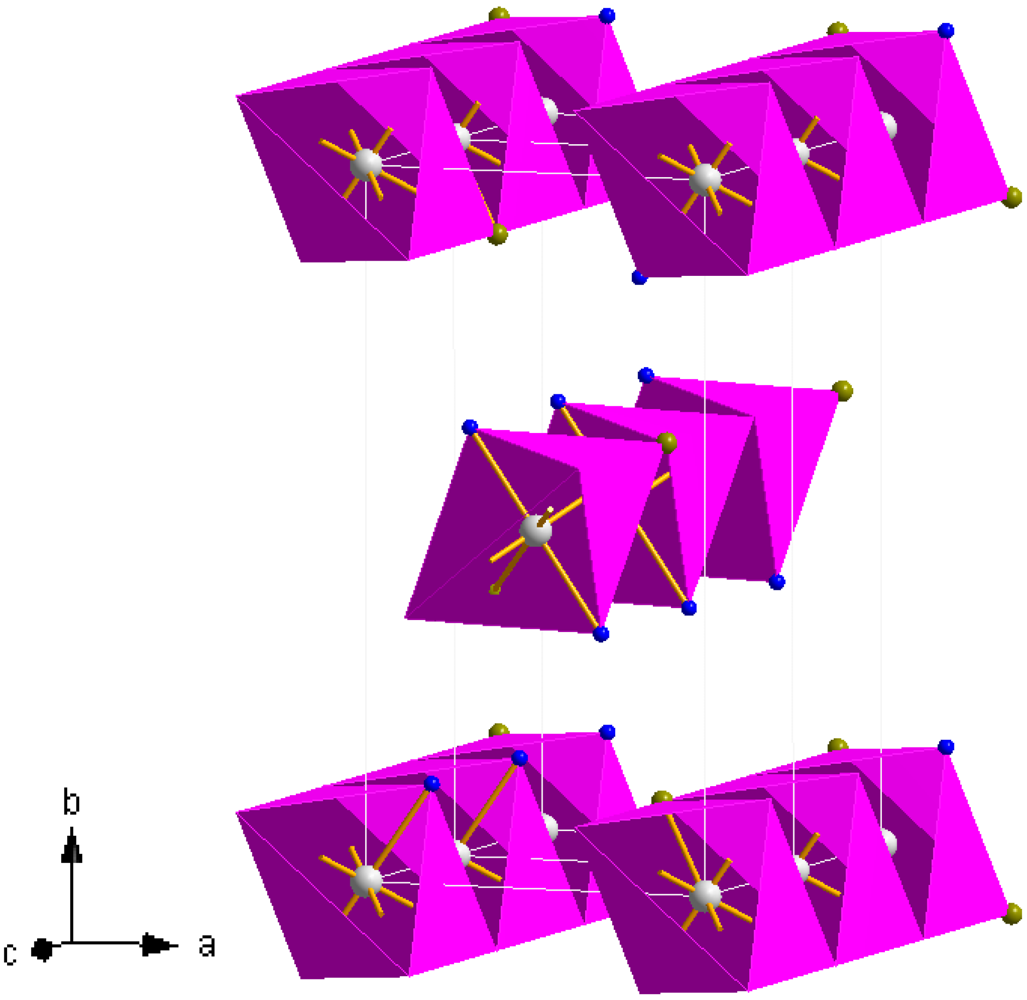
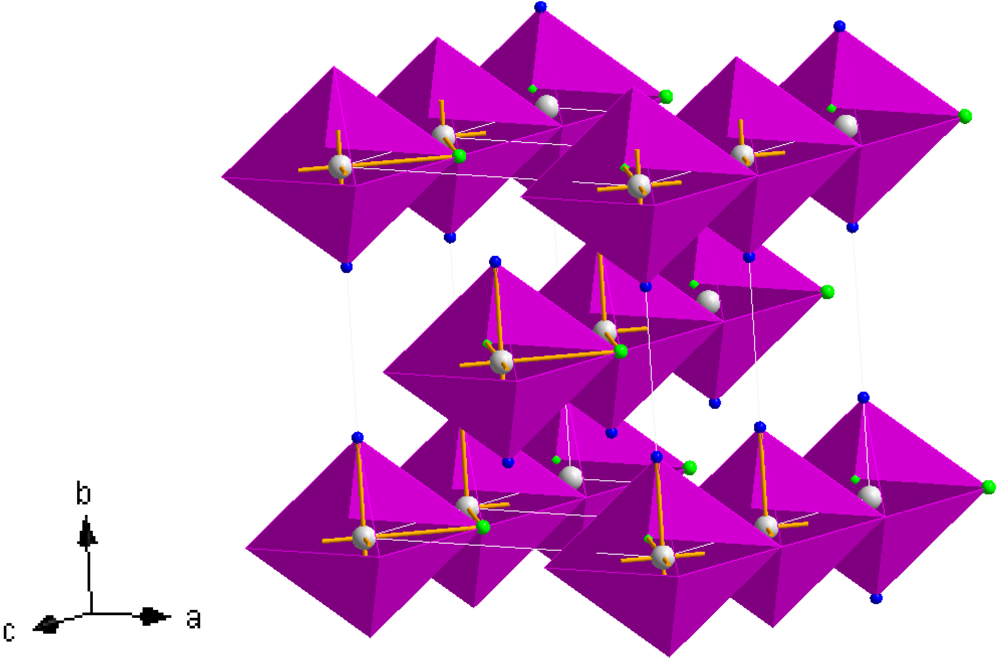
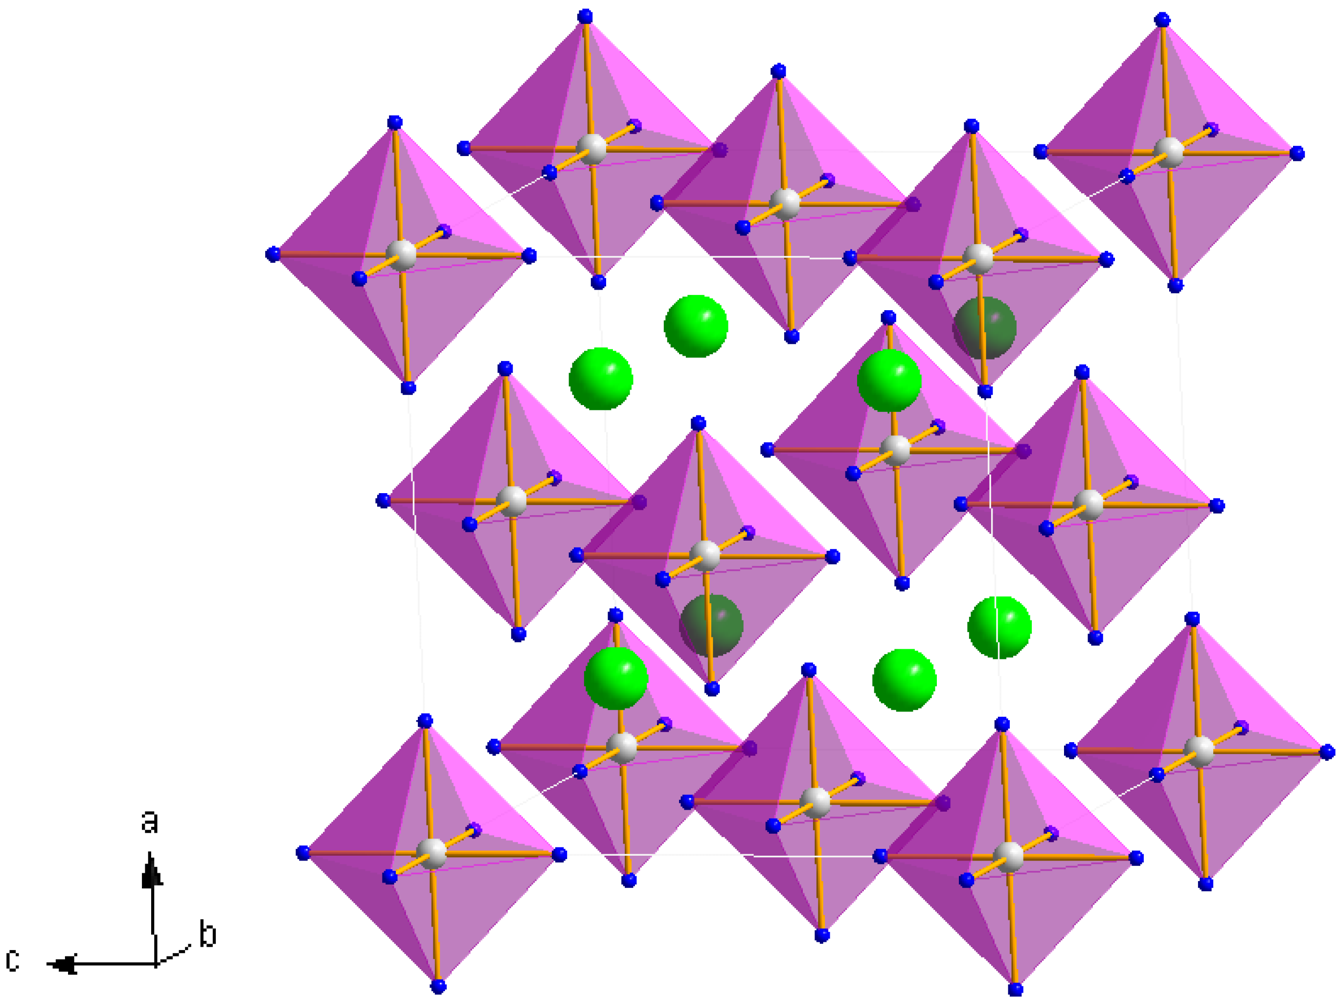
25]. The hexa-ammine structures can be considered to be composed of a FCC lattice of isolated octahedral complex ammoniate cations,
i.e., [Mn(NH
3)
6]
2+, with halide anions,
X (
X = Cl
−, Br
−), occupying the tetrahedral interstices of the unit cell in a distorted close-packed cubic configuration (
Figure 1) [
39]. Although these [Mn(NH
3)
6]
2+ octahedra are effectively isolated, Sørensen
et al. haveevoked the concept of weakly bound-[Mn(NH
3)
6]–X—“chains” in rationalizing the ammonia sorption mechanism [
23]. These chains are thus composed of metal octahedra connected along the chain length via the interceding halide anions. Alternatively, the cubic hexa-ammine structure could be viewed as a simple cubic lattice of halide anions with nitrogen occupying the faces of each halide cube and manganese located in the body centers of alternate halide cubes.
We observe that the cubic structure expands as a result of the replacement of Cl
− by Br
− as would be anticipated from ionic radii arguments [
40,
41]. Previously reported structural models of the hexa-ammines have defined partially occupied hydrogen positions (96
k sites that are 75% occupied) reflecting the dynamic disorder of the ammonia ligands in the octahedral cations. Although it would not be expected that powder X-ray diffraction methods could resolve the positions and disorder of the hydrogen with any great accuracy, we were tentatively able to vary the hydrogen coordinates and achieve stable, convergent refinements with reasonable N–H bond distances. The Mn–N distances in the complex cations are similar to those observed for other transition metals in equivalent ammoniates and the bond length increases slightly from chloride to bromide [
25].
2.2. Deammoniation of the Hexa-ammines by TPD
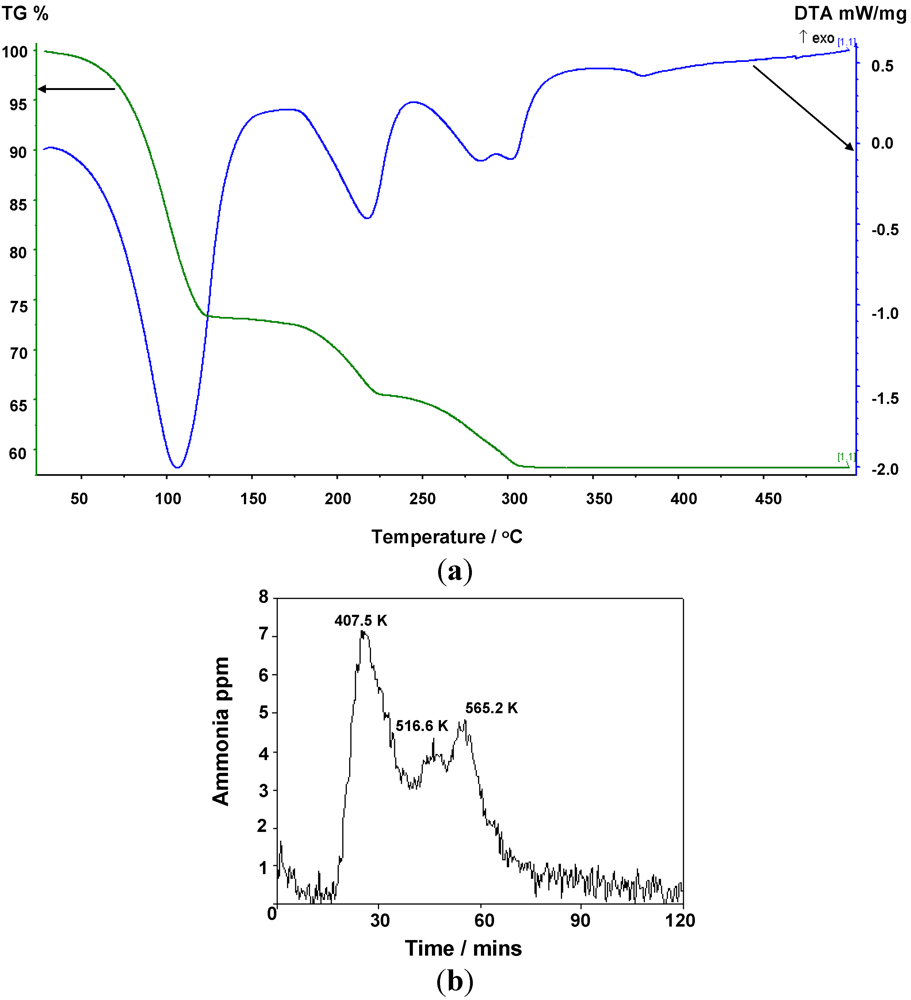
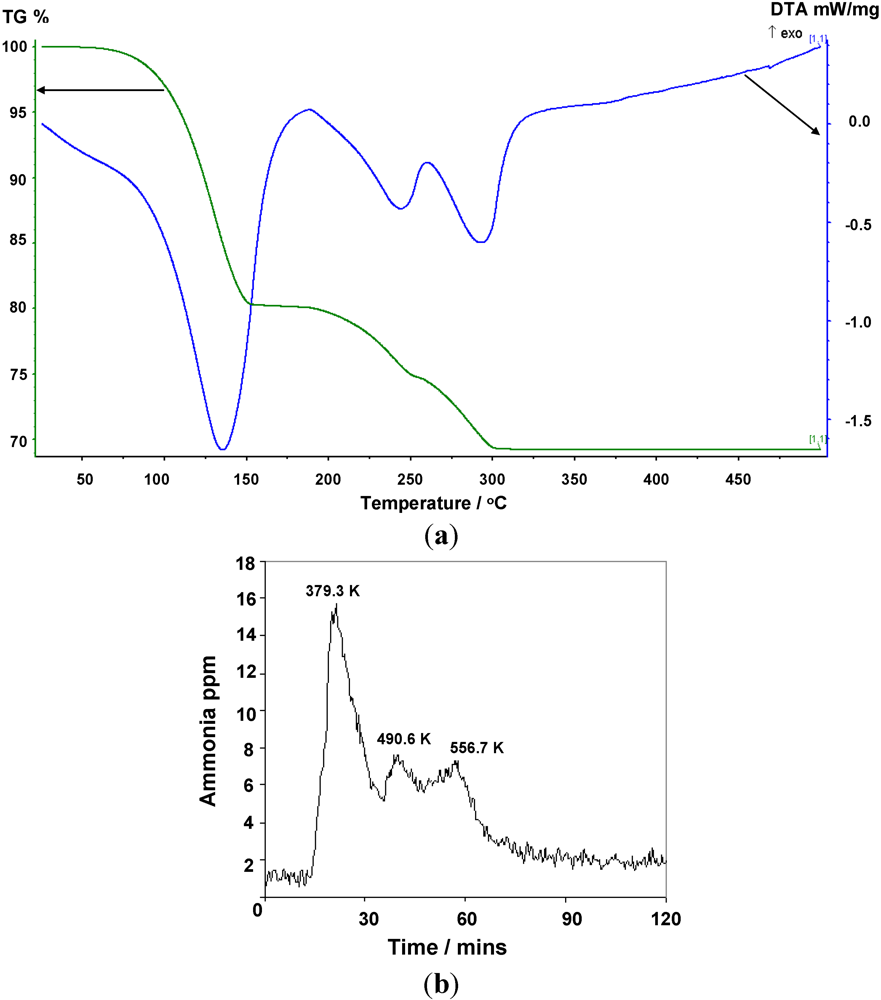
The TGA results collected to 773 K for
1 and
2 (
Figure 5,
Figure 6 and
Table 7) show a 3-stage mass loss in each case which, by simultaneous MS analysis of the gases released, is associated solely with the loss of ammonia. The DTA data indicate four distinct endothermic events with minima at 379.3 K, 490.6 K, 556.7 K and 574.5 K respectively for
1, and three distinct endothermic events at 407.5 K, 516.6 K and 565.2 K for
2 that correlate to each mass loss for both complexes. Careful isolation of the di- and mono-ammoniated compounds using TG-DTA has been possible by ceasing the heating process at the appropriate stage of decomposition. For the chloride complex, TGA analysis to 398 K and 498 K allowed isolation of the di- and mono-ammoniated decomposition products respectively. Slightly higher temperatures were used to isolate the di- and mono-ammoniates for the bromide; 423 K and 523 K respectively. The increase in deammoniation temperatures from the
1 to
2 is unsurprising upon consideration of the respective enthalpies for the ammines in
Table 2.
Table 7.
De-ammoniation parameters of Mn(NH3)6Cl2 (Mn(NH3)6Br2).
Table 7.
De-ammoniation parameters of Mn(NH3)6Cl2 (Mn(NH3)6Br2).
| Step | Expected number of equivalent ammonia molecules lost | Expected weight loss/% | Observed weight loss/% | Onset temperature of deammoniation,
Ti/K | Final temperature of deammoniation,
Tf/K |
|---|
| 1 | 4 | 29.8 (21.5) | 26.9 (19.8) | 300.8 (298.5) | 401.1 (428.6) |
| 2 | 1 | 7.5 (5.4) | 7.8 (5.5) | 410.3 (449.6) | 504.0 (528.4) |
| 3 | 1 | 7.5 (5.4) | 7.2 (5.5) | 504.0 (528.4) | 590.1 (584.5) |
| Total | 6 | 44.8 (32.3) | 41.8 (30.8) | - | - |
Figure 5.
(a) TG-DTA data, and (b) corresponding MS data for the thermal decomposition of Mn(NH3)6Cl2.
Figure 5.
(a) TG-DTA data, and (b) corresponding MS data for the thermal decomposition of Mn(NH3)6Cl2.
Figure 6.
(a) TG-DTA data, and (b) corresponding MS data for the thermal decomposition of Mn(NH3)6Br2.
Figure 6.
(a) TG-DTA data, and (b) corresponding MS data for the thermal decomposition of Mn(NH3)6Br2.
Reaction Scheme 1 hence describes the anticipated route by which the chloride and bromide ammoniates release ammonia in accordance with the TPD data observed in this study. These are comparable with data observed in literature for various dichloride ammines [
9]. The TGA profile in
Figure 6 suggests that weight loss for
1 occurs almost immediately (marginally above room temperature) and in contrast to previous work, ammonia desorption is complete below 600 K. The bromide, 2, begins to desorb ammonia at a higher temperature than the chloride commensurate with its higher desorption enthalpy (
Table 2), but this onset still lies below 373 K.
Although ostensibly both halides exhibit a three-step loss of ammonia with increasing temperature, it is evident from close examination of the chloride DTA profile (
Figure 5) that the transformation from the presumed mono-ammine to the deammoniated chloride, MnCl
2, appears to progress through two closely spaced (almost overlapping) thermal events. Indeed, a change in the slope of the TGA profile at the same temperature as the double minimum in the DTA trace (556.7 and 574.5 K) would also suggest that the loss of the final ammonia molecule is not a stoichiometric process from mono-ammine to MnCl
2. This TG-DTA profile is in agreement with two (or more) gas releases from nominal Mn(NH
3)Cl
2 measured by Sørensen
et al., although the equivalent desorption in their study appeared to occur at a temperature
ca. 80 K above that seen herein [
9]. By contrast, the temperature range over which the dibromide deammoniates is narrower, which results in the successive deammoniation steps being less widely spaced (in temperature and time) and, for example a stability domain for the nominal mono-ammine of only several
K. Although the final desorption step has not yet been resolved into more than one event in either the DTA or TGA traces, the asymmetry of the DTA peak and the fluctuations in slope of the TGA trace would suggest an analogous non-stoichiometric decomposition from mono-ammine to dihalide to that observed for
1. A mechanism for ammonia absorption/desorption for
M(NH
3)
nCl
2 (
M = Mg, Mn, Ni) ammines was proposed by Sørensen
et al. using DFT calculations. This model indicated that ammonia molecules could enter and leave the bulk interface via the zipping/unzipping of the loosely-bound “chains” of octahedral ML
6 groups (where
L could be either NH
3 and/or Cl depending on
n) to allow conservation of the metal coordination geometry independent of n. This model necessarily also involves structural rearrangement in the bulk after each successive sorption step. In the later deammoniation steps, for example, it would be necessary not only for Cl to substitute for NH
3 in each ML
6 octahedron, but also for the resulting octahedra to condense and form edge sharing chains. The structures of the lower Mn ammines are discussed in more detail below, but the non-stoichiometric decomposition from mono-ammine to dihalide observed above could be rationalized in the intermediate loss of one NH
3 unit for every two Mn centers in the edge-sharing octahedral clusters in Mn(NH
3)
X2 and a process as described in Scheme 2:
2.3. Structural Characterization of the Lower Ammoniates
Decomposition of
1 and
2 to 398 K and 423 K respectively in the TG-DTA experiments led to small samples (
ca. 50 mg) of air-sensitive, light pink and light orange/brown powders (
3 and
4) respectively. Decomposition of
1 and
2 conducted to higher temperatures, 498 and 523 K respectively, led to air-sensitive, pink and light orange/brown powders to give the nominal mono-ammoniated complexes,
5 and
6 respectively. After weight losses were complete for both systems a blackened solid mass (
7) and an orange/brown powder (
8) respectively were the result. Raman spectra for
3 and
4 are shown in
Figure 7a,b respectively, and assignments are given in
Table 8. The bands for
3 and
4 have been assigned to N–H and Mn–N vibrations based on the premise that similar bonding modes exist in both the hexa- and di-ammines. The presence of the weak degenerate
δd band at 1599 cm
−1 in
4 would suggest that there is similar dynamic disorder (rotation) of NH
3 groups in the diammines to that observed in the hexammines (and again this band is observable in the bromide but not the chloride).
Figure 7.
Raman data for (a) Mn(NH3)2Cl2 and (b) Mn(NH3)2Br2.
Figure 7.
Raman data for (a) Mn(NH3)2Cl2 and (b) Mn(NH3)2Br2.
Table 8.
Raman data for Mn(NH3)2X2 (X = Cl, Br).
Table 8.
Raman data for Mn(NH3)2X2 (X = Cl, Br).
| Compound | Raman Shift/cm−1 |
|---|
| νas | νs | νs | δd | δs | δas | ρr | ν | δ |
|---|
| (NH3) | (NH3) | (NH3) | (HNH) | (HNH) | (HNH) | (NH3) | (MN) | (MNM) |
|---|
| 3 | 3337 | 3255 | 3155 | - | 1249 | 1083 | 522 | 325 | 169 |
| 4 | 3327 | 3246 | 3142 | 1599 | 1243 | 1076 | 541 | 319 | 153 |
Initial search-matching procedures for the PXRD powder pattern of
3 revealed a match with the Mg analogue (PDF card No: 01-073-4070) and the pattern could be indexed to an orthorhombic unit cell with
a = 8.180 Å,
b = 8.200 Å,
c = 3.750 Å [
41]. From the observed reflections, it was deduced that
3 was isostructural with Fe(NH
3)
2Cl
2 and Mg(NH
3)
2Cl
2 and matched well to a powder pattern generated using Powdercell in which Mn was placed on the Fe positions of the orthorhombic
Cmmm Fe(NH
3)
2Cl
2 structure [
15]. Inspection of patterns for
4 revealed a match with that of the corresponding Mg analogue (PDF card No: 01-089-6789) [
38,
41]. The pattern for
4 could be indexed to an orthorhombic unit cell with
a = 5.944 Å,
b = 11.876 Å,
c = 3.983 Å and it was apparent that
4 was isostructural with Fe(NH
3)
2Br
2 and Mg(NH
3)
2Br
2 (orthorhombic
Pbam) [
16,
38,
41].
Subsequent Rietveld refinements for
3 and
4 were performed taking the previous single crystal X-ray structures of the relevant isostructural iron ammines as the respective starting models [
16]. The refinements were conducted using PXRD data collected from the di-ammine products from the TG-DTA experiments,
i.e.,
3 and
4, which were isolated by heating
1 and
2 to 398 K and 423 K respectively. The refinements of
3 and
4 were performed following a similar sequence in which the background coefficients (GSAS Function 8, a reciprocal interpolation function), scale factor and the unit cell parameters were varied in the initial cycles. The peak profile parameters, atomic parameters including isotropic displacement parameters (for non-hydrogen atoms) were varied subsequently. Modeling of the peak shapes was performed using the Thompson-Cox-Hastings pseudo-Voigt function (function 2 in GSAS). It was not possible in the refinements of either
3 or
4 to refine the positions or displacement parameters of the hydrogen atoms, so these were fixed at values from the literature models of the equivalent iron compounds [
16]. The final crystallographic results for
3 and
4 are presented in
Table 9, atomic parameters in
Table 10 and interatomic distances and angles in
Table 11. (STA data for the isolation of the di-ammines and profile plots for the refinements can be found in the supplementary material).
Table 9.
Crystallographic data from Rietveld refinement of PXRD data for di-ammines, 3 and 4.
Table 9.
Crystallographic data from Rietveld refinement of PXRD data for di-ammines, 3 and 4.
| Compound | 3 | 4 |
|---|
| Formula | Mn(NH3)2Cl2 | Mn(NH3)2Br2 |
| Crystal System | Orthorhombic | Orthorhombic |
| Space Group | Cmmm | Pbam |
| a/Å | 8.1991(9) | 6.0109(5) |
| b
/Å | 8.2498(7) | 12.022(1) |
| c
/Å | 3.8212(4) | 4.0230(2) |
| Volume/Å3 | 258.47(7) | 290.72(4) |
| Z | 2 | 2 |
| Formula Weight/g | 319.812 | 497.616 |
| Calculated density, ρX/g cm−3 | 2.055 | 2.842 |
| No of data | 3290 | 3410 |
| No of parameters | 34 | 36 |
| Rwp | 0.034 | 0.065 |
| Rp | 0.025 | 0.048 |
| χ2 | 2.182 | 8.303 |
Table 10.
Atomic parameters for 3 and 4 from Rietveld refinement against PXRD data.
Table 10.
Atomic parameters for 3 and 4 from Rietveld refinement against PXRD data.
| Compound | Mn(NH3)2Cl2 (3) | Mn(NH3)2Br2 (4) |
|---|
| Mn | 2a (0,0,0) | 2a (0,0,0) |
| Uiso | 1.0(2) | 2.0(2) |
| X | 4h (x, 0, ½) | 4
h (x, y, ½) |
| X | 0.2244(6) | 0.2439(9) |
| Y | 0 | 0.3904(2) |
| Uiso | 0.4(3) | 1.65(9) |
| N | 4i (0, y, 0) | 4g (x, y, 0) |
| X | 0 | 0.193(3) |
| Y | 0.270(2) | 0.140(2) |
| Uiso | 2.50 | 2.50 |
| H(1) | 16
r (x, y, z) | 8
i (x, y, z) |
| X | 0.045 | 0.355 |
| Y | 0.312 | 0.109 |
| Z | 0.158 | 0.143 |
| Uiso | 2.50 | 2.50 |
| Occupancy | 0.75 | 0.75 |
| H(2) | | 8
i (x, y, z) |
| X | | 0.220 |
| Y | | 0.177 |
| Z | | 0.143 |
| Uiso | | 2.50 |
| Occupancy | | 0.75 |
Table 11.
Interatomic distances and angles for 3 and 4.
Table 11.
Interatomic distances and angles for 3 and 4.
| Distance or angle/Å or° | Mn(NH3)2Cl2 (3) | Mn(NH3)2Br2 (4) |
|---|
| Mn–N/Å | 2.231(16) ×2 | 2.046(30) ×2 |
| Mn–X/Å | 2.653(4) ×4 | 2.855(3) ×4 |
| N–H(1)/Å | 0.786(7) ×4 | 1.190(13) ×2 |
| N–H(2)/Å | | 0.743(19) ×2 |
| X–H/Å | 2.57(5) ×4 | 2.743(5) ×2 |
| H(1)–H(1)/Å | 0.72(9) | 1.151(1) |
| 0.93(6) |
| 0.58(9) |
| H(1)–H(2)/Å | | 1.152(1) |
| 1.628(1) |
| H(2)–H(2)/Å | | 1.151(1) |
| X–Mn–X/° | 87.85(16) | 89.57(13) |
| 92.15(16) | 90.43(13) |
| 179.966(1) | 179.980(1) |
The unit cell parameters of
3 are slightly larger than those in both the isostructural magnesium and iron chloride ammines as would be expected by comparison of the respective ionic radii of high spin Mn
2+vs. Mg
2+ and high spin Fe
2+ (and as is also the case for the respective hexa-ammines) [
37,
38,
40,
41]. A representation of the structure of
3 is given in
Figure 8. The structure is composed of edge sharing Mn(NH
3)
2Cl
4 octahedra (which can be termed as
![Crystals 02 00193 i003]()
chains in which the trans-NH
3 groups are thus terminal and the halide groups are bridging) which propagate parallel to the [001] direction. The chains are effectively aligned parallel in the (110) plane throughout the structure with each chain translated by half the [001] face diagonal with respect to its nearest neighbour. Leineweber
et al have also rationalised the orthorhombic structure in terms of CsCl-type motifs and described isostructural Mg(NH
3)
2Cl
2 as a brick-like arrangement of double CsCl units in the
ab plane [
38,
41]. The Mn–N bond length in
3 is broadly similar to those in the hexa-ammmines,
1 and
2, and close to those observed in the equivalent magnesium and iron compounds [
16,
38,
41].
Figure 8.
Crystal structure of
3, Mn(NH
3)
2Cl
2; Mn (white sphere), Cl (green spheres), N (blue spheres) [
38,
41].
Figure 8.
Crystal structure of
3, Mn(NH
3)
2Cl
2; Mn (white sphere), Cl (green spheres), N (blue spheres) [
38,
41].
4 is isostructural with Fe(NH
3)
2Br
2 and Mg(NH
3)
2Br
2 (
Figure 9) [
16,
38,
41]. As with
3, the unit cell of
4 is larger than the Fe and Mg analogues. Similar to
3,
4 is composed of
![Crystals 02 00193 i004]()
chains (where Br replaces Cl as X). The key difference in the structures of
3 and
4 lies in the relative arrangement of these edge sharing octahedral chains. As Bremm and Meyer point out, the packing of the chains in the
Pbam structures is hexagonal as opposed to the tetragonal sequence in the
Cmmm compounds [
16]. Hence, successive rows of edge-sharing octahedra running parallel to the [110] direction are rotated by 90°. Following the double CsCl unit notation used by Leineweber
et al, the units are arranged in a herringbone pattern in the
ab plane in the bromide (as opposed to the brick-like arrangement in the chloride). Mn–X distances are longer in
4 than
3 as would be expected on coordination of the metal to the larger halides [
37,
40]. The Mn–N distance in
4 is shorter however and comparable to that observed in Fe(NH
3)
2Cl
2. Inevitably from the mismatch in Mn–N and Mn–X bond lengths in both
3 and
4 the MnX
4(NH
3)
2 octahedra are axially compressed in both compounds. We are unable to draw any firm conclusions regarding the positions or dynamics of the hydrogens from our relatively limited models from PXRD. The Mg(ND
3)
2X2 compoundshave been studied by neutron diffraction to resolve such issues and a similar approach would be required in the Mn–NH
3–
X systems to understand the relationships of NH
3 rotational disorder with halide and temperature [
42].
Figure 9.
Crystal structure of
4, Mn(NH
3)
2Br
2; Mn (white sphere), Br (yellow spheres), N (blue spheres) [
38,
41].
Figure 9.
Crystal structure of
4, Mn(NH
3)
2Br
2; Mn (white sphere), Br (yellow spheres), N (blue spheres) [
38,
41].
Further de-ammoniation of
1 and
2 to yield the anticipated mono-ammoniated complexes
5 and
6 was performed although isolation of these phases is yet to be achieved owing to the apparent narrow stability range (prior to further desorption). In the available literature, among the transition metal ammines only the Fe(NH
3)Cl
2 and Ni(NH
3)
X2 (
X = Cl, Br) have been crystallographically characterized giving hexagonal
P6
3/mmc and monoclinic
I2
/m structures for the Fe and Ni compounds respectively [
16,
43]. Further heating of
1 and
2 gave rise to
7 and
8 which were amorphous by PXRD. Raman spectra for
7 and
8 showed no notable features over the measurement range and none of the bands that were present in
1–
4 from which one could infer that deammoniation was complete as suggested by the thermogravimetric data.


 chains in which the trans-NH3 groups are thus terminal and the halide groups are bridging) which propagate parallel to the [001] direction. The chains are effectively aligned parallel in the (110) plane throughout the structure with each chain translated by half the [001] face diagonal with respect to its nearest neighbour. Leineweber et al have also rationalised the orthorhombic structure in terms of CsCl-type motifs and described isostructural Mg(NH3)2Cl2 as a brick-like arrangement of double CsCl units in the ab plane [38,41]. The Mn–N bond length in 3 is broadly similar to those in the hexa-ammmines, 1 and 2, and close to those observed in the equivalent magnesium and iron compounds [16,38,41].
 chains (where Br replaces Cl as X). The key difference in the structures of 3 and 4 lies in the relative arrangement of these edge sharing octahedral chains. As Bremm and Meyer point out, the packing of the chains in the Pbam structures is hexagonal as opposed to the tetragonal sequence in the Cmmm compounds [16]. Hence, successive rows of edge-sharing octahedra running parallel to the [110] direction are rotated by 90°. Following the double CsCl unit notation used by Leineweber et al, the units are arranged in a herringbone pattern in the ab plane in the bromide (as opposed to the brick-like arrangement in the chloride). Mn–X distances are longer in 4 than 3 as would be expected on coordination of the metal to the larger halides [37,40]. The Mn–N distance in 4 is shorter however and comparable to that observed in Fe(NH3)2Cl2. Inevitably from the mismatch in Mn–N and Mn–X bond lengths in both 3 and 4 the MnX4(NH3)2 octahedra are axially compressed in both compounds. We are unable to draw any firm conclusions regarding the positions or dynamics of the hydrogens from our relatively limited models from PXRD. The Mg(ND3)2X2 compoundshave been studied by neutron diffraction to resolve such issues and a similar approach would be required in the Mn–NH3–X systems to understand the relationships of NH3 rotational disorder with halide and temperature [42].