Article

Crystal, Optical, Thermal and Dielectric Properties, XPS, and NEXAFS of Magnesium-Doped Nickel–Bismuth Stibate Pyrochlore


by
Nadezhda A. Zhuk
1,*,
Maria G. Krzhizhanovskaya
2,
Alexandra V. Koroleva
2,
Shamil S. Shayakhmedov
2,
Nikolay A. Sekushin
3,
Vladimir A. Belyy
3,
Olga V. Petrova
4,
Sergey V. Nekipelov
4 and
Ratibor G. Chumakov
5
1
Institute of Natural Sciences, Syktyvkar State University, Oktyabrsky Prospect, 55, Syktyvkar 167001, Russia
2
Institute of Earth Sciences, Saint Petersburg State University, University Emb. 7/9, St. Petersburg 199034, Russia
3
Institute of Chemistry of the Komi Science Center UB RAS, Pervomaiskaya St. 48, Syktyvkar 167982, Russia
4
Institute of Physics and Mathematics of the Komi Science Center UB RAS, Oplesnina St. 4, Syktyvkar 167982, Russia
5
National Research Center Kurchatov Institute, Moscow 123182, Russia
*
Author to whom correspondence should be addressed.
Crystals 2026, 16(9), 563; https://doi.org/10.3390/cryst16090563
Submission received: 6 August 2026 / Revised: 23 August 2026 / Accepted: 24 August 2026 / Published: 28 August 2026
(This article belongs to the Section Inorganic Crystalline Materials)

Abstract

The article presents the results of a study of the properties of a new pyrochlore (Bi2.7Mg0.46Ni0.70Sb2O10+Δ) using X-ray powder diffraction analysis, high-temperature X-ray powder diffraction and thermal analysis, diffuse reflectance spectroscopy, impedance spectroscopy, and X-ray spectroscopy methods (XPS, NEXAFS). The Ni/Mg codoped bismuth stibate pyrochlore was synthesized using the solid-phase method. The best results of the Rietveld structure refinement were achieved for the disordered pyrochlore model (sp. gr. Fd-3m:2, a = 10.47574(6) Å). The results of modeling the cation distribution over crystallographic positions are presented. The thermal expansion coefficient (TEC) of pyrochlore increases monotonically from 6.8 × 10⁻⁶ °C−1 (30 °C) to 9.8 × 10⁻⁶ °C−1 (810 °C). Above 1080 °C, thermal dissociation of pyrochlore occurs with the formation of (Mg/Ni)Sb2O6 and two cubic phases. At temperatures below 200 °C, the sample exhibits primarily capacitive impedance. The sample capacitance (~17 pF) is independent of temperature and frequency up to 200 °C. The high-frequency relative permittivity and dielectric loss tangent are 30.5 and 5 × 10⁻⁴ (24 °C, 5 × 10⁴ Hz). The activation energy for conductivity is 0.99 eV. The analysis of NEXAFS and XPS spectra allowed for the determination of the charge state of the metal cations: Bi + (3-δ), Sb + (5-δ), Ni/Mg + 2.

1. Introduction

Oxide pyrochlores are a large class of compounds with diverse physicochemical properties of practical and theoretical significance [1,2,3,4,5,6]. The prevalence of pyrochlores in various fields of application is explained by the stability of the pyrochlore structure to oxygen vacancies and hetero and isovalent cationic substitutions. This allows for the study of reproducible effects associated with macrodoping. The composition of pyrochlore is represented by the chemical formula A2B2O7 (sp. gr. Fd-3m) [7]. Binary pyrochlores A+32B+42O7 and A+22B+52O7 are formed by A/B cations in oxidation states +3/+4 and +2/+5, respectively. The existence of pyrochlores with a combination of cations with valence +3/+5 or +2/+4 has not been established. At the same time, doping with 3d transition elements stabilizes the structure of pyrochlores for cations in the oxidation states +3/+5 [8,9,10]. In this particular case, mixed pyrochlores are formed with a partially vacant sublattice of A cations and dopants distributed in both cation sublattices. Studies have shown that the octahedral sublattice is completely filled, while an insignificant fraction (up to 30 at.%) of doped cations is distributed in the sublattice of A cations [7,8,9,10]. Such a mixed distribution of cations is generally reproducible and does not depend on the synthesis conditions, which indicates that the distribution of cations in the A sublattice is not random, but is associated with the limited capacity of the octahedral sublattice. Previously, we carried out a number of studies of the properties of bismuth-containing pyrochlores based on bismuth niobate and tantalate. As shown in [11,12,13], bismuth-containing pyrochlores doped with 3d-elements exhibit predominantly semiconductor and dielectric properties [14,15]. It was previously established that nickel pyrochlores are capable of demonstrating high permittivity values. For example, the permittivity of Bi1.6Ni2/3−yNb4/3+yO6.4+3y/2 varied from 127 to 168 with a change in the y coefficient from −0.1 to 0.1 [15]. Similar values of permittivity 122 and dielectric loss tangent ~0.001 at a frequency of 1 MHz were demonstrated by Bi2Ni2/3Nb4/3O7 ceramics [3]. Nickel-containing tantalum pyrochlores showed low values of permittivity of 44.85 (RT, 105 Hz) [16] for Bi3Ni1.4Ta3O13.4, and for Bi2NiTa2O9 the permittivity did not exceed 32 at 30 °C and 1 MHz [17]. Replacing nickel(II) ions with magnesium(II) ions led to a decrease in the permittivity. According to the data [18], for Bi1.4(Mg1−xNix)0.7Ta1.4O6.3 (x ≤ 0.7) ceramics, the permittivity and dielectric loss tangent are 24–28 (x(Mg) = 0.7–0.3) and ~0.002 (RT, 1 MHz). As shown in the literature review, niobium pyrochlores usually have higher dielectric properties compared to tantalum ones. This phenomenon can be explained by the grain-free microstructure and the highest polarizability of Nb-O bonds in octahedra compared to the rigid and short Ta-O bonds in compact and more symmetric Ta-O octahedra. In addition, the results of the literature review show that the replacement of tantalum(V)/niobium(V) ions with transition 3d ions leads to insignificant changes in the dielectric parameters [3,15,16,17,18]. Thus, it can be concluded that the polarizability of the octahedral framework, or more precisely the nature of the atoms forming the niobium/tantalum framework, mainly determines the dielectric properties of ceramics. Antimony pyrochlores monodoped with 3d-elements (Cr, Fe, Mn, Ni, Co, Zn) are currently being actively studied [13,19,20,21,22]; they are promising, first of all, as catalysts. Therefore, the aim of our work was to study the properties of a new nickel–magnesium pyrochlore based on bismuth stibate. This study reveals the role of substituting nickel/magnesium ions for antimony(V) cations on the dielectric, structural, and thermal properties of the ceramic. This study compares key physicochemical properties of magnesium/zinc-containing pyrochlores based on bismuth stibate. One of the advantages of magnesium-containing pyrochlores over zinc-containing ones is their thermal stability compared to zinc-containing ones, as well as their higher relative permittivity.

2. Experimental Section

Solid-phase synthesis of the Bi2.7Mg0.46Ni0.70Sb2O10+Δ sample was carried out from bismuth(III), antimony(III), nickel(II), and magnesium(II) oxides using the procedure described in detail in [23]. High-temperature X-ray diffraction analysis of the sample was performed by powder high-temperature X-ray diffraction (HTXRD) using a Rigaku Ultima IV diffractometer (RIGAKU Corporation, Tokyo, Japan) (Co) with a thermo-attachment in the range 25–1200 °C with steps of 30 °C. The unit cell parameters were calculated using the Pauli approach using the Topas 5.0, Bruker, Karlsruhe, Germany software package [24]. The microstructure and chemical composition of the sample were studied using scanning electron microscopy and energy-dispersive spectroscopy (Tescan VEGA 3LMN scanning electron microscope and INCA Energy 450 energy-dispersive spectrometer, TESKAN, Brno, Czech Republic). Electrical characteristics of the sample were measured using a Z-1000P impedance meter (Elins, Minsk, Belarus) at 25 Hz–10 MHz and 24–450 °C. Thermal analysis of the sample was performed using an STA 409 PC Luxx synchronous thermal analyzer (Netzsch, Selb, Germany) at a heating rate of 10 K/min. Air was used as a purge gas, and an empty crucible was used as a standard. The enthalpy and thermal effect temperatures were processed using NETZSCH Proteus software (v. 8.0.3, NETZSCH-Gerätebau GmbH, Selb, Germany). NEXAFS spectra were obtained using the total electron yield (TEY) method. XPS analysis was performed on a Thermo Scientific ESCALAB 250Xi X-ray spectrometer (Thermo Fishes Scientific, East Grinstead, UK) with an AlKα X-ray tube (1486.6 eV). All peaks were calibrated relative to the C1s peak at 284.4 eV. The ESCALAB 250 Xi spectrometer software v.5.35, Thermo Fishes Scientific, East Grinstead, UK was used to process the experimental data. Diffuse reflectance spectra were recorded in the 200–1200 nm range using a UV-2550 spectrophotometer (Shimadzu, Tokyo, Japan).

3. Results and Discussion

3.1. Thermal Stability, Microstructure, and Crystal Structure

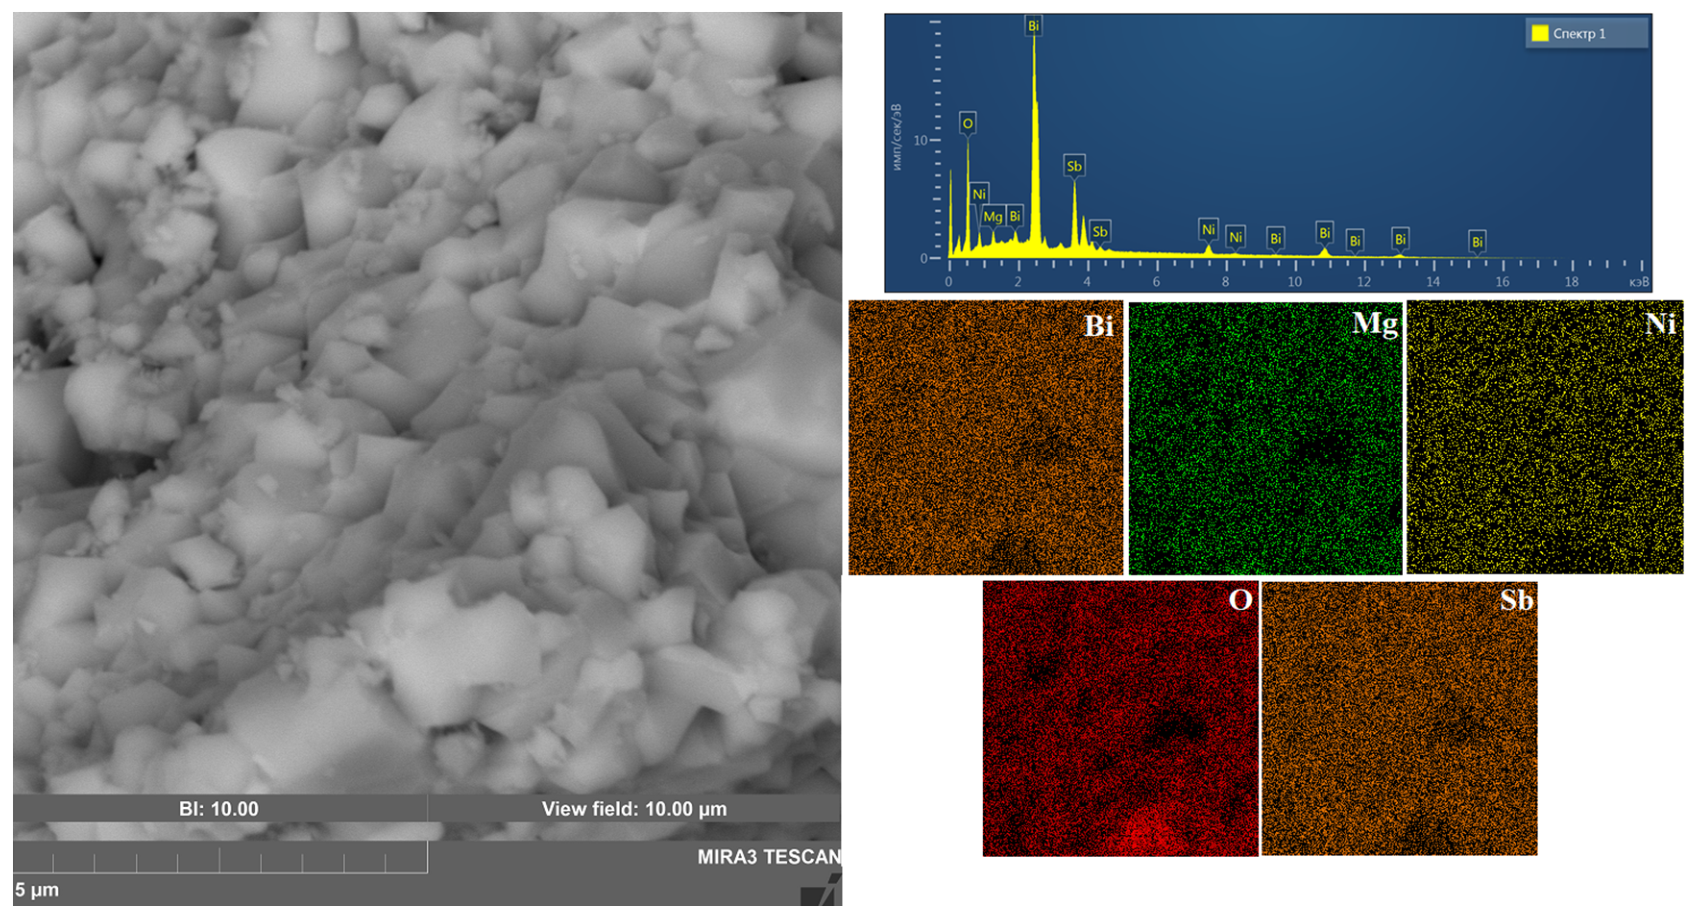
Scanning electron microscopy (SEM) results showed that the synthesized Bi2.7Mg0.46Ni0.70Sb2O10+Δ sample is characterized by a low-porosity microstructure, with grain sizes, according to SEM data, ranging from 0.5 to 2.5 μm. The grains of the oxide ceramics are non-uniform in size. Zinc-containing pyrochlore is dominated by large grains [23], which are significantly larger than those of magnesium ceramics and range from 0.25 to 4 µm. The wide range of grain sizes in the ceramics may be due to the high synthesis temperature, close to the melting point of the material, at which small grains coalesce into larger ones. The atoms of the elements composing the oxide ceramic are uniformly distributed over the sample’s surface (Figure 1). According to EDS spectra, the chemical composition of the synthesized ceramic satisfies its nominal composition and is described by the stoichiometric formula Bi2.7Mg0.46Ni0.69Sb1.95O10+Δ.
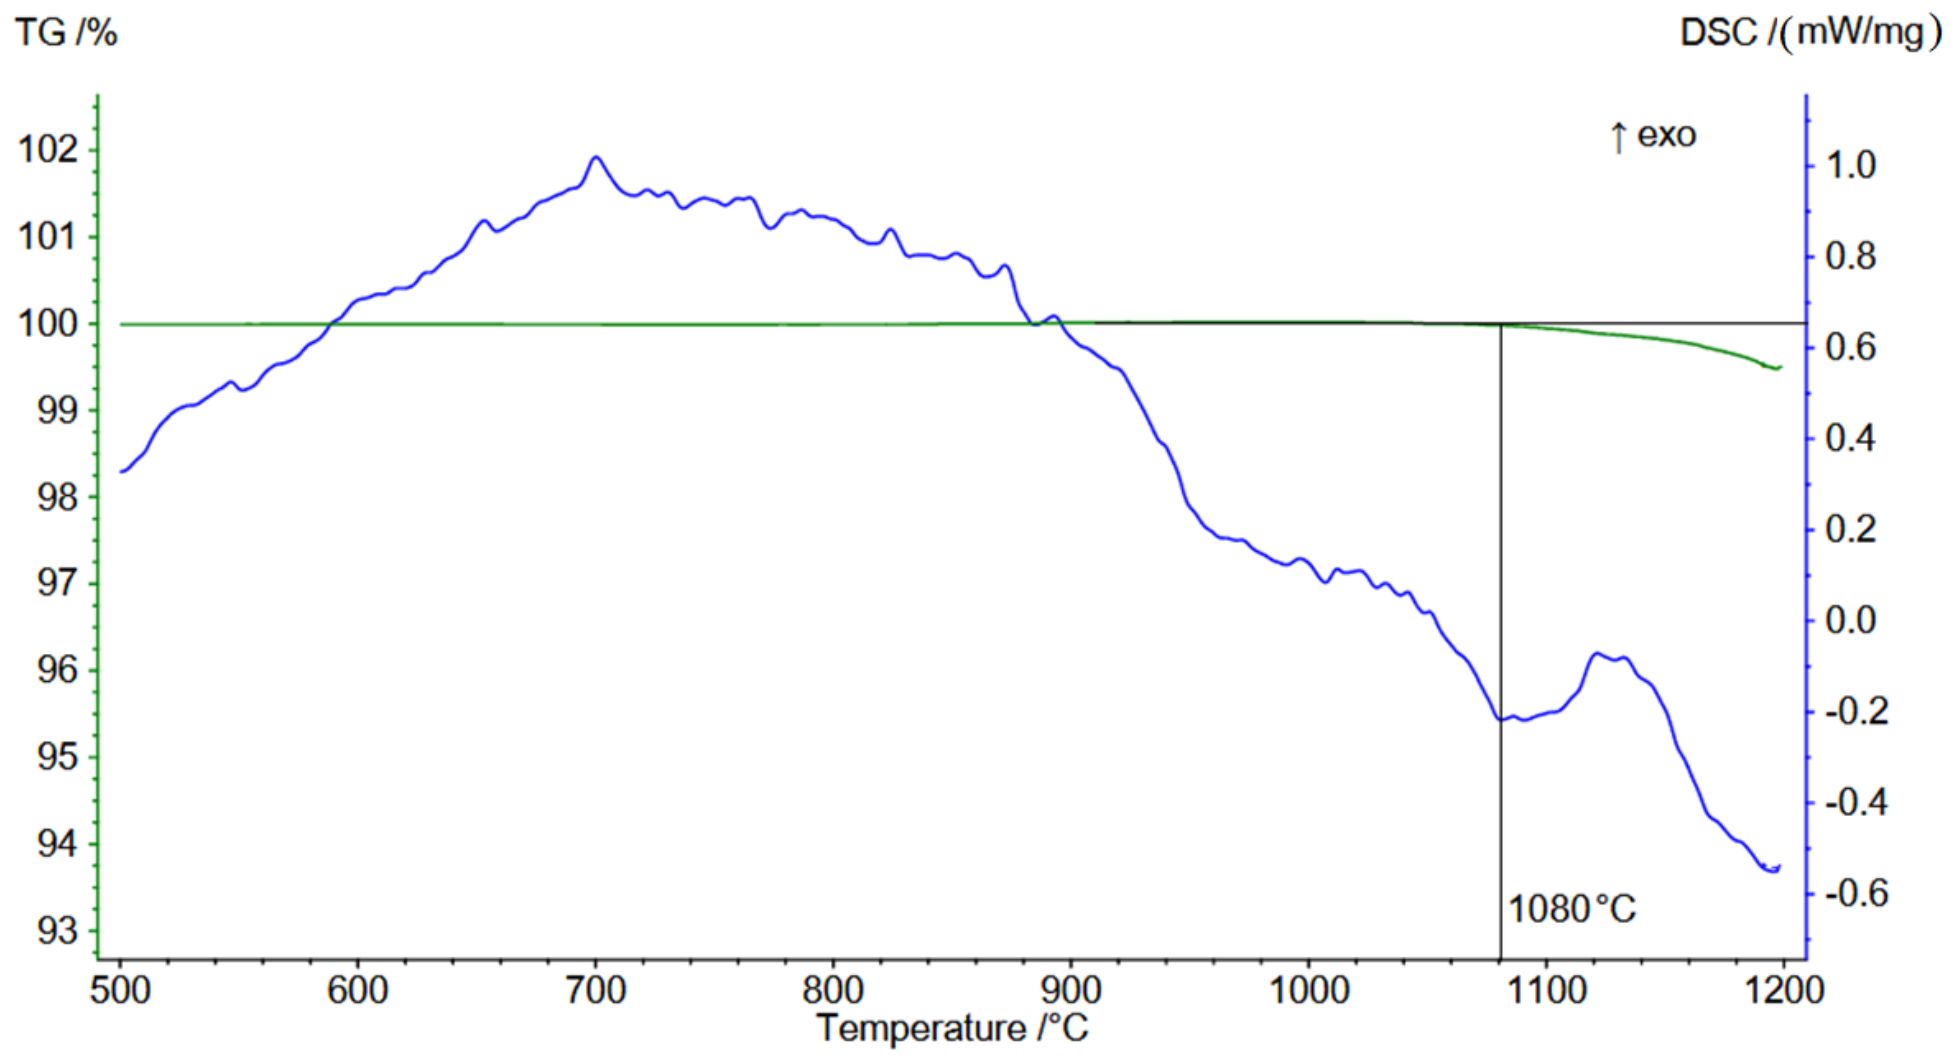
Thermal stability studies of the synthesized pyrochlore Bi2.7Mg0.46Ni0.70Sb2O10+Δ were conducted using thermogravimetry and differential scanning calorimetry in the temperature range of 500–1200 °C. The obtained results revealed a change in sample mass above 1080 °C, indicating preservation of the stoichiometry of the pyrochlore phase during synthesis (Figure 2). As shown by the mass change curve (green), the sample mass decreases above 1080 °C by no more than 0.8 wt.%, which may be due to bismuth loss [17,18].
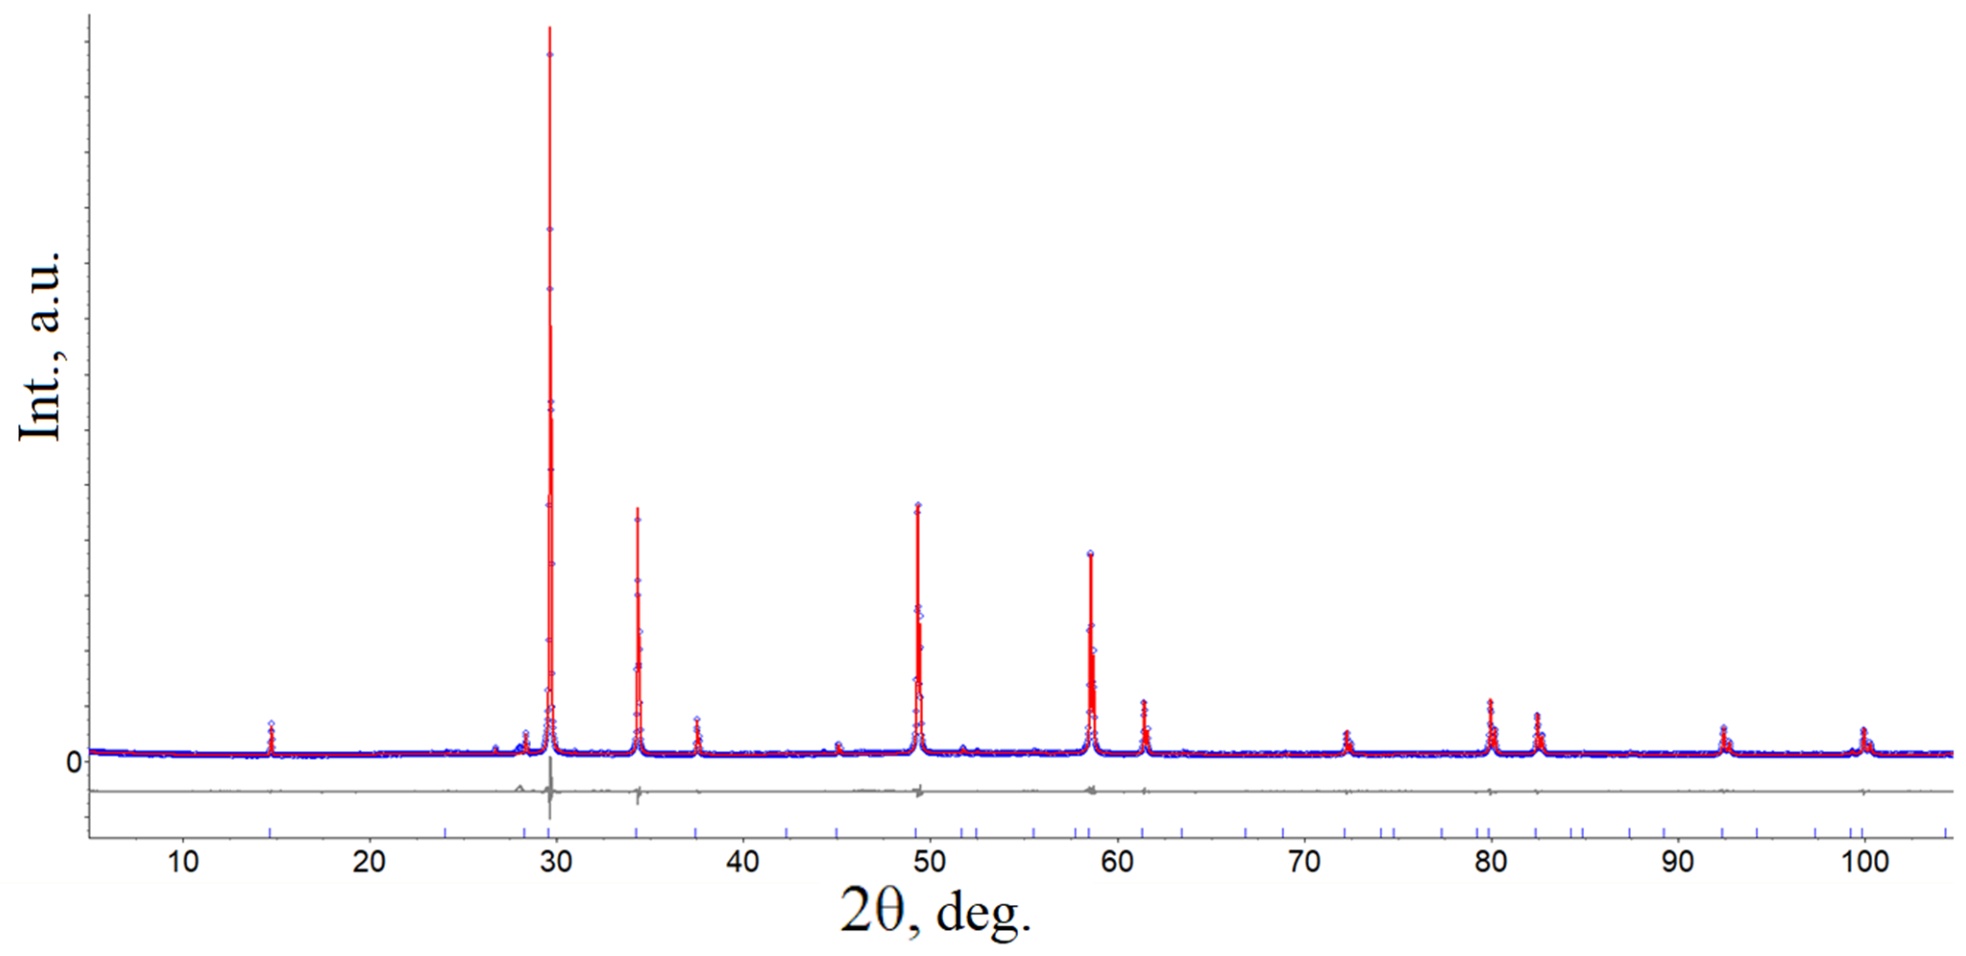
According to X-ray diffraction analysis (Figure 3), the sample synthesized at 1050 °C is single-phase and crystallizes in the cubic pyrochlore structural type. When refining the crystal structure, the ideal pyrochlore structure (sp. gr. Fd-3m) [7] was adopted as the initial model of the crystal structure, and the occupancy was determined in accordance with the stoichiometry of the composition. In order to provide the most accurate description of the X-ray diffraction profile, a model of disordered pyrochlore was considered. In this model the bismuth atoms are displaced to the 96g position, and the oxygen atoms are distributed over 48f and 8a with incomplete occupancy. The distribution of nickel(II) and magnesium(II) cations was varied over the bismuth and antimony positions. Six variants of filling the crystallographic positions are considered: 1—nickel and magnesium cations are distributed only in antimony positions; 2—only nickel(II) cations are located in bismuth positions in the amount of 16 at.% of the total amount of nickel; 3—only nickel(II) cations are located in bismuth positions in the amount of 16 at.% of the total amount of nickel and magnesium; 4—only magnesium cations are located in bismuth positions in the amount of 16 at.% of the total amount of magnesium and nickel; 5—magnesium and nickel cations are located in bismuth positions equally, in the amount of 8 at.% of the total amount of nickel and magnesium; 6—with the loss of bismuth and distribution of nickel and magnesium cations in antimony positions. The modeling results and refinement parameters for all variants are presented in Table 1. Calculations showed that models 1, 5, and 6 demonstrated the best results in terms of thermal parameters and refinement parameters. Overall, the variation in fitting parameters across all models is minimal, and a single crystal is required for more accurate modeling. Structural aspects in comparison with the nature of bonds, vacancies and energetics can be further confirmed by DFT modeling within the framework of the synthetic growth concept and other levels of theory [25,26].
The geometric parameters of the structure for distribution variant 6, in which the spread of thermal parameters is minimal, are presented below. The analysis of the fitting results suggests that the bismuth sublattice is partially vacant in all models. In models 2 and 3, negative isotropic displacement parameters were obtained for the cations at position 16b, with the latter being even more negative for model 3. The very fact that such thermal atomic parameters were obtained indicates that the placement of only nickel(II) cations in the bismuth sublattice is unacceptable, and the result only worsens with increasing nickel(II) content. A comparison with similar model 4, which assumes the placement of only magnesium(II) cations, shows that the atomic displacement parameters remain unsatisfactory, but are no longer negative. Thus, it is shown that the distribution of magnesium(II) cations within the bismuth(III) sublattice is preferable to that of nickel(II). Furthermore, a mixed distribution of nickel and magnesium in the bismuth and antimony sublattices is probable.
The unit cell parameter of nickel pyrochlore Bi2.7Mg0.46Ni0.70Sb2O10+Δ is 10.47574(6) Å. The unit cell parameter of pyrochlore Bi2.7Zn0.46Ni0.70Sb2O10+Δ is a = 10.46442(5) Å, which is slightly smaller than that of pyrochlore with magnesium, despite the fact that the cationic radius of magnesium(II) is smaller than that of zinc(II) (R(Zn2+) = 0.074 nm, R(Mg2+) = 0.072 nm) [23]. This difference may be due to the distribution of a larger number of zinc cations at the bismuth position compared to magnesium. In the work [20] for pyrochlores described by the formula Bi2−xNixNi2/3−ySb4/3+yO7±δ, x = 0.1–0.35, y = 0–0.1, the unit cell parameter changes in the range of 10.44–10.47 Å, which is consistent with our data.
The final results of the refinement of the pyrochlore structure for the Bi2.7Mg0.46Ni0.70Sb2O10+Δ composition by the Rietveld method in the Fd-3m:2 space group (227) are given in Table 1, variant 6. Model 6 of the structure plausibly describes the distribution of atoms among crystallographic sites, but is not the final model. Model 6 exhibits relatively small differences in the thermal parameters of the atoms, and the stoichiometric coefficient of the oxygen atom is closest to the calculated index, taking into account the formal valences of the atoms. The experimental, calculated, and difference X-ray diffraction patterns are shown in Figure 3. The atomic parameters and selected bond lengths of Bi2.7Mg0.46Ni0.70Sb2O10+Δ are given in Table 2. The modeling results indicate that the antimony(V)/nickel(II)/magnesium(II) cations form a regular oxygen octahedron, in which all M–O bonds in the octahedron have a length of approximately 2.003 Å (Table 2), close to that of octahedral polyhedra in tantalum/niobium pyrochlores [3,15,16,17,18].
The coordination polyhedron of bismuth atoms is a distorted octahedron, BiO8. Individual interatomic distances in the BiO8 polyhedron are pairwise identical and range from 2.2898(4) to 2.895(4) Å (Table 2). It is interesting to note that the BiO8 polyhedron in antimony pyrochlore is more symmetrical and compact than that in niobium/tantalum pyrochlore [3,15,16,17,18]. This is evidenced by the alignment and small spread of Bi-O bond lengths in antimony pyrochlore compared to tantalum/niobium pyrochlore.

3.2. Thermal Expansion

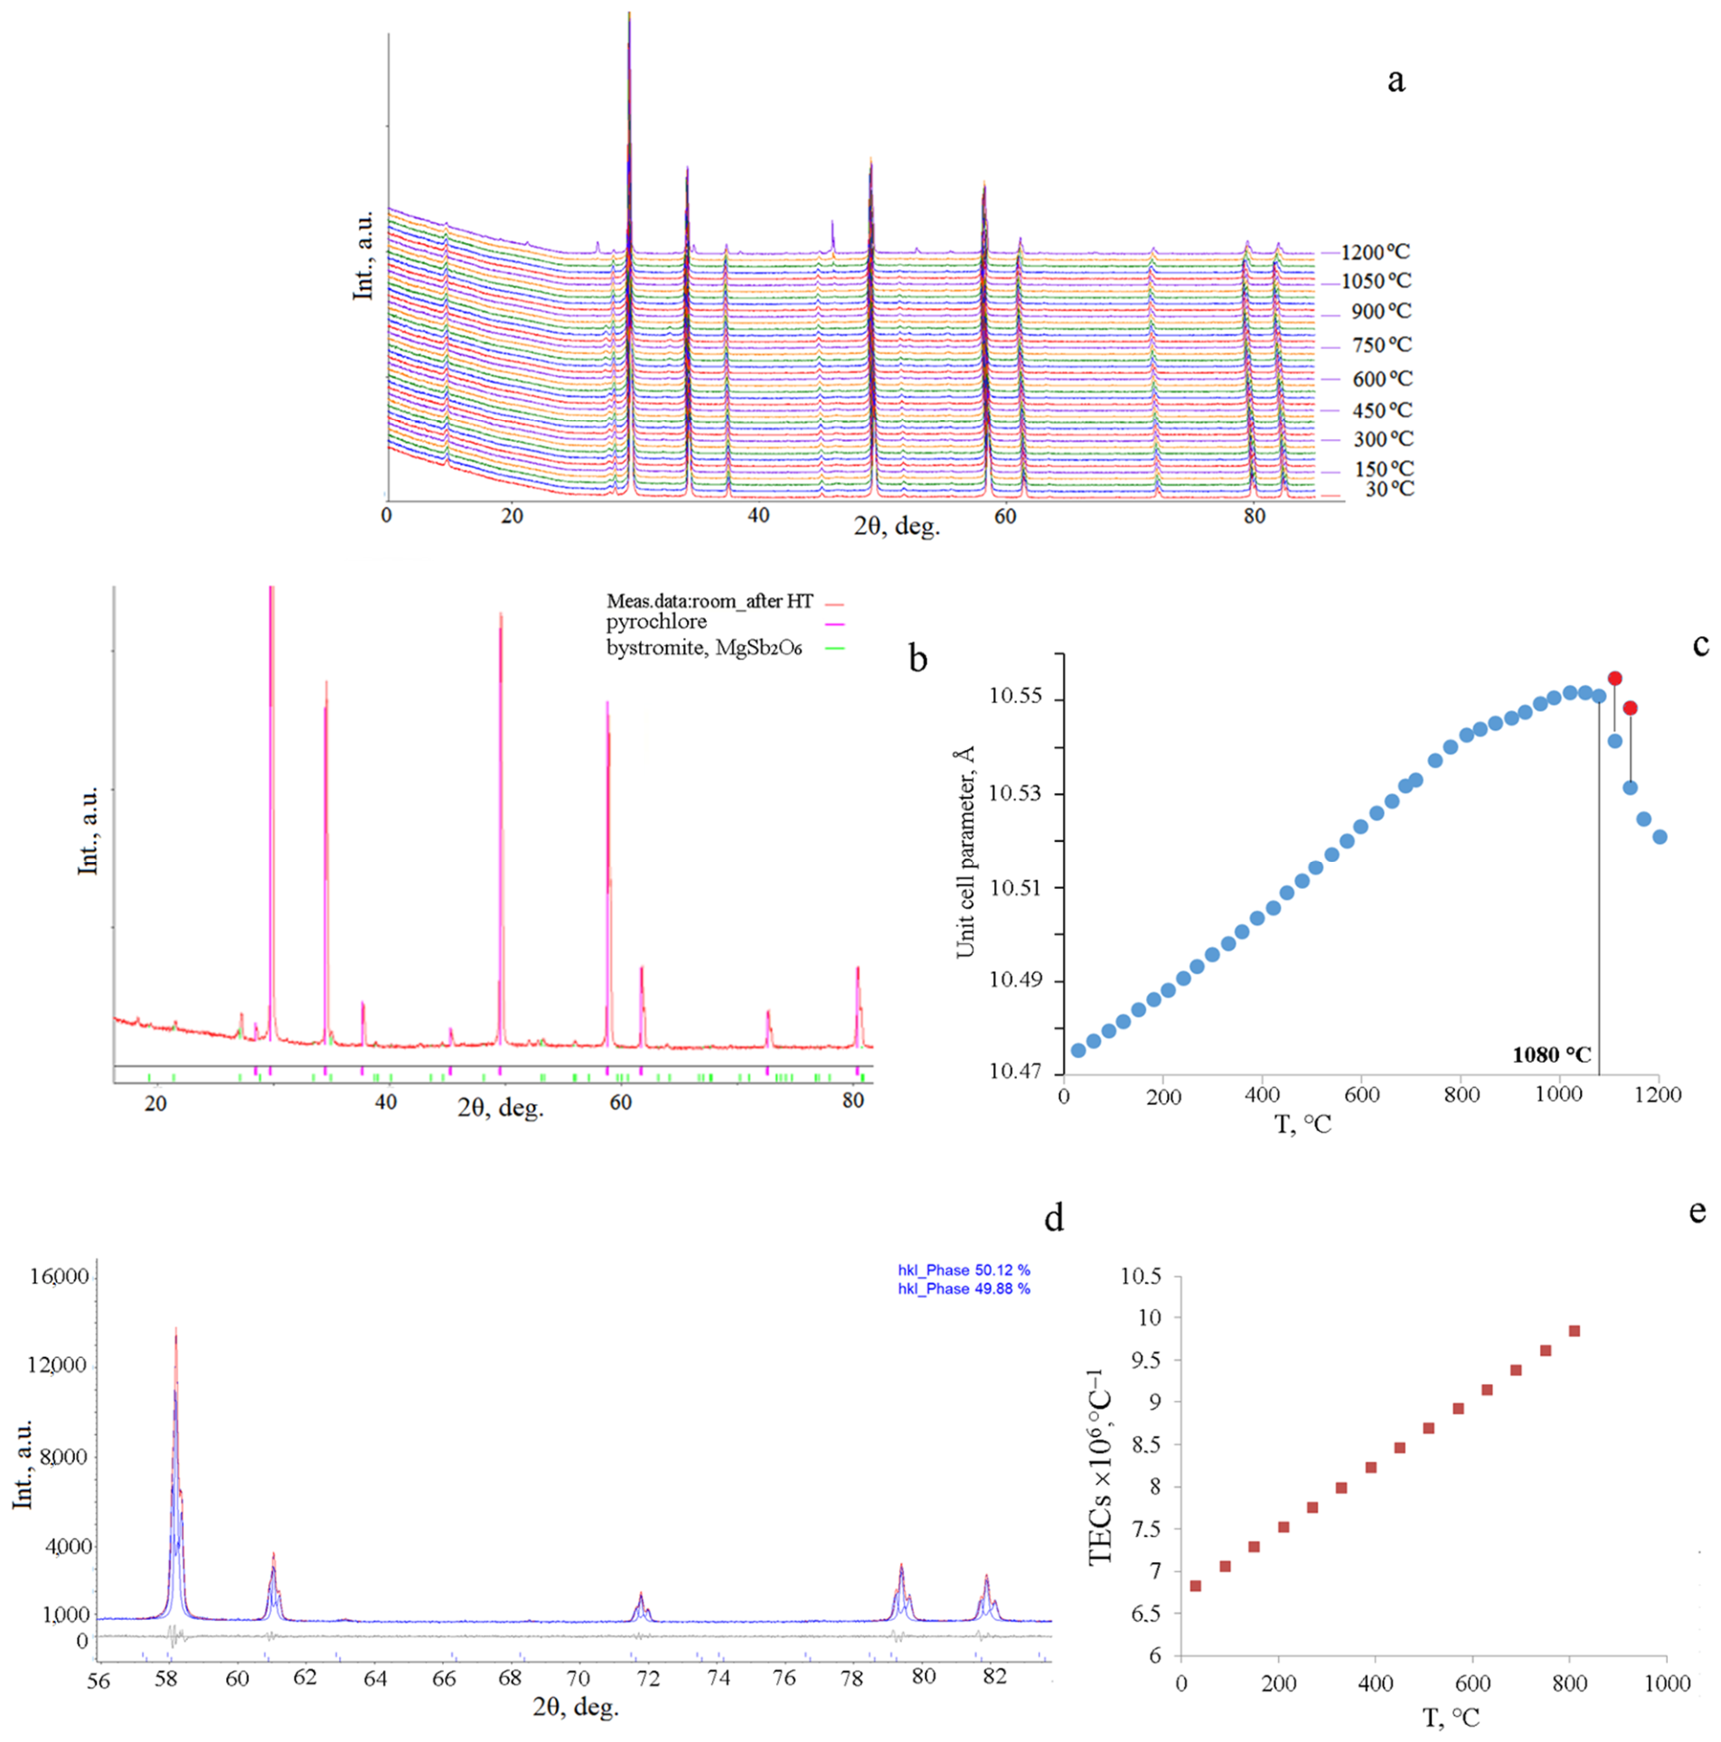
The thermal expansion of nickel- and magnesium-containing antimony pyrochlore was studied in the temperature range of 30–1200 °C with a 30 °C increment (Figure 4a, Table 3) using high-temperature X-ray diffraction data, as well as the phase composition of the sample after annealing at 1200 °C (Figure 4b). The temperature dependence of the pyrochlore unit cell parameter is shown in Figure 4c. Up to 1080 °C, the unit cell parameter a of pyrochlore increases almost linearly from 10.47543 Å (30 °C) to 10.55078 Å (1080 °C), indicating the absence of phase transitions in this temperature range. The thermal stability of pyrochlore is confirmed by high-temperature X-ray diffraction data, according to which reflections of impurity phases appear in the X-ray diffraction patterns at a temperature of 1170 °C (Figure 4a). As can be seen from Figure 4c, a distinctive feature of the thermal behavior of antimony pyrochlore in the high-temperature region (above 1080 °C) is the duplication of the unit cell parameter. According to high-temperature X-ray diffraction data, the sample contains two cubic phases (sp. gr. Fd-3m), including the pyrochlore phase (Figure 4d). The doubling of the peaks can be clearly observed only at high angles, since the unit cell parameters of the cubic phases change only slightly: 10.5239 and 10.5249 Å. The peculiar behavior of bismuth-containing antimony pyrochlore is associated with its thermal dissociation at temperatures near 1080 °C. The thermal analysis curve, showing a slight mass loss in the sample, also indicates this thermal decomposition. According to data [23], zinc-containing pyrochlore is less stable (up to 1070 °C) than magnesium-containing pyrochlore, which is confirmed by thermogravimetry and high-temperature X-ray diffraction data. It is interesting to note that 1080 °C is also critical for tantalum pyrochlores. The cause of this extreme behavior is the same as in the case of bismuth evaporation, which affects the pyrochlore stoichiometry and is reflected in the unit cell parameter. The nature of the second cubic phase is still unclear. The content of the two cubic phases in a sample heated to 1140 °C was estimated at 49.88 and 50.12 at.%. A comparative assessment of the content of two cubic phases in antimony pyrochlores Bi2.7Zn0.46Ni0.70Sb2O10+Δ/Bi2.7Mg0.46Ni0.70Sb2O10+Δ, heated to 1170 °C, was carried out. According to the calculation, the content of the non-pyrochlore cubic phase at 1170 °C is almost the same in the samples, amounting to 50.2/50.12 mol.%, and demonstrates independence from the nature of the dopant. X-ray diffraction analysis of the sample at room temperature showed that the phase composition of the ceramics is represented by several phases: two cubic phases belonging to the Fd-3m space group, as well as a magnesium/nickel stibate phase (Mg/Ni)Sb2O6 (sp. gr. P42/mnm). The presence of nickel/magnesium stibate indicates the loss of bismuth upon heating of the sample, which is characteristic of the high-temperature dissociation of bismuth niobate/tantalate-based pyrochlores and indicates signs of a similar onset of thermal dissociation of bismuth-containing pyrochlores. The low content of thermal decomposition products indicates the low intensity of the bismuth evaporation process at 1200 °C, as evidenced by Figure 2, which shows that the mass loss of the sample calcined at 1200 °C does not exceed 0.8 at.% of the total mass of the sample. A simple calculation shows that the gross composition of the sample after calcination at 1200 °C, provided that only bismuth is removed, does not change much and corresponds to the conditional formula Bi2.66Mg0.46Ni0.70Sb2O10+Δ..
Based on the polynomial approximation of the temperature dependence of the unit cell parameter, the values of the coefficient of thermal expansion (TEC), α, were calculated at different temperatures (Table 3, Figure 4e).
Analysis of the thermal behavior of Bi2.7Zn0.46Ni0.70Sb2O10+Δ/Bi2.7Mg0.46Ni0.70Sb2O10+Δ showed that antimony pyrochlores belong to isotropically expanding materials [23]. The coefficient of thermal expansion for Bi2.7Zn0.46Ni0.70Sb2O10+Δ/Bi2.7Mg0.46Ni0.70Sb2O10+Δ varies from 7.1 to 9.3 × 10⁻⁶/from 6.8 to 9.8 × 10⁻⁶ °C−1 in the temperature range of 30–810 °C, the average TEC values in this temperature range are almost the same 8.2 × 10⁻⁶/8.3 × 10−6 °C−1. Interestingly, magnesium–nickel pyrochlore exhibits the greatest thermal expansion at high temperatures compared to zinc–nickel pyrochlore. This can be explained by the ionicity and bond length of Mg-O compared to Zn-O. The lower structural flexibility of zinc-containing pyrochlores may explain their reduced thermal stability. For nickel pyrochlore Bi2NiTa2O9, the average TEC value in the range of 30–990 °C is 6.02 × 10⁻⁶ °C−1 [17]. The lower TEC values for Bi2NiTa2O9 indicate that, with similar bond lengths in the octahedron, the Ta-O bond is more rigid than the Sb-O bond, despite the fact that the covalency of the Sb-O bond is greater than that of Ta-O. Apparently, the reason for the greatest thermal expansion lies in the internal structure of antimony pyrochlore. The isotropy of the thermal behavior and the average TEC (8.3 × 10⁻⁶ °C−1) of antimony pyrochlore are typical of compounds with a framework structure, confirming the thesis of the rigidity of the bonds of framework structures.

3.3. Optical and Dielectric Properties

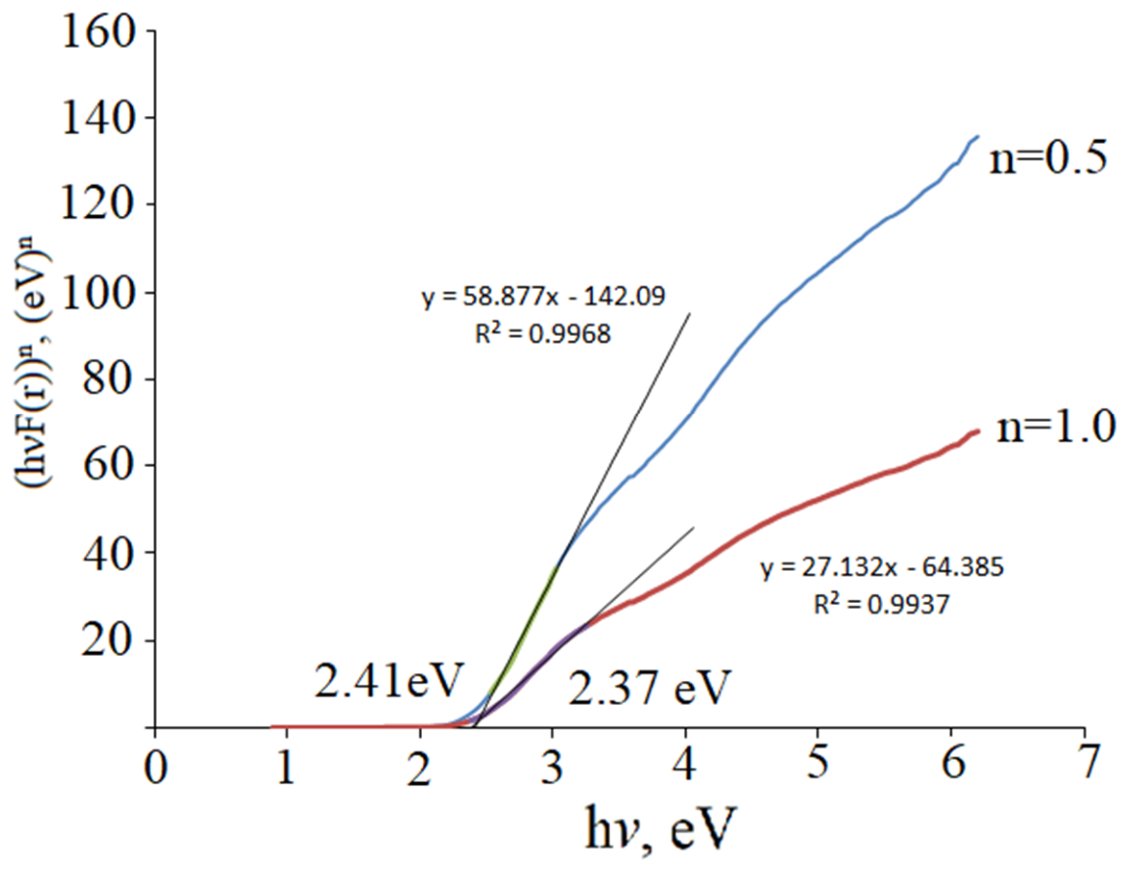
The band gap (Eg) of antimony pyrochlore for direct allowed electron transitions was estimated using diffuse reflectance spectra. The approximation quality is higher for direct electron transitions. Meanwhile, the band widths calculated for n = 1 and n = 1/2 are almost identical. The calculations showed that the band gap for direct allowed transitions in the sample is 2.41 eV (Figure 5), corresponding to absorption in the 515 nm wavelength range. The band gap of the studied ceramics is typical for dielectrics and is close to the energy of solar radiation reaching the surface of our planet and having a maximum intensity (2.1–2.5 eV). This suggests the potential for using these materials as light-absorbing elements in solar cells.
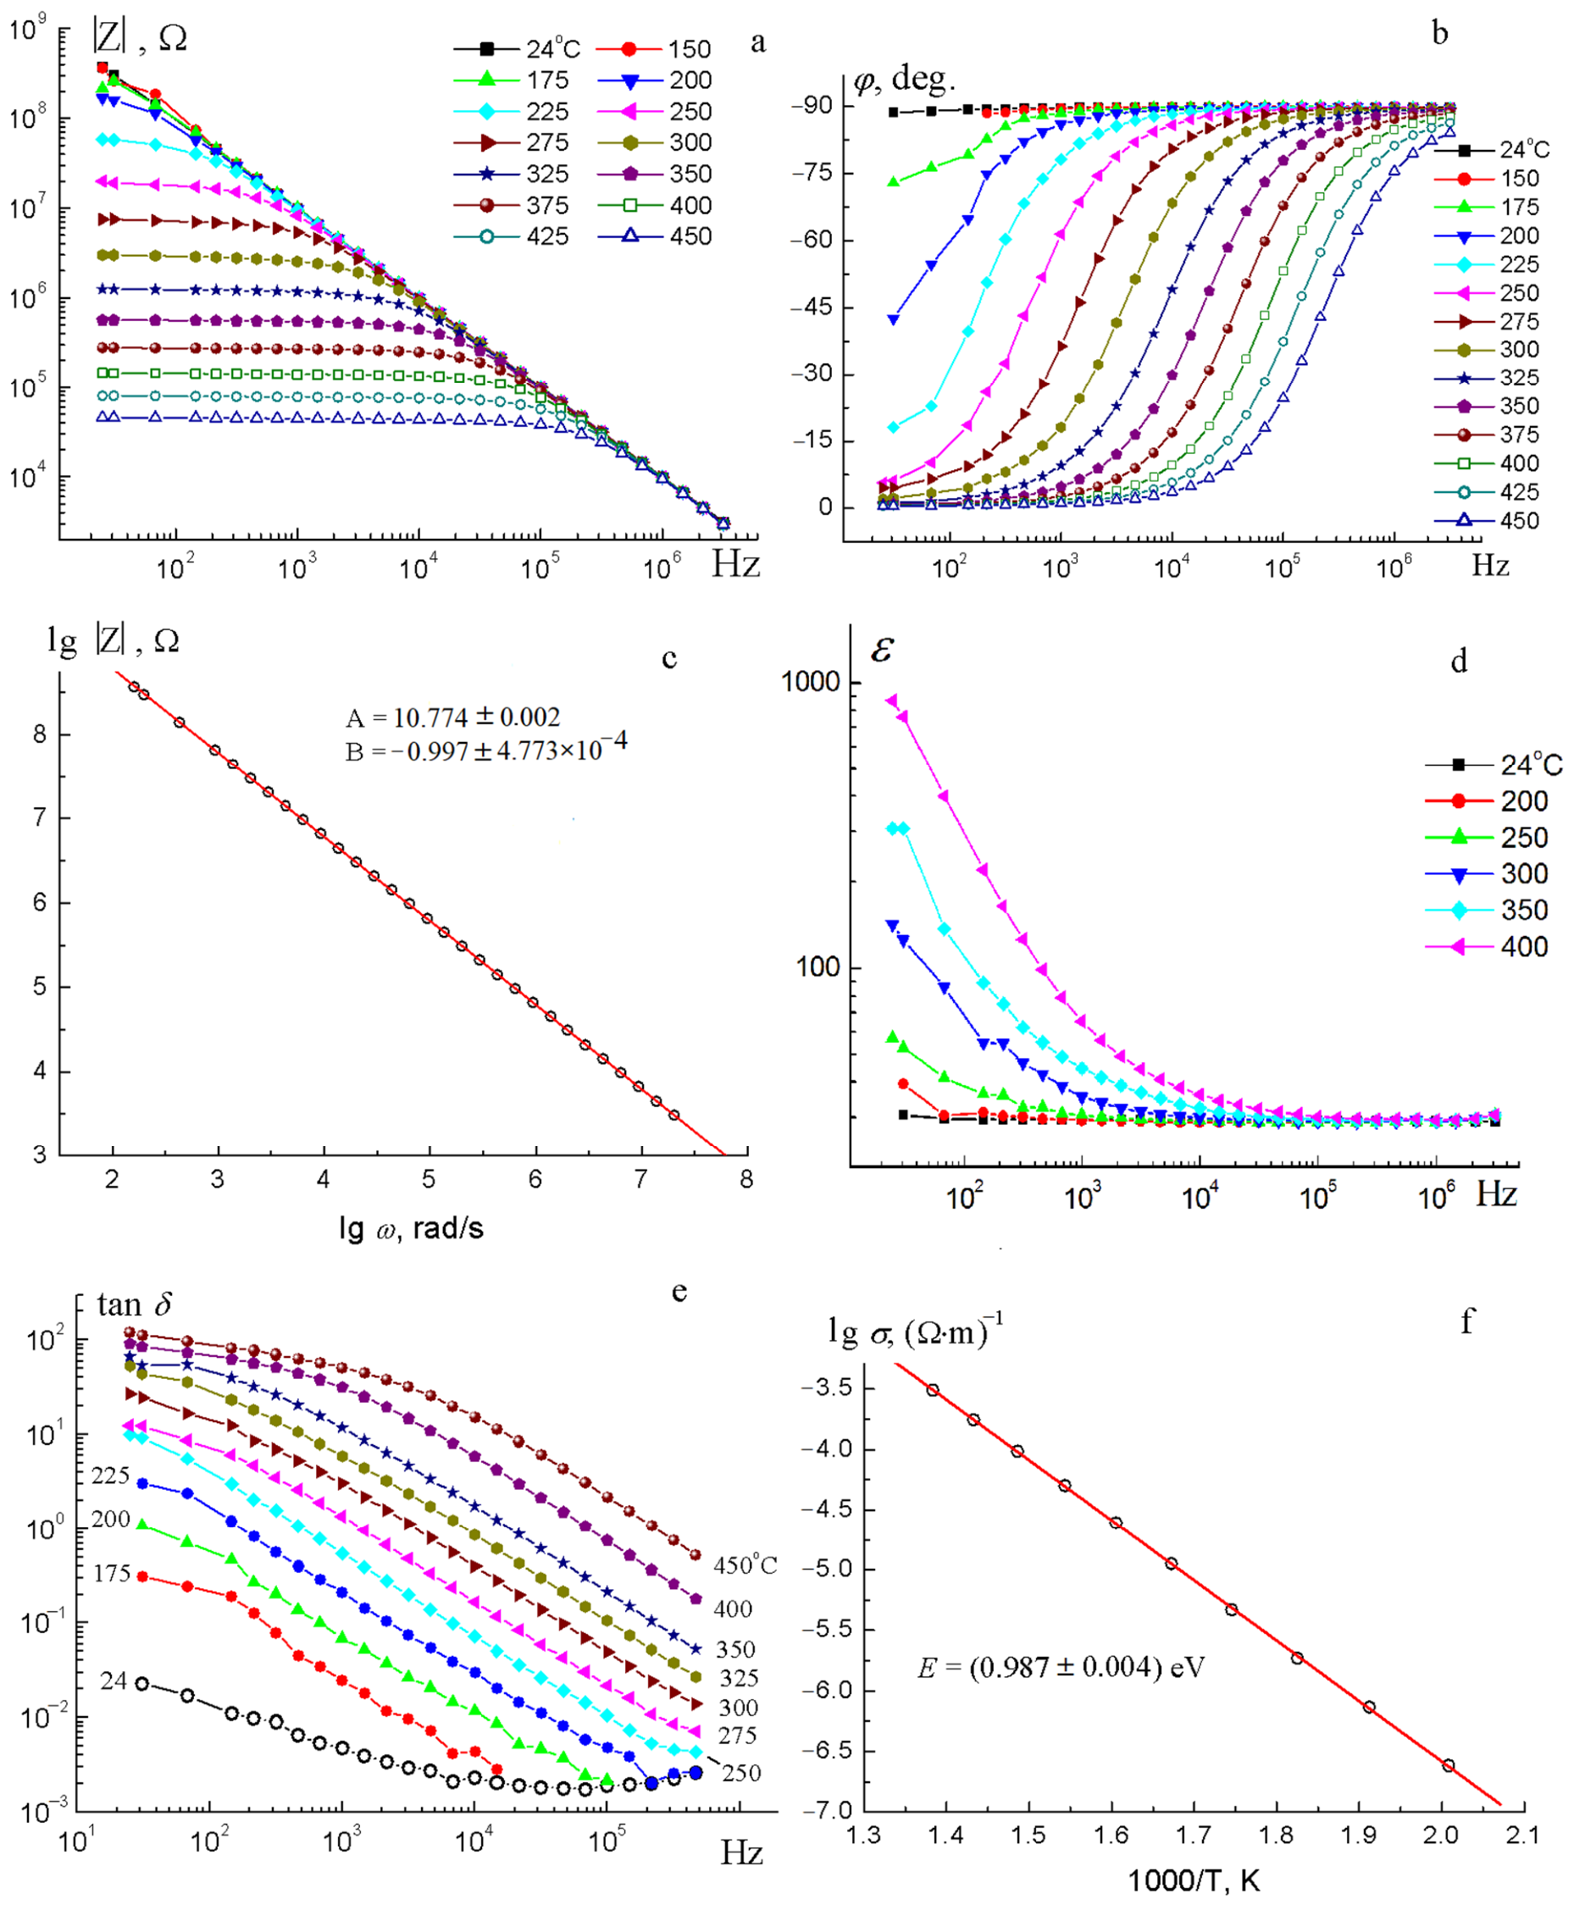
The electrical properties of the Bi2.7Mg0.46Ni0.70Sb2O10+Δ sample were studied in the temperature range of 24–450 °C at a frequency of 25 Hz–6 MHz (Figure 6). Figure 6a,b show the frequency dependences of the impedance modulus and phase angle as functions of temperature. The change in phase angle as a function of frequency and temperature is shown in Figure 6b. As can be seen, at room temperature, the phase angle is close to a right angle, confirming the conclusion about the manifestation of reactance caused by the capacitive current. At high frequencies, the phase angle remains at 90°, indicating the flow of predominantly bias currents. As Figure 6a shows, the impedance modulus of the sample remains virtually unchanged up to 200 °C (150 °C for Bi2.7Zn0.46Ni0.70Sb2O10+Δ) over the entire frequency range and is proportional to the field frequency, indicating the flow of a capacitive current in the sample. As the temperature increases, through conductivity- the end-to-end conductivity begins to prevail over capacitive conductivity, which is reflected in the frequency independence of the impedance modulus, especially noticeable in the low-frequency region. As noted above, the sample exhibits capacitive conductivity, as a result of which the slope of the impedance modulus line is 45° with high accuracy (Figure 6c). In this case, Z = 1 ω C p , where ω = 2 π f is the angular frequency in units of rad/s; f—is the frequency in Hz; Cp—is the capacitance for the parallel equivalent circuit.
After taking the logarithm, we obtain a frequency dependence in the form of a straight line [27]:
l o g Z = log 2 π f l o g C p
Dependence (1) is observed experimentally, as shown in Figure 6a. All isotherms in this figure have coinciding high-frequency asymptotes, indicating the independence of capacitance from frequency and temperature. The formula for the approximating line for low-temperature data is as follows:
l o g Z = A + B · l o g ω ,
where the values of parameters A and B are shown in Figure 6c. Comparing Formulas (1) and (2), we obtain: l o g C p = A . Thus, C p = 10 A F = 10 12 A p F = 10 1.226 ± 0.002 = 10 0.002 10 1.226 . The relative error is 0.5%. The sample capacitance is Cp = (16.83 ± 0.08) pF. We determine the relative permittivity using the formula:
ε = 144 · h m m · C p F D 2 m m = 144 · 2 · 16.83 12.6 2 30.5
The main error is related to the accuracy of measuring the sample’s geometric dimensions and is equal to 8%. It is interesting to note that the sample exhibits a constant relative permittivity of ~30 (26 for Bi2.7Zn0.46Ni0.70Sb2O10+Δ) throughout the entire frequency range (up to 6 × 10⁶ Hz) at temperatures from room temperature to 200 °C (150 °C). With increasing temperature, the frequency range of independent permittivity narrows. The dielectric loss tangent at 24 °C does not exceed 2 × 10⁻² over the entire frequency range, and at a frequency of 5 × 10⁴ Hz it is minimal and equal to 5 × 10⁻⁴. The temperature dependence of the through conductivity of the sample is shown in Figure 6f. As a result of the calculation, the values of the activation energy of conductivity in the Bi2.7Zn0.46Ni0.70Sb2O10+Δ/Bi2.7Mg0.46Ni0.70Sb2O10+Δ samples were obtained as 1.30(5)/0.99(4) eV, respectively. The end-to-end conductivity of pyrochlore changes with increasing temperature from 2.5 × 10⁻⁷ Ohm−1 ·m−1 (230 °C) to 3.2 × 10⁻⁴ Ohm−1 ·m−1 (450 °C). The electrical conductivity values are close to those of nickel pyrochlore Bi2NiTa2O9, the specific electrical conductivity varies from 3.2 × 10⁻⁷ Ohm−1 ·m−1 (350 °C) to 1 × 10⁵ Ohm−1 ·m−1 (450 °C), and for solid solutions Bi1.4(Mg1–xNix)0.7Ta1.4O6.3 it varies from 2 × 10⁻⁷ Ohm−1·m−1 (370 °C) to 1.2 × 10⁻⁵ Ohm−1·m−1 (440 °C) [17,18].

3.4. XPS and NEXAFS

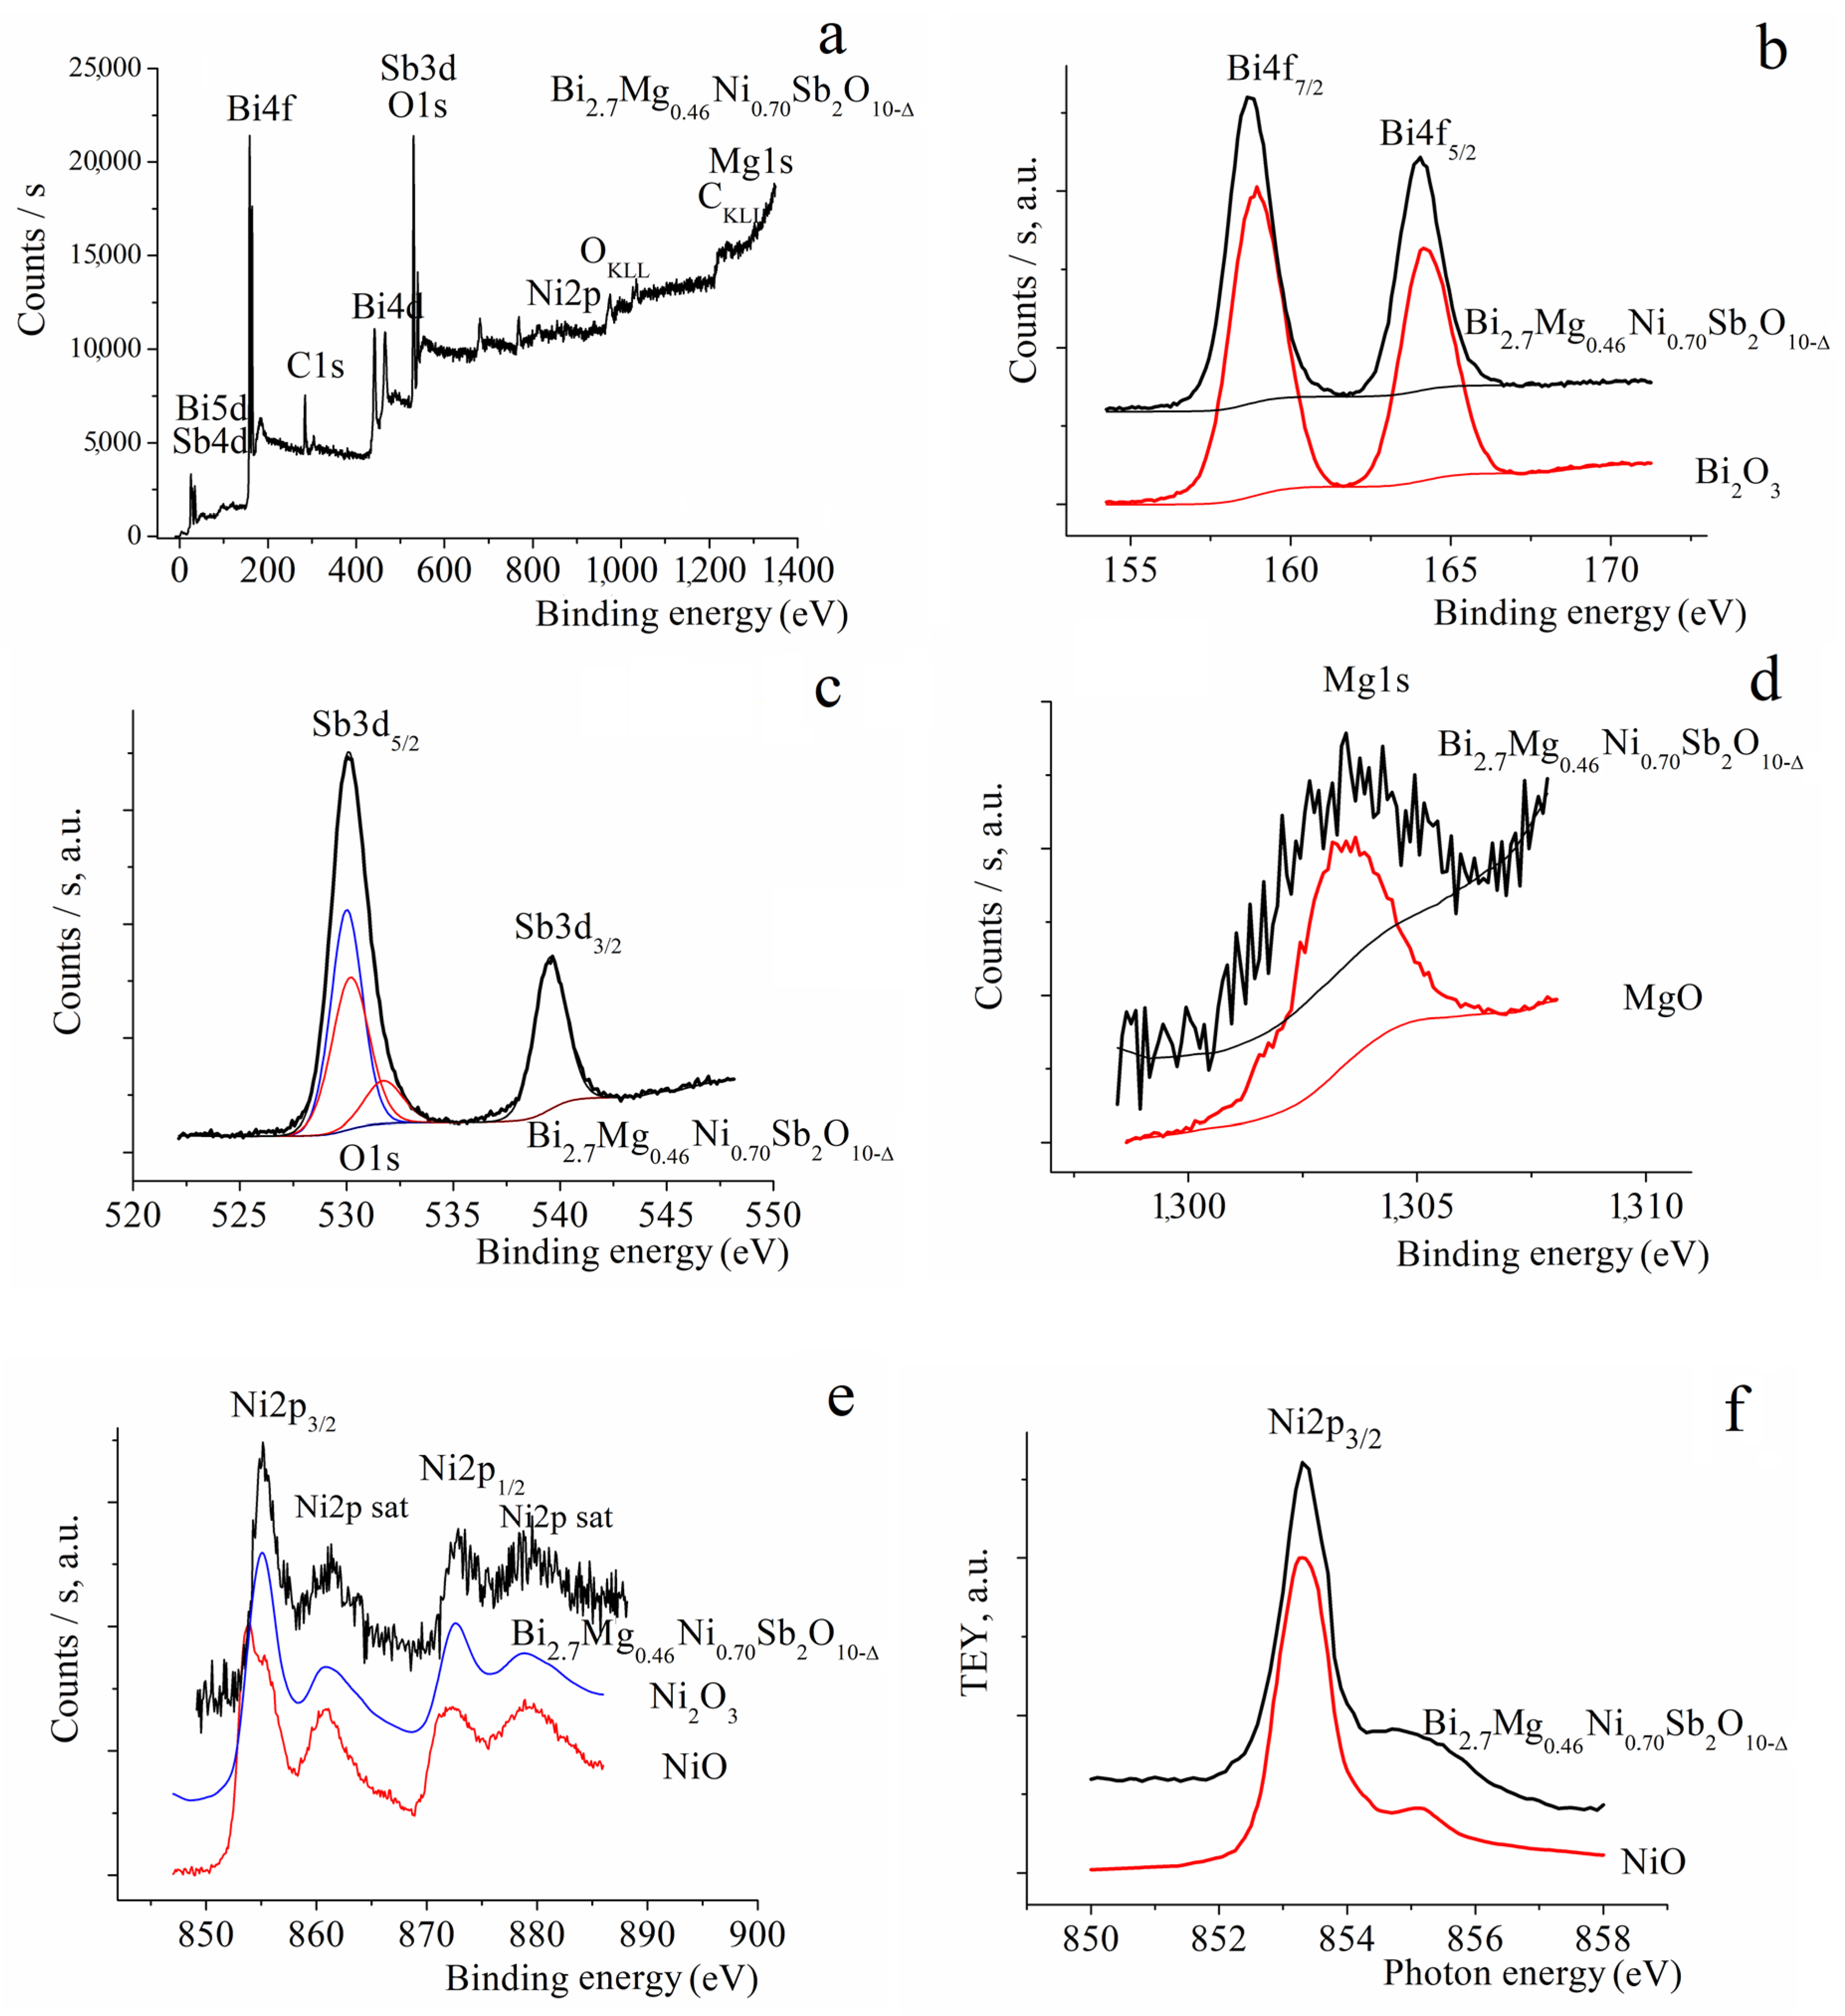
The charge state of cations in pyrochlore was studied using X-ray spectroscopy. Figure 7a,b–e show the survey and Bi4f, Sb3d, Mg1s, and Ni2p XPS spectra of the investigated sample, respectively. The chemical composition of the sample surfaces was analyzed based on the spectra of metals. The figures show the results of decomposition of spectral dependences into individual peaks modeled by Gaussian–Lorentzian curves, and background lines by Shirley or smart approximation. The shape of the peaks in the Bi4f XPS spectra of pyrochlore and Bi2O3 oxide (Figure 7b) clearly indicates that all bismuth cations are in the same charge state, as there is no peak splitting or distortion. The energy position of the pyrochlore peaks has a characteristic shift (ΔE = 0.2 eV) toward lower energies compared to the binding energy in trivalent Bi2O3 oxide. For this reason, it was concluded that the bismuth cations in antimonite have the same effective charge of +(3-δ). The decrease in the effective charge state may be associated with the introduction of low-charge cations of 3d-elements into the cationic sublattice of bismuth.
Figure 7c shows that the Sb3d XPS spectra overlap with the oxygen spectra. Meanwhile, the Sb3d3/2 component at 539.6 eV can be distinguished, and its shape indicates the same charge state of antimony ions in the ceramics. In the literature [28,29,30], the distribution of binding energy values for antimony ions of different valences is observed. The difference between the binding energies of the Sb3d3/2 lines found for Sb2O3 and Sb2O5 varies in the range of 0.6–1.0 eV and, accordingly, the states of Sb3+ and Sb5+ can be well separated by the XPS method. According to the literature data, the spread of binding energy values for Sb3+/Sb5+ is 539.4–540.0 eV [28], 539.3–540.2 eV [29], and 539.5–540.5 eV [30]. In the present experiment, the binding energy of the Sb3d3/2 peak is 539.6 eV, thereby indicating a charge state of +(5-δ) for antimony. A similar comparative analysis of the energy position of the peak was conducted for the Mg1s XPS spectrum of the pyrochlore sample (Figure 7d) and MgO [31], which allows us to assume that the charge state of these atoms is +2. The Ni2p XPS spectra of nickel oxides and antimony pyrochlore are shown in Figure 7e. Comparison of the pyrochlore spectra with the NiO spectrum obtained by us and the Ni2O3 spectrum known from the literature [32] allows us to conclude that all nickel cations are in the same charge state. The energy position of the XPS Ni2p spectrum of pyrochlore is more consistent with the Ni2O3 spectrum. However, the NEXAFS Ni2p spectra of pyrochlore and NiO oxide (Figure 7f) practically coincide in energy position and spectral details. Experimental NEXAFS Ni2p spectra of Ni2O3 are not available in the literature. However, the calculated spectra of trivalent nickel clearly differ from those of the pyrochlore studied here [33]. This difference led to the conclusion that the nickel cations in pyrochlore are divalent.

4. Conclusions

A low-porosity nickel- and magnesium-containing bismuth antimonate, Bi2.7Mg0.46Ni0.70Sb2O10+Δ, was synthesized for the first time by the solid-phase method and characterized in detail. The structure was refined using the Rietveld method. The pyrochlore crystal structure is disordered, and the bismuth sublattice is partially vacant. The average thermal expansion coefficient (TEC) is 8.3 × 10⁻⁶ °C−1 for the temperature range of 30–810 °C. Above 1080 °C, pyrochlore thermally dissociates to form bismuth-free phases of the MSb2O6 (M-Ni, Mg) type. Above 1080 °C, reflections of two cubic phases are recorded, one of which is the pyrochlore phase. The relative high-frequency permittivity is independent of frequency and temperature up to 200 °C and has a value of 30.5, while the dielectric loss tangent is low, equal to 5 × 10⁻⁴. The calculation of the conductivity activation energy in the sample yielded a value of 0.99 eV. According to X-ray spectroscopy data, the charge state of the metal cations is traditional.

Author Contributions

Conceptualization, N.A.Z., N.A.S., S.V.N. and M.G.K.; formal analysis, O.V.P.; investigation, N.A.Z., S.V.N., S.S.S., V.A.B., M.G.K., A.V.K. and N.A.S.; resources, M.G.K., V.A.B., A.V.K., S.S.S., R.G.C. and N.A.S.; validation, N.A.Z., S.V.N., M.G.K. and N.A.S.; visualization, N.A.Z., V.A.B., S.V.N., S.S.S., N.A.S. and M.G.K.; writing—original draft, N.A.Z. and S.V.N. All authors have read and agreed to the published version of the manuscript.

Funding

The NEXAFS studies were performed with the financial support of the Ministry of Science and Higher Education of Russia within the framework of agreement No. 075-15-2025-455.

Data Availability Statement

The original contributions presented in this study are included in the article. Further inquiries can be directed to the corresponding author.

Acknowledgments

Structure analysis was done at the Center for X-Ray Diffraction Studies of the Research Park of St. Petersburg State University within the project 125021702335-5. Optical studies were performed at the “Methods of Analysis of Substance Composition” resource center of the Research Park of St. Petersburg State University within the project 125021702335-5. The NEXAFS studies were performed on the synchrotron radiation from station “NanoPES” storage ring (National Research Center “Kurchatov Institute”, project No. 3034) within the framework of the state budget topic 125020501562-1.

Conflicts of Interest

The authors declare no conflicts of interest.

References

  1. Hiroi, Z.; Yamaura, J.-I.; Yonezawa, S.; Harima, H. Chemical trends of superconducting properties in pyrochlore oxides. Phys. C Supercond. Appl. 2007, 460–462, 20–27. [Google Scholar] [CrossRef] [Scilit]
  2. Giampaoli, G.; Siritanon, T.; Day, B.; Li, J.; Subramanian, M.A. Temperature in-dependent low loss dielectrics based on quaternary pyrochlore oxides. Prog. Solid State Chem. 2018, 50, 16–23. [Google Scholar] [CrossRef] [Scilit]
  3. Cann, D.P.; Randall, C.A.; Shrout, T.R. Investigation of the dielectric properties of bismuth pyrochlores. Sol. St. Commun. 1996, 100, 529–534. [Google Scholar] [CrossRef] [Scilit]
  4. Kozlovskiy, A.L.; Shlimas, D.I.; Volodina, N.; ZhMoldabayeva, G.; Kabiyev, M.; Konuhova, M. Study of the effect of phase formation processes on the change in optical and thermal properties of Nd2Zr2O7 ceramics with a pyrochlore structure. Opt. Mater. X 2025, 26, 100410. [Google Scholar] [CrossRef] [Scilit]
  5. Antonova, E.; Tropin, E.; Khodimchuk, A. Alkaline earth–doped La2Zr2O7 oxides with a pyrochlore structure: Phase equilibria and electrical properties. Ionics 2022, 28, 5181–5188. [Google Scholar] [CrossRef] [Scilit]
  6. Wang, Y.; Jing, C.; Ding, Z.-Y.; Zhang, Y.-Z.; Wei, T.; Ouyang, J.-H.; Liu, Z.-G.; Wang, Y.-J.; Wang, Y.-M. The Structure, Property, and Ion Irradiation Effects of Pyrochlores: A Comprehensive Review. Crystals 2023, 13, 143. [Google Scholar] [CrossRef] [Scilit]
  7. McCauley, R.A. Structural Characteristics of Pyrochlore Formation. J. Appl. Phys. 1980, 51, 290−294. [Google Scholar] [CrossRef] [Scilit]
  8. Vanderah, T.A.; Lufaso, M.W.; Adler, A.U.; Levin, I.; Nino, J.C.; Provenzano, V.; Schenck, P.K. Subsolidus phase equilibria and properties in the system Bi2O3:Mn2O3±x:Nb2O5. J. Sol. St. Chem. 2006, 179, 3467–3477. [Google Scholar] [CrossRef] [Scilit]
  9. Vanderah, T.A.; Siegrist, T.; Lufaso, M.W.; Yeager, M.C.; Roth, R.S.; Nino, J.C.; Yates, S. Phase Formation and Properties in the System Bi2O3:2CoO1+x:Nb2O5. Eur. J. Inorgan. Chem. 2006, 2006, 4908–4914. [Google Scholar] [CrossRef] [Scilit]
  10. Miles, G.C.; West, A.R. Pyrochlore Phases in the System ZnO-Bi2O3-Sb2O5: I. Stoichiometries and Phase Equilibria. J. Am. Ceram. Soc. 2006, 89, 1042–1046. [Google Scholar] [CrossRef] [Scilit]
  11. Lufaso, M.W.; Vanderah, T.A.; Pazos, I.M.; Levin, I.; Roth, R.S.; Nino, J.C.; Provenzano, V.; Schenck, P.K. Phase formation, crystal chemistry, and properties in the system Bi2O3–Fe2O3–Nb2O5. J. Sol. St. Chem. 2006, 179, 3900–3910. [Google Scholar] [CrossRef] [Scilit]
  12. Chon, M.P.; Tan, K.B.; Khaw, C.C.; Zainal, Z.; Taufiq-Yap, Y.H.; Chen, S.K.; Tan, P.Y. Subsolidus phase equilibria and electrical properties of pyrochlores in the Bi2O3–CuO–Ta2O5 ternary system. J. Alloys Comp. 2016, 675, 116–127. [Google Scholar] [CrossRef] [Scilit]
  13. Jusoh, F.A.; Tan, K.B.; Zainal, Z.; Chen, S.K.; Khaw, C.C.; Lee, O.J.; Balachandran, R.; Murthy, H.C.A. Novel pyrochlore-structured bismuth iron antimonates: Structural, impedance and electrochemical studies. Results Phys. 2021, 27, 104542. [Google Scholar] [CrossRef] [Scilit]
  14. Zhuk, N.A.; Sekushin, N.A.; Krzhizhanovskaya, M.G.; Kharton, V.V. Multiple relaxation, reversible electrical breakdown and bipolar conductivity of pyrochlore–type Bi2Cu0.5Zn0.5Ta2O9 ceramics. Sol. St. Ion. 2022, 377, 115868. [Google Scholar] [CrossRef] [Scilit]
  15. Valant, M. Dielectric Relaxations in Bi2O3-Nb2O5-NiO Cubic Pyrochlores. J. Am. Ceram. Soc. 2009, 92, 955–958. [Google Scholar] [CrossRef] [Scilit]
  16. Abdullah, A.; Wan Khalid, W.E.F.; Abdullah, S.Z. Synthesis and Characterization of Bismuth Nickel Tantalate Pyrochlore. Appl. Mech. Mater. 2015, 749, 30–35. [Google Scholar] [CrossRef] [Scilit]
  17. Zhuk, N.A.; Krzhizhanovskaya, M.G.; Koroleva, A.V.; Nekipelov, S.V.; Kharton, V.V.; Sekushin, N.A. Thermal Expansion, XPS Spectra, and Structural and Electrical Properties of a New Bi2NiTa2O9 Pyrochlore. Inorg. Chem. 2021, 60, 4924–4934. [Google Scholar] [CrossRef] [Scilit] [PubMed]
  18. Zhuk, N.A.; Krzhizhanovskaya, M.G.; Sekushin, N.A.; Kharton, V.V.; Koroleva, A.V.; Nekipelov, S.V.; Sivkov, D.V.; Sivkov, V.N.; Makeev, B.A.; Lebedev, A.M.; et al. Novel Ni-Doped Bismuth–Magnesium Tantalate Pyrochlores: Structural and Electrical Properties, Thermal Expansion, X-ray Photoelectron Spectroscopy, and Near-Edge X-ray Absorption Fine Structure Spectra. ACS Omega 2021, 6, 23262–23273. [Google Scholar] [CrossRef] [Scilit] [PubMed]
  19. Ellert, O.G.; Egorysheva, A.V.; Gajtko, O.M.; Kirdyankin, D.I.; Svetogorov, R.D. Highly frustrated Bi-Cr-Sb-O pyrochlore with spin-glass transition. J. Magn. Magn. Mater. 2018, 463, 13–18. [Google Scholar] [CrossRef] [Scilit]
  20. Egorysheva, A.V.; Ellert, O.G.; Zubavichus, Y.V.; Gajtko, O.M.; Efimov, N.N.; Svetogorov, R.D.; Murzin, V.Y. New complex bismuth oxides in the Bi2O3–NiO–Sb2O5 system and their properties. J. Solid State Chem. 2015, 225, 97–104. [Google Scholar] [CrossRef] [Scilit]
  21. Egorysheva, A.V.; Ellert, O.G.; Gajtko, O.M.; Kirdyankin, D.I.; Svetogorov, R.D. Complex dependence of magnetic properties on Mn concentration in Bi-Mn-Sb-O pyrochlores. J. Alloys Compd. 2017, 718, 311–318. [Google Scholar] [CrossRef] [Scilit]
  22. Egorysheva, A.V.; Golodukhina, S.V.; Liberman, E.Y.; Razvorotneva, L.S.; Kirdyankin, D.I.; Popova, E.F. Synthesis of Bi1.5CoSb1.5O7 with the Pyrochlore Structure under Hydrothermal Conditions and Its Catalytic Properties in the Reaction of CO Oxidation. Russ. J. Inorgan. Chem. 2024, 69, 957–964. [Google Scholar] [CrossRef] [Scilit]
  23. Nekipelov, S.V.; Krzhizhanovskaya, M.G.; Koroleva, A.V.; Sekushin, N.A.; Belyy, V.A.; Petrova, O.V.; Zhuk, N.A. NEXAFS and XPS and Structural, Electrical and Thermal Properties of Zn and Ni Codoped Bismuth Antimonate Pyrochlore. Chemistry 2026, 8, 110. [Google Scholar] [CrossRef] [Scilit]
  24. Bruker, A.X.S. Topas 5.0; General Profile and Structure Analysis Software for Powder Diffraction Data; Bruker AXS: Karlsruhe, Germany, 2014. [Google Scholar]
  25. de Almeida, E.F., Jr.; Kakanakova-Georgieva, A.; Gueorguiev, G.K. On Decorating a Honeycomb AlN Monolayer with Hydrogen and Fluorine Atoms: Ab Initio and Experimental Aspects. Materials 2024, 17, 616. [Google Scholar] [CrossRef] [Scilit] [PubMed]
  26. Pela, R.R.; Hsiao, C.-L.; Hultman, L.; Birch, J.; Kostov Gueorguiev, G. Electronic and optical properties of core–shell InAlN nanorods: A comparative study via LDA, LDA-1/2, mBJ, HSE06, G0W0 and BSE methods. Phys. Chem. Chem. Phys. 2024, 26, 7504–7514. [Google Scholar] [CrossRef] [Scilit] [PubMed]
  27. Lasia, A. Electrochemical Impedance Spectroscopy and Its Applications; Springer: New York, NY, USA, 2014; p. 369. [Google Scholar]
  28. Delobel, R.; Baussart, H.; Leroy, J.-M.; Grimblot, J.; Gengembre, L. X-ray photoelectron spectroscopy study of uranium and antimony mixed metal-oxide catalysts. J. Chem. Soc. Faraday Trans. 1983, 79, 879–891. [Google Scholar] [CrossRef] [Scilit]
  29. Izquierdo, R.; Sacher, E.; Yelon, A. X-ray photoelectron spectra of antimony oxides. Appl. Surf. Sci. 1989, 40, 175–177. [Google Scholar] [CrossRef] [Scilit]
  30. Benvenutti, E.V.; Gushikem, Y.; Vasquez, A.; de Castro, S.C.; Zaldivar, G.; Gunther, A.P. X-Ray photoelectron spectroscopy and messbauer spectroscopy study of iron(III) and antimony(V) oxides grafted onto a silica gel surface. J. Chem.Soc. Chem. Commun. 1991, 19, 1325–1327. [Google Scholar] [CrossRef] [Scilit]
  31. Khairallah, F.; Glisenti, A. XPS Study of MgO Nanopowders Obtained by Different Preparation Procedures. Surf. Sci. Spectra 2006, 13, 58–71. [Google Scholar] [CrossRef] [Scilit]
  32. Mansour, A.N.; Melendres, C.A. Characterization of Ni2O3⋅6H2O by XPS. Surf. Sci. Spectra 1994, 3, 263–270. [Google Scholar] [CrossRef] [Scilit]
  33. Preda, I.; Abbate, M.; Gutiérrez, A.; Palacín, S.; Vollmer, A.; Soriano, L. Study of the growth of NiO on highly oriented pyrolytic graphite by X-ray absorption spectroscopy. J. Electron Spectrosc. Relat. Phenom. 2007, 156–158, 111–114. [Google Scholar] [CrossRef] [Scilit]
Figure 1. Micrograph of the surface of the Bi2.7Mg0.46Ni0.70Sb2O10+Δ sample in the elastically reflected electron mode, EDS spectrum, and maps of the elements included in the sample.
Crystals 16 00563 g001
Figure 2. Differential scanning calorimetry and thermogravimetric analysis curves for Bi2.7Mg0.46Ni0.70Sb2O10+Δ in the temperature range 500–1200 °C.
Crystals 16 00563 g002
Figure 3. Experimental powder XRD pattern of Bi2.7Mg0.46Ni0.70Sb2O10+Δ (blue crosses), Rietveld-simulated pattern (solid red line), and the difference between experimental and calculated patterns.
Crystals 16 00563 g003
Figure 4. Detailed plot of XRD patterns of Bi2.7Mg0.46Ni0.70Sb2O10+Δ in the heating range 30–1200 °C (a) and after heating the sample at 1200 °C (b); temperature dependence of the cubic unit cell parameter a of Bi2.7Mg0.46Ni0.70Sb2O10+Δ (c); manifestation of reflections of two cubic phases on the X-ray powder diffraction pattern of a sample heated to 1140 °C (d); and TECs of Bi2.7Mg0.46Ni0.70Sb2O10+Δ at different temperatures (e).
Crystals 16 00563 g004
Figure 5. Tauc curve and band gap for Bi2.7Mg0.46Ni0.70Sb2O10+Δ for direct (n = 1/2) and indirect (n = 1) transitions.
Crystals 16 00563 g005
Figure 6. (a) The modulus of the impedance and (b) phase of the impedance of the Bi2.7Mg0.46Ni0.70Sb2O10+Δ sample; (c) the logarithm of the impedance modulus versus the logarithm of the angular frequency at 24 °C; (d) frequency dependences of the relative permittivity and (e) the dielectric loss tangent of the Bi2.7Mg0.46Ni0.70Sb2O10+Δ; (f) the temperature dependence of the end-to-end conductivity of Bi2.7Mg0.46Ni0.70Sb2O10+Δ, plotted on an Arrhenius scale.
Crystals 16 00563 g006
Figure 7. Survey XPS spectra of Bi2.7Mg0.46Ni0.70Sb2O10+Δ (a), XPS Bi4f spectra (b), XPS Sb3d and O1s spectra (c), XPS Mg1s spectra (d), XPS Ni2p spectra (e), and NEXAFS Ni2p spectra (f).
Crystals 16 00563 g007
Table 1. Variants of cation distribution by crystallographic positions and refinement parameters obtained by the Rietveld method based on powder data, as well as atomic parameters of Ni-doped bismuth magnesium stibate.
1 option—[Bi1.710.29][Mg0.29Ni0.44Sb1.27]O6.870.13 = Bi2.7Mg 0.46Ni0.70Sb2O10.85
a (Å)
α, β, γ (˚)
V3)
Dcalc (g/cm3)
10.47461(6)
90, 90, 90
1149.248(19)
7.562(5)
RB, %
Rwp, %
Rp, %
Rexp, %
GOF
0.494
5.14
3.76
3.05
1.69
AtomWyckoff sitexyzSOFBiso,Å2
Bi96g00.02150(14)−0.01508(14)0.1424(8)0.98(7)
Sb16b0.50000.50000.50000.6330.20(5)
Mg16b0.50000.50000.50000.14550.20(5)
Ni16b0.50000.50000.50000.22150.20(5)
O148f0.12500.12500.4268(5)11.45(18)
O28a0.12500.12500.12500.87(3)1.45(18)
2 option—[Bi1.71Ni0.070.22][ Mg 0.30Ni0.39Sb1.31]O6.990.11 = [Bi2.7Ni0.11][Mg 0.47Ni0.61Sb2.07]O11.04
a (Å)
α, β, γ (˚)
V3)
Dcalc (g/cm3)
10.47471(6)
90, 90, 90
1149.2812(19)
7.662(5)
RB, %
Rwp, %
Rp, %
Rexp, %
GOF
1.393
5.19
3.82
3.05
1.70
AtomWyckoff sitexyzSOFBiso,Å2
Bi96g00.02151(13)−0.02151(13)0.1424(8)0.30(7)
Ni96g00.02151(13)−0.02151(13)0.006(8)0.30(7)
Sb16b0.50000.50000.50000.656−0.14(5)
Ni16b0.50000.50000.50000.193−0.14(5)
Mg16b0.50000.50000.50000.151−0.14(5)
O148f0.12500.12500.4247(6)11.11(19)
O28a0.12500.12500.12500.99(3)1.11(19)
3 option—[Bi1.82Ni 0.120.06][ Mg 0.31Ni0.34Sb1.35]O7.0 = [Bi2.7Ni 0.18][ Mg 0.46Ni0.50Sb2]O10.38
a (Å)
α, β, γ (˚)
V3)
Dcalc (g/cm3)
10.47536(6)
90, 90, 90
1149.49(2)
7.981(5)
RB, %
Rwp, %
Rp, %
Rexp, %
GOF
0.98
5.05
3.66
3.05
1.66
AtomWyckoff sitexyzSOFBiso,Å2
Bi96g00.02099(16)−0.02099(2)0.15141.57(8)
Ni96g00.02099(16)−0.02099(2)0.01041.57(8)
Sb16b0.50000.50000.50000.6729−0.10(4)
Ni16b0.50000.50000.50000.1726−0.10(4)
Mg16b0.50000.50000.50000.1545−0.10(4)
O148f0.12500.12500.4265(5)11.22(16)
O28a0.12500.12500.12501.00(3)1.22(16)
4 option—[Bi1.82Mg 0.120.06][ Mg 0.18Ni0.47Sb1.34]O7 = [Bi2.73 Mg 0.18][ Mg 0.27Ni0.7Sb2.01]O10.5
a (Å)
α, β, γ (˚)
V3)
Dcalc (g/cm3)
10.47566(6)
90, 90, 90
1149.59(2)
7.981(1)
RB, %
Rwp, %
Rp, %
Rexp, %
GOF
0.713
5.02
3.63
3.05
1.65
AtomWyckoff sitexyzSOFBiso,Å2
Bi96g00.02122(15)−0.02122(15)0.15141.16(7)
Mg96g00.02122(15)−0.02122(15)0.01041.16(7)
Sb16b0.50000.50000.50000.67290.00(4)
Ni16b0.50000.50000.50000.2350.00(4)
Mg16b0.50000.50000.50000.09210.00(4)
O148f0.12500.12500.4268(5)10.95(15)
O28a0.12500.12500.125010.95(15)
5 option—[Bi1.82Mg0.06Ni0.060.06][Mg0.24Ni0.41Sb1.3458]O7.00 = [Bi2.70Mg0.09Ni0.09][Mg 0.36Ni0.61Sb2]O10.38
a (Å)
α, β, γ (˚)
V3)
Dcalc (g/cm3)
10.47576(6)
90, 90, 90
1149.63(2)
8.02280(14)
RB, %
Rwp, %
Rp, %
Rexp, %
GOF
0.810
5.03
3.65
3.05
1.65
AtomWyckoff sitexyzSOFBiso,Å2
Bi96g00.02119(15)−0.02119(15)0.1514(8)1.23(7)
Mg96g00.02119(15)−0.02119(15)0.00521.23(7)
Ni96g00.02119(15)−0.02119(15)0.00521.23(7)
Sb16b0.50000.50000.50000.67290.37(4)
Ni16b0.50000.50000.50000.20380.07(4)
Mg16b0.50000.50000.50000.12330.07(4)
O148f0.12500.12500.4272(5)10.89(15)
O28a0.12500.12500.12501.00(3)0.89(15)
6 option—[Bi1.800.20][Mg 0.26Ni0.34Sb1.4]O6.91 = [Bi2.70][Mg 0.39Ni0.51Sb2.1]O10.365
a (Å)
α, β, γ (˚)
V3)
Dcalc (g/cm3)
10.47574(6)
90, 90, 90
1149.62(2)
7.90(2)
RB, %
Rwp, %
Rp, %
Rexp, %
GOF
0.810
5.02
3.64
3.05
0.607
AtomWyckoff sitexyzSOFBiso,Å2
Bi96g00.02125(15)−0.02115(15)0.1501(8)1.05(9)
Sb16b0.50000.50000.50000.70.23(5)
Ni16b0.50000.50000.50000.170.23(5)
Mg16b0.50000.50000.50000.130.23(5)
O148f0.12500.12500.4271(5)10.73(17)
O28a0.12500.12500.12500.91(3)0.73(17)
Table 2. Selected bond lengths in the structure of Bi2.7Mg0.46Ni0.70Sb2O10+Δ..
BondLength (Å)
Bi1–O1 × 22.2898(4)
–O1 × 22.3590(4)
–O1 × 22.640(4)
–O2 × 22.895(4)
<Bi1VIII–O>2.55
Sb1–O1 × 62.003(19)
<Sb1VI–O>2.00
Table 3. TECs (×106 °C−1) of Bi2.7Mg0.46Ni0.70Sb2O10+Δ along crystallographic axes at different temperatures.
T, °C3090150210270330390450510570630690750810
TECs (×106 °C−1)6.827.067.297.537.767.998.228.468.708.929.159.389.619.84
<30-990>8.34
Disclaimer/Publisher’s Note: The statements, opinions and data contained in all publications are solely those of the individual author(s) and contributor(s) and not of MDPI and/or the editor(s). MDPI and/or the editor(s) disclaim responsibility for any injury to people or property resulting from any ideas, methods, instructions or products referred to in the content.