Article

Anisotropic Thermo-Elastic Modeling and Sensitivity Analysis of Edge-Defined Film-Fed Grown β-Ga2O3


School of Physical Science and Technology, Lanzhou University, Lanzhou 730000, China
Crystals 2026, 16(9), 558; https://doi.org/10.3390/cryst16090558
Submission received: 21 July 2026 / Revised: 23 August 2026 / Accepted: 26 August 2026 / Published: 27 August 2026
(This article belongs to the Section Crystal Engineering)

Abstract

The edge-defined film-fed growth (EFG) method is the dominant industrial technique for producing large-area β-Ga2O3 single-crystal substrates, but thermal stress-induced dislocation generation remains a critical barrier. This work presents a coupled thermo-mechanical finite-element framework for thermal-stress management in EFG-grown β-Ga2O3. The central methodological contribution is a 500-sample gradient-boosting surrogate sensitivity analysis ( R 2 = 0.955 , mean absolute error (MAE) = 11.3 MPa) that quantitatively decomposes thermal-stress variance into controllable process factors and irreducible material-property uncertainties. The physical foundation comprises two enabling elements: (i) the full 21-component monoclinic Voigt stiffness matrix with explicit crystal–model coordinate mapping, for which the orthotropic model is rigorously shown to be exact in 2D plane strain through an exact kinematic theorem showing that the 2D plane-strain results of prior orthotropic EFG analyses are unaffected by the coupling terms, while the monoclinic formulation provides the essential foundation for future 3D studies; and (ii) a dimensionless and numerical justification for omitting melt convection, which enables 100% solver convergence (500/500 Latin hypercube samples) with stress errors < 1.5 MPa. Afterheater temperature T AH is the leading controllable parameter (35.9%), nearly tied with the elastic constant C 33 (35.5%), followed by the thermal-expansion component α c (15.9%). Elevating T AH from 1900 K to 1950 K reduces the peak von Mises stress by ∼29% (COMSOL Multiphysics 6.2-verified); the 2D plane-strain baseline anchors the surrogate analysis at σ max = 223 MPa, while the afterheater-free 3D configuration gives σ max = 187 MPa at the crystal periphery near the solid–liquid interface. The isotropic approximation underestimates peak stress by 39.6%, confirming that directional anisotropy is essential for quantitatively reliable thermal stress prediction in monoclinic oxide crystals.

1. Introduction

Beta-gallium oxide (β-Ga2O3) has emerged as a transformative ultra-wide-bandgap semiconductor (bandgap ∼4.8 eV, predicted Baliga figure of merit > 3000) with the unique advantage of melt-grown single-crystal substrates compatible with industrially scalable techniques [1]. Among melt-growth methods, edge-defined film-fed growth (EFG) has become the dominant production route, routinely yielding 2-inch and, more recently, 4-inch single-crystalline substrates [2,3], while the vertical Bridgman method has produced 6-inch boules [4] and Czochralski (CZ) growth has been simulated for thermal-gradient control [5]. However, the pronounced thermo-elastic anisotropy of β-Ga2O3—arising from its low-symmetry monoclinic C 2 / m crystal structure—introduces severe challenges in thermal-stress management during post-growth cooling. Residual stresses exceeding the critical resolved shear stress (CRSS) drive dislocation multiplication, which degrades crystalline quality and ultimately limits power-device performance [6].
Numerical simulations of EFG-grown oxide crystals have progressed from isotropic linear-elasticity approximations, which first established the central role of anisotropic thermal expansion in stress development [7], to orthotropic descriptions that resolved the directional elastic response [8], and further to full-process coupled-field simulations that added dynamic interface tracking and active afterheater optimization [9,10,11]. Machine-learning surrogates have recently emerged to accelerate thermal-field optimization over large geometric-parameter datasets [12,13] (Table 1). However, all of these models adopt either isotropic or orthotropic elastic descriptions; the full monoclinic anisotropy—21 independent elastic constants with four shear–normal coupling terms—has not been applied to EFG β-Ga2O3 thermal-stress prediction.
Experimental validation benchmarks include Raman stress measurements (10–300 MPa) [15], X-ray diffraction and Raman characterization [16], etch-pit density (EPD) measurements ( 10 3 10 5 cm−2) [6], extended-defect microscopy [17], crack propagation studies [18], and a recent review spanning 60 years of bulk-growth methods [19].
Crucially, the four non-zero shear–normal coupling terms ( C 15 , C 25 , C 35 , C 46 ) that distinguish the monoclinic stiffness matrix from its orthotropic simplification are intrinsically three-dimensional. In a 2D plane-strain formulation, the out-of-plane shear strains ϵ 13 and ϵ 23 are identically zero, so these coupling terms contribute nothing to the stress field; therefore, the orthotropic and monoclinic models become equivalent. In a fully 3D geometry, these terms activate, enabling shear–normal coupling that can redistribute stress and alter both the peak magnitude and spatial distribution of stress. Prior isotropic [9] and orthotropic [8] models therefore provide an incomplete description of the full anisotropic stress state.
The practical necessity of the monoclinic formulation becomes apparent in three-dimensional geometries, where the coupling terms ( C 15 , C 25 , C 35 , C 46 ) are expected to activate and produce effects inaccessible to orthotropic models: (1) shear–normal coupling may redistribute stress across crystal faces, potentially shifting the critical slip system from the one predicted by an orthotropic model; (2) afterheater asymmetric heating could couple with monoclinic stiffness to generate slip-system-specific resolved shear stresses that an orthotropic model would underestimate; and (3) anisotropic thermal conductivity [20] combined with monoclinic stiffness may produce thermal stress patterns that differ qualitatively from the orthotropic prediction in 3D. These effects are absent in the present 2D plane-strain formulation and require future 3D non-axisymmetric simulations to quantify. The full monoclinic matrix is implemented as the foundation for a framework that remains physically complete when extended to three dimensions.
The complete monoclinic stiffness tensor has been available since the resonant ultrasound measurements of Adachi et al. [21]; to the author’s knowledge, it has not yet been incorporated into an EFG growth model. The present work therefore addresses three gaps left by prior EFG models. First, it implements the full 21-component monoclinic stiffness matrix with an explicit crystal-to-model coordinate mapping and demonstrates that, in 2D plane-strain, the orthotropic approximation is exact—establishing the anisotropic foundation required for quantitative prediction and for the 3D case, where the monoclinic coupling terms become active. Second, it provides a combined dimensionless and numerical justification for omitting melt convection, which removes the dominant source of solver non-convergence and enables the large parametric study. Third, it uses a 500-sample gradient-boosting surrogate to decompose thermal-stress variance into controllable process factors and irreducible material-property uncertainties, giving actionable guidance for growth optimization.

2. Materials and Methods

2.1. Model Geometry and Dimensionality Justification

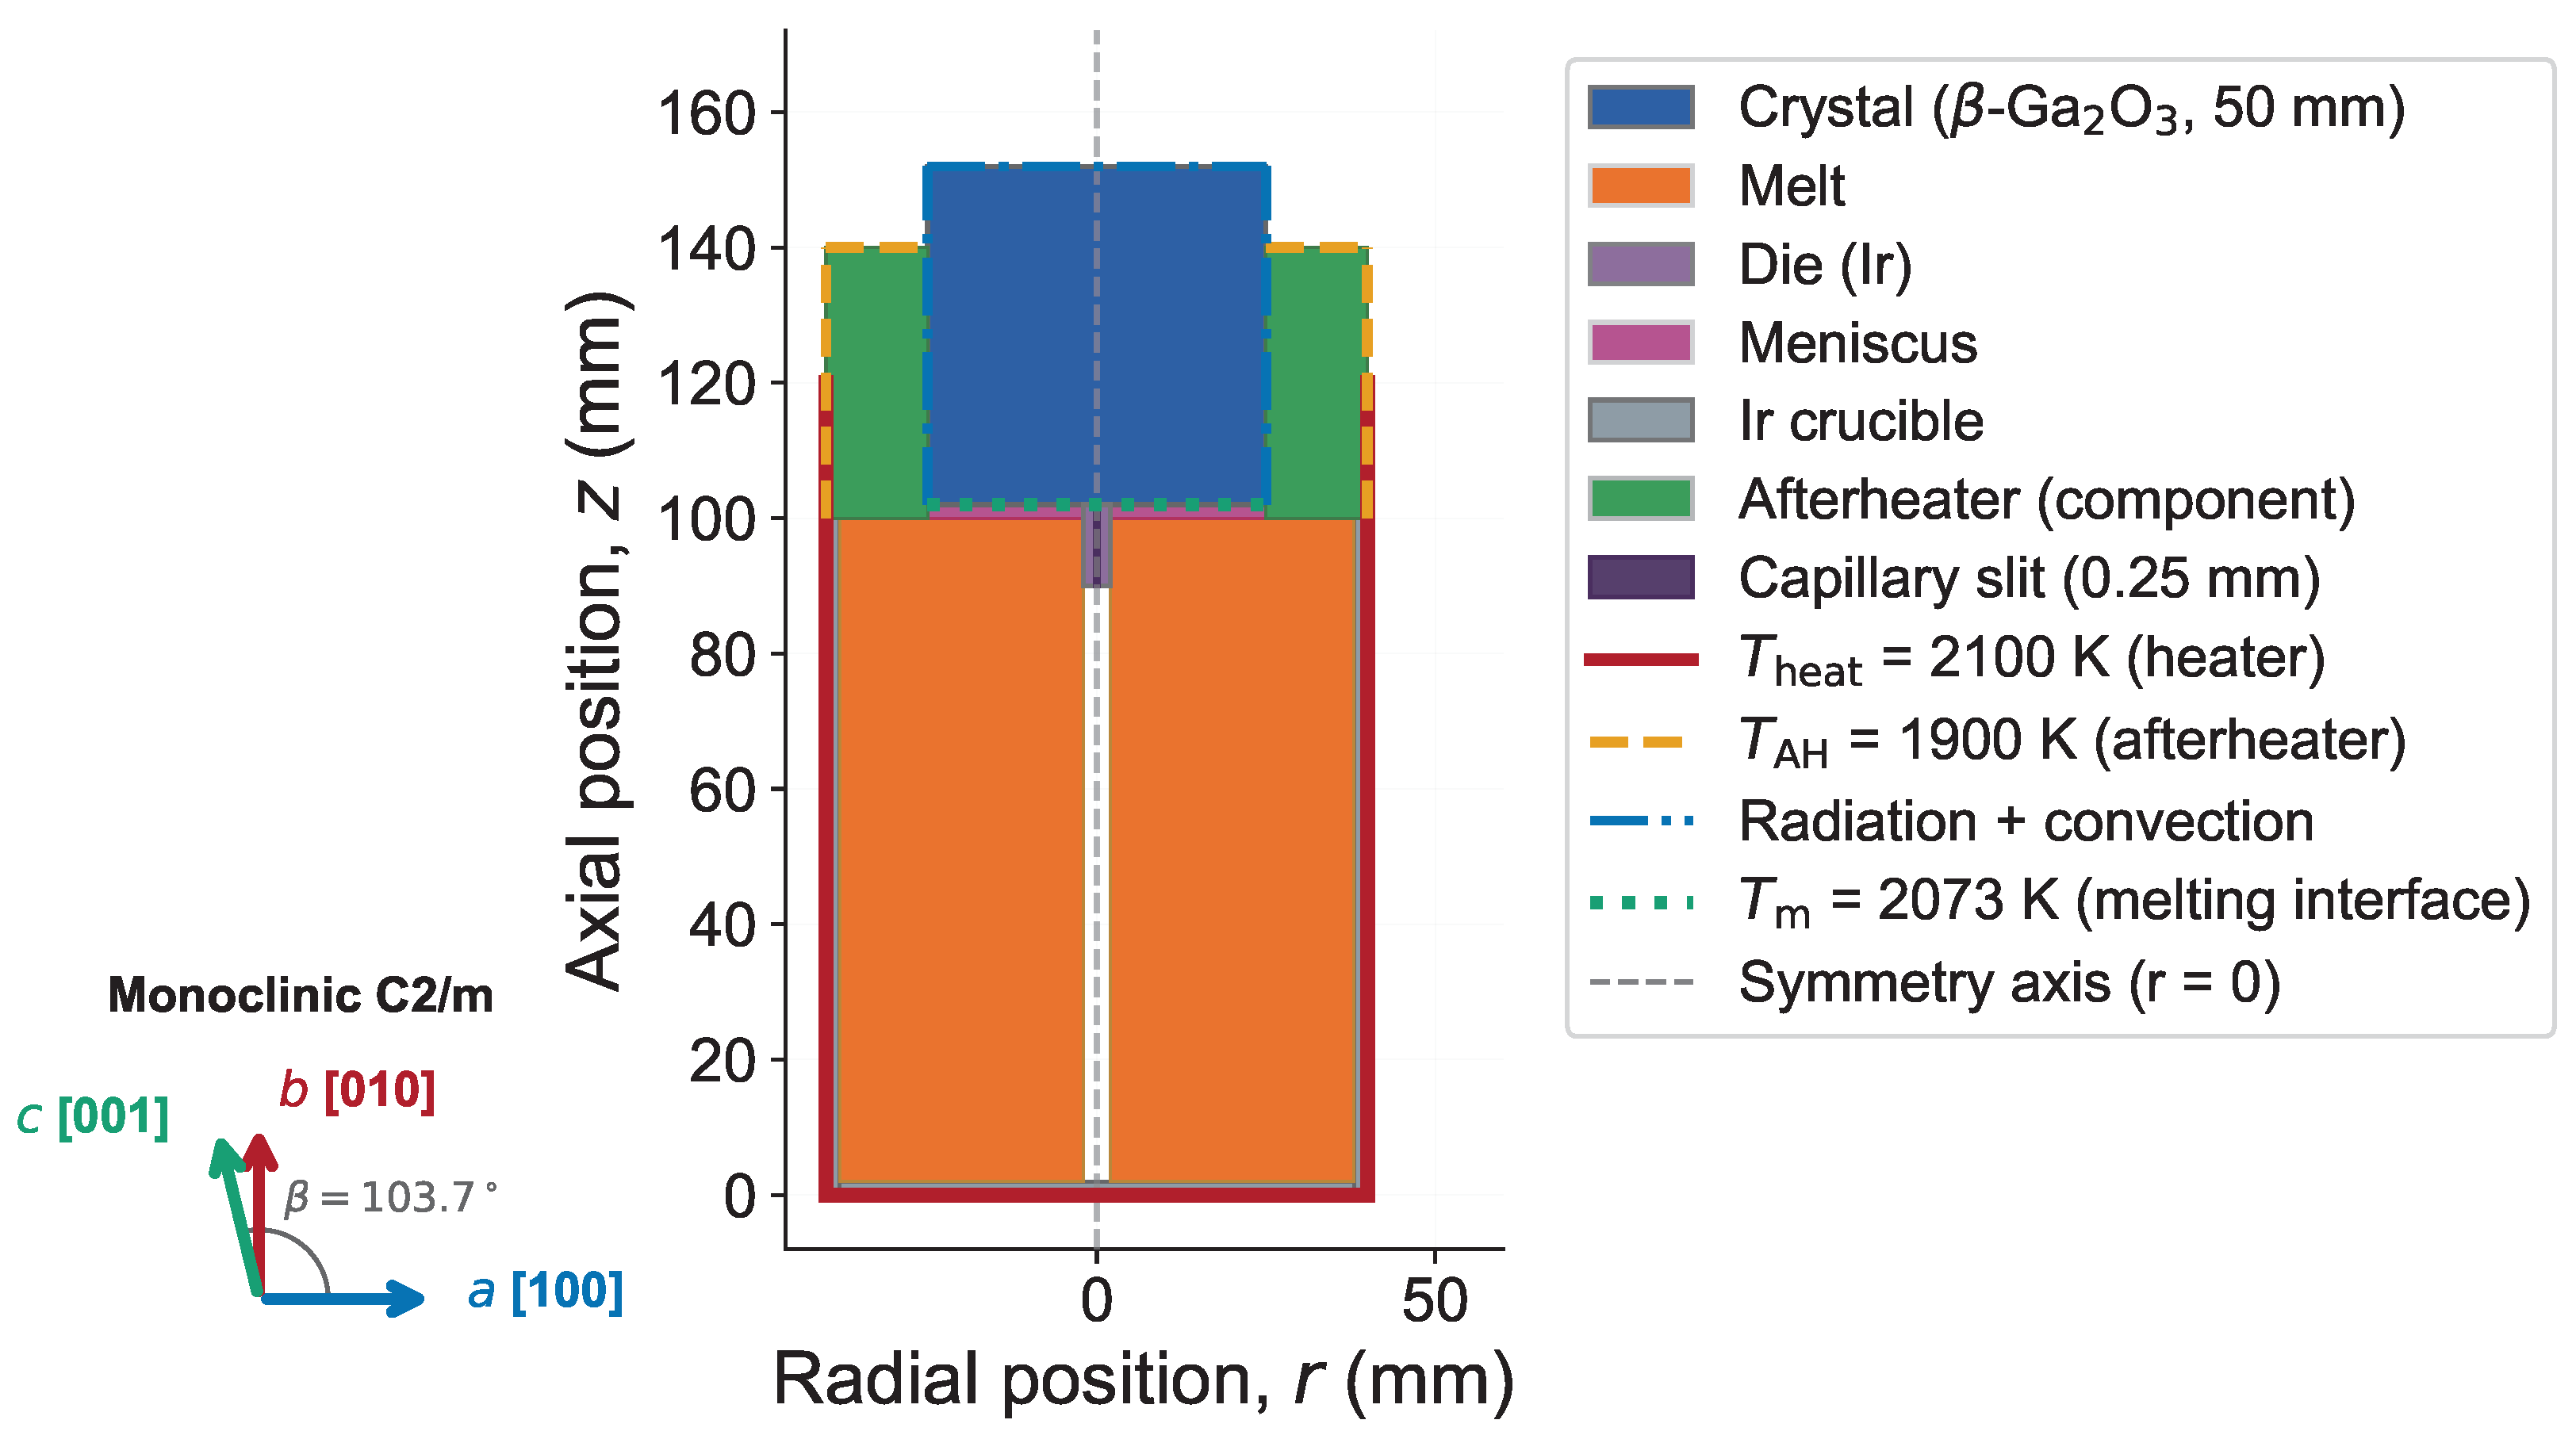
The EFG system is modeled as a 2D planar (plane-strain) half-model exploiting left–right symmetry (Figure 1). The plane-strain assumption provides a conservative upper bound on thermal stress, with estimated stresses 10–20% higher than those in the equivalent 3D cylindrical case [14]. The computational cost per solve (∼3 s) enables the 500-sample parametric study. The out-of-plane constraint may amplify the c-axis parameter contributions. Therefore, the importance percentages for C 33 and α c should be treated as upper bounds pending 3D validation.
The computational domain comprises eight subdomains (Table 2). The β-Ga2O3 crystal is 25 mm half-width × 50 mm height (a 2-inch-class boule). The capillary slit half-width is 0.25 mm, following industrial EFG practice [15].

2.2. Crystal Axis to Model Coordinate Mapping

For β-Ga2O3 (monoclinic C 2 / m , unique axis b), the convention adopted [21,22] is as follows: z     b [010] (growth), x     a [100] (radial), and y     c [001] (out-of-plane). This corresponds to the conventional EFG configuration used to produce (010)-oriented wafers [2]. The full 21-component Voigt stiffness matrix is:
D = C 11 C 12 C 13 0 C 15 0 C 12 C 22 C 23 0 C 25 0 C 13 C 23 C 33 0 C 35 0 0 0 0 C 44 0 C 46 C 15 C 25 C 35 0 C 55 0 0 0 0 C 46 0 C 66
The room-temperature experimental values, reported in GPa and obtained by resonant ultrasound spectroscopy (RUS) [21], are as follows: C 11 = 242.8 , C 22 = 343.8 , C 33 = 347.4 , C 12 = 128.0 , C 13 = 160.0 , C 23 = 70.9 , C 15 = 1.62 , C 25 = 0.36 , C 35 = 0.97 , C 44 = 47.8 , C 46 = 5.59 , C 55 = 88.6 , and C 66 = 104.0 . RUS determines elastic constants by matching measured mechanical resonance frequencies of a small sample to those predicted by continuum elasticity theory. An independent experimental determination by Miller et al. [14] agrees with these values to within a few percent, confirming reproducibility, and first-principles calculations [23] provide a further independent estimate. The experimental values were therefore adopted.
For the coefficient of thermal expansion (CTE) tensor, the diagonal components follow high-temperature XRD measurements [7]: α a = 2.1 × 10 6 , α b = 3.7 × 10 6 , α c = 5.3 × 10 6 K−1. Off-diagonal CTE components were set to zero due to the absence of reliable experimental data. The reference temperature is T m = 2073 K. The iridium crucible, die, and afterheater are modeled as isotropic linear elastic materials ( E = 530 GPa, ν = 0.26 , α Ir = 6.4 × 10 6 K−1) [9].

2.3. Governing Equations and Boundary Conditions

2.3.1. Heat Transfer

The steady-state heat transfer equation in solid domains is:
· ( k eff T ) = 0 ,
where k eff accounts for internal radiation via the Rosseland approximation:
k eff = k iso + 16 n 2 σ T 3 3 β R ,
with n = 1.9 , σ = 5.67 × 10 8 W m−2 K−4, and β R = 3000 m−1. The optical thickness τ = β R L 75 1 validates the optically thick limit.
Boundary conditions: crucible bottom/outer wall at T heat ; afterheater at T AH ; crystal–melt interface at T m = 2073 K [14]; crystal top with convective cooling ( h = 5 W m−2 K−1, T ext = 500 K) [9]. Surface-to-ambient T 4 radiation: q rad = ε σ ( T 4 T amb 4 ) , with three radiating surface categories: crystal top ( ε cry = 0.55 , T amb = 300 K), crystal side ( ε cry = 0.55 , T amb = T AH ), and melt free surface ( ε melt = 0.30 , T amb = T AH ). Iridium surfaces use ε Ir = 0.35 [9,14]. Throughout this work, T AH denotes the prescribed temperature of the afterheater surfaces—a fixed Dirichlet boundary condition that represents the thermal environment imposed by the afterheater power supply, i.e., a scalar process parameter rather than the spatially varying temperature field within the afterheater component. In the sensitivity analysis (Section 3), T AH is treated as a tunable process parameter (swept over 1850–1950 K), with higher values corresponding to increased afterheater power and reduced radiative loss from the crystal lateral surface.

2.3.2. Mechanical Equilibrium

Static equilibrium on the crystal domain requires · σ = 0 , with σ = D : ( ϵ α ( T T ref ) ) . Rigid motion is suppressed via weak spring constraints; the crystal bottom is mechanically free.

2.3.3. Dislocation Density Estimation

The semi-empirical correlation N d = N 0 ( σ vm / τ CRSS ) 2 is employed, where N 0 = 1 × 10 4 cm−2 and τ CRSS = 100 MPa. This provides a qualitative relative comparison, not quantitative prediction. Important caveats include the following: (1) the quadratic scaling is phenomenological; (2) the von Mises stress ignores slip-system specificity, whereas the CRSS of monoclinic β-Ga2O3 is strongly anisotropic; and (3) the parameters are chosen to align with the experimental EPD range [6]. Predicted N d values carry an uncertainty of approximately ±one order of magnitude. High-temperature CRSS data remain an important experimental need [15].

2.4. Justification for Neglecting Melt Convection

The EFG configuration differs fundamentally from the classic Rayleigh–Bénard paradigm: the die structure partitions the melt into narrow vertical channels, and the 0.25 mm capillary slit provides extreme viscous resistance that hydraulically decouples the meniscus from the bulk melt. Each convection mechanism is evaluated using thermophysical properties of molten Ga2O3 ( ρ 5.0 × 10 3 kg/m3, μ 5 × 10 3 Pa·s, ν 1 × 10 6 m2/s, κ 2 × 10 6 m2/s, β 5 × 10 5 K−1, γ / T 1 × 10 4 N/m·K) [9,14].
Buoyancy-driven convection: With the die-confined annular gap L 0.01 m and Δ T 10 K:
Ra = g β Δ T L 3 ν κ 9.8 × 5 × 10 5 × 10 × ( 0.01 ) 3 1 × 10 6 × 2 × 10 6 2.5 × 10 3 .
This lies near Ra c 1708 for an ideal horizontal layer. However, the die structure partitions the melt into narrow channels, the 0.25 mm slit imposes extreme hydraulic resistance ( d 3 ), and vertical sidewalls provide additional viscous damping. The combined geometric confinement suppresses large-scale circulation.
Thermocapillary convection: The meniscus free surface is limited to ∼2 mm radial extent with Δ T men 5 K:
Ma = ( γ / T ) Δ T men L men μ κ 1 × 10 4 × 5 × 2 × 10 3 5 × 10 3 × 2 × 10 6 1 × 10 2 ,
two orders of magnitude below the oscillatory threshold ( Ma c 10 4 ) [14].
Forced convection: Pulling rate U pull 2.8 × 10 6 m/s through slit d = 0.25 mm:
Re = U pull d ν 2.8 × 10 6 × 2.5 × 10 4 1 × 10 6 7 × 10 4 ,
entirely negligible.
Numerical validation at three parameter extremes (nominal and max/min thermal drive) confirmed that, without flow, 30/30 samples converged (100%), whereas, with flow, only 21/30 converged (70%). The maximum stress difference was less than 1.5 MPa, and temperature differences were below 0.3 K. Removing flow modules enables 100% convergence across all 500 parametric samples.

2.5. Numerical Implementation

The model is implemented in COMSOL Multiphysics 6.2 using the Java API. Each parametric sample is constructed by loading a baseline template, redefining geometry parameters and physics settings, generating the computational mesh, solving with the fully coupled stationary Newton–Raphson solver (relative tolerance 1 × 10 6 , maximum 50 iterations, damping factor 0.8), and extracting field results. The mesh employs free triangular elements with automatic size calibration ( h auto parameter). Mesh independence was verified at three refinement levels (Table 3); σ max varies by less than 1% across refinements, and the peak location varies by less than 0.5 mm. h auto = 4 (∼15,000 elements) was selected as optimal.

2.6. Modeling Pipeline

Surrogate modeling (also known as metamodeling) constructs a computationally inexpensive mathematical approximation of a computationally expensive simulation model, enabling rapid sensitivity analysis and optimization without repeated finite element solves. In this work, a gradient boosting regressor [24] was trained on 500 COMSOL solutions to predict thermal stress as a function of input parameters.

LatinHypercube Sampling Design

A 500-sample Latin hypercube sampling (LHS) design [25] spans the 10-dimensional parameter space (Table 4). The sample size of 500 was selected because: (1) for 10 input parameters, this provides approximately 50 samples per dimension, sufficient for training tree-based models with R 2 > 0.95 ; (2) convergence analysis showed negligible performance improvement beyond 400 samples; and (3) the computational cost per COMSOL solve (∼3 s) made 500 solutions tractable within a single day.
  • Controllable process parameters (2): T heat (2073–2120 K) and T AH (1850–1950 K).
  • Material property uncertainty ranges (8): the elastic constants C 11 , C 13 , and C 33 and the CTE components α a , α b , and α c varied within ±20% of their experimental values; surface emissivity ε cry (0.45–0.65) and the Rosseland coefficient β R (2000–4000 m−1).
The ±20% range encompasses RUS measurement precision (2–5%), temperature softening (10–15%), and sample-to-sample variation. Material parameter ranges do not represent tunable design variables but quantify how irreducible input uncertainty propagates to predicted stress.

2.7. Model Training and Feature Importance

Four regression models were trained on the 500-sample dataset with an 80/20 train–test split (400 samples for training, 100 for testing): gradient boosting ( n estimators = 200 , max _ depth = 5 , learning rate = 0.05 ), XGBoost [26], random forest, and Gaussian process regression with a radial basis function (RBF) kernel κ ( x , x ) = σ 2 exp ( x x 2 / 2 2 ) . Gradient boosting attained a five-fold cross-validated (CV) R 2 = 0.952 ± 0.014 (mean absolute error, MAE = 11.3 MPa), comparable to XGBoost ( 0.957 ± 0.005 ) and higher than random forest ( 0.941 ± 0.006 ); it was used as the primary model for the sensitivity analysis and subsequent optimization. The importance ranking did not depend on this choice: repeating the permutation analysis with XGBoost reproduces the same ordering and the same importances to within 0.5 percentage points ( T AH 36.3%, C 33 35.0%, α c 15.9%, C 13 12.2%). The Gaussian process shows overfitting (MAE = 0.10 MPa, with the kernel length scales collapsed). Permutation importance was quantified on the held-out test set (20 repeats), normalized to 100%.

Model-Assisted Optimization

Random search over the gradient-boosting surrogate (10,000 iterations) identified parameter combinations minimizing σ max . Two scenarios were considered: (1) process-only: material properties fixed at nominal values, with only T heat and T AH varied; (2) all parameters free: all ten variables varied simultaneously, as realized by the 500-sample LHS ensemble. The optimal parameter set from scenario (1) was independently verified by constructing and solving a fresh COMSOL model.

3. Results

3.1. Thermal-Stress Field

Note. Two geometries are reported: the 2D plane-strain model (used for the surrogate; Figure 2) gives a nominal peak stress of σ max = 223 MPa at the crystal periphery and a nearly isothermal centerline, whereas the afterheater-free 3D axisymmetric validation (Section 4.7) yields σ max = 187 MPa. The axial temperature gradient ( 2073 1650 K) and the centerline ( 64 6 MPa) and radial ( 30 161 MPa) profiles quoted below are those of the 3D cylinder.
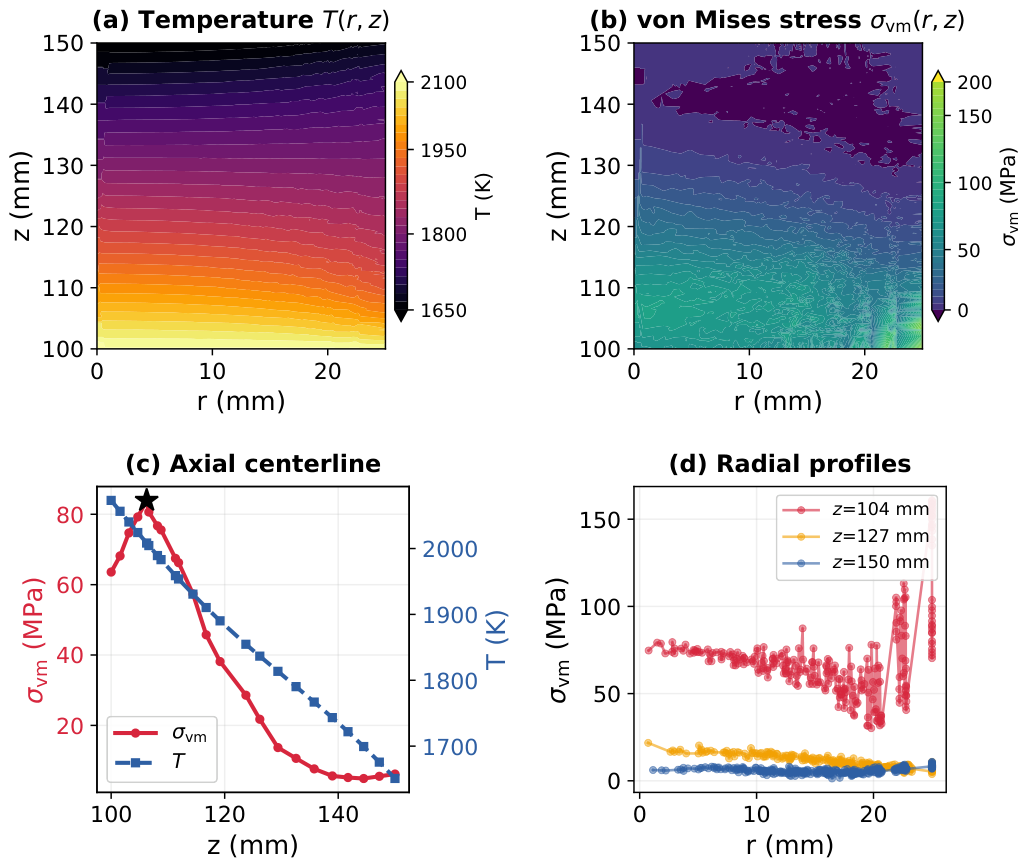
In the afterheater-free 3D model, the axial temperature decreases from 2073 K at the interface to ≈1650 K at the crystal top, corresponding to an average axial gradient of ≈84 K/cm ( Δ T 423 K over the 50 mm crystal). The von Mises stress reaches σ max = 187 MPa at the crystal periphery adjacent to the solid–liquid interface ( r 25 mm, z 104 mm), and decreases monotonically toward both the crystal center and the crystal top—the axial centerline stress falls from ≈64 MPa at the interface to ≈6 MPa at the top, while the radial stress at the crystal base increases from ≈30 MPa at the center to ≈161 MPa at the periphery. The peak stress is therefore governed by the radial, surface-cooling thermal gradient, which concentrates stress at the crystal periphery, consistent with the experimentally observed dislocation-density and crack distributions near the crystal periphery [18].
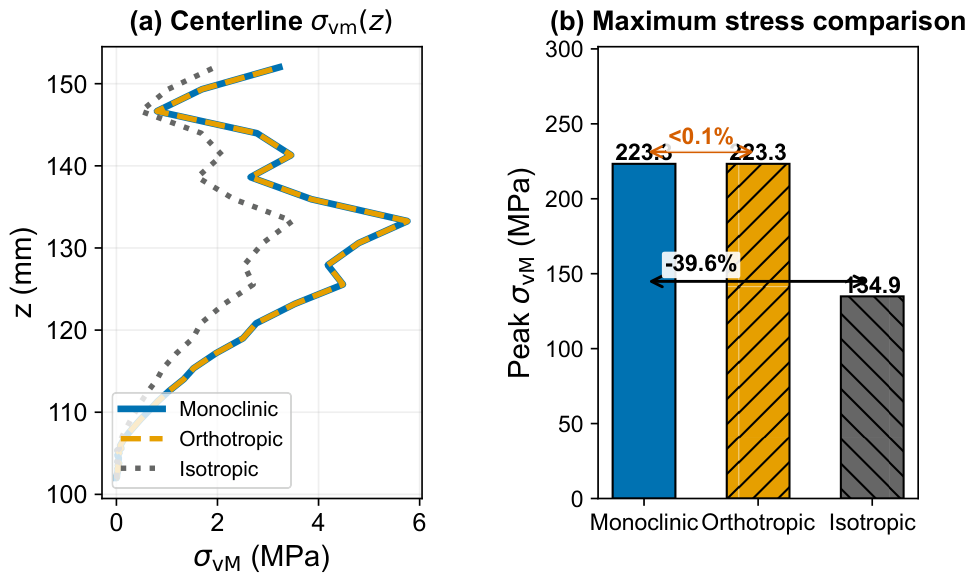
Comparison of anisotropic models (Figure 3) shows that the orthotropic and monoclinic models produce identical results to within numerical precision ( σ max = 223 MPa for both; <0.1% deviation). As a kinematic consequence of the plane-strain constraint, the out-of-plane shear strains ϵ 13 and ϵ 23 are identically zero, so the monoclinic coupling terms ( C 15 , C 25 , C 35 , C 46 ) do not contribute to the in-plane constitutive response. The isotropic model underestimates σ max by 39.6% (isotropic peak ≈ 135 MPa), confirming that directional anisotropy is essential for quantitatively accurate thermal-stress prediction.

3.2. Model Performance and Sensitivity

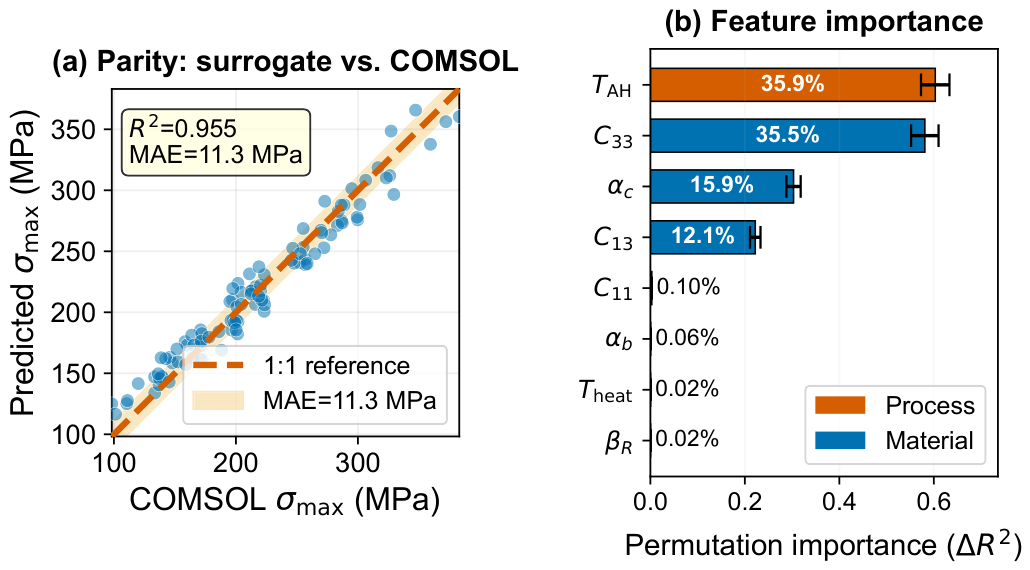
The gradient-boosting surrogate attained CV R 2 = 0.952 ± 0.014 (MAE = 11.3 MPa) (Figure 4a). Table 5 compares the four models. Three parameters account for 87.3% of the total permutation importance (Table 6; Figure 4b): T AH (35.9%), C 33 (35.5%), and α c (15.9%); the fourth-ranked C 13 (12.1%) reflects the enhanced ac Poisson coupling of the stiffness tensor adopted here. T heat shows negligible importance (<0.01%), a direct consequence of the fixed-interface boundary condition.

3.3. Optimization and Process Map

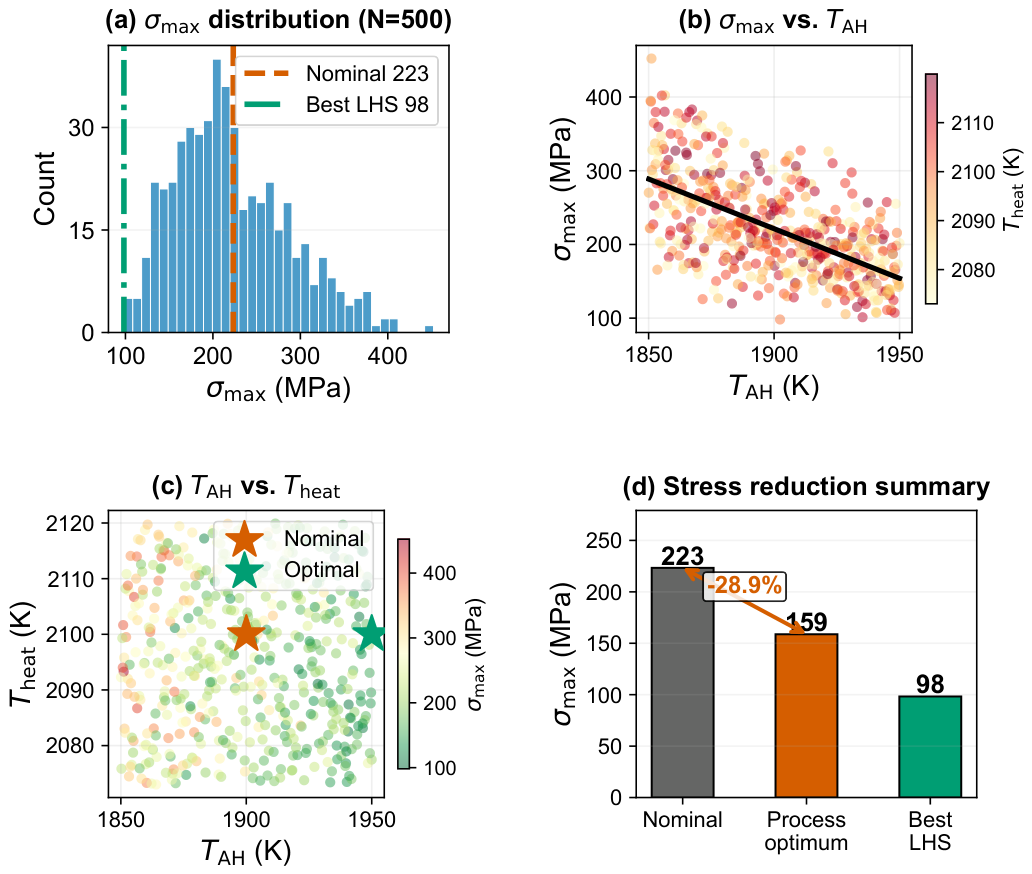
Process-only optimization: With material properties fixed at nominal values and only T AH and T heat varied, the surrogate identified T AH = 1950 K as the optimum. An independent COMSOL solve yielded σ max = 159 MPa (Figure 5d), representing a 28.9% reduction from the nominal 223 MPa (evaluated on the unrounded solver output, 223.3 158.8 MPa) under the fixed-interface assumption. This requires only adjustment of the afterheater power.
LHS sweep: The minimum σ max among the 500 LHS samples is 98.2 MPa, lower than the 159 MPa process-only optimum. This lower value was reached only through a favorable combination of material properties ( α c and C 33 near the lower ends of their uncertainty ranges), which is not accessible to process control; among the parameters that an operator can set, the 159 MPa optimum therefore remains the relevant target, and the gap between the two quantifies the portion of the attainable stress reduction that is dictated by material uncertainty rather than by process design. Note that the optimum T AH = 1950 K lies at the upper boundary of the sampled range; the surrogate should not be extrapolated beyond this value.

4. Discussion

4.1. Physical Interpretation of the Sensitivity Hierarchy

The sensitivity hierarchy ( T AH C 33 > α c other factors) reflects the stress scaling σ C · α · Δ T . The afterheater temperature T AH controls the net radiative heat loss (35.9% permutation importance): raising T AH from 1900 to 1950 K reduces the net radiative heat loss from the crystal lateral surface and flattens the axial temperature distribution, representing a trade-off between the 28.9% stress reduction and a reduced pull rate, since the vertical temperature gradient governs the stable growth regime [27]. The elastic constant C 33 (35.5%) is nearly as influential as T AH under the plane-strain assumption because c-axis expansion is fully suppressed ( ϵ c c = 0 ), generating compressive stress proportional to C 33 ; the ±20% uncertainty propagates to ∼±30 MPa in σ max . The c-axis CTE α c (15.9%) is 2.5× larger than the a-axis value, and under plane-strain suppression, it is fully converted into elastic stress. The key insight is that T AH is the only controllable parameter among the leading factors, whereas C 33 and α c are intrinsic material constants that together contribute a comparable fraction of the variance—identifying high-temperature property measurements as a key priority for reducing predictive uncertainty.
The spatial distribution of stress is governed by the radial surface-cooling gradient and the geometric constraint at the crystal periphery rather than by the axial-gradient magnitude alone. Along the centerline, the temperature falls monotonically from ≈2073 K at the interface to ≈1650 K at the top (≈84 K/cm) in the 3D model (the 2D plane-strain centerline is nearly isothermal at ∼2073 K), yet the peak stress localizes at the crystal periphery near the solid–liquid interface (Figure 2), where the radial temperature gradient is steepest (the crystal side radiates to the cooler afterheater) and the die–crystal transition imposes a multi-axial thermal-strain mismatch that cannot relax—consistent with the general expectation that stress formation in crystal growth is associated with the spatial non-uniformity of the thermal field rather than with the gradient magnitude alone [27]. Physically, a uniform gradient produces uniform thermal strain that relaxes freely, whereas non-uniformity (curvature) and constrained boundaries introduce differential, non-relaxable thermal strain, which the elastic constraint converts into stress.

4.2. Implications for EFG Process Engineering

The simulation analysis identifies afterheater optimization as the primary process control: raising T AH to 1950 K achieves a 28.9% stress reduction (223 → 159 MPa, COMSOL-verified). At ∼0.72 T m , Ir ( T m , Ir = 2719 K), iridium component degradation (recrystallization, creep) must be considered; industrial practice typically limits iridium components below 1900 K for prolonged operation [28]. The 1950 K optimum therefore indicates the direction and magnitude of the available gain rather than a directly implementable setpoint. In the present model, T AH acts through the net radiative loss from the crystal lateral surface, so a similar reduction may be pursued within the iridium limit by lowering that loss through improved afterheater insulation or radiation shielding, subject to the same trade-off against pull rate discussed above. Crucible heating is largely decoupled under the fixed-interface assumption, with T heat showing negligible importance. The anisotropic description changes engineering decisions in a specific and quantifiable way. Under nominal conditions, an isotropic model returns σ max 135 MPa against the 223 MPa of the anisotropic model (Figure 3); an engineer relying on the isotropic value would place the crystal in the lower half of the experimentally reported residual-stress range (10–300 MPa) [15] and would have little reason to raise the afterheater temperature, whereas the anisotropic model identifies a 28.9% stress reduction available from precisely that adjustment. The distinction between the orthotropic and monoclinic descriptions, by contrast, changes no decision in the present 2D plane-strain setting, where the two are exactly equivalent; the monoclinic terms become decision-relevant only in three-dimensional or non-axisymmetric configurations, in which σ y z is non-zero and slip-system-resolved shear stresses—rather than the von Mises magnitude alone—can be compared against critical resolved shear stresses (Section 4.5). The plane-strain constraint amplifies the out-of-plane (c-axis) contribution relative to the 3D cylindrical geometry (by an estimated 10–20% [14]); in 3D cylindrical boules, this amplification is attenuated by the circumferential stress relief.

4.3. Limitations and Uncertainty Quantification

Key limitations include the following: (1) the fixed-interface boundary condition makes T heat importance negligible (<0.01%); under self-consistent tracking, 5–15% dependence may emerge; (2) the 2D plane-strain formulation overestimates the stress by an estimated 10–20% relative to the 3D cylindrical geometry and amplifies the out-of-plane (c-axis) contribution [14]; (3) the use of a diagonal CTE tensor is formally inconsistent with the 21-component stiffness matrix ( α 13 could modify predictions at 5–15%); (4) melt convection validation at three points does not explore β R or ε cry variation; (5) ∼50 samples in the upper T AH quartile may be insufficient for boundary predictions (partially mitigated by COMSOL verification at 1950 K); (6) semi-empirical dislocation estimates carry an uncertainty of approximately ±one order of magnitude; (7) uniform ±20% parameter ranges are a simplification (the ranking is robust to factor-of-two variations); and (8) crystal rotation, T 4 -to-ambient radiation masking, and thermophysical property uncertainty (∼one order of magnitude at ∼2100 K) are not captured.

4.4. Comparison with Experimental Data

The predicted stress concentration at the crystal periphery and the peak stress of the afterheater-free 3D model ( σ max = 187 MPa) are qualitatively consistent with available experimental data. Mu et al. [15] reported Raman-measured residual stresses of 10–300 MPa; the predicted peak stresses under nominal and optimized process conditions fall within this range. The upper end of the full 500-sample LHS range (452.2 MPa, Table 7) arises only from worst-case combinations of the ±20% material-property uncertainties ( C 33 and α c simultaneously at their extremes), which are unlikely to be realized simultaneously in a single grown crystal. Elevated EPD values ( 10 3 10 5 cm−2) have been reported near the seed–crystal interface [6], consistent with the predicted stress concentration location. The 3D simulations are consistent with this picture: the predicted N d falls entirely within the experimental EPD range when d T / d z = 84.4 K/cm. The spatially resolved experimental data available for EFG-grown β-Ga2O3 are defect maps—etch-pit density and crack locations—rather than stress maps, so the spatial comparison is necessarily made against defect locations. Direct quantitative validation would further require time-dependent cooling simulations and systematic 3D parametric studies. Consequently, the present comparison is qualitative at the level of stress magnitude and location rather than a point-by-point validation; a quantitative spatially resolved comparison against measured stress maps remains an important experimental need for this material.

4.5. Temperature-Dependent Elastic Properties and Slip-System Analysis

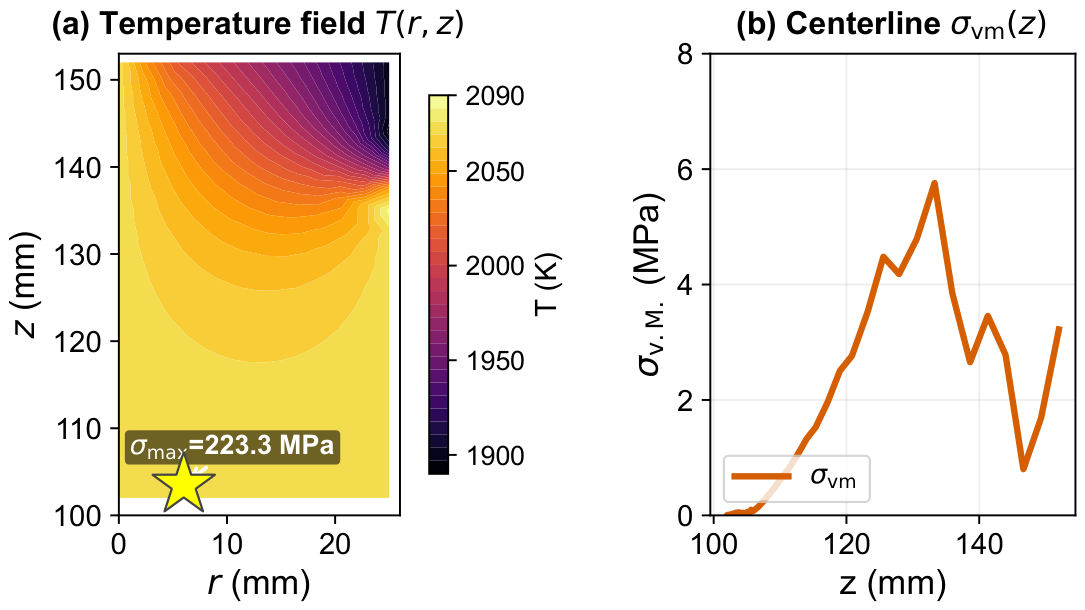
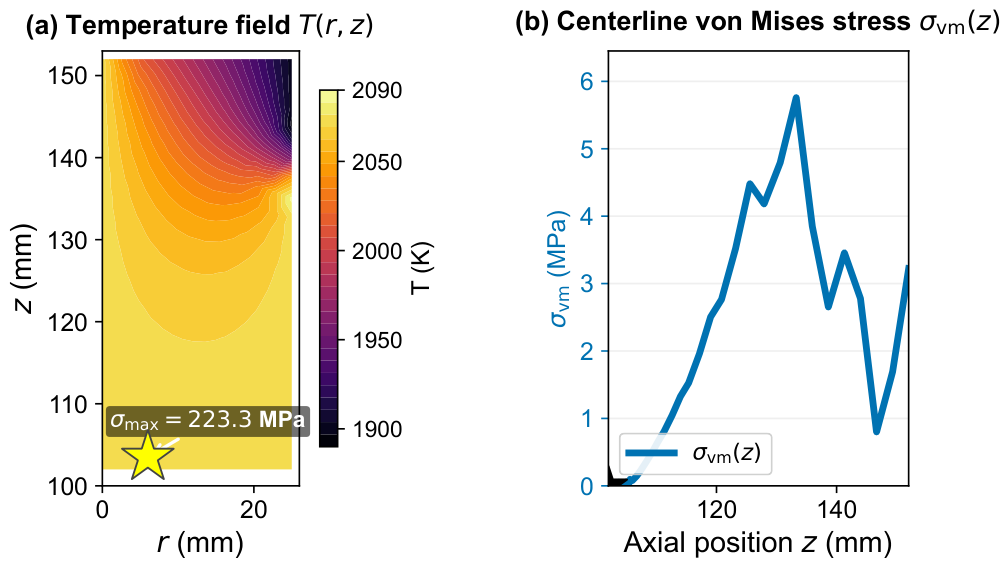
The sensitivity analysis identifies C 33 as the second most influential parameter (35.5%) based on room-temperature RUS measurements [21], which remain the only complete set available for monoclinic β-Ga2O3; no complete high-temperature stiffness tensor has been measured. Because elastic constants soften with increasing temperature, the room-temperature values provide a conservative upper bound on the thermal stress: any high-temperature softening would be expected to reduce σ max downward, so the reported peak stress is unlikely to be underestimated by this approximation. Liu et al. [29] measured Young’s modulus up to 600 °C and found only a ∼4% reduction (186 → 179 GPa), whereas hardness decreased by ∼37%. Since 600 °C lies far below the growth temperature ( T m = 2073 K), this 4% value is a lower bound on the softening expected near the melting point; a stronger softening would still reduce σ max monotonically and is not expected to reorder the hierarchy, because the ranking T AH > C 33 > α c is set by the physical mechanisms (radiative-loss control, plane-strain suppression of the c-axis, thermal-strain conversion) rather than by the absolute magnitude of the constants. The ±20% material-uncertainty range in the LHS is therefore wide enough to encompass this extrapolation conservatively, and the absolute peak-stress magnitude carries a corresponding systematic uncertainty, namely a plausible 10–30% overestimate at the growth temperature, that is acknowledged among the limitations. The Arrhenius factor exp ( E a / k B T ) with E a = 0.801 eV [30] quantifies thermal activation of dislocation motion; the temperature field and the centerline stress profile that enter this factor are shown in Figure 6.
Regarding the limitation of the von Mises stress for describing dislocation generation, the primary slip system in (100)-oriented β-Ga2O3 has been recently confirmed as 010 / { 001 } , that is, slip along 010 on { 001 } planes) with Burgers vector b = 010 [30,31]. Wu et al. [32] further identified secondary slip systems, including ( 002 ) 100 , ( 310 ) 001 , and ( 3 ¯ 10 ) 001 . For this primary slip system in the present coordinate convention (face normal n     [ 001 ] , slip direction d     [ 010 ] ), the resolved shear stress (RSS) is τ RSS = σ y z . In the 2D plane-strain formulation, the shear stress component σ y z is identically zero because the slip-plane normal [ 001 ] coincides with the out-of-plane direction ( y     c ) of the plane-strain model—this is a fundamental physical limitation of the 2D model, not a numerical artifact. The same applies to every reported slip system: the secondary systems ( 002 ) 100 (plane normal     [ 001 ] ) and ( 310 ) 001 , ( 3 ¯ 10 ) 001 (slip direction     [ 001 ] ) each involve the out-of-plane c-axis in either the plane normal or the slip direction, so their resolved shear stresses also vanish identically in the 2D plane-strain formulation. Nevertheless, a rigorous upper-bound argument applies: for any slip system in any stress state, τ RSS = σ : ( n d ) dev σ vm / 3 , where the equality holds for the maximum resolved shear stress across all slip systems [32]. A direct comparison of τ RSS against the critical resolved shear stress (CRSS) on each slip system requires both (a) 3D stress fields with non-zero σ y z components and (b) experimentally determined CRSS values for each slip system. The dislocation velocity framework established by Liu et al. [30], v = v 0 ( τ / τ 0 ) m exp ( E a / k B T ) with E a = 0.801 eV, demonstrates that the stress field determines the spatial pattern of dislocation activity even when absolute CRSS thresholds are unavailable. The dislocation activity accordingly concentrates near the solid–liquid interface, where both the von Mises stress and the temperature reach their maxima. In summary, the present von Mises–based dislocation estimates should be interpreted as conservative upper bounds: the true RSS on any given slip system cannot exceed σ vm / 3 , and the overall magnitude of the dislocation driving force is bounded from above. However, the spatial pattern of dislocation activity on individual slip systems in monoclinic β-Ga2O3 requires 3D stress fields with non-zero σ y z components and cannot be deduced from the 2D σ vm field alone.

4.6. Comparison with Prior Work

To the author’s knowledge, this is the first study to (1) employ the full 21-component monoclinic stiffness matrix in an EFG β-Ga2O3 thermal stress model; (2) rigorously show, as an exact kinematic theorem, that the orthotropic approximation is exact in 2D plane-strain, thereby showing that the 2D plane-strain results of prior orthotropic EFG analyses are unaffected by these terms; (3) provide a combined dimensionless and numerical justification for neglecting melt convection; (4) achieve 100% solver convergence across a 500-sample parametric study; and (5) quantitatively decompose stress variance into process-controllable (35.9%) and material-uncertainty-limited (64.1%) contributions.

4.7. Preliminary Three-Dimensional Axisymmetric Validation

To assess the limitations of the 2D plane-strain assumption, a series of 3D axisymmetric COMSOL simulations was performed using the Java API. These models incorporate the full 21-component stiffness matrix, temperature-dependent anisotropic thermal conductivity (Klimm 2023 [20]), and a 3-domain geometry (crystal, crucible, afterheater). The simulations serve as a consistency check rather than a comprehensive parametric study.
3D with afterheater ( T AH = 1700 K): The baseline 3D model yields σ max = 40.3 MPa, σ mean = 13.9 MPa, and an axial gradient d T / d z = 34.5 K/cm across the crystal, with T min = 1901 K at the top surface and T iface = 2073 K at the solid–liquid interface. The spatial stress distribution exhibits the same qualitative pattern as the afterheater-free case—peak stress at the crystal periphery near the interface, monotonically decreasing toward both the center and the crystal top—though at reduced magnitude due to the shallower thermal gradient. The predicted von Mises stress lies well within the experimental Raman stress range (10–300 MPa) [15]. The dislocation density estimate ( N d , max 1.6 × 10 3 cm−2, N d , mean 244 cm−2) straddles the lower end of the experimental EPD range ( 10 3 10 5 cm−2) [6], with the maximum inside the range and the mean below it, which is physically reasonable for the constant T AH approximation.
3D without afterheater (enhanced gradient): Removing the afterheater increases the axial gradient to d T / d z = 84.4 K/cm, entering the literature range for EFG growth (50–150 K/cm) [10]. The peak stress rises to σ max = 187.2 MPa under a fixed seed constraint, with σ mean = 26.3 MPa. COMSOL point evaluations confirm the spatial stress distribution: at the crystal top surface ( z = 152 mm), σ vm ranges from ∼6 MPa at the center ( r = 0 ) to ∼11 MPa at the periphery ( r = 25 mm), while the peak stress of 187.2 MPa occurs at the crystal periphery near the solid–liquid interface ( z 104 mm) (Figure 7). The stress therefore decreases monotonically toward both the crystal center and the crystal top, consistent with the steepening thermal gradient toward the interface and the surface thermal gradients imposed by radiation to the cooler ambient enclosure. Crucially, the predicted dislocation density ( N d , mean = 1.4 × 10 3 cm−2, N d , max = 3.5 × 10 4 cm−2) falls entirely within the experimental EPD range ( 10 3 10 5 cm−2) [6], the only configuration considered here for which both the mean and maximum N d lie within the experimental EPD range. Refinement to a fine mesh (62 k elements) yields consistent results ( σ mean = 8.9 MPa, N d , max = 1.3 × 10 3 cm−2), confirming mesh independence.
Comparison with 2D plane-strain: The three configurations differ in both dimensionality and afterheater condition, so the comparison below is indicative rather than a controlled measurement of the plane-strain effect. The 2D plane-strain baseline (223 MPa at T AH = 1900 K) exceeds the afterheater-free 3D result (187.2 MPa) by ∼19%, which is of the same order as the 10–20% plane-strain amplification estimated by Miller et al. [14]; the 3D case with an afterheater at 1700 K yields 40.3 MPa, a difference dominated by its much shallower axial gradient (34.5 versus 84.4 K/cm) rather than by dimensionality; the out-of-plane (circumferential) stress relief available in a cylindrical geometry also contributes. A controlled 2D-versus-3D comparison at identical boundary conditions is left to future work. The spatial stress pattern, namely peak stress at the crystal periphery near the interface and monotonically decreasing stress toward both the center and the top, is qualitatively preserved across both the 2D and 3D geometries, indicating that the 2D model captures the correct stress distribution shape despite the conservative absolute magnitudes. The relative stress reduction from process optimization (raising T AH ) is also qualitatively preserved across both geometries. A quantitative mapping between 2D and 3D stress levels requires systematic calibration beyond the scope of this work.
These 3D results serve two purposes: they demonstrate that the 2D plane-strain model does not qualitatively misrepresent the stress distribution, and they establish a baseline for future 3D surrogate modeling. The computational cost per 3D solve (∼16 s for the fine mesh) remains tractable for a moderate parametric study, suggesting that a 3D extension of the LHS-GBM framework is feasible.

5. Conclusions

This work establishes a computational framework for anisotropic thermo-elastic modeling of EFG-grown β-Ga2O3. The full 21-component monoclinic stiffness matrix is implemented for the first time in this growth method with an explicit crystal-to-model coordinate mapping; the orthotropic approximation is rigorously shown to be exact in 2D plane-strain as a kinematic theorem, thereby showing that the 2D plane-strain results of prior orthotropic EFG analyses are unaffected by these terms, while the monoclinic formulation supplies the foundation for future 3D studies, where the shear–normal coupling terms become active. A combined dimensionless and numerical argument supports the neglect of melt convection, enabling 100% solver convergence across 500 Latin hypercube samples. The surrogate-based sensitivity analysis identifies the afterheater temperature T AH as the leading controllable factor (35.9%), nearly tied with the elastic constant C 33 (35.5%) and followed by the CTE component α c (15.9%); for the 2D plane-strain baseline that anchors the surrogate analysis ( σ max = 223 MPa), elevating T AH from 1900 K to 1950 K reduces the peak stress by ∼29%, while the afterheater-free three-dimensional model places the peak at σ max = 187 MPa at the crystal periphery (Section 4.7). These results provide actionable guidance for process engineers and identify high-temperature c-axis property measurements as a priority experimental need.

Funding

This research received no external funding.

Institutional Review Board Statement

Not applicable.

Informed Consent Statement

Not applicable.

Data Availability Statement

The COMSOL model template, Python 3.9 scripts, and the 500-sample LHS dataset are available from the corresponding author upon reasonable request.

Conflicts of Interest

The author declares no conflicts of interest.

Abbreviations

EFGEdge-Defined Film-Fed Growth
CZCzochralski
OFZOptical Floating Zone
VBVertical Bridgman
HRXRDHigh-Resolution X-ray Diffraction
FWHMFull Width at Half Maximum
RMSRoot Mean Square
LHSLatin Hypercube Sampling
RUSResonant Ultrasound Spectroscopy
CTECoefficient of Thermal Expansion
CRSSCritical Resolved Shear Stress
EPDEtch-Pit Density
RSSResolved Shear Stress
MAEMean Absolute Error
CVCross-Validation
RBFRadial Basis Function

References

  1. Higashiwaki, M. β-Ga2O3 material properties, growth technologies, and devices: A review. AAPPS Bull. 2022, 32, 3. [Google Scholar] [CrossRef] [Scilit]
  2. Kuramata, A.; Koshi, K.; Watanabe, S.; Yamaoka, Y.; Masui, T.; Yamakoshi, S. High-quality β-Ga2O3 single crystals grown by edge-defined film-fed growth. Jpn. J. Appl. Phys. 2016, 55, 1202A2. [Google Scholar] [CrossRef] [Scilit]
  3. Feng, G.; Li, S.; Tian, Y.; Qi, S.; Guo, D.; Tang, W. 2 in. bulk β-Ga2O3 single crystals grown by EFG method with high wafer-scale quality. ACS Omega 2024, 9, 22084–22089. [Google Scholar] [CrossRef] [Scilit] [PubMed]
  4. Igarashi, T.; Ueda, Y.; Koshi, K.; Sakaguchi, R.; Watanabe, S.; Yamakoshi, S.; Kuramata, A. Growth of 6 inch diameter β-Ga2O3 crystal by the vertical Bridgman method. Phys. Status Solidi B 2025, 262, 2400444. [Google Scholar] [CrossRef] [Scilit]
  5. Wu, D.; Xia, N.; Ma, K.; Wang, J.; Li, C.; Jin, Z.; Zhang, H.; Yang, D. Numerical simulation of β-Ga2O3 single crystal growth by Czochralski method with an insulation lid. Crystals 2022, 12, 1715. [Google Scholar] [CrossRef] [Scilit]
  6. Yao, Y.; Ishikawa, Y.; Sugawara, Y. Revelation of dislocations in β-Ga2O3 substrates grown by edge-defined film-fed growth. Phys. Status Solidi A 2020, 217, 1900630. [Google Scholar] [CrossRef] [Scilit]
  7. Yan, Y.; Wu, D.; Xia, N.; Deng, T.; Zhang, H.; Yang, D. Anisotropic thermal expansion tensor of β-Ga2O3 and its critical role in casting-grown crystal cracking. Appl. Phys. Lett. 2024, 124, 122102. [Google Scholar] [CrossRef] [Scilit]
  8. Wang, J.; Li, Z.; Qi, C.; Liu, L. 3D numerical modeling and simulation of β-Ga2O3 crystal growth by edge-defined film-fed growth method. J. Vac. Sci. Technol. A 2025, 43, 013202. [Google Scholar] [CrossRef] [Scilit]
  9. Yin, C.; Meng, B.; Zhao, S.; Yan, Y.; Wang, Q.; Wu, G.; Liang, K.; Li, Z.; Jia, Z.; Wei, Q.; et al. Multiphysical field full-process simulation of gallium oxide with EFG approach. J. Am. Ceram. Soc. 2025, 108, e20421. [Google Scholar] [CrossRef] [Scilit]
  10. Jeong, W.H.; Choi, S.M.; Lim, S.M.; Shin, Y.J.; Bae, S.Y.; Kang, J.-K.; Lee, W.-J.; Kwon, S.-H.; Jeong, S.-M. Influence of active afterheater in the crystal growth of gallium oxide via edge-defined film-fed growing method. Crystals 2023, 13, 1591. [Google Scholar] [CrossRef] [Scilit]
  11. Stelian, C.; Muzy, J.; Labor, S.; Fivel, M.; Cabane, H.; Duffar, T. Numerical analysis of thermal stress in semi-transparent oxide crystals grown by Czochralski and EFG methods. Cryst. Res. Technol. 2018, 54, 1800219. [Google Scholar] [CrossRef] [Scilit]
  12. Yin, C.; Wan, X.; Yu, W.; Lu, Y.; Feng, J.; Liu, T.; Zhao, S.; Liang, K.; Wei, Q.; Guo, Y. Explainable analysis and optimization of the thermal field in gallium oxide single crystal growth based on machine learning. Cryst. Growth Des. 2026, 26, 1197–1209. [Google Scholar] [CrossRef] [Scilit]
  13. Kutsukake, K. Review of machine learning applications for crystal growth research. J. Cryst. Growth 2024, 630, 127598. [Google Scholar] [CrossRef] [Scilit]
  14. Miller, W.; Böttcher, K.; Galazka, Z.; Schreuer, J. Numerical modelling of the Czochralski growth of β-Ga2O3. Crystals 2017, 7, 26. [Google Scholar] [CrossRef] [Scilit]
  15. Mu, W.; Jia, Z.; Yin, Y.; Hu, Q.; Li, Y.; Wu, B.; Zhang, J.; Tao, X. High-quality crystal growth and anisotropic physical characterization of β-Ga2O3 single crystals grown by EFG method. J. Alloys Compd. 2017, 714, 453–458. [Google Scholar] [CrossRef] [Scilit]
  16. Yao, Y.; Ishikawa, Y.; Sugawara, Y. X-ray diffraction and Raman characterization of β-Ga2O3 single crystal grown by edge-defined film-fed growth method. J. Appl. Phys. 2019, 126, 205106. [Google Scholar] [CrossRef] [Scilit]
  17. Haven, D.; Moutinho, H.; Mangum, J.; Guthrey, H.; Joyce, D.; Zakutayev, A.; Haegel, N.M. Multimodal microscopy of extended defects in β-Ga2O3 (010) EFG crystals. AIP Adv. 2023, 13, 075122. [Google Scholar] [CrossRef] [Scilit]
  18. Li, P.; Bu, Y.; Chen, D.; Sai, Q.; Qi, H. Investigation of the crack extending downward along the seed of the β-Ga2O3 crystal grown by the EFG method. CrystEngComm 2021, 23, 6300–6306. [Google Scholar] [CrossRef] [Scilit]
  19. Wang, X.; Chang, X.; Wang, P.; Yang, X.; Yuan, L. Research progress and prospect of the bulk single crystal growth of β-Ga2O3: From 1964 to 2024. Cryst. Res. Technol. 2025, 60, 2400255. [Google Scholar] [CrossRef] [Scilit]
  20. Klimm, D.; Amgalan, B.; Ganschow, S.; Kwasniewski, A.; Galazka, Z.; Bickermann, M. The thermal conductivity tensor of β-Ga2O3 from 300 to 1275 K. Cryst. Res. Technol. 2023, 58, 2200204. [Google Scholar] [CrossRef] [Scilit]
  21. Adachi, K.; Ogi, H.; Takeuchi, N.; Nakamura, N.; Watanabe, H.; Ito, T.; Ozaki, Y. Unusual elasticity of monoclinic β-Ga2O3. J. Appl. Phys. 2018, 124, 085102. [Google Scholar] [CrossRef] [Scilit]
  22. Grundmann, M. The principal axes systems for the elastic properties of monoclinic gallia. Sci. Rep. 2020, 10, 19486. [Google Scholar] [CrossRef] [Scilit] [PubMed]
  23. Poncé, S.; Giustino, F. Structural, electronic, elastic, power, and transport properties of β-Ga2O3 from first principles. Phys. Rev. Res. 2020, 2, 033102. [Google Scholar] [CrossRef] [Scilit]
  24. Friedman, J. Greedy function approximation: A gradient boosting machine. Ann. Stat. 2001, 29, 1189–1232. [Google Scholar] [CrossRef] [Scilit]
  25. McKay, M.; Beckman, R.; Conover, W. A comparison of three methods for selecting values of input variables in the analysis of output from a computer code. Technometrics 1979, 21, 239–245. [Google Scholar] [CrossRef] [Scilit]
  26. Chen, T.; Guestrin, C. XGBoost: A scalable tree boosting system. In Proceedings of the 22nd ACM SIGKDD International Conference on Knowledge Discovery and Data Mining, San Francisco, CA, USA, 13–17 August 2016; pp. 785–794. [Google Scholar] [CrossRef] [Scilit]
  27. Epure, S.; Braescu, L.; Balint, S. Modeling the effects of the vertical temperature gradient in the furnace in an edge-defined film-fed growth technique. Mater. Sci. Eng. B 2006, 134, 277–281. [Google Scholar] [CrossRef] [Scilit]
  28. Galazka, Z. Growth of bulk β-Ga2O3 single crystals by the Czochralski method. J. Appl. Phys. 2022, 131, 031103. [Google Scholar] [CrossRef] [Scilit]
  29. Liu, D.; Yan, Y.; Bi, Y.; Gao, X.; Zhu, Q.; Liu, Y.; Wu, D.; Jin, Z.; Xia, N.; Zhang, H.; et al. Temperature effects on anisotropic mechanical properties of cast-grown β-Ga2O3. J. Appl. Phys. 2025, 137, 125702. [Google Scholar] [CrossRef] [Scilit]
  30. Liu, D.; Wu, D.; Gao, X.; Bi, Y.; Yan, Y.; Liu, Y.; Jin, Z.; Xia, N.; Zhang, H.; Yang, D. Investigation of dislocation mobility on the cast-grown β-Ga2O3:(100) by nanoindentation. J. Alloys Compd. 2025, 1048, 185317. [Google Scholar] [CrossRef] [Scilit]
  31. Wu, D.; Yan, Y.; Sun, X.; Gao, X.; Liu, D.; Liu, Y.; Jin, Z.; Xia, N.; Zhang, H.; Yang, D. Characterization of dislocations in ( 3 ¯ 10) β-Ga2O3 single crystal grown by the casting method. J. Alloys Compd. 2025, 1018, 179092. [Google Scholar] [CrossRef] [Scilit]
  32. Wu, Y.; Rao, Q.; Best, J.; Mu, D.; Xu, X.; Huang, H. Superior room temperature compressive plasticity of submicron beta-phase gallium oxide single crystals. Adv. Funct. Mater. 2022, 32, 2207960. [Google Scholar] [CrossRef] [Scilit]
Figure 1. EFG 2D planar half-model: geometry, boundary conditions, and crystal axes mapping. Boundary conditions: solid red ( T heat ), dashed orange ( T AH ), dash-dot blue (radiation + convection), dotted green ( T m ). Domains: crucible (Ir), melt pool (β-Ga2O3), die (Ir), capillary slit, meniscus, crystal, afterheater. Crystal axes: r     a [100], z     b [010], y     c [001] (monoclinic C 2 / m ).
Crystals 16 00558 g001
Figure 2. Thermal-stress field at nominal conditions. (a) Temperature field on the crystal (the peak von Mises stress of σ max = 223 MPa occurs at the crystal periphery near the solid–liquid interface). (b) Centerline von Mises stress σ vm ( z ) : in the 2D plane-strain model σ vm stays below ∼6 MPa along the centerline (the peak 223 MPa is reached at the crystal periphery).
Crystals 16 00558 g002
Figure 3. Anisotropic model comparison. (a) Centerline profiles: the monoclinic and orthotropic curves are indistinguishable (<0.1%). (b) Peak stress comparison: the isotropic model underestimates the peak stress by 39.6%.
Crystals 16 00558 g003
Figure 4. Model validation and feature importance. (a) Parity plot ( R 2 = 0.955 , MAE = 11.3 MPa). (b) Permutation feature importance.
Crystals 16 00558 g004
Figure 5. Stress distribution and optimization. (a) Histogram of σ max across 500 Latin hypercube samples, showing a right-skewed distribution centered near ∼221 MPa. (b) σ max vs. T AH over the sampled range (1850–1950 K): a monotonic decrease ( Δ σ / Δ T AH 1.29 MPa/K between the two COMSOL-verified endpoints at 1900 K and 1950 K), supporting T AH as the dominant controllable stress-reduction parameter. (c) Process map of the 500 samples in the ( T heat , T AH ) plane, colored by σ max , with the nominal and optimized operating points marked. (d) Scenario comparison: the combined optimization ( T AH = 1950 K, T heat = 2100 K) achieves σ max = 159 MPa (28.9% reduction from baseline).
Crystals 16 00558 g005
Figure 6. Thermal activation of dislocation mobility. (a) Temperature field T ( r , z ) across the crystal, hottest at the solid–liquid interface ( z 102 mm, T 2073 K) and cooling toward both the crystal top and periphery. (b) Centerline von Mises stress σ vm ( z ) (blue): it stays below ≈6 MPa along the centerline, whereas the field maximum is 223 MPa at the crystal periphery. Dislocation activity is therefore stress-dominated and concentrates near the interface, where both σ vm and T are maximal.
Crystals 16 00558 g006
Figure 7. Spatial distribution of temperature and von Mises stress in the crystal (3D axisymmetric model). (a) Temperature field T ( r , z ) ; (b) von Mises stress σ vm ( r , z ) , with the peak (187.2 MPa) at the crystal periphery near the solid–liquid interface; (c) axial centerline σ vm ( z ) and T ( z ) , with T decreasing from 2073 K to ∼1650 K (84.4 K/cm); (d) radial σ vm ( r ) at three axial stations, increasing from ∼30 MPa at the center to ∼161 MPa at the periphery.
Crystals 16 00558 g007
Table 1. Comparison of recent numerical studies on β-Ga2O3 crystal growth.
Ref.MethodDim.AnisotropyMLKey Focus
Yin 2025 [9]EFG2DIso.Full-process simulation
Wang 2025 [8]EFG3DOrtho.Dynamic interface tracking
Jeong 2023 [10]EFG2DIso.Afterheater effect
Stelian 2018 [11]CZ/EFG2DIso.Thermal stress comparison
Miller 2017 [14]CZ2DIso.Elastic & thermal props.
Yin 2026 [12]EFG2DIso.CatBoostExplainable optimization
This workEFG2D + 3DMono.Gradient boostingFull 21-comp. stiffness + surrogate
Table 2. Geometric parameters of the EFG model.
ParameterValueDescription
r cruc 38 mmCrucible inner radius
t cruc 2 mmCrucible wall thickness
h cruc 120 mmCrucible height
w slit 0.25 mmCapillary slit half-width
t die 1.5 mmDie thickness
h die 80 mmDie height
w cry 25 mmCrystal half-width
h cry 50 mmCrystal height
h men 2 mmMeniscus height
z die 0 20 mmDie base elevation
h AH 40 mmAfterheater height
Table 3. Mesh convergence study.
Mesh h auto Elements σ max (MPa)Rel. Error
Coarse5∼9500223.0−0.13%
Medium4∼15,000223.3(reference)
Fine3∼22,000224.1+0.36%
Table 4. Parameter ranges for LHS.
ParameterLowerUpperNominalType
T heat (K)207321202100Process
T AH (K)185019501900Process
α c ( 10 6 K−1)4.26.45.3Material
α a ( 10 6 K−1)1.72.52.1Material
α b ( 10 6 K−1)3.04.43.7Material
C 13 (GPa)128.0192.0160.0Material
C 33 (GPa)277.9416.9347.4Material
C 11 (GPa)218.5267.1242.8Material
ε cry 0.450.650.55Material
β R (m−1)200040003000Material
Table 5. Model performance.
Model R 2 (Test)MAE (MPa)CV R 2 (5-Fold)
Gradient Boosting0.95511.3 0.952 ± 0.014
XGBoost0.9686.72 0.957 ± 0.005
Random Forest0.9478.40 0.941 ± 0.006
Gaussian Process0.999990.10N/A a
a Not cross-validated due to O ( n 3 ) scaling; overfitting indicated.
Table 6. Permutation feature importance (2D plane-strain geometry), evaluated on the held-out test set and normalized to 100%.
RankParameterNormalized Importance (%)Type
1 T AH 35.9Process
2 C 33 35.5Material
3 α c 15.9Material
4 C 13 12.1Material
5 C 11 0.1Material
6–10Others< 0.1
Table 7. Optimization results.
ParameterBest LHS SampleNominalNote
Process parameters
T AH (K)19021900Mid-range
T heat (K)20992100Mid-range
Material parameters
α c ( 10 6 K−1)4.315.3Near lower bound
C 33 (GPa)289.1347.4Near lower bound
C 13 (GPa)187.8160.0Near upper bound
OutcomeValue
Nominal σ max 223 MPa
Process optimum (COMSOL-verified)159 MPa (up to 28.9% reduction)
Best LHS sample98.2 MPa
σ max range98.2–452.2 MPa
Disclaimer/Publisher’s Note: The statements, opinions and data contained in all publications are solely those of the individual author(s) and contributor(s) and not of MDPI and/or the editor(s). MDPI and/or the editor(s) disclaim responsibility for any injury to people or property resulting from any ideas, methods, instructions or products referred to in the content.