1. Introduction
Casting simulation software has become essential for aluminum foundries to optimize die designs and process parameters, and to predict defects [
1,
2,
3,
4,
5]. However, these tools face a critical challenge: existing material databases lack essential solidification parameters, such as dendrite coherency and rigidity points [
4]. The MAGMASOFT and ProCAST packages contain data for only generic aluminum alloys, systematically failing to account for composition variations, grain-refinement treatments, and chemical modifications that fundamentally alter solidification behavior in production environments. This database deficit directly constrains predictive accuracy and limits the practical utility of simulation for real-world casting operations. It is acknowledged that commercial simulation packages allow for the integration of thermodynamic databases (e.g., JMatPro, ThermoCalc) to simulate non-equilibrium solidification. However, Thermal Analysis (TA) remains an indispensable complementary tool, as it captures real-time physical phenomena like undercooling and recalescence that are difficult to predict solely through theoretical calculations, especially in complex Al-Si-Mg alloy systems.
Digital casting simulation, which emerged in the mid-1970s [
5], has evolved significantly alongside advanced processes such as semi-solid molding and Vacuum Mold Casting [
6,
7]. Modern commercial software employs finite element analysis (FEA) and computational fluid dynamics (CFD) to model all aluminum casting methods, including gravity die casting (GDC), low-pressure die casting (LPDC), high-pressure die casting (HPDC), and investment casting (IC) [
7,
8]. These sophisticated tools predict fluid flow defects (misruns, air entrapment) and solidification defects (shrinkage, porosity) [
4,
6], as well as structural issues (hot tears, residual stresses, distortion) [
8,
9], and can forecast microstructure development and mechanical properties [
1,
2,
3,
4].
Simulation accelerates product development by replacing physical prototypes with virtual testing [
1,
2,
3,
4,
7,
8,
9], enabling early customer collaboration and reducing time-to-market [
1,
7,
9]. Economic benefits are substantial: foundries report scrap rate reductions from 8.5 to 3.5% [
10], optimized material utilization, and extended tooling life. These improvements demonstrate simulation’s transformative potential when properly implemented.
Despite these advantages, three critical constraints limit widespread adoption and effectiveness [
11,
12]. First, high financial investment is required for software licenses and high-performance computing systems, creating barriers for small to medium-sized foundries. Second, specialized expertise in both metallurgy and computational modeling is insufficient, necessitating extensive training and expert retention. Third, and most critically, simulation accuracy depends entirely on validated application-specific material databases [
7,
11,
12]. Current databases provide only generic alloy data, forcing engineers to apply oversimplified universal criteria, such as assuming feeding becomes impossible after 30% solid fraction, regardless of alloy composition, which ignore substantial variations in actual solidification behavior. These limitations are summarized in
Table 1.
Calibration using experimental cooling curves provides the essential pathway to overcome these database limitations. Cooling curve analysis delivers high-resolution temperature histories that reveal actual solidification kinetics and phase transformations [
13,
14], capturing non-equilibrium phenomena undercooling, recalescence, and treatment-induced transformations that thermodynamic software operating under equilibrium assumptions cannot predict.
This paper demonstrates the systematic integration of experimental cooling curve data into commercial simulation tools. By incorporating key solidification parameters (liquidus/solidus temperatures, dendrite coherency and rigidity point temperatures, fraction solid evolution, latent heat release, and crack susceptibility indicators) derived from simple 15–20 min tests using standard foundry equipment, the reliability of numerical models is significantly enhanced. This approach bridges the gap between theoretical predictions and industrial reality, transforming generic simulation databases into alloy-specific, experimentally validated tools for improved microstructural and performance predictions. The methodology is accessible to foundries of all sizes, requiring no additional capital investment beyond the quality-control equipment already in place, thereby lowering barriers to precision-casting simulation.
2. Data Collected from Cooling Curve Analysis
Commercial casting simulation software typically includes material databases limited to standard alloys. For alloys with varying compositions, varying solidification rates, or those subjected to grain-refining or modifying treatments, thermal analysis is a crucial method for determining the required material properties. Through accurate cooling curve measurements, thermal analysis has become essential for validating and refining simulation models of hypoeutectic aluminum alloys [
15].
2.1. Characteristic Solidification Temperatures
While equilibrium phase diagrams provide theoretical values, actual casting conditions often deviate significantly from these values due to kinetic effects and melt treatment [
15,
16,
17].
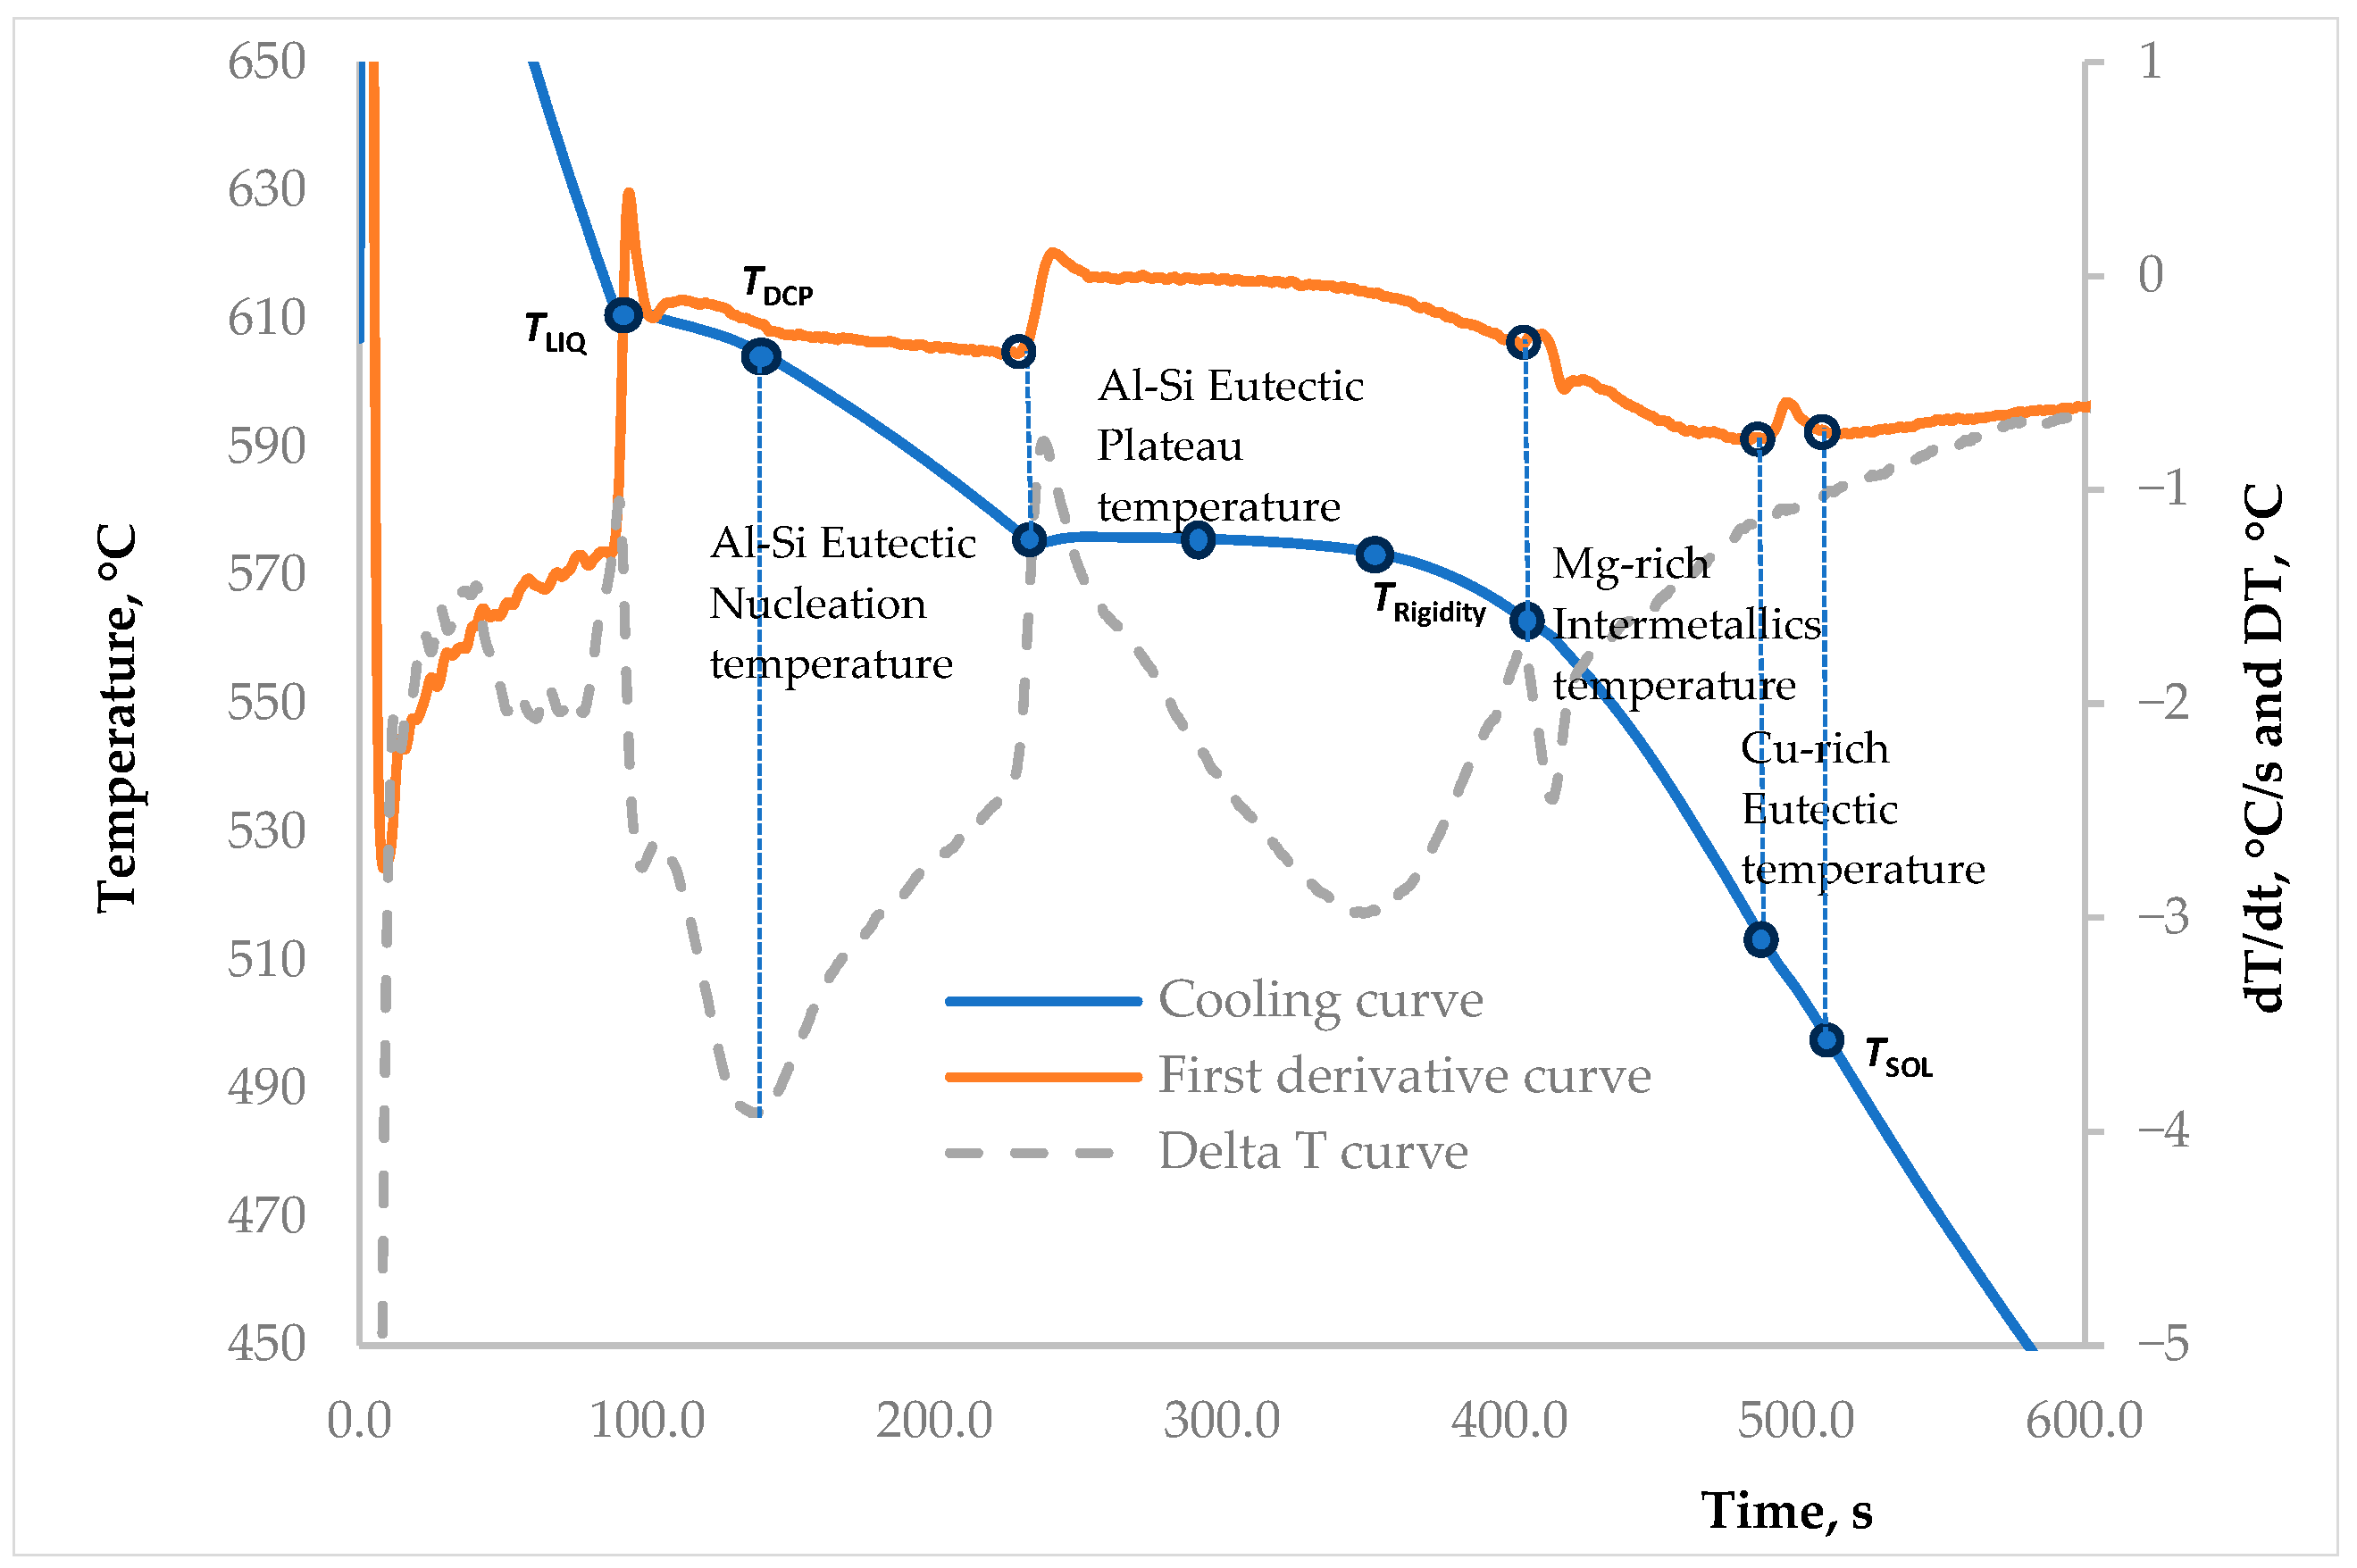
Figure 1 displays the characteristic solidification temperatures of cast aluminum alloys. These critical temperatures are determined by thermal analysis, evaluating the cooling curve, its first derivative, or the temperature differential curve (
). The abbreviations used in
Figure 1 include:
, Thermoelement located near TA cup wall;
, Thermoelement located in the center of the TA cup;
, Liquidus temperature, °C;
, Solidus temperature, °C;
, Rigidity temperature, °C;
, Dendrite coherency point/temperature, °C.
Liquidus Temperature: Determined from the first derivative curve as a sudden, sharp decrease in cooling rate, indicating solidification initiation. As
Figure 1 illustrates, this temperature defines the upper boundary for solidification modeling and predicts the extent of the mushy zone and the locations of dendrite nucleation sites.
Dendrite Coherency Temperature:
Figure 1 shows that this temperature corresponds to the first minimum on the delta T curve, marking when dendrites establish physical contact and form a continuous network. This critical point marks the transition from bulk mass feeding to constrained interdendritic feeding and the onset of the alloy developing measurable mechanical properties essential for hot-tearing predictions. The maximum temperature difference (
) between center and wall thermocouples corresponds to dendrite coherency because this represents the point of maximum thermal resistance during the transition from liquid-dominated to solid-dominated heat transfer.
Eutectic Temperatures: The eutectic nucleation and plateau temperatures provide vital information on melt quality and the effectiveness of modification. As
Table 2 demonstrates, thermal analysis accurately captures the significant eutectic temperature depression caused by strontium modification from 572.4 °C (1 ppm Sr) to 562.5 °C (173 ppm Sr). Commercial simulation software like Pandat and JMatPro predict virtually constant temperatures (570.80–570.88 °C) regardless of modifier content, thereby failing to account for modification treatment effects. The
is Al−Si eutectic temperature (°C).
Thermal analysis directly measures these composition-dependent variations, enabling accurate prediction of silicon morphology and eutectic distribution, characteristics that profoundly influence mechanical properties and machinability. These eutectic temperatures are identified through combined analysis of the cooling curve and its first derivative, shown in
Figure 1.
Rigidity Temperature:
Figure 1 illustrates that this temperature corresponds to the second minimum in the delta T curve, where dendritic networks completely block interdendritic channels, terminating melt flow. This marks the boundary between interdendritic and burst feeding, distinguishing between localized shrinkage cavities and dispersed microporosity formation. Similarly to DCP determination, rigidity temperature is identified from thermal analysis as the transition point where the dendritic skeleton achieves mechanical stability sufficient to resist deformation. These critical temperatures provide experimentally validated inputs for simulation databases.
Intermetallic Temperatures: The first derivative curve in
Figure 1 determines Mg-rich and Cu-rich intermetallic formation temperatures. These enable accurate prediction of intermetallic phase kinetics, distribution, and their impact on hot tearing, porosity, age-hardening behavior, and microsegregation patterns. The intermetallic formation temperatures obtained from thermal analysis provide critical information for predicting microstructural distribution, porosity formation tendency, and subsequent age-hardening response. The temperature-time window of intermetallic crystallization determines local feeding conditions and solute redistribution, directly influencing both casting defect formation and heat treatment effectiveness.
Solidus Temperature: Determined from the first derivative curve where cooling rate returns to steady state, capturing non-equilibrium solidification effects. Critical for predicting total solidification time and hot tearing susceptibility.
The characteristic temperatures from thermal analysis enable more sophisticated prediction of feeding behavior, which is essential for accurate shrinkage-related defect modeling.
2.2. Feeding Ability of Cast Aluminum Alloys
The term “feeding ability” refers to the molten metal’s capacity to flow and compensate for volumetric shrinkage during solidification [
17,
18]. More specifically, feeding ability describes how effectively liquid metal can flow through the solidifying structure to fill voids created by solidification shrinkage, thereby preventing shrinkage porosity and cavities in the final casting [
19].
Understanding feeding ability requires consideration of several interconnected physical phenomena. During solidification, aluminum alloys undergo volumetric contraction of six to seven percent [
17], creating voids that must be filled by liquid metal flowing from hotter regions or from feeders. The liquid metal must navigate through an increasingly complex dendritic network in the mushy zone, with effectiveness depending on maintaining adequate pressure transmission through the semi-solid material. Multiple metallurgical and physical factors influence feeding ability, including chemical composition (Si, Mg, Sr), solidification characteristics (solidification range, intermetallic compound formation), casting design (geometry), process parameters (pouring temperature, mold temperature, grain refinement, modification), and casting conditions (mold coatings, gating design) [
17,
18,
19]. The solidification range plays a particularly critical role. Alloys with narrow solidification ranges generally exhibit superior feeding ability because they maintain a clear boundary between the liquid and solid phases for a longer period.
According to Campbell [
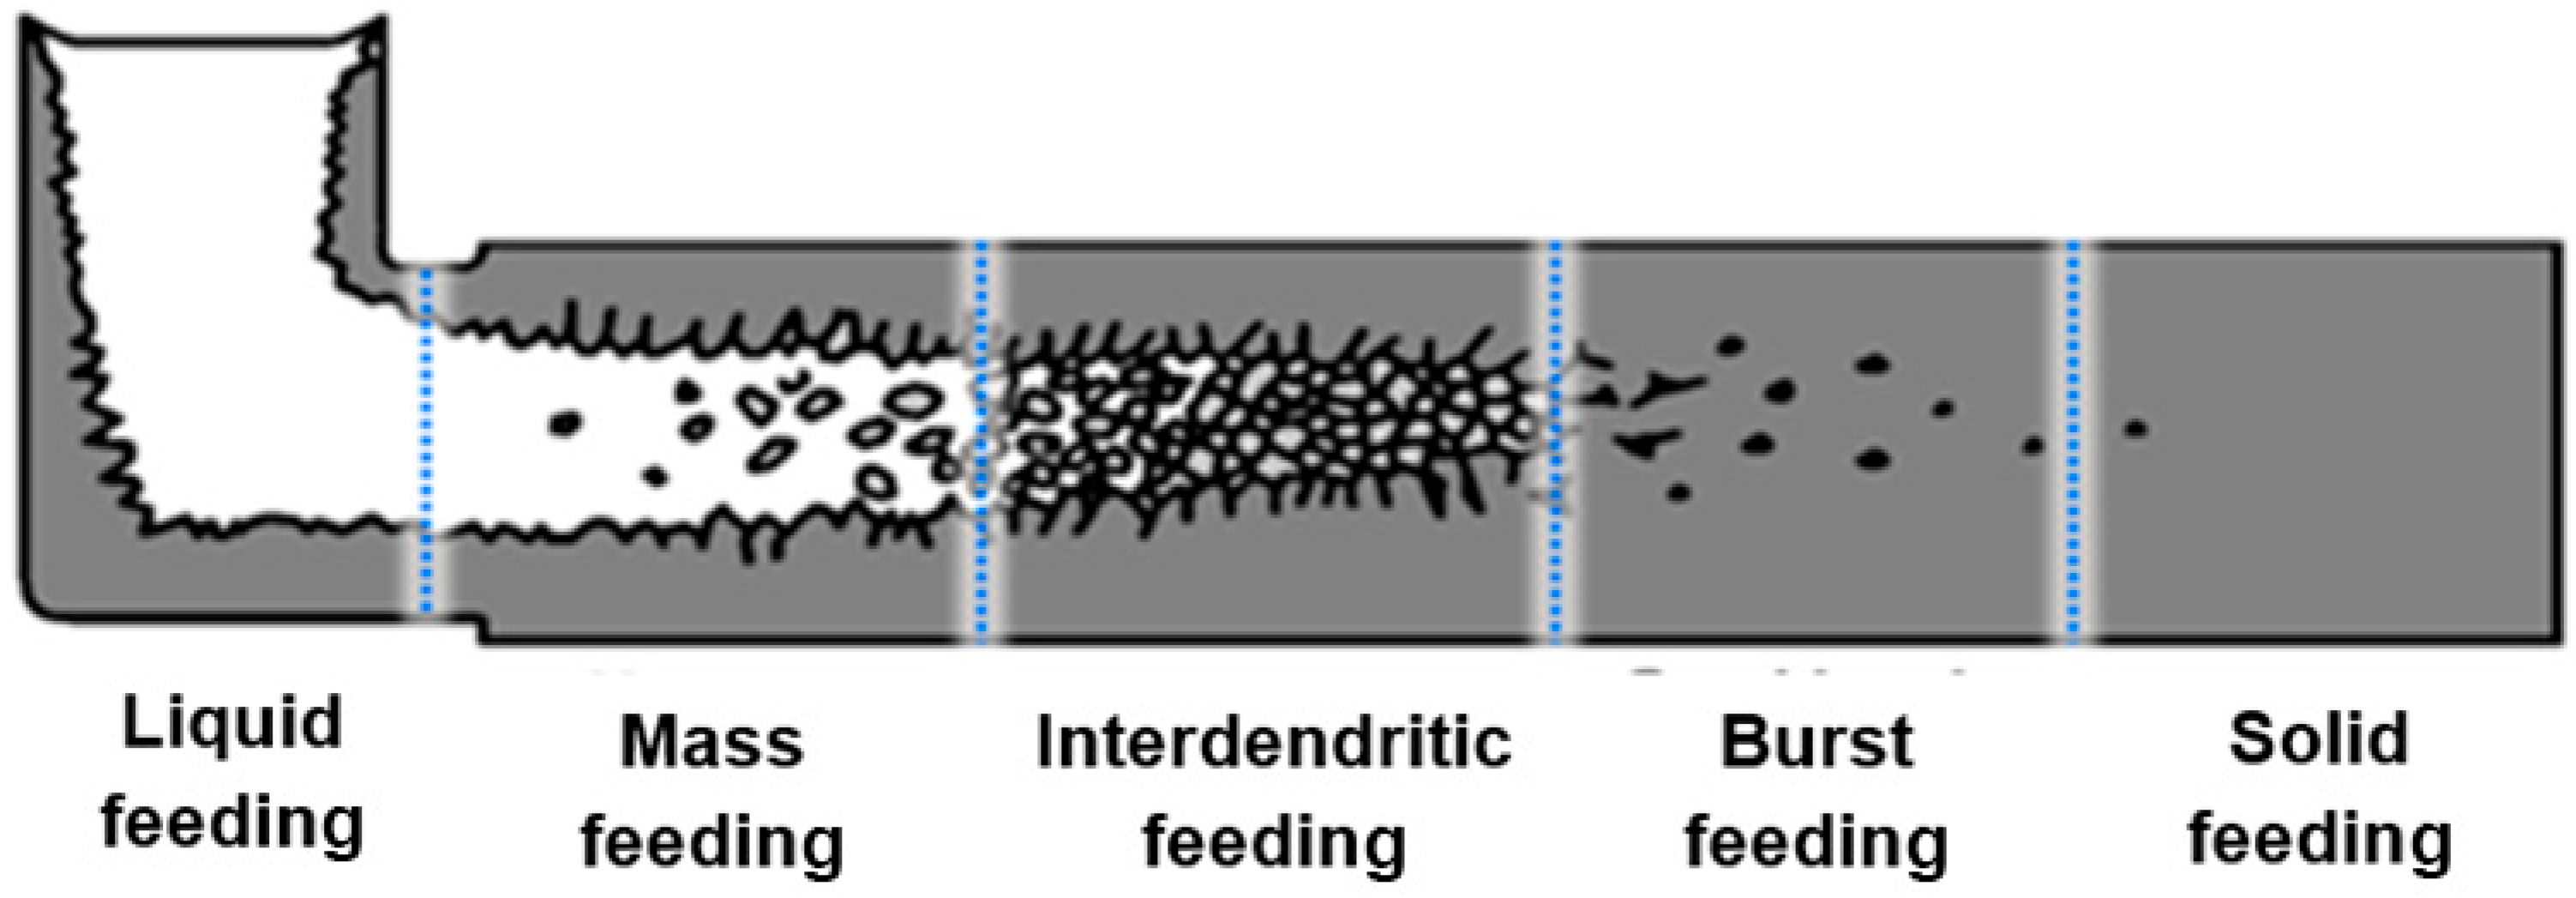
17], alloy solidification can be divided into five distinct regions: liquid feeding, mass feeding, interdendritic feeding, burst feeding, and solid feeding, as illustrated in
Figure 2. Liquid feeding occurs between the pouring temperature and the liquidus temperature, during which the metal remains completely liquid and flows freely to compensate for thermal contraction. Mass feeding occurs between the liquidus and the dendrite coherency temperatures. In this region, solidifying metal consists of freely floating dendrites suspended in the liquid, allowing relatively unimpeded liquid-metal flow to feed shrinkage cavities [
17].
As solidification progresses, interdendritic feeding becomes the dominant mechanism between dendrite coherency and rigidity temperatures. At the dendrite coherency point, growing dendrites begin to touch and form a coherent network, though channels between dendrites remain open enough to permit liquid flow, albeit with increasing resistance. The rigidity temperature marks a critical transition where the solid network becomes sufficiently strong to resist deformation, yet some liquid remains trapped between dendrites [
17,
18]. Burst feeding occurs between rigidity and solidus temperatures. During this stage, the solid skeleton has developed sufficient strength that liquid flow is severely restricted. Feeding can only occur if local pressure differentials are large enough to cause localized rupture or rearrangement of the solid network, allowing liquid to burst through and fill shrinkage voids [
17]. Finally, solid feeding takes place below the solidus temperature, where any remaining volume compensation must occur through plastic deformation or yielding of the fully solid metal.
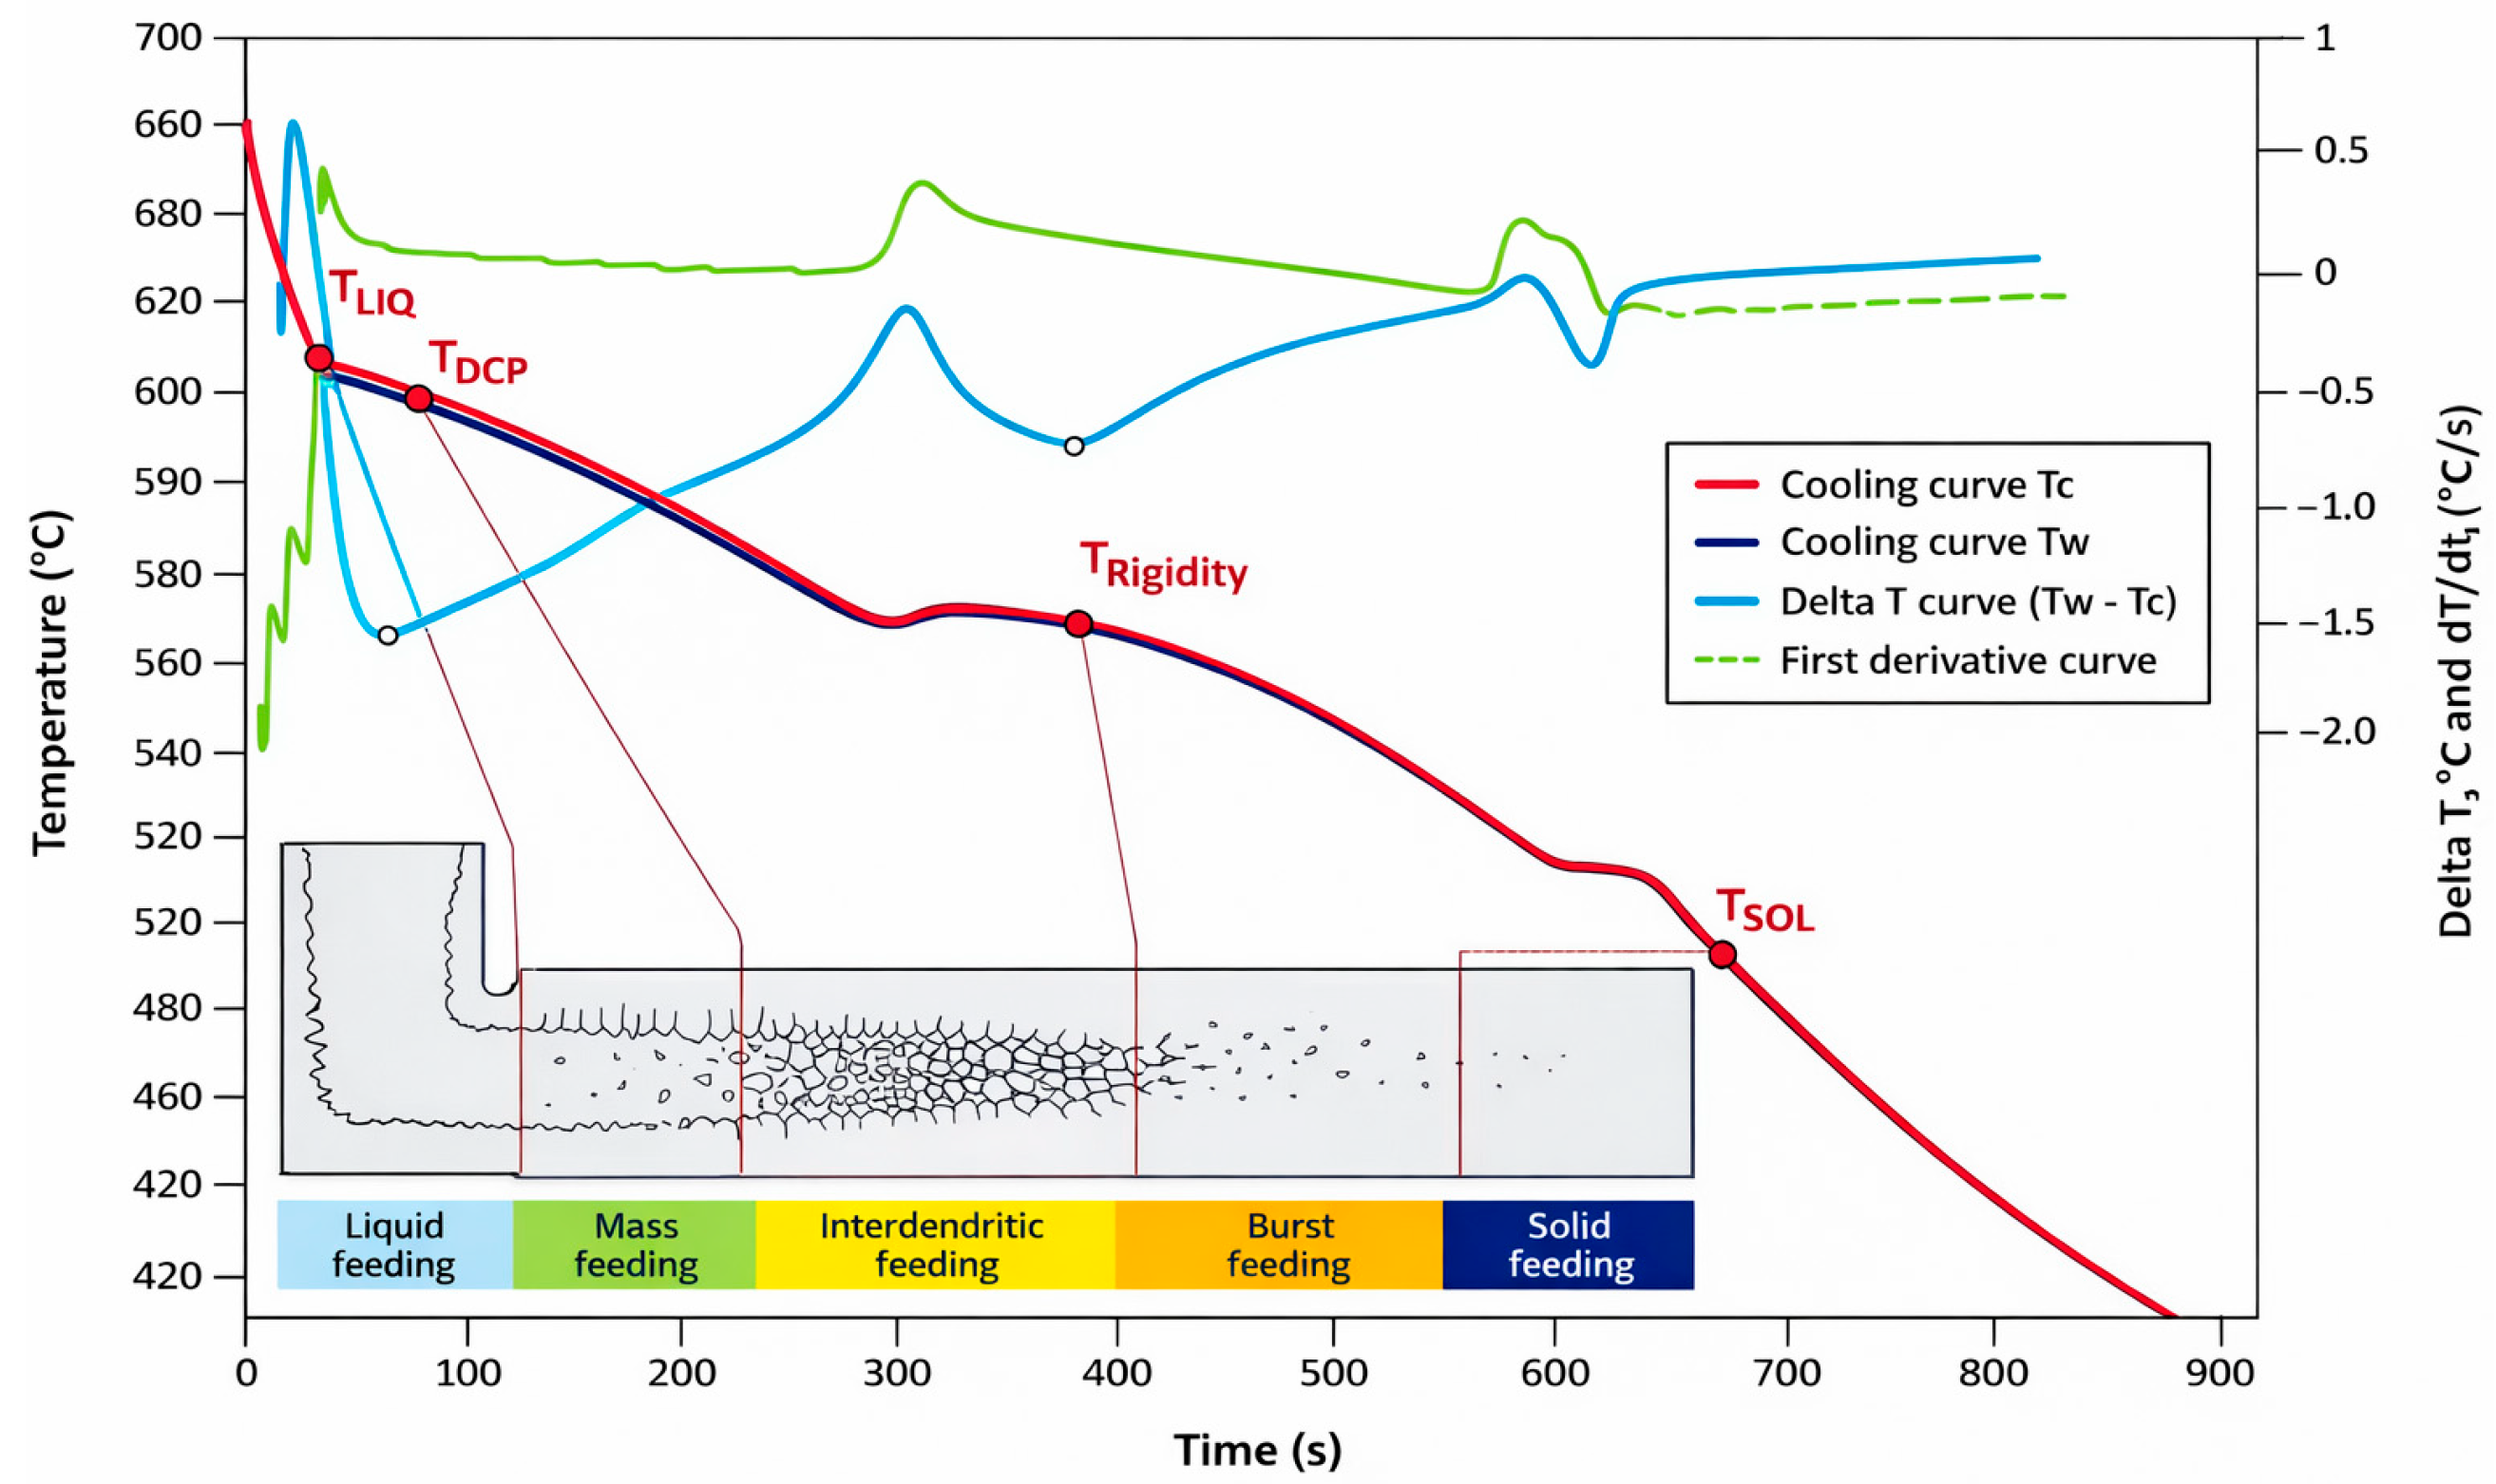
Thermal analysis successfully quantifies feeding regions of any cast aluminum alloy by identifying characteristic solidification temperatures, liquidus, dendrite coherency, rigidity, and solidus that mark transitions between feeding mechanisms. As shown in
Figure 3, all these characteristic temperatures can be readily determined using cooling curve analysis. These specific solidification temperatures delineate the characteristic feeding regions of any hypoeutectic aluminum cast alloy, with each region representing a distinct stage in the solidification process characterized by different mechanisms of shrinkage compensation [
17,
18].
Using these characteristic solidification temperatures, temperature ratios for mass, interdendritic, and burst feeding can be quantified using Equations (1)–(3) [
18]:
where:
, temperature ratio for mass feeding, %
, temperature ratio for interdendritic feeding, %
, temperature ratio for burst feeding, %
By using data exclusively from thermal analysis, all five feeding regions can be quantified using temperature, time, or fraction-solid parameters. Cooling curve analysis provides a simple, cost-effective, and accurate method to determine all characteristic solidification temperatures necessary for assessing the feeding ability of cast aluminum alloys [
18]. This technique offers major advantages for foundries, enabling real-time measurements directly in production environments without specialized equipment or extensive sample preparation. Moreover, characteristic temperatures from cooling curve analysis can be integrated into simulation software databases, enhancing the accuracy of solidification and feeding predictions. This integration addresses a key limitation of current simulation practice: most software uses a generalized feeding criterion for all aluminum alloys, assuming feeding ceases once the fraction solid reaches 30%. Such simplification neglects alloy-specific variations in feeding behavior. Incorporating data from cooling curve analysis enables more refined, alloy-specific feeding criteria that capture the dendrite coherency point and rigidity temperature for each alloy [
17,
18,
19]. The result is a substantial improvement in predictive accuracy, enabling better forecasting of shrinkage defects, optimized feeder design, and enhanced casting quality control, all while maintaining the simplicity and speed required for industrial applications, making advanced feeding analysis accessible without major workflow changes.
2.3. The Fraction Solid Is Determined Using Cooling Curve Analysis
Commercial casting simulation software for aluminum alloys requires accurate thermophysical and chemical property data, yet existing databases lack sufficient information. Cooling curve analysis provides a cost-effective solution to collect missing data and enhance simulation software capabilities. The fraction solid, determined by cooling curve analysis, is among the most critical simulation parameters [
20]. A key aspect of cooling curve analysis is determining the baseline, the theoretical first derivative of the cooling curve without phase transformation. The baseline overlaps with the actual first derivative in single-phase regions above the liquidus and below the solidus. Two established methods for calculating latent heat and solid fraction are the Newtonian and Fourier methods [
20,
21].
2.4. Newtonian Analysis Method
The Newtonian approach uses simplifying assumptions: a single thermocouple at the sample center, a lumped thermal system (Biot number < 0.1), a uniform temperature distribution, constant specific heat within the freezing range, and a single-function heat-transfer characterization [
20]. A polynomial (third order or higher) fits the first derivative in single-phase regions. Solid fraction is calculated from the cumulative area between the first derivative curve and baseline relative to the total area [
20].
2.5. Fourier Analysis Method
The Fourier method, following the approach of Fras and colleagues, accounts for thermal gradients during solidification [
21]. Assuming conduction-only heat transfer, it requires two thermocouples at different radii in a cylindrical sample. Unlike the Newtonian approach, it accounts for temperature variations by expressing the temperature field as a parabolic function and treating thermophysical properties as temperature- and time-dependent. Through iterative procedures, thermal diffusivity is determined before and after solidification, and solid fraction is approximated and then refined. It should be noted that, although the interfacial heat transfer coefficient between the melt and the mold is known to vary with time during industrial solidification due to gap formation, surface roughness, oxidation, and phase transformation effects, no constant interfacial heat transfer coefficient was assumed in the present analysis. In the Fourier-based cooling curve analysis applied here, the heat transfer conditions at the metal mold interface are not prescribed explicitly. Instead, the transient heat flux and temperature gradients are derived directly from experimentally measured temperature histories obtained using two thermocouples. Consequently, the time-dependent interfacial heat transfer behavior is naturally captured in the system’s experimental thermal response, rather than imposed as an idealized boundary condition. The analysis assumes predominantly one-dimensional heat conduction within the sample, which may affect absolute heat flux values but does not affect the determination of characteristic solidification temperatures, fraction-solid evolution, or feeding-related parameters that form the basis of this study. Thermophysical properties, such as volumetric specific heat and thermal diffusivity, are recalculated at each step based on the evolving solid fraction [
21]. Furthermore, even under hypothetical assumptions of a constant interfacial heat transfer coefficient, the cooling rate within a casting is naturally non-uniform. As solidification progresses, the formation and growth of the solid phase increase local thermal resistance, leading to a progressive reduction in the cooling rate and a spatially varying thermal history within the sample. In the present study, this behavior is naturally captured by Fourier-based cooling curve analysis, which explicitly accounts for spatial temperature gradients using two thermocouples at different radial locations. The evolving solid fraction and associated changes in thermophysical properties are incorporated iteratively, enabling the method to reflect the local decrease in cooling rate caused by the growing solid network. As a result, the non-uniform, time-dependent nature of cooling during solidification is directly reflected in the measured temperature histories and resulting thermal gradients, without assuming uniform cooling conditions.
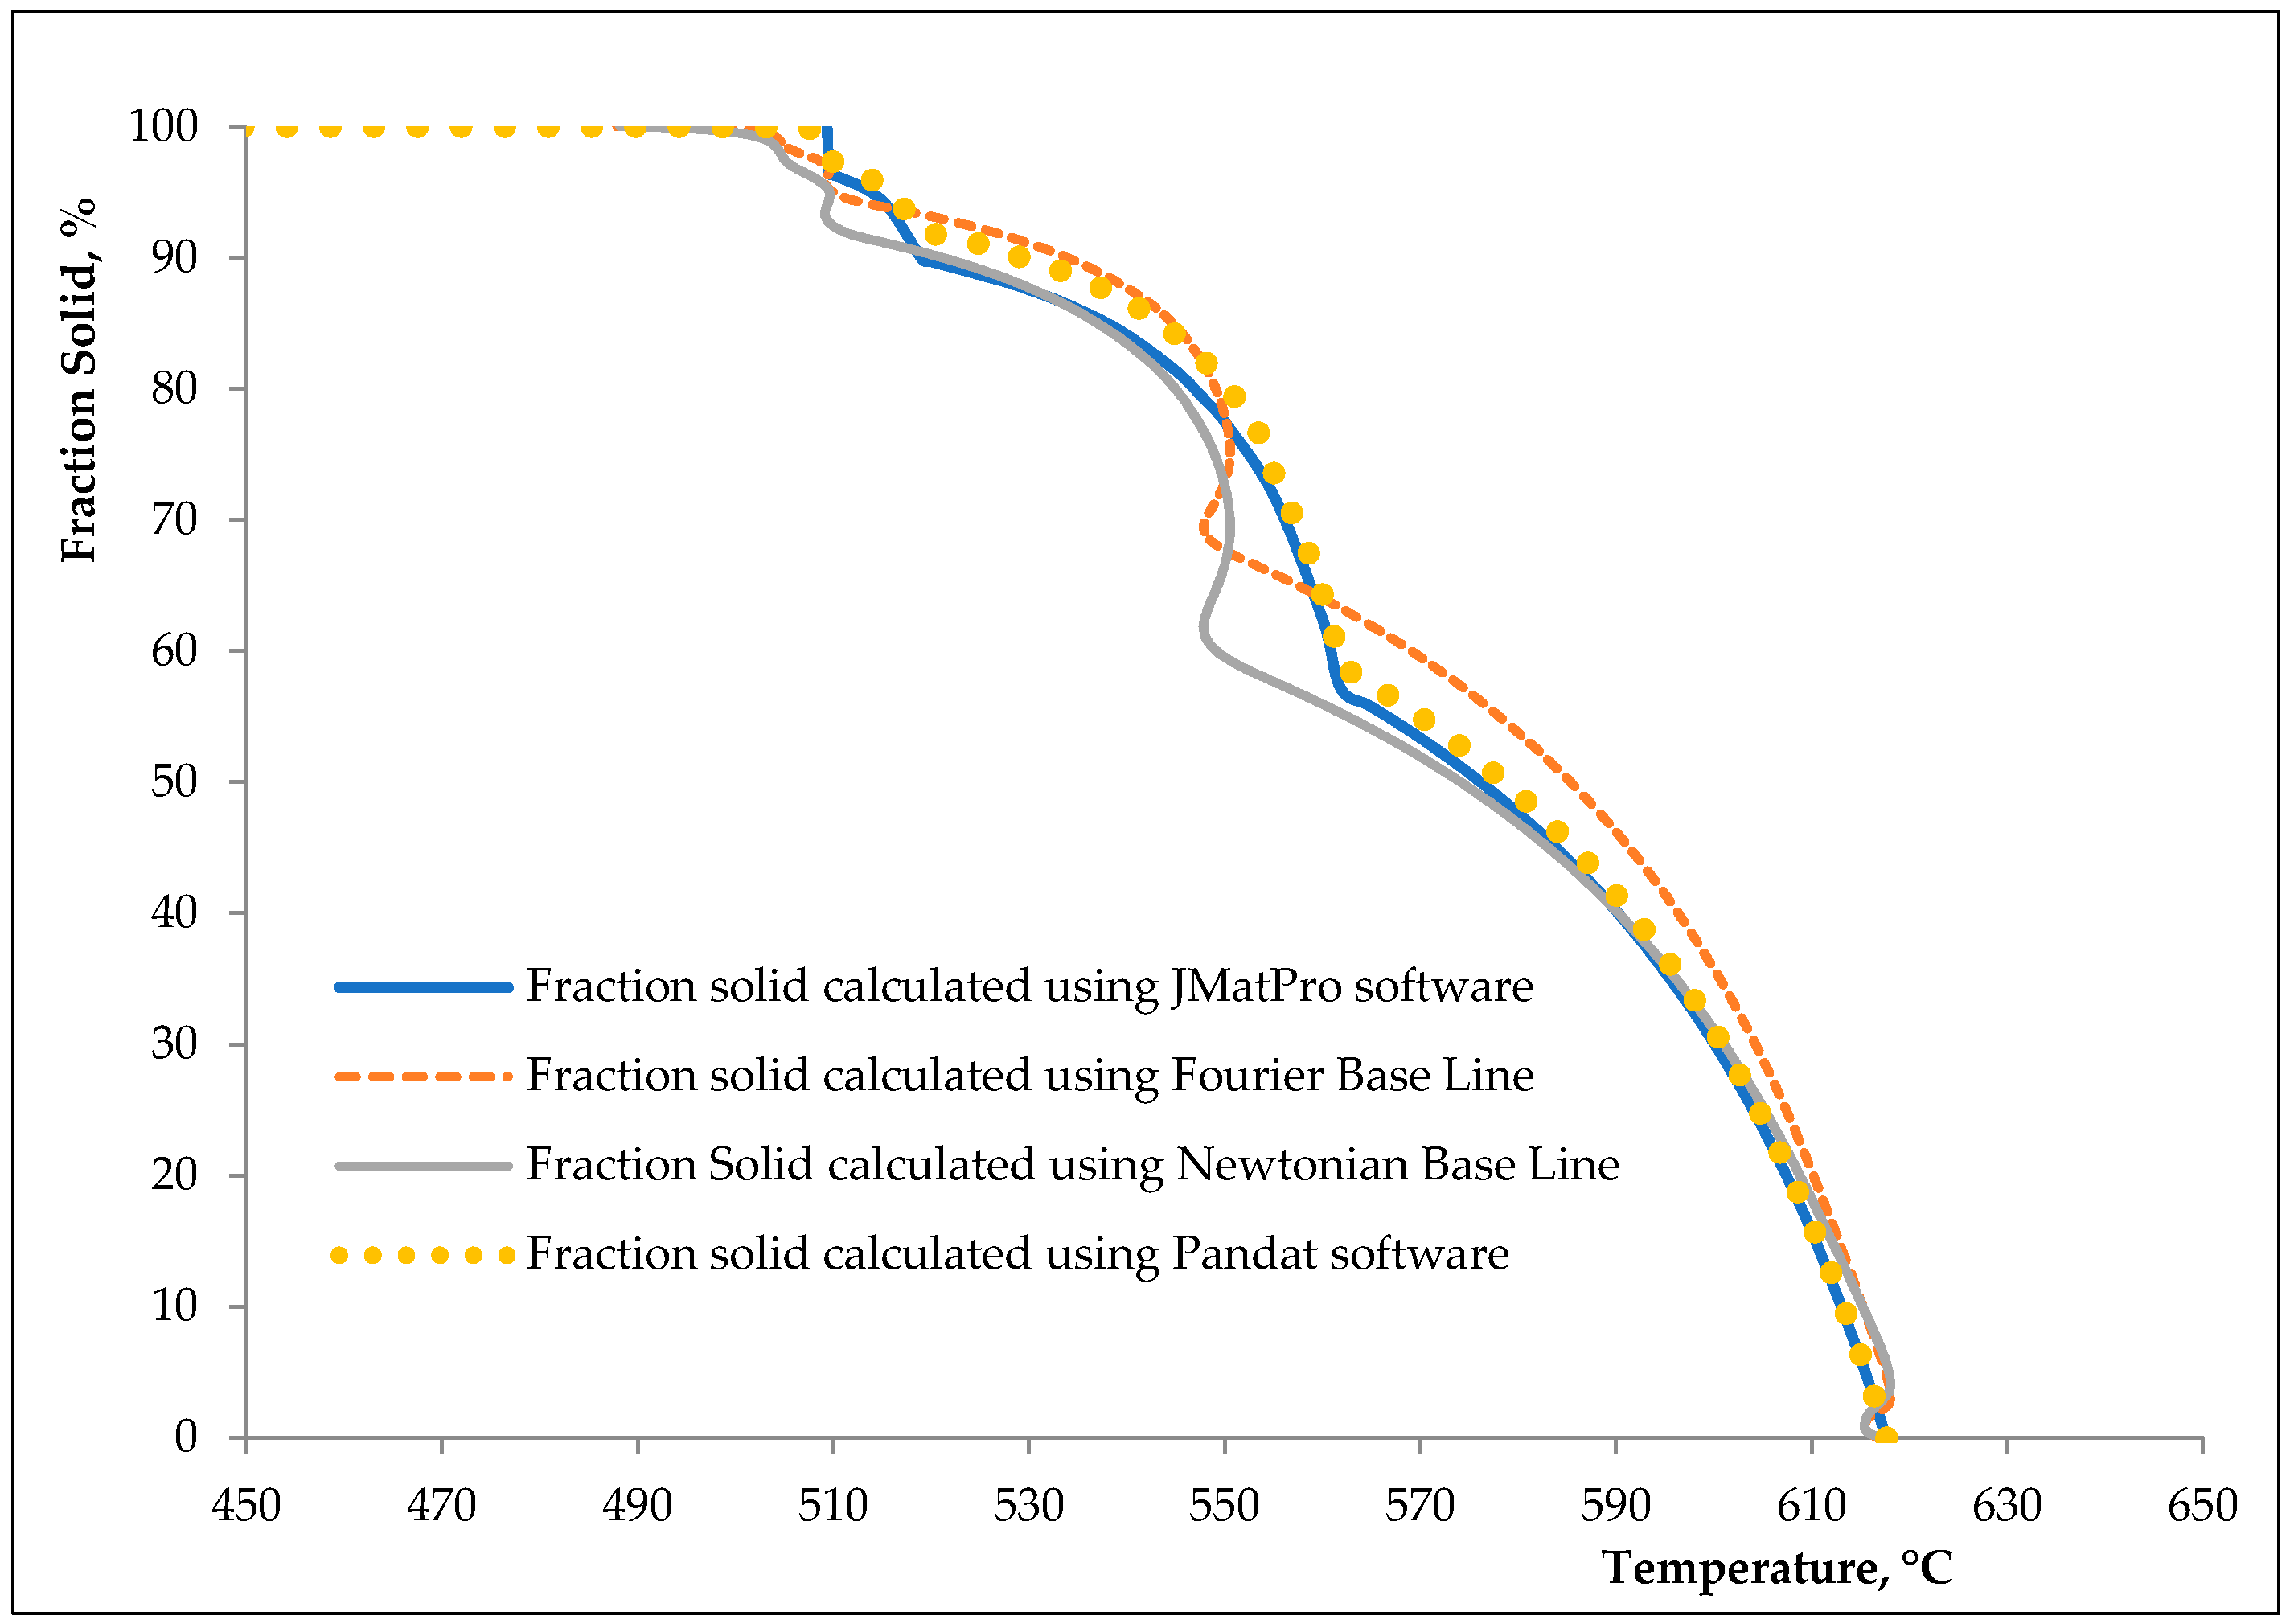
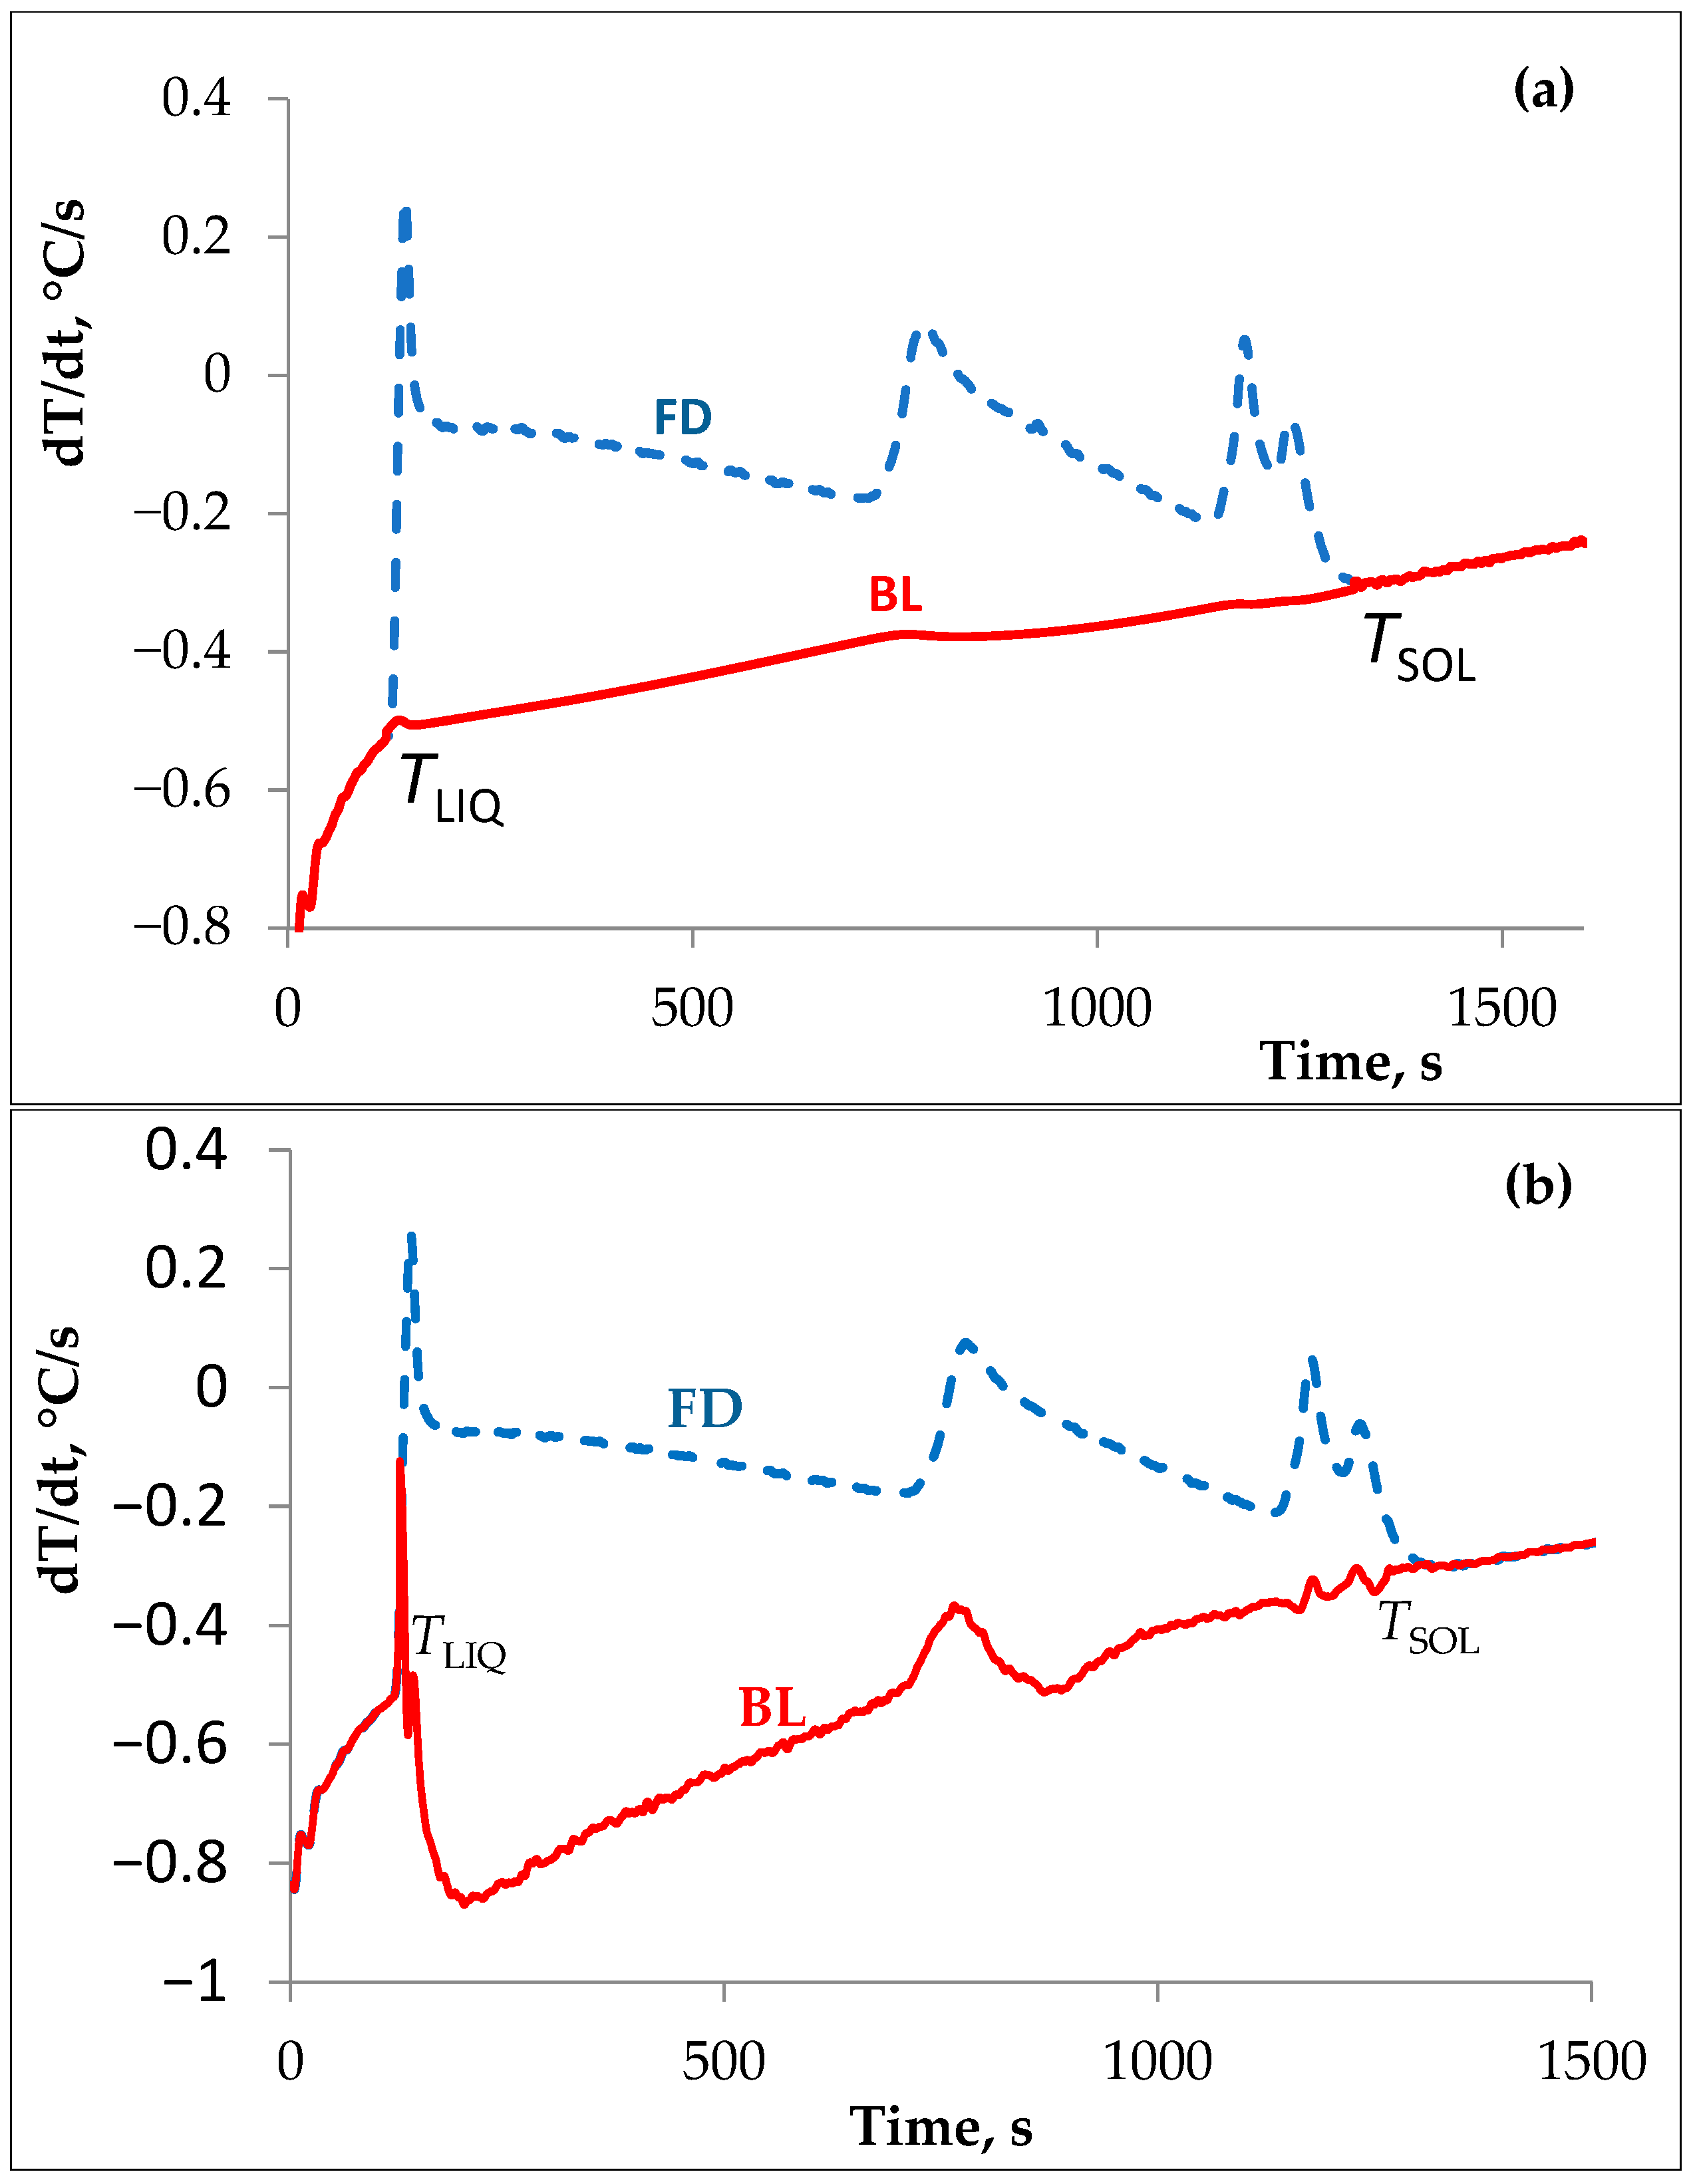
For example, both methods were used to evaluate solid fraction evolution during the solidification of AlSi
5Cu
4 alloys with varying copper content (
Figure 4). All thermal analysis experiments used to generate the data presented in
Figure 4 and
Figure 5 were performed on alloy AlSi
5Cu
4 under a constant average cooling rate of approximately 6 °C/min. While the Newtonian method offers simplicity, the Fourier method provides greater accuracy by accounting for spatial variations in temperature and property changes.
Figure 4 shows solid fraction curves from both experimental methods, compared with those from commercial software calculations. Pandat and JMatPro predictions are nearly identical and agree well with both methods. Commercial software closely matches the Newtonian method during primary solidification, while the Fourier method shows better agreement between AlSi eutectic and solidus temperatures. Based on limited experiments, it is difficult to definitively determine the most accurate method; additional experiments are needed. The Fourier method is technically more complicated, requiring two thermocouples with precisely measured positions. Thermal analysis at various cooling rates reveals rate-dependent evolution of the fraction solid, essential for simulating castings with varying section thicknesses, where cooling rates differ by orders of magnitude. Multi-rate calibrated models can accurately predict microstructure transitions from slow-cooled heavy sections to rapidly solidified thin walls.
It should be noted that the thermal history measured at a specific location within the sample is inherently local and cannot be assumed to be representative of the entire casting, particularly in cases involving complex geometries or non-uniform cooling conditions. Accordingly, the solidification parameters obtained from thermal analysis are not intended to directly describe the full spatial thermal field of a casting. Instead, they represent alloy-specific solidification behavior determined under well-defined cooling conditions. When used in casting simulations, these experimentally derived parameters serve as physically grounded input for model calibration, while the simulation itself resolves spatial variations in temperature, cooling rate, and heat flow throughout the casting. The approach remains meaningful provided that the thermal analysis measurements are performed at cooling rates representative of those in the casting, or that multiple cooling curves are used to span the relevant range of solidification conditions associated with different section thicknesses.
2.6. Advantages of Cooling Curve Analysis over Commercial Software
Within the limitations discussed in the previous section, cooling curve analysis offers several practical advantages over purely database-driven commercial software approaches. Although satisfactory agreement between experimental methods and predictions from commercial software is often reported, thermodynamic calculation tools have inherent limitations. Software packages such as JMatPro and Pandat primarily calculate equilibrium or near-equilibrium transformations and therefore cannot fully account for non-equilibrium phenomena such as undercooling and recalescence during primary phase nucleation or eutectic solidification [
20,
21]. These transient events can significantly affect solidification kinetics and the evolution of the solid fraction, particularly when substantial undercooling precedes nucleation. Cooling curve analysis captures the alloy’s actual thermal history, including undercooling events and subsequent recalescence associated with rapid latent heat release. Since these phenomena directly influence microstructure development and final component properties, their experimental detection is essential for realistic solidification analysis. By incorporating real-time thermal data that reflect non-equilibrium solidification behavior, cooling curve analysis provides a more representative description of industrial casting conditions than equilibrium-based thermodynamic predictions. Consequently, experimental thermal analysis is particularly valuable for simulation validation and for investigating alloys and processes where significant departures from equilibrium solidification occur [
13,
20].
2.7. Latent Heat Determination Using Cooling Curve Analysis
The latent heat of solidification is a critical thermophysical property governing aluminum alloy solidification behavior and is essential for accurate casting simulation, process optimization, and defect prediction [
22,
23]. While Differential Scanning Calorimetry (DSC), Differential Thermal Analysis (DTA), and thermodynamic software (JMatPro, FactSage, ThermoCalc) are widely used, cooling curve analysis has become particularly attractive for industrial applications due to its simplicity, cost-effectiveness, and ability to capture real solidification conditions [
24,
25,
26]. Cooling curve analysis (thermal analysis—TA) has long been applied for phase diagram determination and metallurgical studies [
13]. The method records temperature versus time during melt solidification in a test cup, where latent heat release appears as characteristic slope changes identifiable via the first derivative. It requires minimal sample preparation, provides reproducible results, and directly reflects industrial casting conditions [
22]. Its ease of implementation and low cost make it ideal for routine quality control and alloy characterization in production environments.
DSC and DTA, though precise, face practical limitations. DSC requires small samples (10–20 mg), often unrepresentative of inhomogeneous alloys, and demands meticulous calibration and expert interpretation [
22,
23]. DTA offers lower sensitivity. Both techniques are poorly suited for routine foundry use due to high equipment costs, limited throughput, and complex sample preparation. Thermodynamic software provides rapid predictions using equilibrium and Scheil–Gulliver non–equilibrium models (assuming negligible solute diffusion in solids and full diffusion in liquids). While accurate for many aluminum alloys, these models cannot account for non-equilibrium phenomena such as undercooling before nucleation or recalescence during solidification [
27]. Such transient effects strongly influence the actual evolution of the solid fraction. Additionally, commercial databases are typically reliable only for standard compositions, limiting accuracy for modified or non-standard alloys. Cooling curve analysis overcomes these limitations by directly recording the real thermal history, including undercooling and recalescence events that govern solidification kinetics and microstructural evolution, affecting temporal solid fraction and final casting properties [
27]. The method provides a more realistic description of industrial solidification than equilibrium-based software and validates simulations of non-equilibrium processes. By applying various cooling rates, it reveals rate-dependent solid fraction evolution, which is critical for predicting microstructure transitions between slow-cooled heavy sections and fast-cooled thin walls.
Comparative studies confirm that cooling curve analysis yields latent heat values for pure aluminum and its alloys with relative errors below 7.5% and 5%, respectively, when benchmarked against DSC and software predictions [
27,
28]. Excellent agreement has been reported for AlSi
7Cu
1 alloy compared with FactSage, ThermoCalc, and JMatPro data ([
28]). Experimental methods particularly excel in capturing non-equilibrium effects during eutectic solidification, where undercooling and recalescence are most pronounced.
Accurate determination of latent heat requires precise identification of the liquidus and solidus temperatures from first-derivative curves, as small errors can significantly affect the results. Baseline selection, Newtonian or Fourier, presented in
Figure 5, is equally important; polynomial fitting and high decimal precision improve accuracy.
Figure 5.
First derivative and Newtonian (
a) and Fourier (
b) base lines for AlSi
5Cu
4 alloy [
28].
Figure 5.
First derivative and Newtonian (
a) and Fourier (
b) base lines for AlSi
5Cu
4 alloy [
28].
Beyond property determination, cooling curve analysis assesses modified or experimental alloys lacking complete database coverage. Experimentally derived latent heat data can be incorporated into casting simulation software, enhancing model accuracy and predictive capability, creating a hybrid approach that combines computational efficiency with experimental realism. On the foundry floor, it enables real-time process monitoring, melt quality assessment, and rapid optimization without external laboratory support. Cooling curve analysis provides a robust, practical, and cost-effective method for determining the latent heat of aluminum alloys under realistic casting conditions. Its ability to capture non-equilibrium solidification phenomena makes it a powerful complement to DSC/DTA and computational tools. As casting simulation evolves, integrating experimental thermal analysis data will be essential to achieving high predictive accuracy in the development of advanced aluminum components.
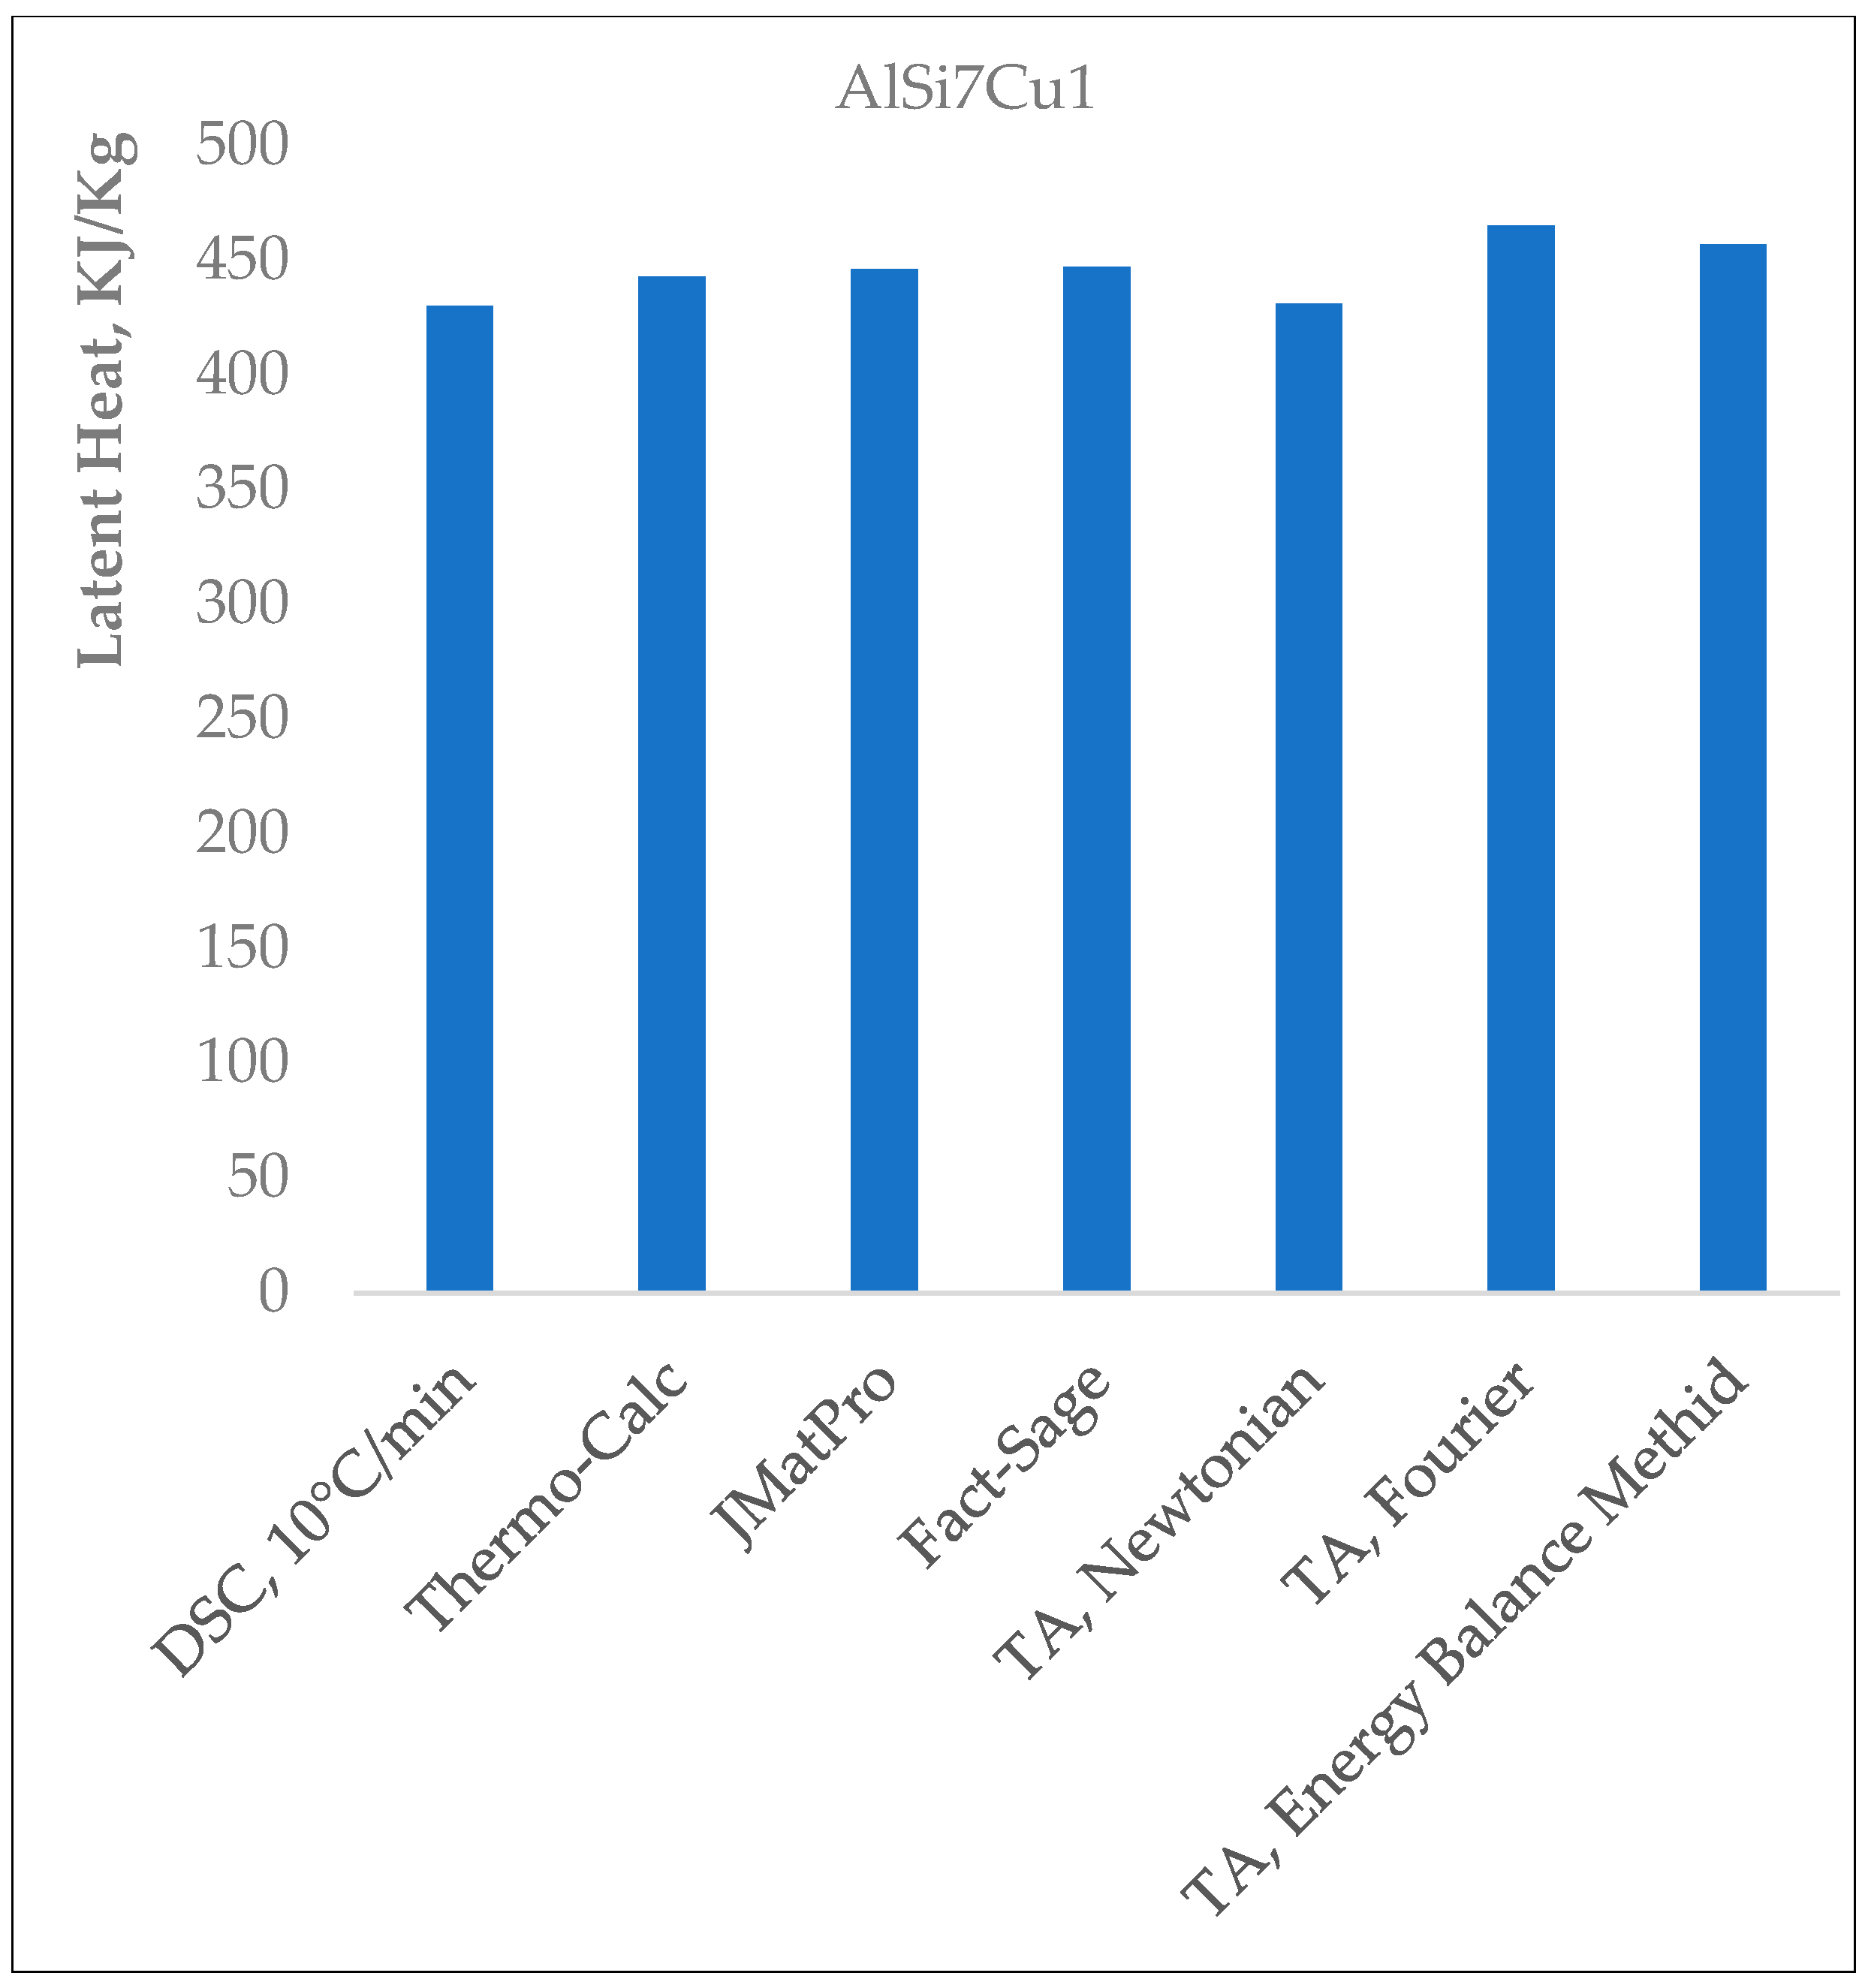
Figure 6 compares the accuracy of all applied methods for determining the latent heat of cast AlSi
7Cu
1 alloy, using DSC measurements as reference. Results confirm the reliability of cooling curve analysis and demonstrate excellent agreement with established techniques.
2.8. Prediction of Crack Susceptibility Coefficient
Hot tearing is a critical defect in aluminum alloy casting, particularly affecting complex automotive components like cylinder heads and engine blocks [
29]. These intergranular cracks form during solidification when semi-solid material possesses sufficient strength to transmit stress but lacks adequate ductility to accommodate strain, leading to substantial economic losses through part rejection or costly repairs [
30,
31].
The crack susceptibility coefficient (
) quantitatively predicts hot-tearing susceptibility by characterizing critical time or temperature intervals during solidification. Clyne and Davies established the foundational framework [
32]:
where
,
, and
represent times when solid fractions reach 0.99, 0.9, and 0.4, respectively [
33]. This model relied on simplified assumptions that did not account for actual microstructural development.
Katgerman [
34,
35] improved this by introducing dendrite coherency time:
where
is the coherence point time,
is when feeding becomes inadequate, and
It is when the solid fraction reaches 0.99. This refinement better captured the transition from mass feeding to interdendritic feeding, focusing on solid fractions between 0.85 and 0.99, where hot tearing risk peaks.
Kamga et al. [
33] advanced the model by transitioning to temperature-based calculations:
where
is dendrite coherency temperature,
is the temperature at inadequate feeding, and
is the temperature at 1% residual liquid. This formulation provided more robust predictions across varying cooling rates and alloy compositions, though it still lacked direct incorporation of critical microstructural transformation points.
2.9. Rigidity Temperature Model
Duenkelmann et al. [
36] introduced a groundbreaking advancement by incorporating experimentally determined rigidity temperature:
where:
is dendrite coherency point temperature (typically at )
is rigidity temperature (at )
T0.99 is the temperature at 99% solid fraction
The numerator () represents the vulnerable period from rigidity temperature to near complete solidification, while the denominator () captures the stress relief period from dendrite coherency to rigidity temperature.
The rigidity point marks the critical transition at which the alloy develops sufficient mechanical strength to resist deformation, signifying the end of interdendritic feeding and the onset of burst feeding. Determined by thermal analysis, it captures the actual physical state at which the dendritic skeleton can no longer accommodate strain without fracturing. The dendrite coherency point identifies when dendrites first form a coherent network and impinge on each other, while the rigidity point occurs at higher solid fractions when stress exceeds the strength of the solid dendritic skeleton.
Incorporating rigidity, temperature, and their corresponding solid fractions represents a fundamental advance for casting simulation accuracy. These parameters, obtained directly from cooling curve analysis, provide enhanced predictive capability by accounting for actual microstructural development rather than relying on theoretical assumptions.
A crucial advantage of temperature-based formulation over time-based models is that temperature, being an extensive parameter, remains independent of sample mass and varies only with thermocouple accuracy, whereas time is intensive and highly sensitive to sample mass variations. This ensures consistency regardless of experimental conditions. Since thermal analysis is already widely implemented in aluminum foundries for quality control, the required parameters are readily obtainable without additional equipment investment.
Rigidity-temperature data can be directly implemented in existing casting simulation packages, enabling a sophisticated representation of mushy-zone behavior and hot-tearing susceptibility zones within complex geometries. This allows engineers to visualize and predict where hot tears are most likely to occur before actual production begins. The model can also be expressed in time-based form, providing flexibility depending on available data and application requirements:
Validation against experimental hot-cracking index data for AlSi
7MgCu alloys demonstrated a strong correlation, confirming the model’s ability to qualitatively and quantitatively predict cracking susceptibility [
36]. This enables foundries to proactively adjust alloy compositions and process parameters before production, significantly reducing scrap rates and improving casting quality while minimizing time-consuming and costly experimental trials. The comprehensive approach, combining experimental data with analytical methods, has significantly advanced our ability to predict and understand hot-tearing phenomena, ultimately leading to higher-quality castings and reduced economic losses in industrial applications.
3. Conclusions
This work demonstrates that cooling curve analysis provides a practical, accurate solution for bridging the gap between casting simulation and industrial reality. Modern simulation tools rely on generic material databases that fail to account for composition variations, grain refinement, and chemical modification limitations that directly impact solidification behavior and defect prediction.
Cooling curve analysis overcomes these constraints by capturing actual non-equilibrium phenomena that thermodynamic software cannot model. Undercooling, recalescence, and modification-induced temperature shifts (such as 10 °C eutectic depression from strontium treatment) profoundly influence microstructure development yet remain invisible to equilibrium-based calculations. Experimental validation confirms that thermal analysis achieves latent heat accuracy within 5% of DSC measurements while capturing phenomena that computational methods systematically miss.
A single 15–20 min test using standard foundry equipment yields all critical solidification parameters: liquidus and solidus temperatures, dendrite coherency and rigidity points, eutectic formation temperatures, fraction solid evolution, latent heat release, and crack susceptibility indicators. These experimentally determined values replace oversimplified universal criteria, such as the assumption that feeding becomes impossible at a 30% solid fraction, with alloy-specific data that accurately delineate the five feeding mechanisms and predict hot-tearing susceptibility.
The integration pathway is straightforward. Cooling curves recorded under actual casting conditions provide characteristic temperatures from first-derivative analysis, fraction-solid evolution via Newtonian or Fourier methods, and crack-susceptibility coefficients from dendrite coherency and rigidity temperatures. These parameters integrate directly into existing simulation databases without workflow disruption, dramatically enhancing predictive accuracy for shrinkage porosity, microstructure evolution, and hot tearing.
Unlike DSC, which requires expensive equipment and expert interpretation, or thermodynamic software, which demands continuous licensing fees, cooling curve analysis uses equipment already present in most foundries for quality control. This accessibility democratizes precision-casting simulation for foundries of all sizes, enabling real-time process monitoring and melt-quality assessment on the production floor.
As aluminum casting evolves toward complex geometries and tighter tolerances, cooling curve analysis provides the essential mechanism to transform simulation from a design tool into a precision engineering instrument. This hybrid approach, combining computational efficiency with experimental reality, represents the future of aluminum casting technology, enabling foundries to achieve the predictive accuracy necessary for modern manufacturing while maintaining practical industrial applicability. It is important to emphasize that TA measurements are not restricted to a single cooling rate. By employing specialized cooling systems ranging from different crucible materials and masses to active cooling methods like a perforated copper tube with controlled compressed air flow the cooling rate can be dynamically adjusted to match the thermal conditions of various casting wall thicknesses. This flexibility allows TA to provide a robust data matrix for simulation tools, covering both thin and thick-walled sections and bridging the gap between laboratory results and complex industrial geometries.