1. Introduction
Hydrogen fuel cells that can function at intermediate temperatures have received considerable attention [
1,
2,
3] due to their ability to operate under the special conditions needed in many automotive, space exploration, and military applications. A key component of any fuel cell is the electrolyte, a membrane that needs to have the ability to effectively conduct protons [
4,
5,
6]. Nafion
®, a sulfonated tetrafluoroethylene copolymer is the material most used as an electrolyte in large-scale hydrogen fuel cell applications [
7]. Yet, it should be noted that Nafion
® does not conduct protons but hydronium ions (H
3O
+) and, consequently, the membrane needs to stay hydrated at all times. This limits the highest temperature at which the fuel cell can function to about 100 °C. A possible alternative solution is to use electrolytes based on solid acids, MH
nXO
4, where M is a monovalent cation,
n = 1, 2, and XO
4 is a tetrahedral oxy-anion (X = S, P). These compounds do not conduct protons well at room temperature, but some of them are known to exhibit a so-called superprotonic transition, where their proton conductivity, σ, sharply increases by several orders of magnitude upon heating above a temperature threshold, T
sp [
8,
9,
10]. The first solid-acid-based fuel cell used a 1.5 mm thick electrolyte membrane made of CsHSO
4 operating at 150 °C and showed very promising performance parameters [
11]. It was soon realized, however, that some molecular hydrogen (the fuel) always trickles down to the membrane and triggers the sulfur reduction reaction:
This leads to a rapid chemical decomposition of the electrolyte that is accelerated by the generation of the catalyst poison H2S. The proposed solution was to use phosphate-based solid acids, such as CsH2PO4 (CDP) and RbH2PO4 (RDP).
Phosphate solid acids are fully hydrogen-bonded, i.e., they have hydrogen bonds at all four corners of the PO
4 tetrahedra, as opposed to their half hydrogen-bonded sulfate counterparts where just two corners of each SO
4 tetrahedral oxy-anion form hydrogen bonds. This structural difference is significant, as the highly efficient superprotonic conduction mechanism in CsHSO
4 is known to be based on the structure and dynamics of its disordered hydrogen bond network [
12], and theorical studies have shown that this specific mechanism does not necessarily carry over to the fully hydrogen-bonded CDP or RDP [
13]. Consequently, the ability of phosphate solid acids to become superprotonic upon heating and be used as hydrogen fuel cell electrolytes was initially regarded with skepticism, but intermediate-temperature fuel cells have eventually been built using CDP electrolytes in their stable superprotonic state [
14,
15]. Yet, the microstructures and proton diffusion mechanisms that enable CDP to function as an electrolyte have become the subject of intense debate. Some authors attributed the sharp increase in CDP’s proton conductivity above T
sp = 233 °C to a monoclinic → cubic polymorphic phase transition [
16,
17,
18,
19], while others argued that this behavior is due to chemical changes such as polymerization and dehydration [
20,
21]. The main reason for this controversy is that the chemical decomposition of CDP via the dehydration reaction
occurs at temperatures just a few degrees above T
sp = 233 °C [
22], so it is difficult to identify the microscopic origin of the observed proton conductivity increase. Two methods have been proposed and successfully used to prevent the dehydration of CDP at temperatures above 233 °C: (1) keeping the sample under a saturated water vapor atmosphere [
15]; (2) applying high pressure P = 1 GPa during the heating process [
23]. Using these procedures, strong evidence was eventually found that the superprotonic behavior of CDP is due to a polymorphic phase transition from CDP’s room-temperature monoclinic P2
1/m phase to a superprotonic cubic Pm-3m modification [
8,
22]. Furthermore, a method to keep the superprotonic CDP phase stable over a long period of time (>24 h) by sealing the sample in a small volume of dry air (~50 mL) has recently been developed [
24]. Still, the details of the new microscopic dynamics that enable the highly efficient proton conduction in cubic CDP have not been elucidated. One key question is whether this superprotonic conduction mechanism is specific for CDP or is cation-independent, i.e., it stays the same in the high-temperature phases of other phosphate solid acids where the Cs
+ ions are replaced by Rb
+, K
+, or Li
+.
RDP presents a particularly interesting case as its crystal structure in the room-temperature phase is not monoclinic P2
1/m like that of its Cs-based counterpart, but tetragonal I-42d. Yet, temperature-resolved proton conductivity measurements showed sharp increases in proton conductivity in both CDP and RDP upon heating above a temperature threshold. This behavior was observed under high pressure (~1 GPa) at 265 °C for CDP [
23] and 295 °C for RDP [
25]. In addition, more recent studies [
26,
27] demonstrated that KH
2PO
4 (KDP) and RDP undergo polymorphic phase transitions from their room-temperature tetragonal I-42d phase to an intermediate-temperature monoclinic P2
1/m modification. In RDP, this transition occurs at 120 °C even under ambient humidity and pressure conditions. Most significantly, the newly discovered RDP intermediate-temperature monoclinic P2
1/m phase turned out to be isomorphic (structurally identical) with that of room-temperature CDP. This is important because, corroborated with the overwhelming evidence that the superprotonic conduction of CDP is due to a monoclinic P2
1/m → cubic Pm-3m transition, it suggests that a similar structural behavior might occur in RDP and be responsible for its enhanced proton conductivity at high temperatures. Unfortunately, however, there is a knowledge gap in terms of identifying a pure RDP cubic phase as studies have shown that chemical changes according to the reaction
occur as monoclinic RDP is heated within the 200–300 °C temperature range, even when the sample was kept under a saturated water vapor atmosphere [
28].
Here, we present a study where the crystal structure of RDP is monitored upon heating using synchrotron X-ray diffraction (XRD) on powder samples (1) sealed in a quartz capillary, and (2) subjected to high pressure applied using a piston press. We also carried out temperature-resolved ac-impedance spectroscopy (AIS) measurements on RDP and CDP samples sealed in a small volume of dry air. We found that sealing the sample prevents dehydration. Moreover, after the first transition (from tetragonal to monoclinic) the P21/m monoclinic RDP phase persists as the sample is heated towards its melting point. This is consistent with the AIS results that show a gradual increase in proton conductivity upon heating from 180 to 260 °C, but not the three-order-of-magnitude superprotonic jump observed in CDP within the same temperature range. Other important results come from the full profile analysis of the XRD data collected on RDP under high pressure (P = 1 GPa). In this case, we found a different structural behavior: at Tsp = 300 °C compressed RDP shows evidence of a polymorphic phase transition to a high-temperature cubic phase (Pm-3m, a = 4.784 Å) that is isomorphic with its CDP counterpart. This is highly significant, as it indicates that the superprotonic conduction in phosphate solid acids is not cation-specific, and a general highly efficient proton conduction mechanism is present in the high-temperature phases of these materials.
2. Materials and Methods
Two methods were used to synthesize the RDP powders used in this study. The first is a co-precipitation method, where rubidium carbonate Rb2CO3 and phosphoric acid H3PO4 were mixed in stoichiometric amounts to achieve a 1 mol Rb: 2 mol P ratio. Rb2CO3 was initially dissolved in deionized water and then H3PO4 was slowly added. Once the reaction occurred, a clear RbH2PO4 solution was left. Next, methanol was added dropwise to induce precipitation. Finally, the precipitate was filtered, further washed with methanol several times, and dried overnight at a temperature of 75 °C. Alternatively, RDP single crystals were synthesized via slow evaporation, where the as-prepared RbH2PO4 solution was placed in a beaker and left to evaporate in dry air. Crystals formed upon evaporation in two weeks. For both methods, the last step was to grind the resulting crystals into a fine RbH2PO4 powder. CDP powders were synthesized using the same methods as those described above with the sole difference that Cs2CO3 was used instead of Rb2CO3.
Temperature-resolved ac-impedance spectroscopy measurements were carried out within the 150–260 °C temperature range on cylindrical pellets pressed from RDP and CDP powders. In all measurements, silver paint sprayed on both sides of the pellet and platinum mesh electrodes were used. The pellets were sealed in a 50 mL chamber filled with dry air and linked by feedthrough contacts to a Solartron 1260 impedance analyzer (Advanced Measurement Technology, Inc., Oak Ridge, TN, USA) operating at a 100 mV oscillating potential in a two point–four wire setup. At each temperature, both the in-phase and the out-of-phase components of the impedance, Z′ and Z″, were recorded at frequencies between 6 MHz and 100 Hz.
Powder X-ray diffraction (XRD) measurements using synchrotron X-ray radiation were performed at the National Synchrotron Light Source, Brookhaven National Laboratory. In the first set of experiments, the powder RDP samples were placed in a 1 mm thick quartz capillary and diffraction patterns were collected using X-rays of λ = 0.922 Å in the transmission geometry at different temperatures ranging from room temperature to 260 °C. A MAR 2300 area detector perpendicular (RAYONICS GmbH, Neumünster, Germany) to the direction of the incident beam recorded images of the Debye–Scherrer cones’ projections. These were then processed using the Fit 2D V10.132 software into typical I vs. 2θ powder diffraction patterns. A second set of temperature-resolved XRD experiments were carried out on RDP powders compressed at a pressure of ~ 1 GPa using a piston-type pressure cell with boron nitride slabs acting as pressure-transmitting media. White radiation was used in conjunction with an energy-sensitive detector placed at a fixed 2θ position to record I vs. d-spacing diffraction patterns at different temperatures up to 300 °C.
3. Results and Discussion
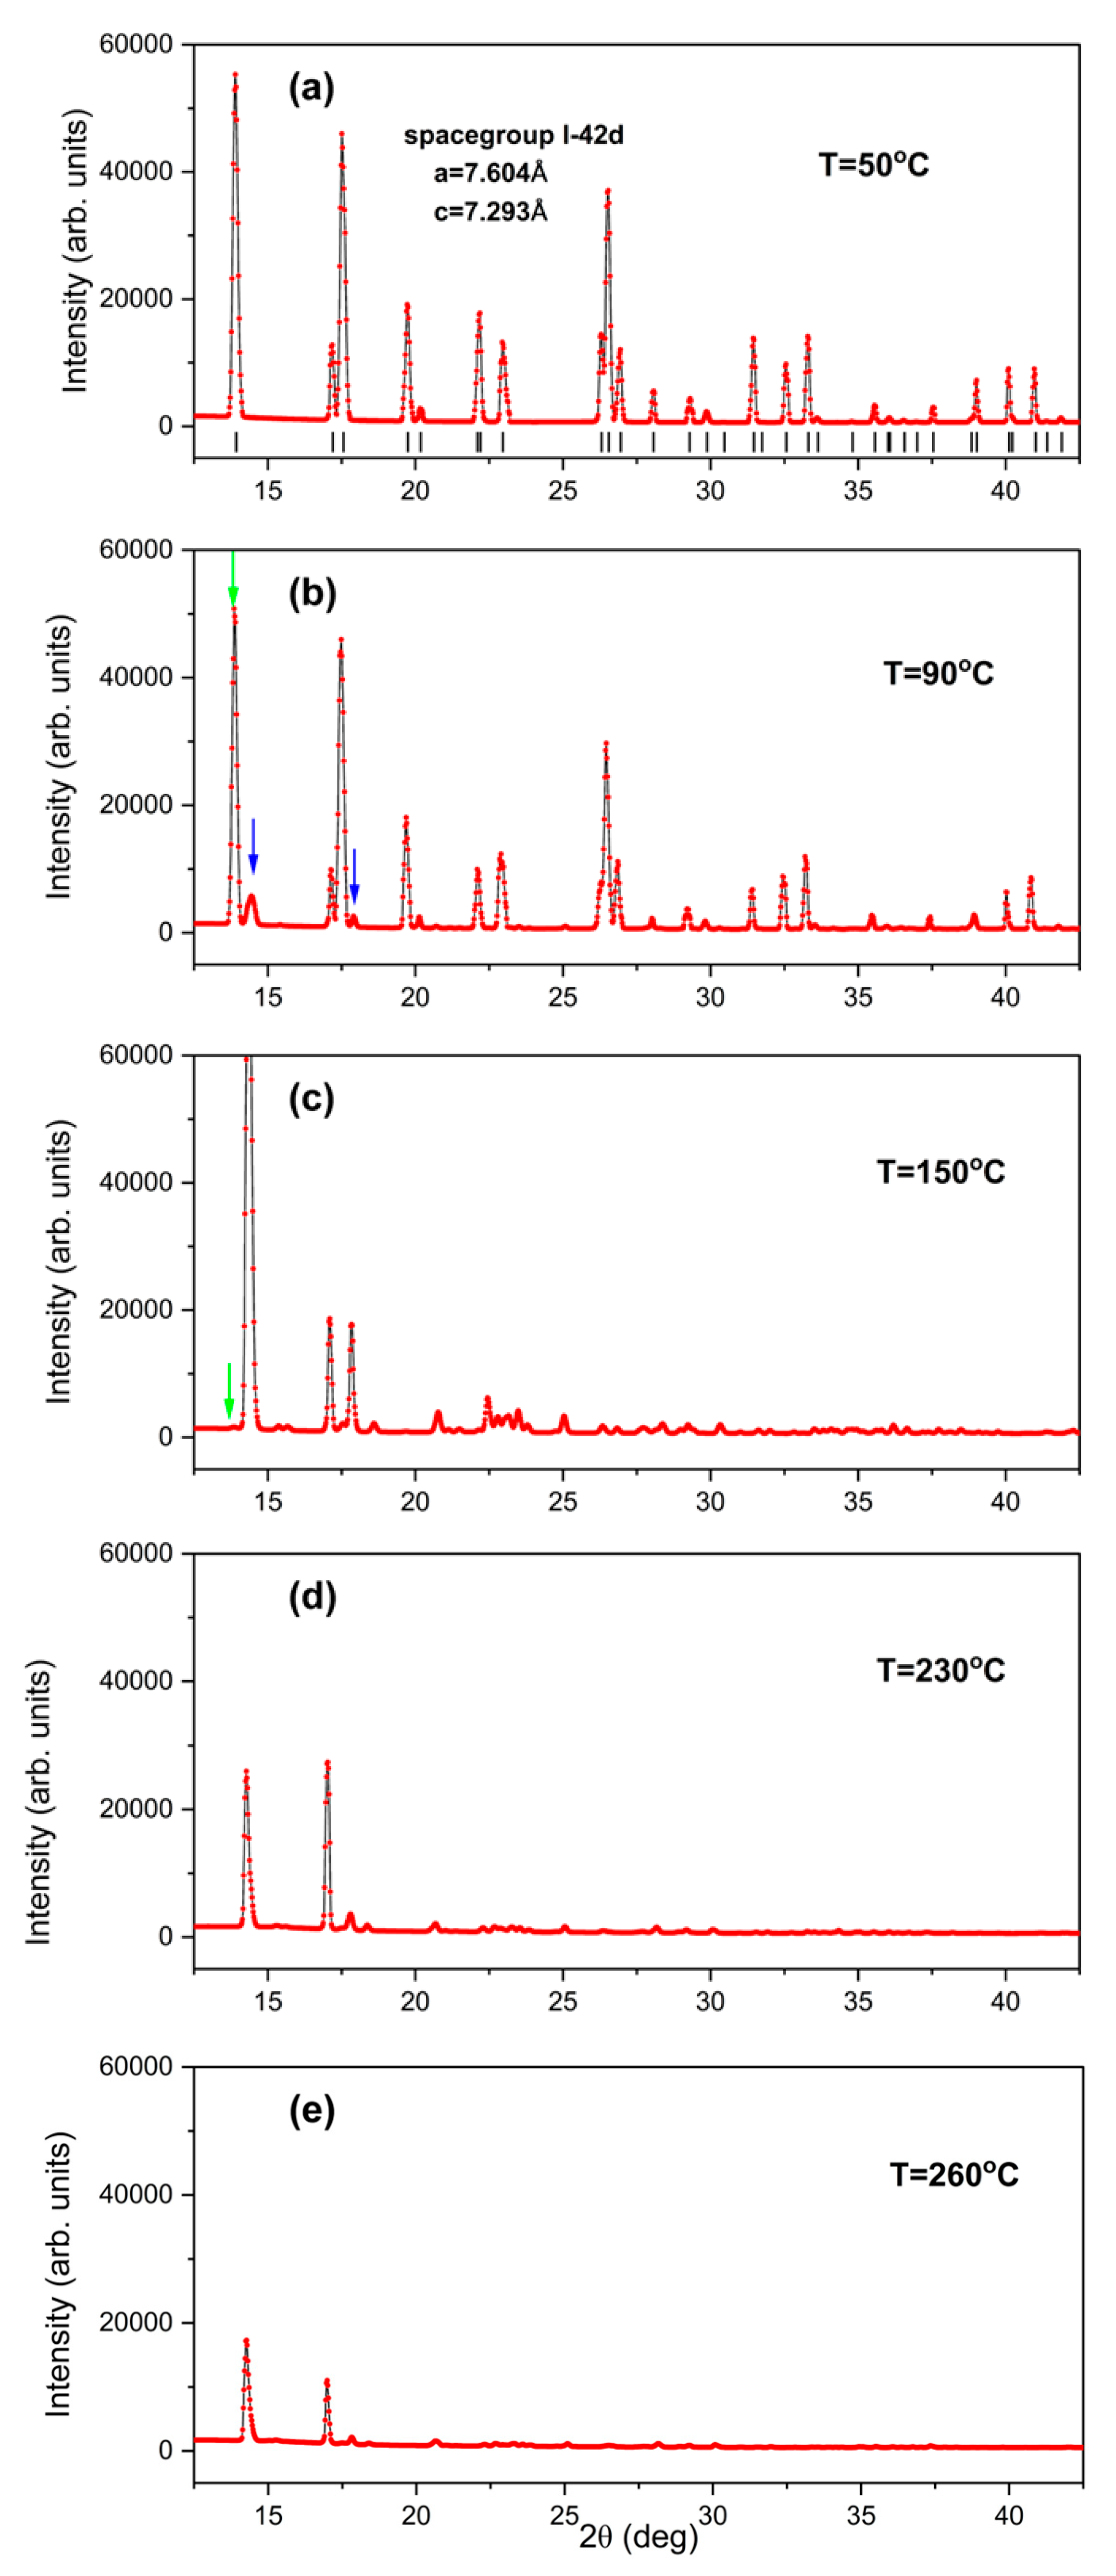
Figure 1 shows the evolution of the powder XRD pattern recorded within the 12.5–42.5 deg 2θ range on RDP samples sealed in quartz capillaries as the temperature increased (at a rate of 2 °C/min) from 50 °C to 260 °C. The as-prepared RDP powders crystallize in the tetragonal symmetry: space group I-42d and lattice constants a = 7.604 Å and c = 7.293 Å. This is confirmed by the XRD pattern in
Figure 1a, where the red symbols are the I vs. 2θ data and the vertical bars mark the positions of the Bragg reflection from the above-mentioned tetragonal lattice. Notably, all of the observed reflections are indexed and there are no extra peaks, which confirms the quality and the purity of the powder samples used in this study. We used the full width at half maximum of the (103) peak FWHM = 0.19 deg. located at 2θ = 22.96 deg. to determine the average grain size of the RDP powders using Scherrer’s formula
. We found <D> = 26 nm. Heating to 90 °C leads to the first changes in the powder diffraction pattern. As shown in
Figure 1b, the I vs. 2θ data recorded at this temperature still shows all the reflections from the room-temperature tetragonal RDP phase, but new robust peaks are appearing, e.g., at 14.3 deg and 18.2 deg as shown by the blue arrows. At 150 °C the tetragonal I-42d RDP phase completely vanishes, as demonstrated by the absence of its strongest peak (at 13.75 deg) in the I vs. 2θ data shown in
Figure 1c, where a new XRD pattern is present. The most significant feature of the data recorded upon further heating to 230 °C (
Figure 1d) and then to 260 °C (
Figure 1e) is a gradual and significant reduction in the peak intensities. Moreover, no powder diffraction pattern could be recorded at 290 °C, which demonstrates that there are no crystalline phases present in the sample at this temperature. Several studies have indicated that chemical changes (via dehydration) occur in RDP upon heating at temperatures below its melting point [
29]. On the other hand, it was recently found that heating CDP powders sealed in dry air prevents dehydration and enables the polymorphic phase transition that triggers the superprotonic behavior in this phosphate solid acid [
24]. It is therefore important to further investigate the effect of heating under a sealed environment on the microstructure and macroscopic proton conduction of RDP and compare it with its CDP counterpart.
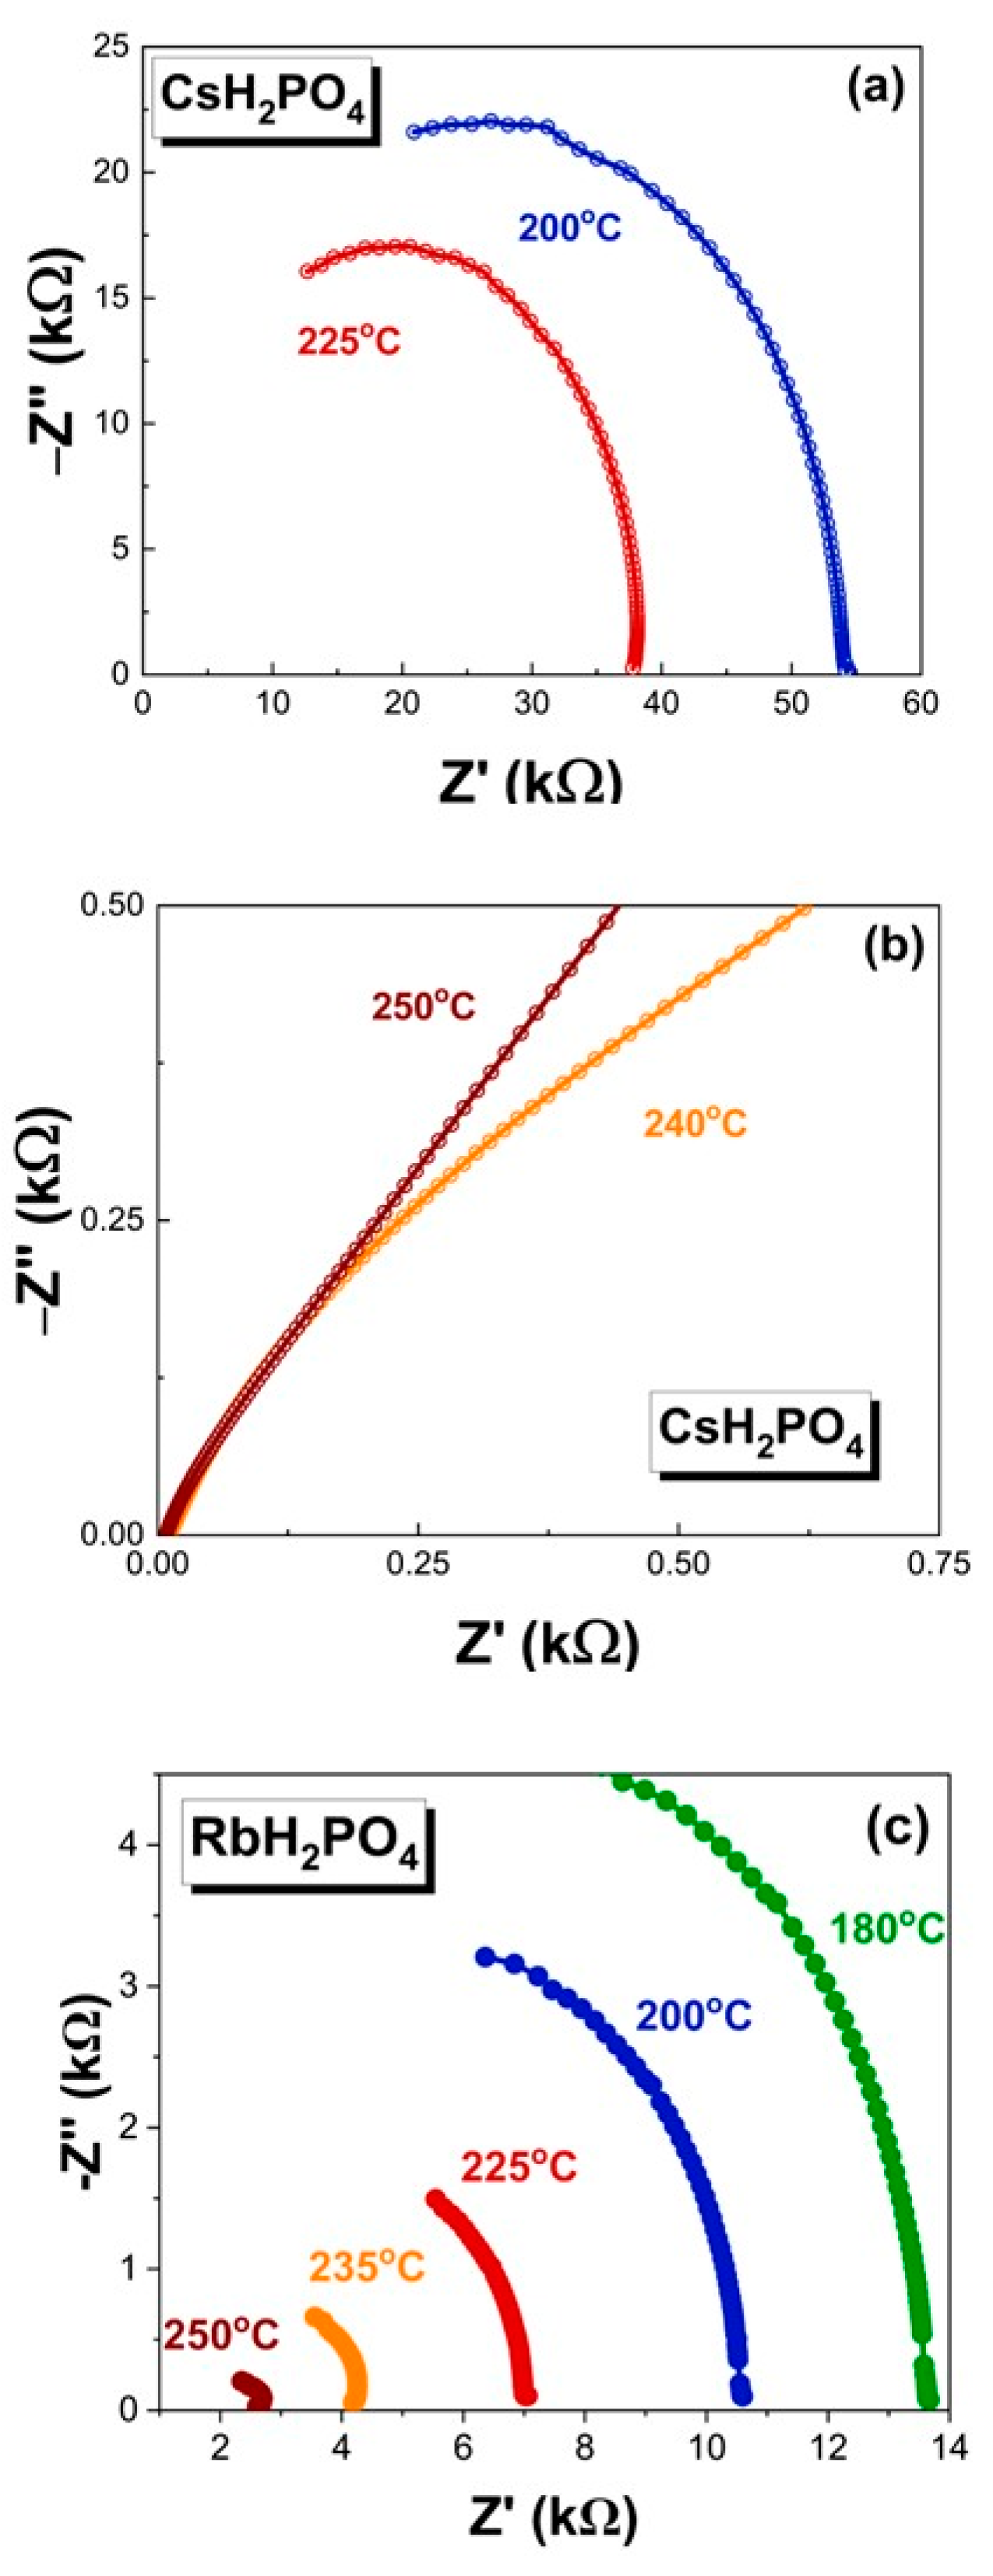
Figure 2a,b show Nyquist plots (out-of-phase Z″ vs. in-phase Z′ ac impedance at different frequencies) measured on CDP at 200 °C (blue symbols), 225 °C (red symbols), 240 °C (maroon symbols), and 250 °C (orange symbols). In all four cases the samples are pellets pressed from CDP powders and kept sealed in 50 mL of dry air during the measurement. Clearly, the most striking feature of these data is the difference between the Nyquist plots recorded at 200 °C and 225 °C and those measured at 240 °C and 250 °C. The former are semicircles where the Z″ vs. Z′ dependence can be modeled using RC circuits [
30]. The proton conductivity, σ, was determined from the intersection of the Nyquist plot with the horizontal (Z′) axis at high frequencies and the size of the pellet according to σ = L/(R·A). L is the sample thickness, R is the resistance (determined from the Z′ intercept), and A is the area of the electrodes. We found σ (200 °C) = 3.4 × 10
−6 S/cm and σ (225 °C) = 5.05 × 10
−6 S/cm. At higher temperatures, the shape of the Nyquist plots changes significantly. They become nearly straight segments that intersect the horizontal axis at very low Z′ values that yield a proton conductivity value σ (240 °C) = 1.7 × 10
−2 S/cm, more than three orders of magnitude higher than the values observed at lower temperatures.
This is consistent with the monoclinic P2
1/m to cubic Pm-3m superprotonic phase transition observed in CDP powders sealed in quartz capillaries at T
sp = 233 °C [
22]. RDP, however, shows a markedly different behavior.
Figure 2c presents Nyquist plots measured on RDP pellets sealed in 50 mL of dry air at five different temperatures: 180 °C (green symbols), 200 °C (blue symbols), 225 °C (red symbols), 235 °C (maroon symbols), and 250 °C (orange symbols). All five datasets have shapes similar to one another and although the proton conductivity increases with increasing temperature, the increase is gradual, from σ (180 °C) =1.35 × 10
−5 S/cm to σ (250 °C) = 6.67 × 10
−5 S/cm, with no superprotonic jump. This behavior occurs in the same temperature range as that corresponding to the powder XRD patterns in
Figure 1c–e, i.e., after the first transition that is complete at 150 °C. Consequently, the thermally activated proton conduction occurs in an ordered P2
1/m RDP phase that is isomorphic to its CDP counterpart. This is markedly different from the superprotonic conduction (
Figure 1b), where the PO
4 tetrahedra are dynamically disordered [
22]. Their libration couples with the oscillations of the protons within the disordered hydrogen bonds, which dramatically enhances the proton conductivity. Next, we analyze the microstructural changes that correspond to the observed proton conductivity data.
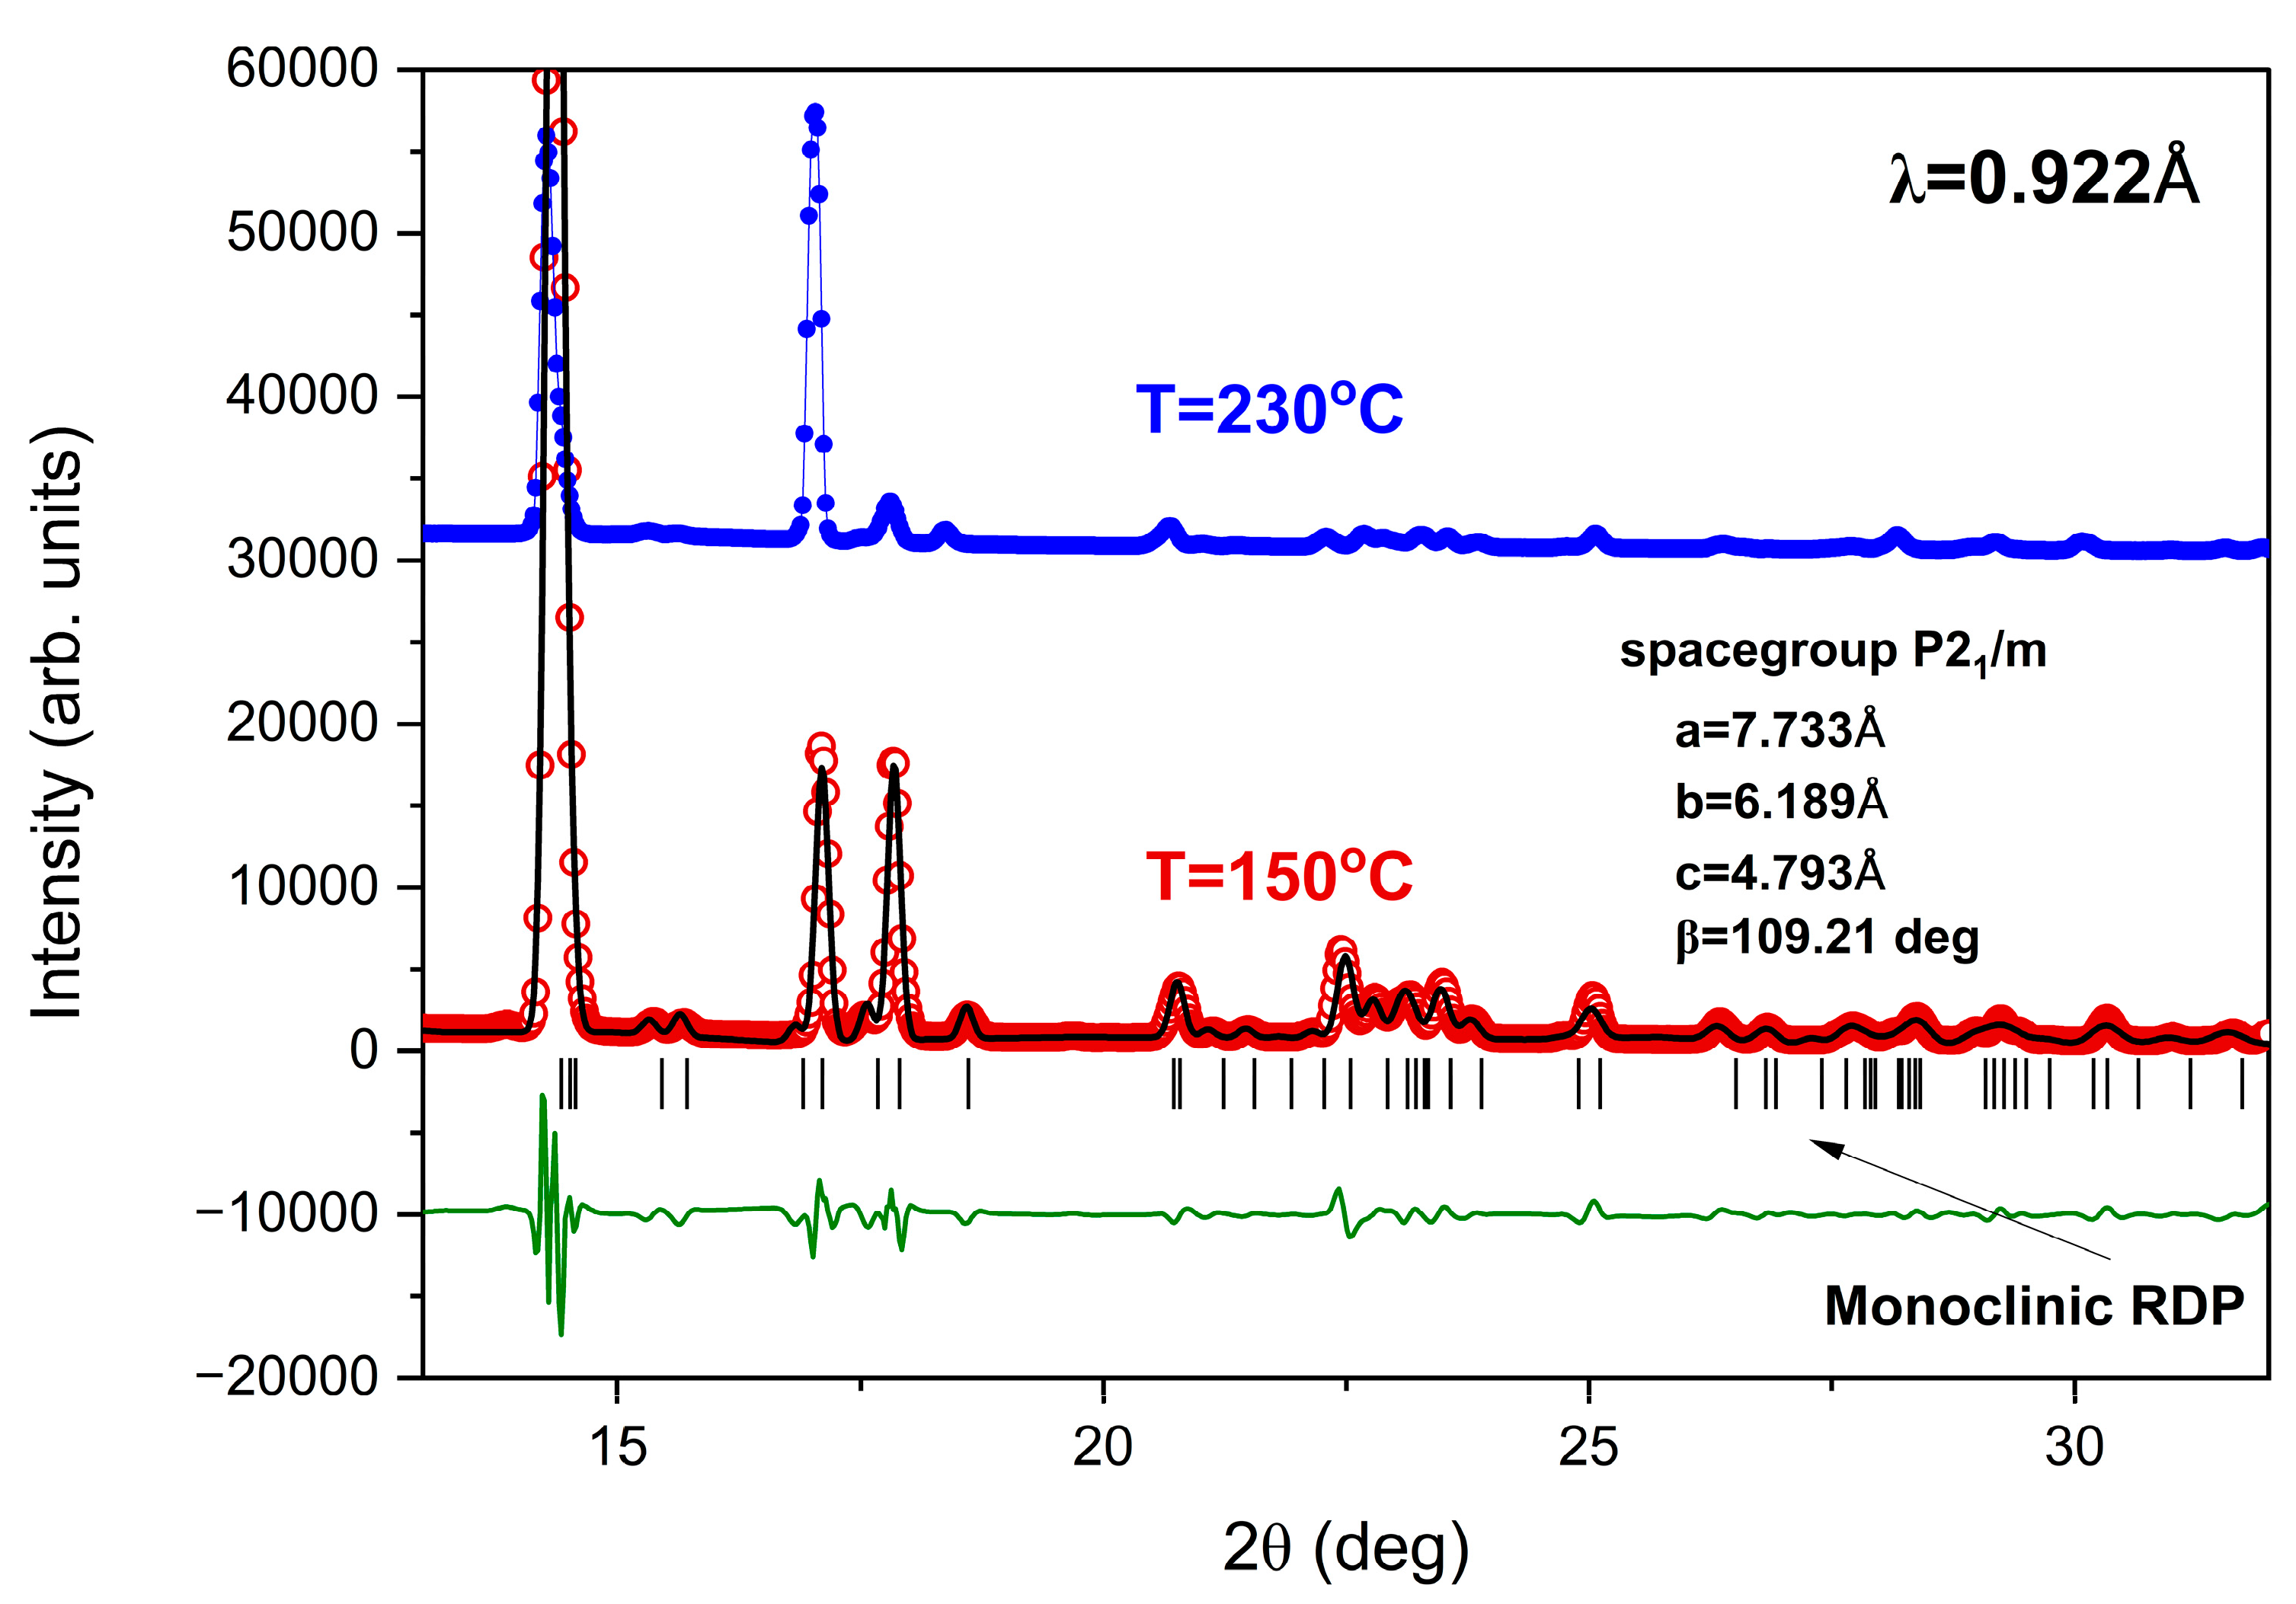
The two datasets (solid symbols) in
Figure 3 represent the intensity vs. detector angle XRD patterns recorded on RDP powders at two different temperatures, T = 150 °C and T = 230 °C, under the same sample environment (sample sealed in dry air) as that used to collect the ac-impedance spectroscopy data shown in
Figure 2c, described above. We analyzed the data measured at 150 °C using a full profile (Le Bail) fit against the observed XRD pattern, I
obs vs. 2θ (blue disks). The solid black line represents the best fit to a model based on a monoclinic lattice: space group P2
1/m and unit cell parameters a = 7.733 Å, b = 6.189 Å, c = 4.793 Å, and β = 109.21 deg.
The fit converged under the simultaneous variation in seven parameters: the four lattice parameters mentioned above, the “zero” of the I vs. 2θ dataset, and two parameters that characterize the pseudo-Voigt function used to model the Bragg peak profiles. The whole-pattern residual corresponding to the best fit is R
wp = 17.1. The vertical bars indicate the angular positions of the Bragg reflections from the monoclinic RDP phase as they result from the Le Bail fit. The powder XRD data collected at the higher temperature T = 230 °C (red disks) presents two important features. First, the overall intensity is significantly reduced, which indicates that the melting of the crystalline RDP phase has initiated. Second, and most significantly, all the peaks are indexed by the Bragg reflection markers (vertical bars) proven to belong to the monoclinic P2
1/m phase, despite some significant preferred orientation that modifies the relative peak intensities. This demonstrates that monoclinic RDP persists upon heating up to the melting point if the sample is sealed in dry air. This behavior is different from previous observations based on experiments where heating was performed under other sample environments and dehydration/chemical changes in RDP preceded melting [
28,
29].
Other significant results came from powder XRD measurements performed on RDP samples subjected to a pressure of 1 GPa. The rationale for carrying out such measurements is twofold. First, this method was used to unambiguously establish that the superprotonic transition in CDP is due to a monoclinic P21/m → cubic Pm-3m polymorphic phase transition [
22]. Second, impedance spectroscopy measurements carried out on RDP under 1 GPa of pressure do show evidence of a superprotonic behavior, i.e., a two-order-of-magnitude sudden increase in its proton conductivity when heated to ~300 °C [
25], a behavior that is not present in RDP under ambient pressure [
26] or, as shown here, when the sample was sealed in a small volume of dry air. Notably, this is different from CDP where a stable superprotonic (cubic Pm-3m) phase was observed in hermetically sealed samples [
31].
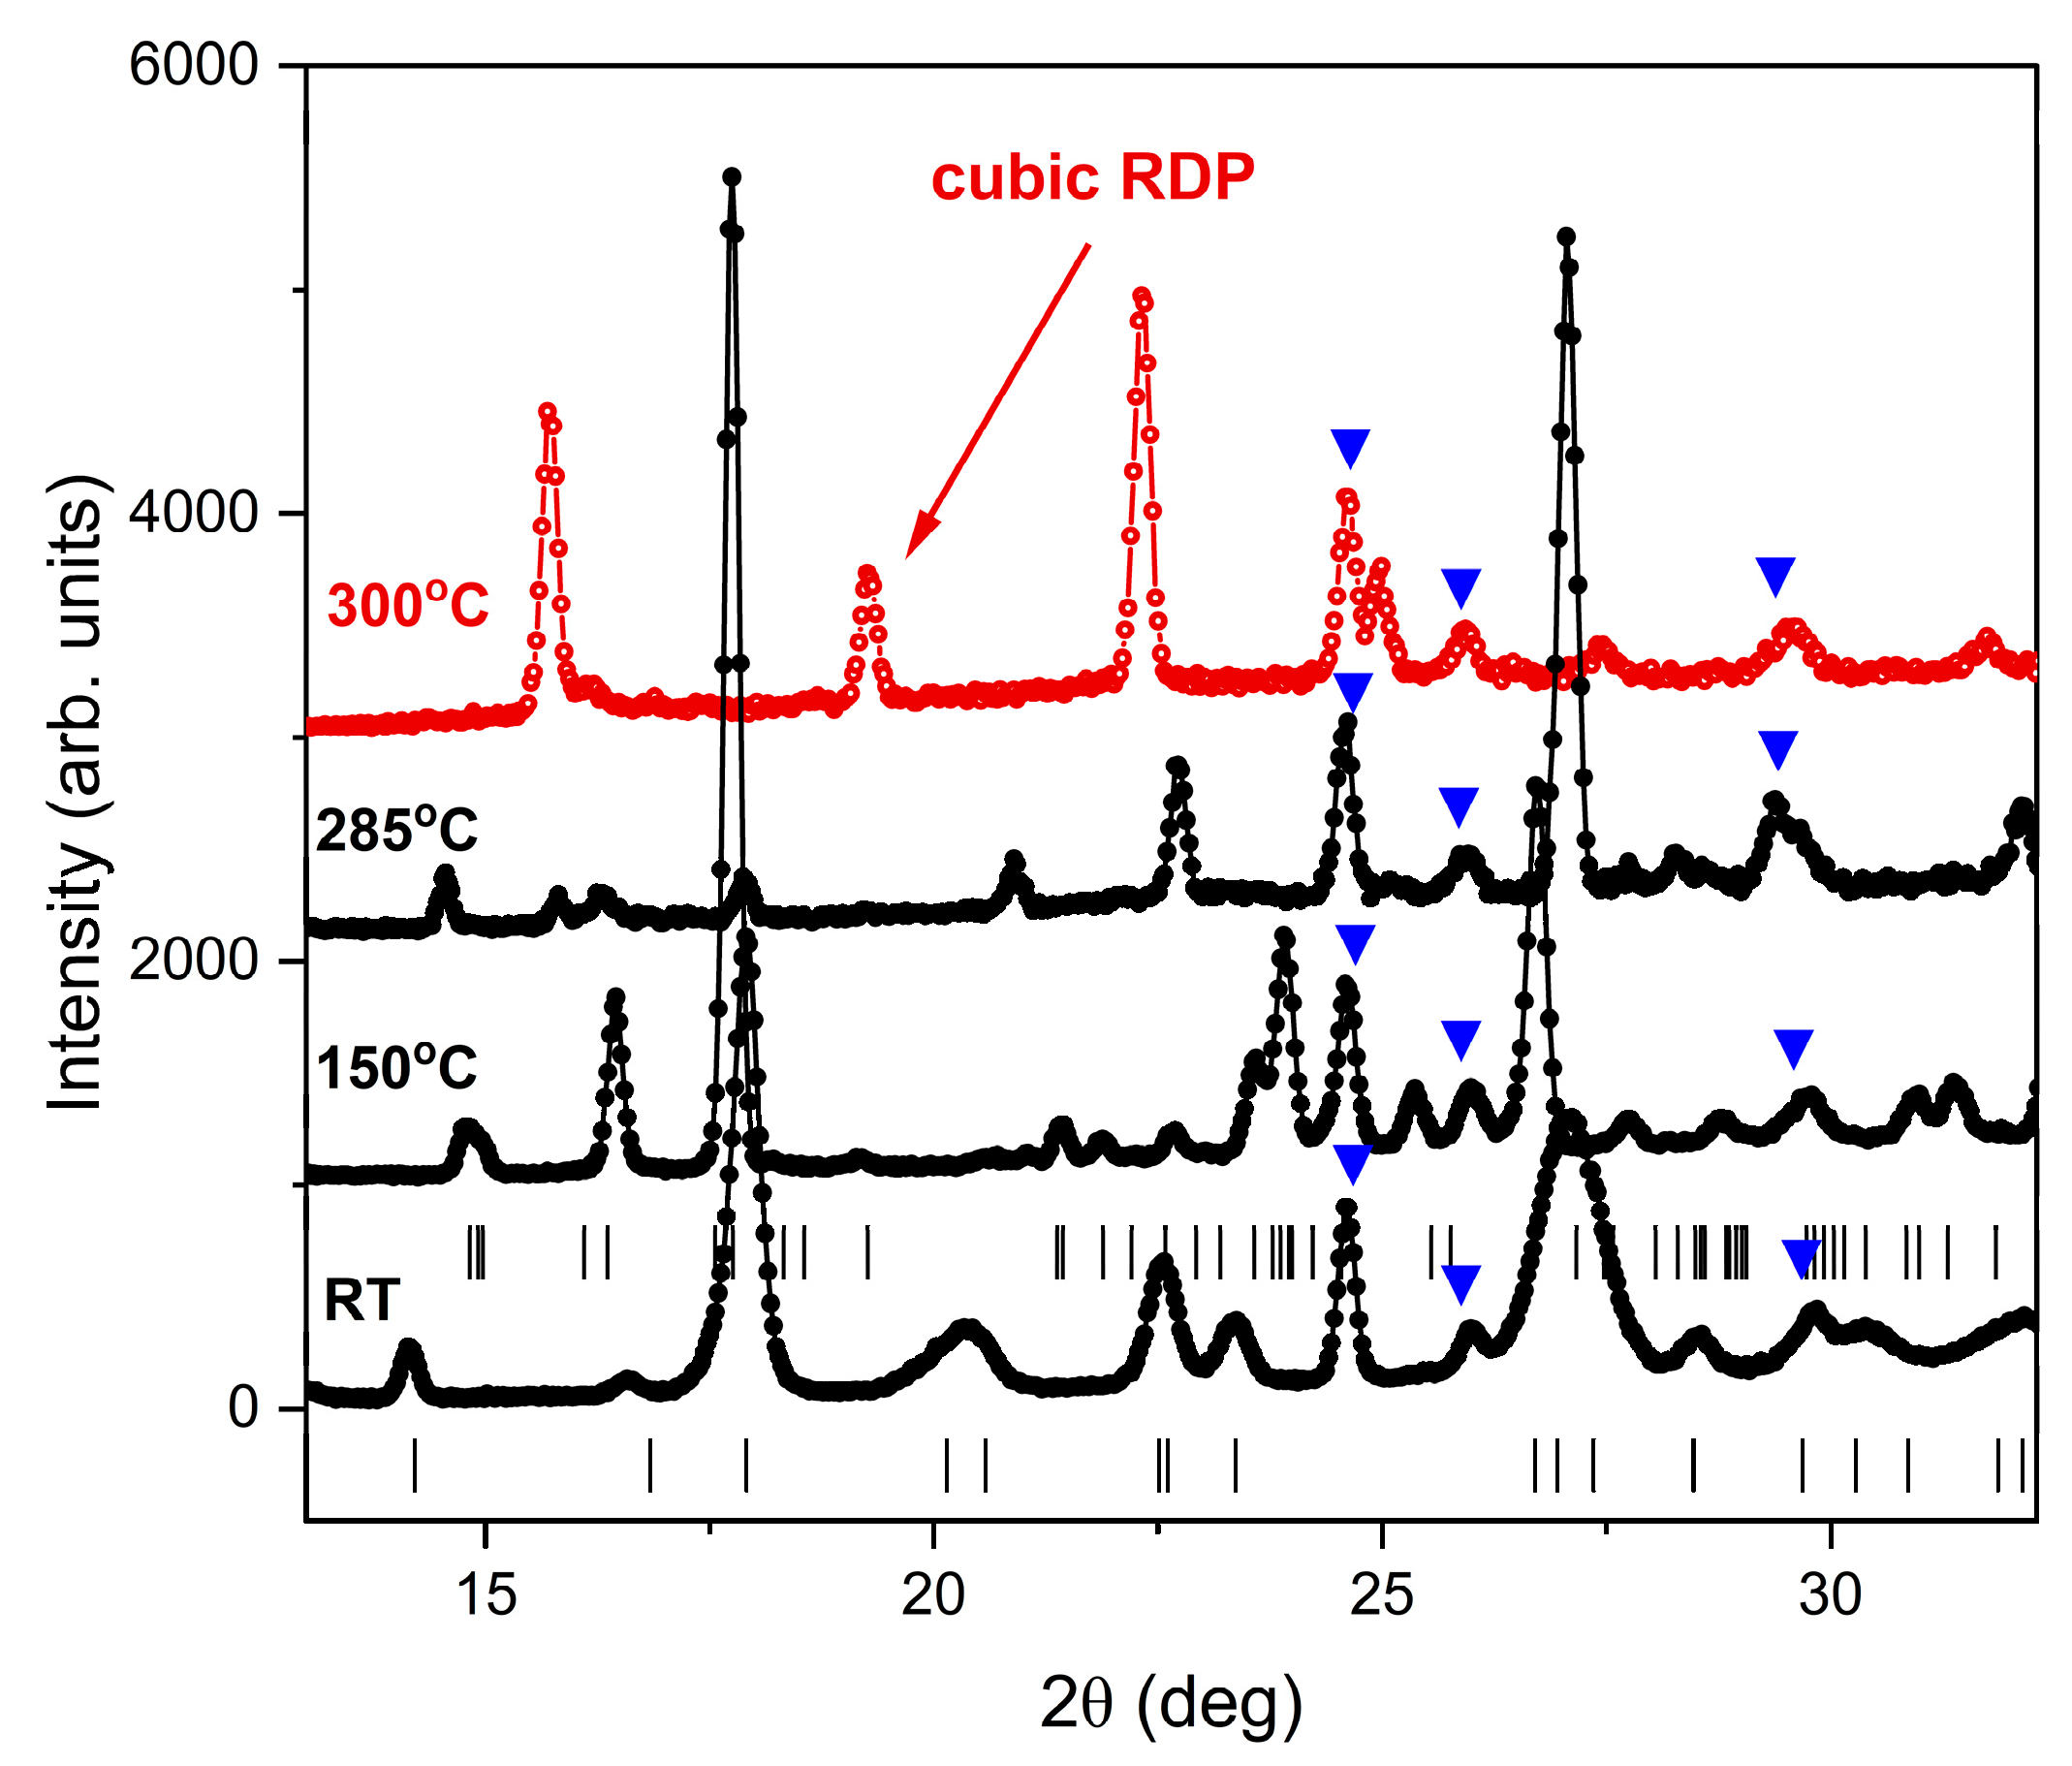
Figure 4 shows powder XRD data collected at four different temperatures on CDP under a pressure of 1 GPa.
As described in more detail in
Section 2, a white X-ray beam and an energy-sensitive detector were used; thus, the raw data were collected in the I vs. d-spacing format. We then used Bragg’s law 2sin[(2θ)/2] = nλ (with λ = 0.922 Å) to convert to the I vs. 2θ format to enable an easier comparison with the ambient pressure powder XRD measurements discussed before. In all four datasets, there are several peaks—marked by inverted blue triangles—that belong to Rb fluorescence, W (from the W/Re thermocouple) and boron nitride (which is used as a pressure-transmission medium). These peaks will be disregarded in the analysis below. The first two datasets at room temperature (RT) and 150 °C correspond to the tetragonal I-42d and the monoclinic P2
1/m RDP phase, respectively. This behavior is similar to that observed in a sealed environment. At higher temperatures, however, the application of high pressure has a very strong impact. First, there is no reduction in the overall intensity under 1 GPa of pressure, indicating that the sample crystallinity persists with no evidence of melting. Furthermore, at T = 285 °C, the powder XRD pattern still shows peaks from monoclinic RDP, but new reflections appear indicating that one (or more) crystalline phase(s) grow in the sample. Most significantly, at 300 °C, the I vs. 2θ dataset (red symbols) changes dramatically into a pattern that includes just a few Bragg reflections, indicating the possibility of a transition to a high-symmetry crystalline phase, possibly cubic. This hypothesis is supported by the fact that CDP’s and RDP’s intermediate-temperature P2
1/m phases are isostructural and that CDP’s superprotonic behavior is due to a monoclinic P2
1/m → cubic Pm-3m polymorphic phase transition. Consequently, it is important to investigate in more detail the 300 °C powder XRD data recorded under high pressure.
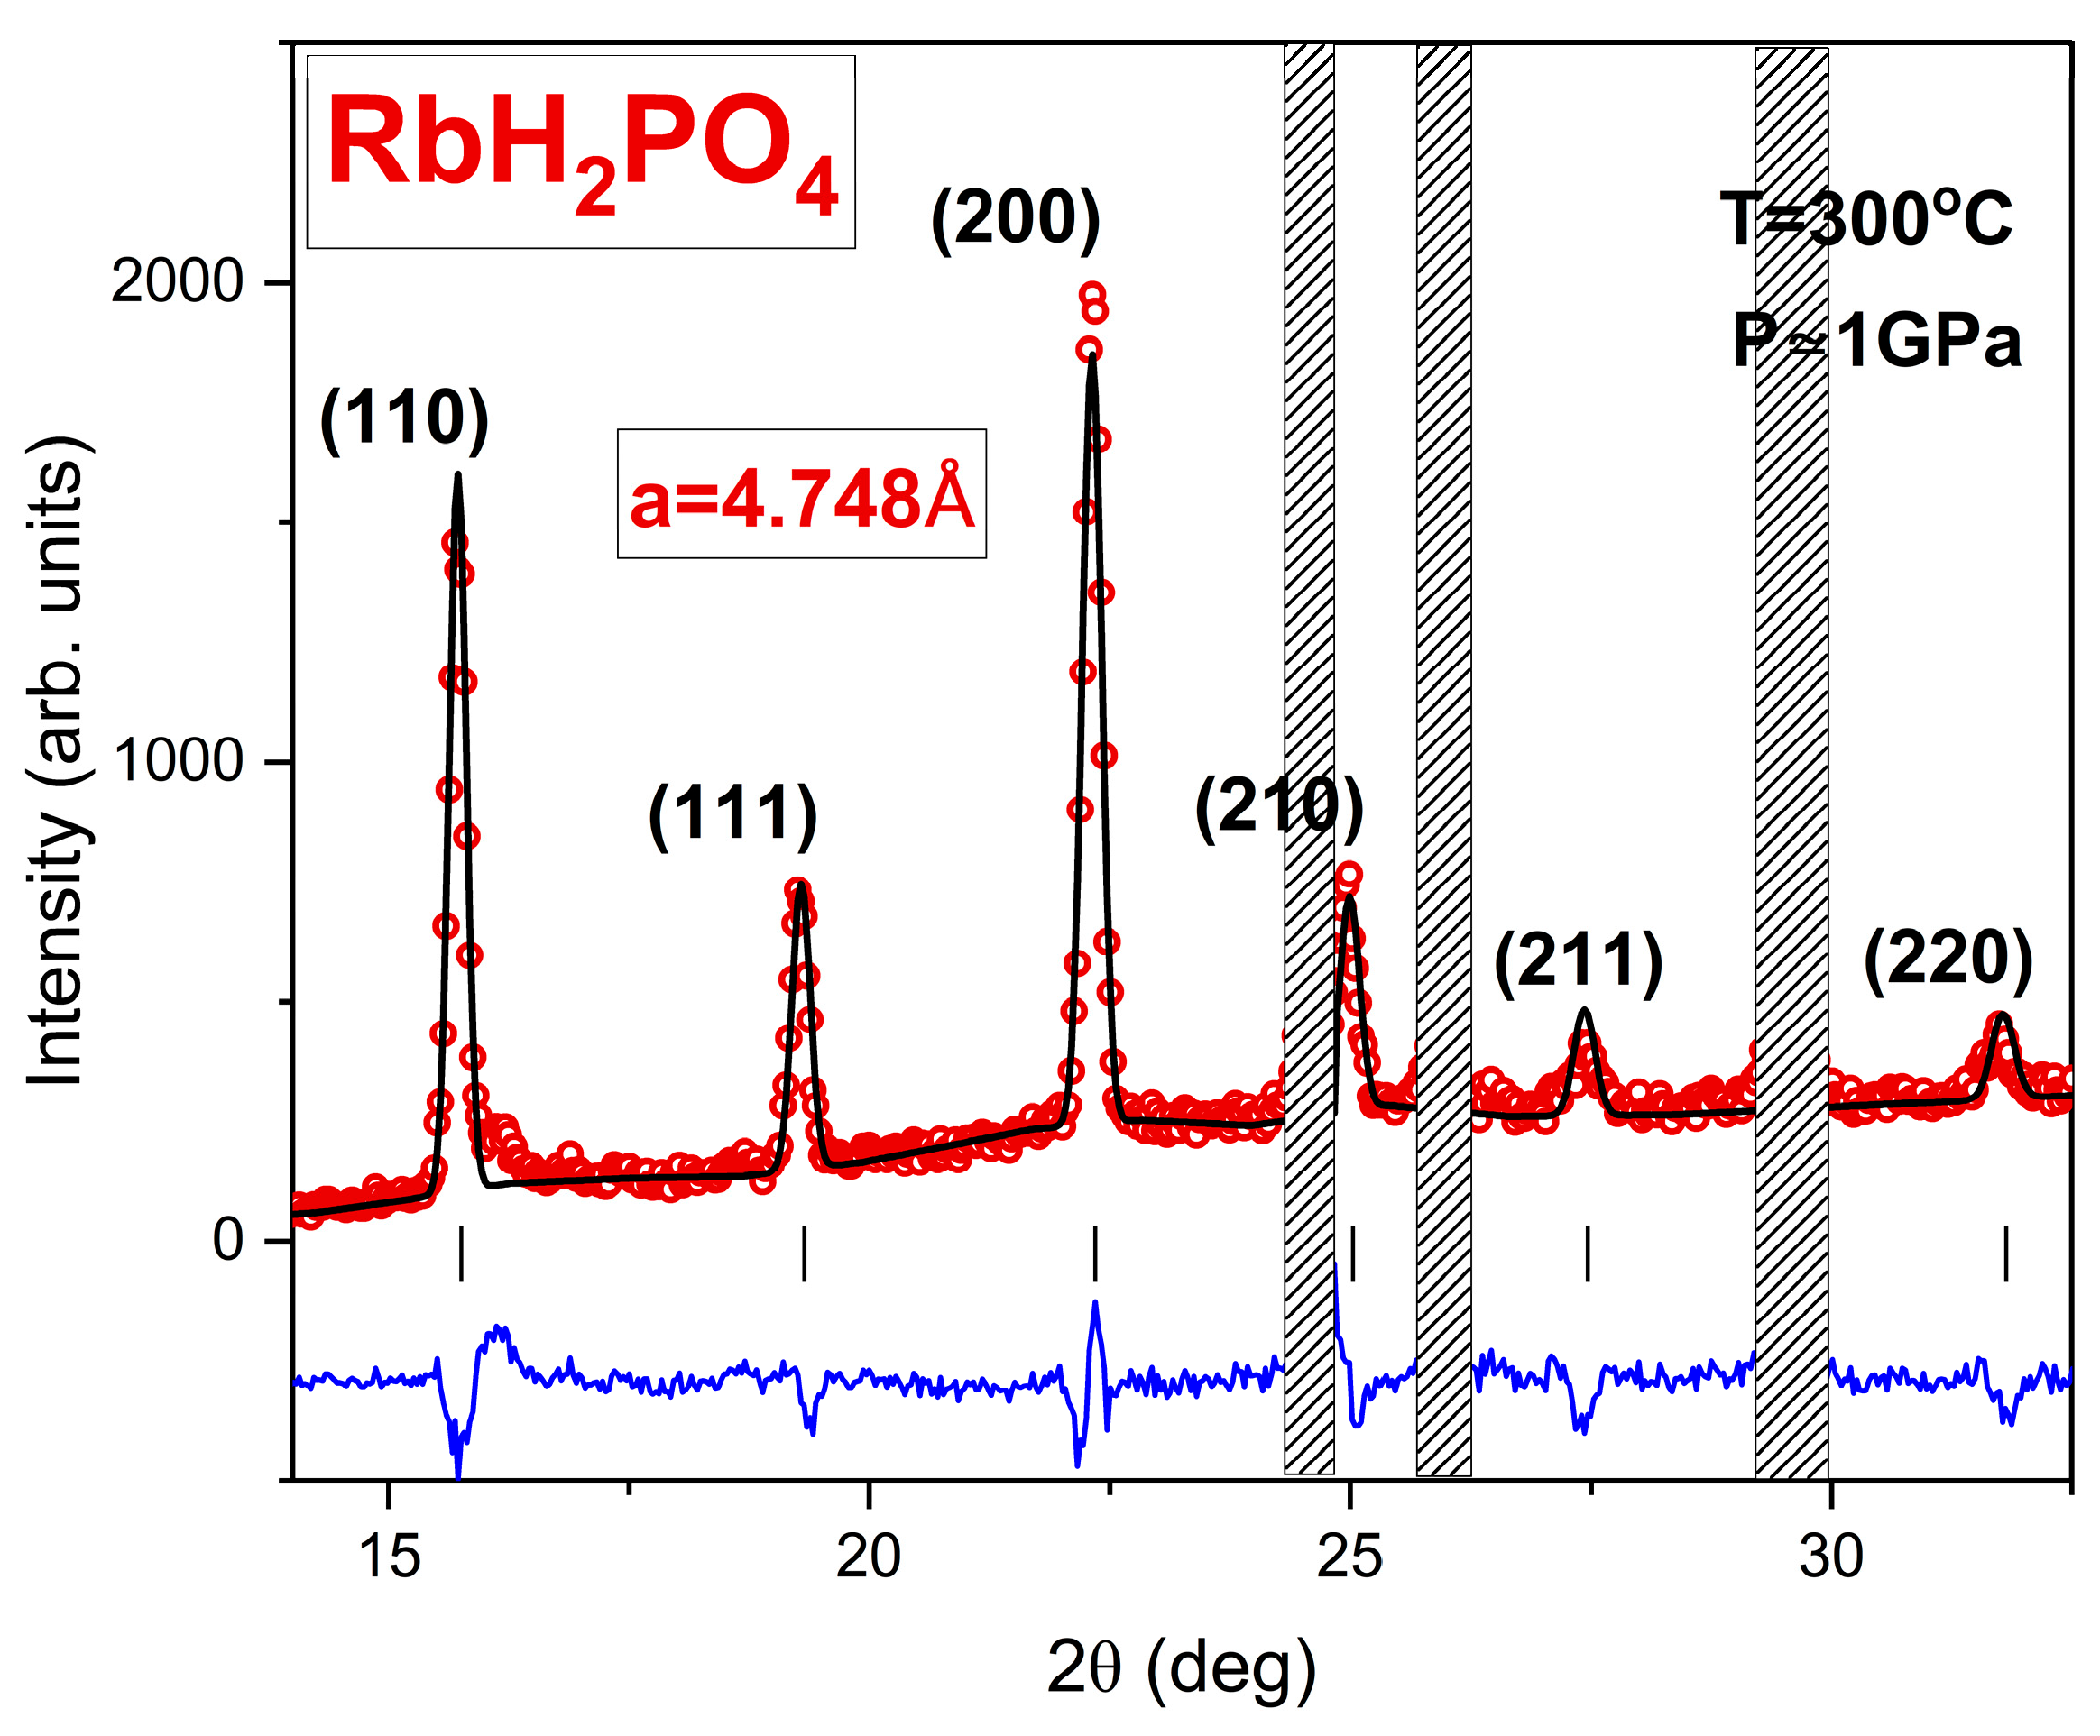
The red symbols in
Figure 5 represent the X-ray intensity, I, from an RDP powder kept at T = 300 °C under a pressure p = 1 GPa as a function of the detector angle, 2θ, corresponding to a wavelength of 0.922 Å.
The shaded areas represent excluded regions corresponding to the Rb fluorescence, W reflections, and boron nitride reflections described above, leaving only the diffraction (Bragg) peaks from RDP in the pattern. We used the full profile of the XRD pattern to analyze these data. First, we fit the six peaks individually to accurately determine their 2θ values and use this information to index the XRD pattern. The indexing process yielded a cubic lattice of space group Pm-3m and lattice constant a = 4.75 Å. The numbers in parentheses in
Figure 5 show the (hkl) Miller indices of each of the six peaks. The next step was to carry out a full profile refinement, where the lattice parameter and the peak profile parameters were adjusted iteratively to reach the best agreement between the observed and the calculated curves I
obs vs. 2θ and I
calc vs. 2θ, respectively. The refinement converges upon the simultaneous variation in five parameters and the best fit (represented by the black curve) yields a value a = 4.748 Å for the refined lattice parameter. Corroborated with the observation of a steep proton conductivity increase under the same pressure and temperature conditions (p = 1 GPa and T ~ 300 °C) [
25], our results indicate that the same, already known monoclinic P2
1/m → cubic Pm-3m polymorphic phase transition [
31,
32,
33] might be responsible for the superprotonic transition in both RDP and CDP. In turn, this means that the mechanism that enables the highly efficient proton transport in these phosphates is cation-independent. As discussed in the introduction, this mechanism is different from the one observed in the sulfate-based compounds. Consequently, the cubic (Pm-3m) phases of fully hydrogen-bonded phosphate solid acids allow superprotonic transport via a new general mechanism that might carry over to other important functional materials such as polymers and intercalation compounds.