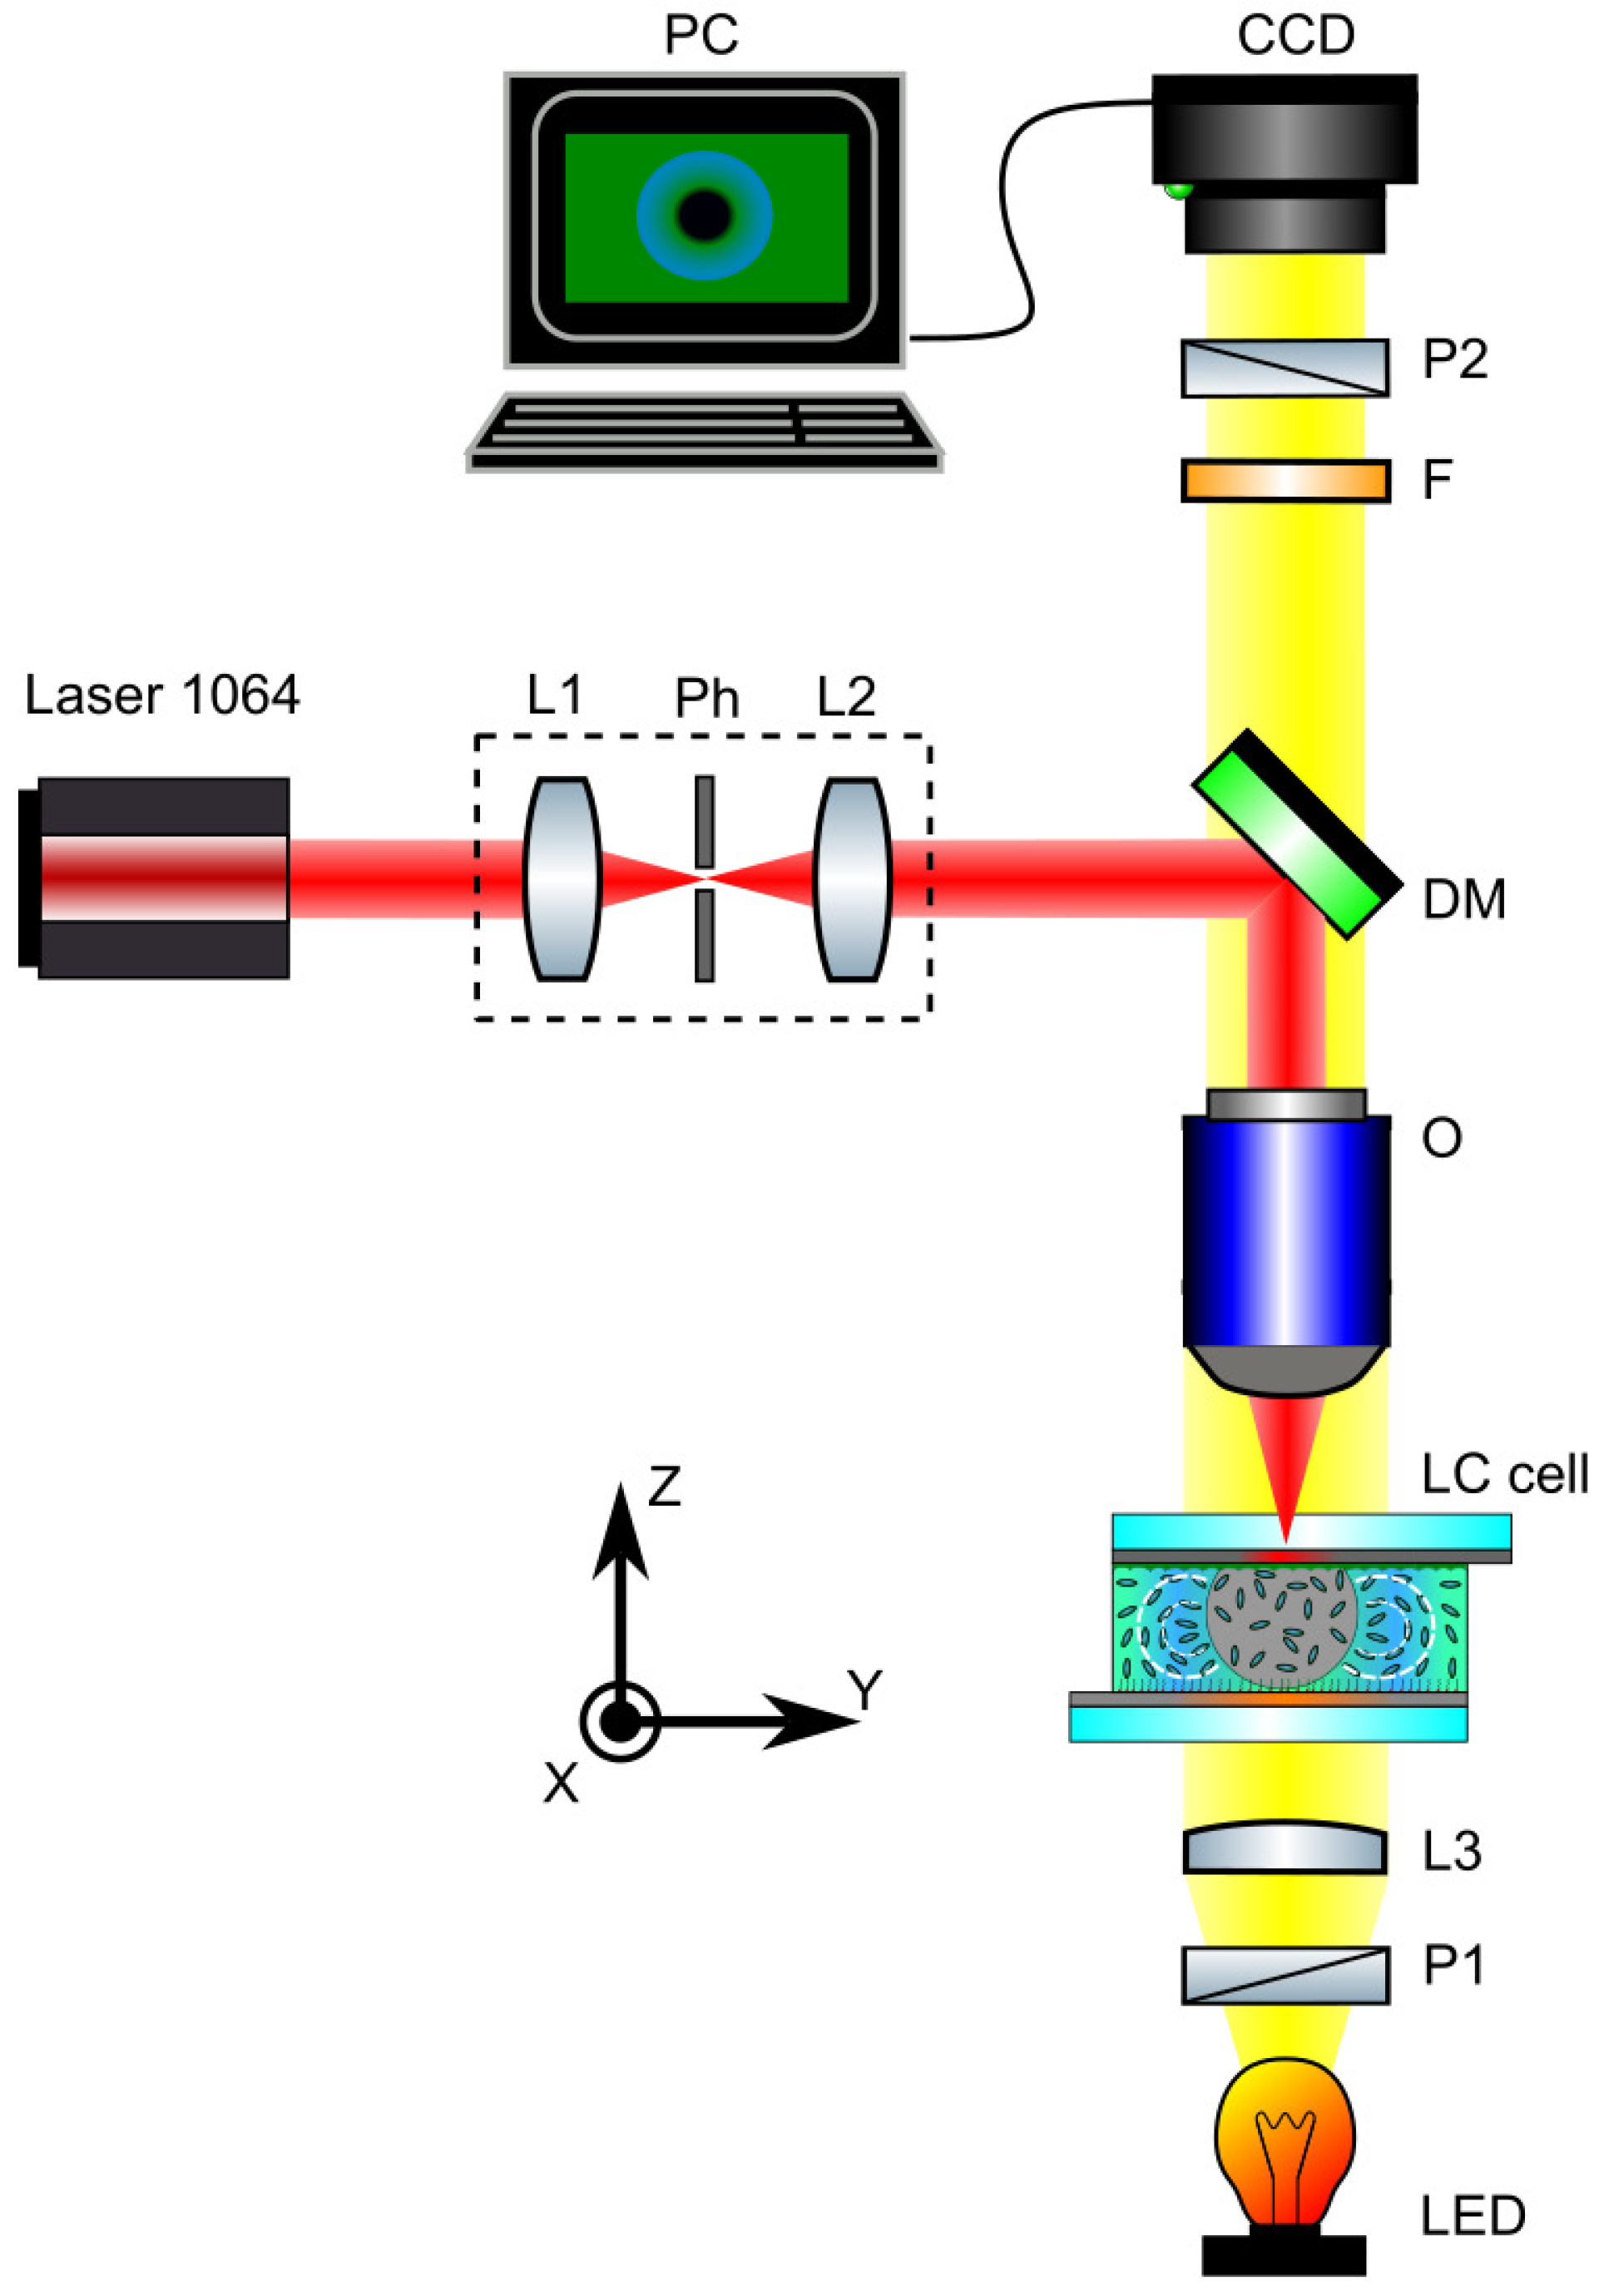
3.1. Laser Beam Heating of Nematic Sample
Under the effect of the electrode heating with the laser power
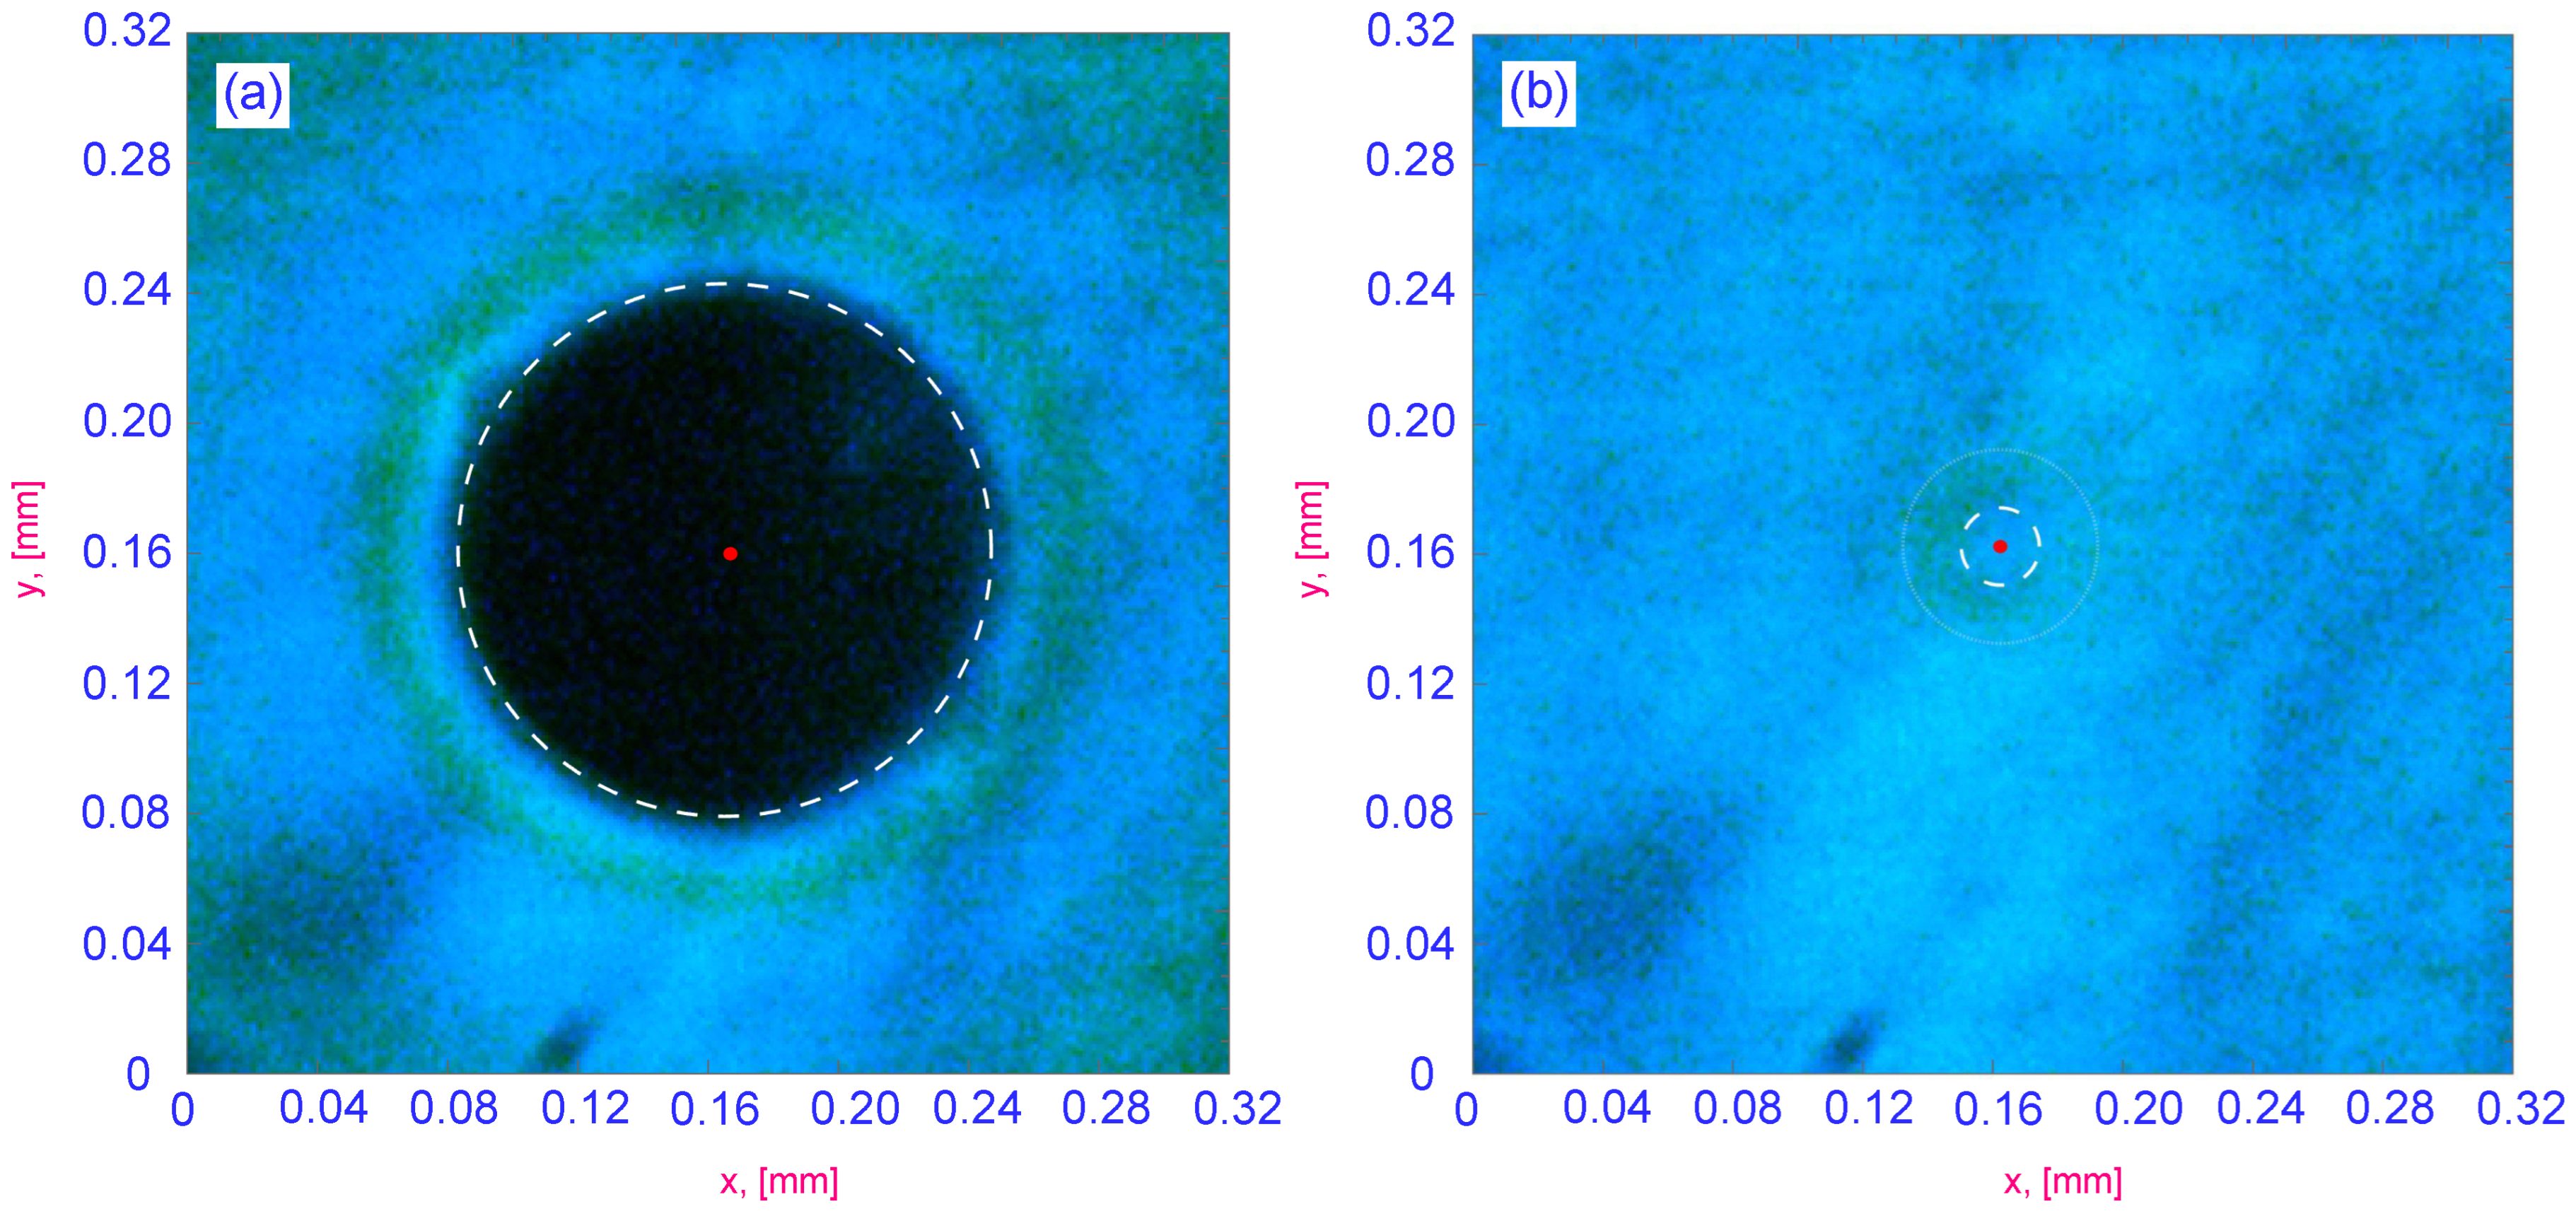
exceeding a threshold value of approximately ≈2.5 mW, the “fast” formation of a texture consisting of a black circular region corresponding to an isotropic domain with concentric colored rings is observed. The typical texture is shown in
Figure 3a for optical power equal to
. In
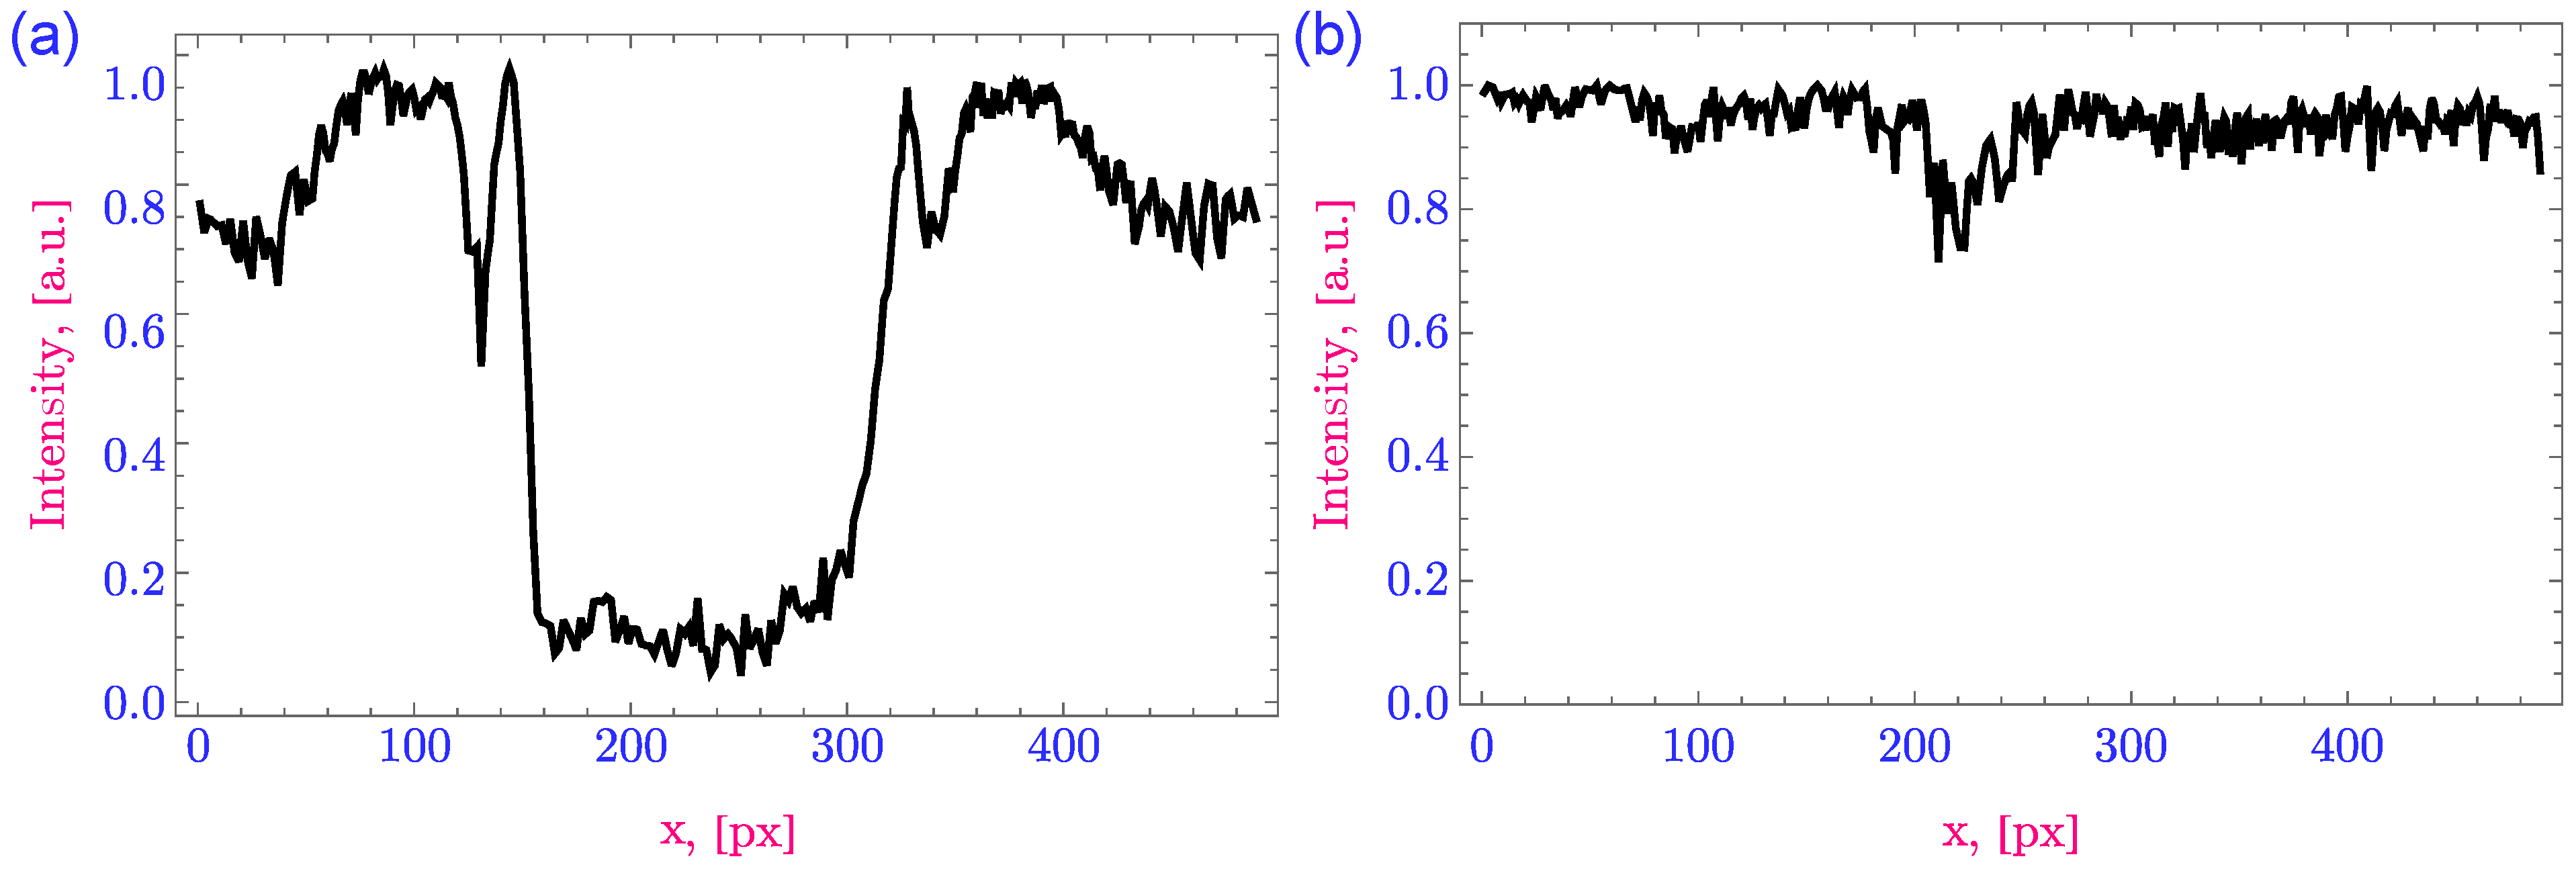
Figure 3a we marked the center of texture with red dot and the revealed boundary of black area with dashed white line. To highlight the texture profile we provided an intensity cut section in
Figure 4a at which there is clearly observed the central black area with following sequence of zones with high and low intensity.
We must emphasize that the textures are formed at a high speed, which apparently exceeds the frame rate used. However, after formation textures two modes of expansion are formed, namely the fast explosive expansion mode and the slow transition to a stationary state. The features of the evolution of the texture formed at the laser power exceeding the threshold volume will be discussed in the following subsections. Using the laser with the power below the threshold value (≈2.5 mW), we observed the formation of a slightly distinguishable colored ring without signs of an isotropic domain. The example of such a texture is shown in
Figure 3b, where the laser power is
. The red dot corresponds to the center of the detected texture. A slightly observed colored ring is bounded by white lines. The corresponding intensity cut section is shown in
Figure 4b.
Such a texture is completely formed at a rate much higher than the frame rate used per second, and can be characterized as static, since there is no sign of a change in the second time scale. As discussed in the previous section, we used this texture to provide focus on the electrode. The formation of the black domain in the
-plane with a sequence of rings in the polarizing microscopic image indicates the formation of a complex topology of the director field in the HAN cell. This topology was caused by local heating and a corresponding change in the temperature gradient. Although these texture features are visible to the naked eye, and the radii of the observed rings can be estimated by the intensity of cut sections, we used computer vision methods to recognize the texture and analyze its morphology. The approach of computer vision techniques allow us to fast automatic process the obtained video-footage frame-by-frame and makes it possible to reduce the number of operator errors during manual processing. For this purpose, frame-by-frame preprocessing of the image was performed. At the first stage, we divided the source frame into RGB color channels and obtained 3 matrices with dimension
images containing information about the red, green and blue channels for each frame, respectively. For further data processing, it is sufficient to use only the blue channel matrices. In the second step, we removed the background matrix from each blue channel matrix, which corresponds to the averaging of blue channel data for frames taken 3 s before laser heating. At the next stage, each matrix was binarized and inverted for ease of further processing. Then, for each received preprocessed frame, a morphological closure operation was applied. The morphological detection algorithm was used to identify circular elements in each frame. The algorithm of morphological detection is described in Ref. [
16]. The example of the preprocessing results is shown in
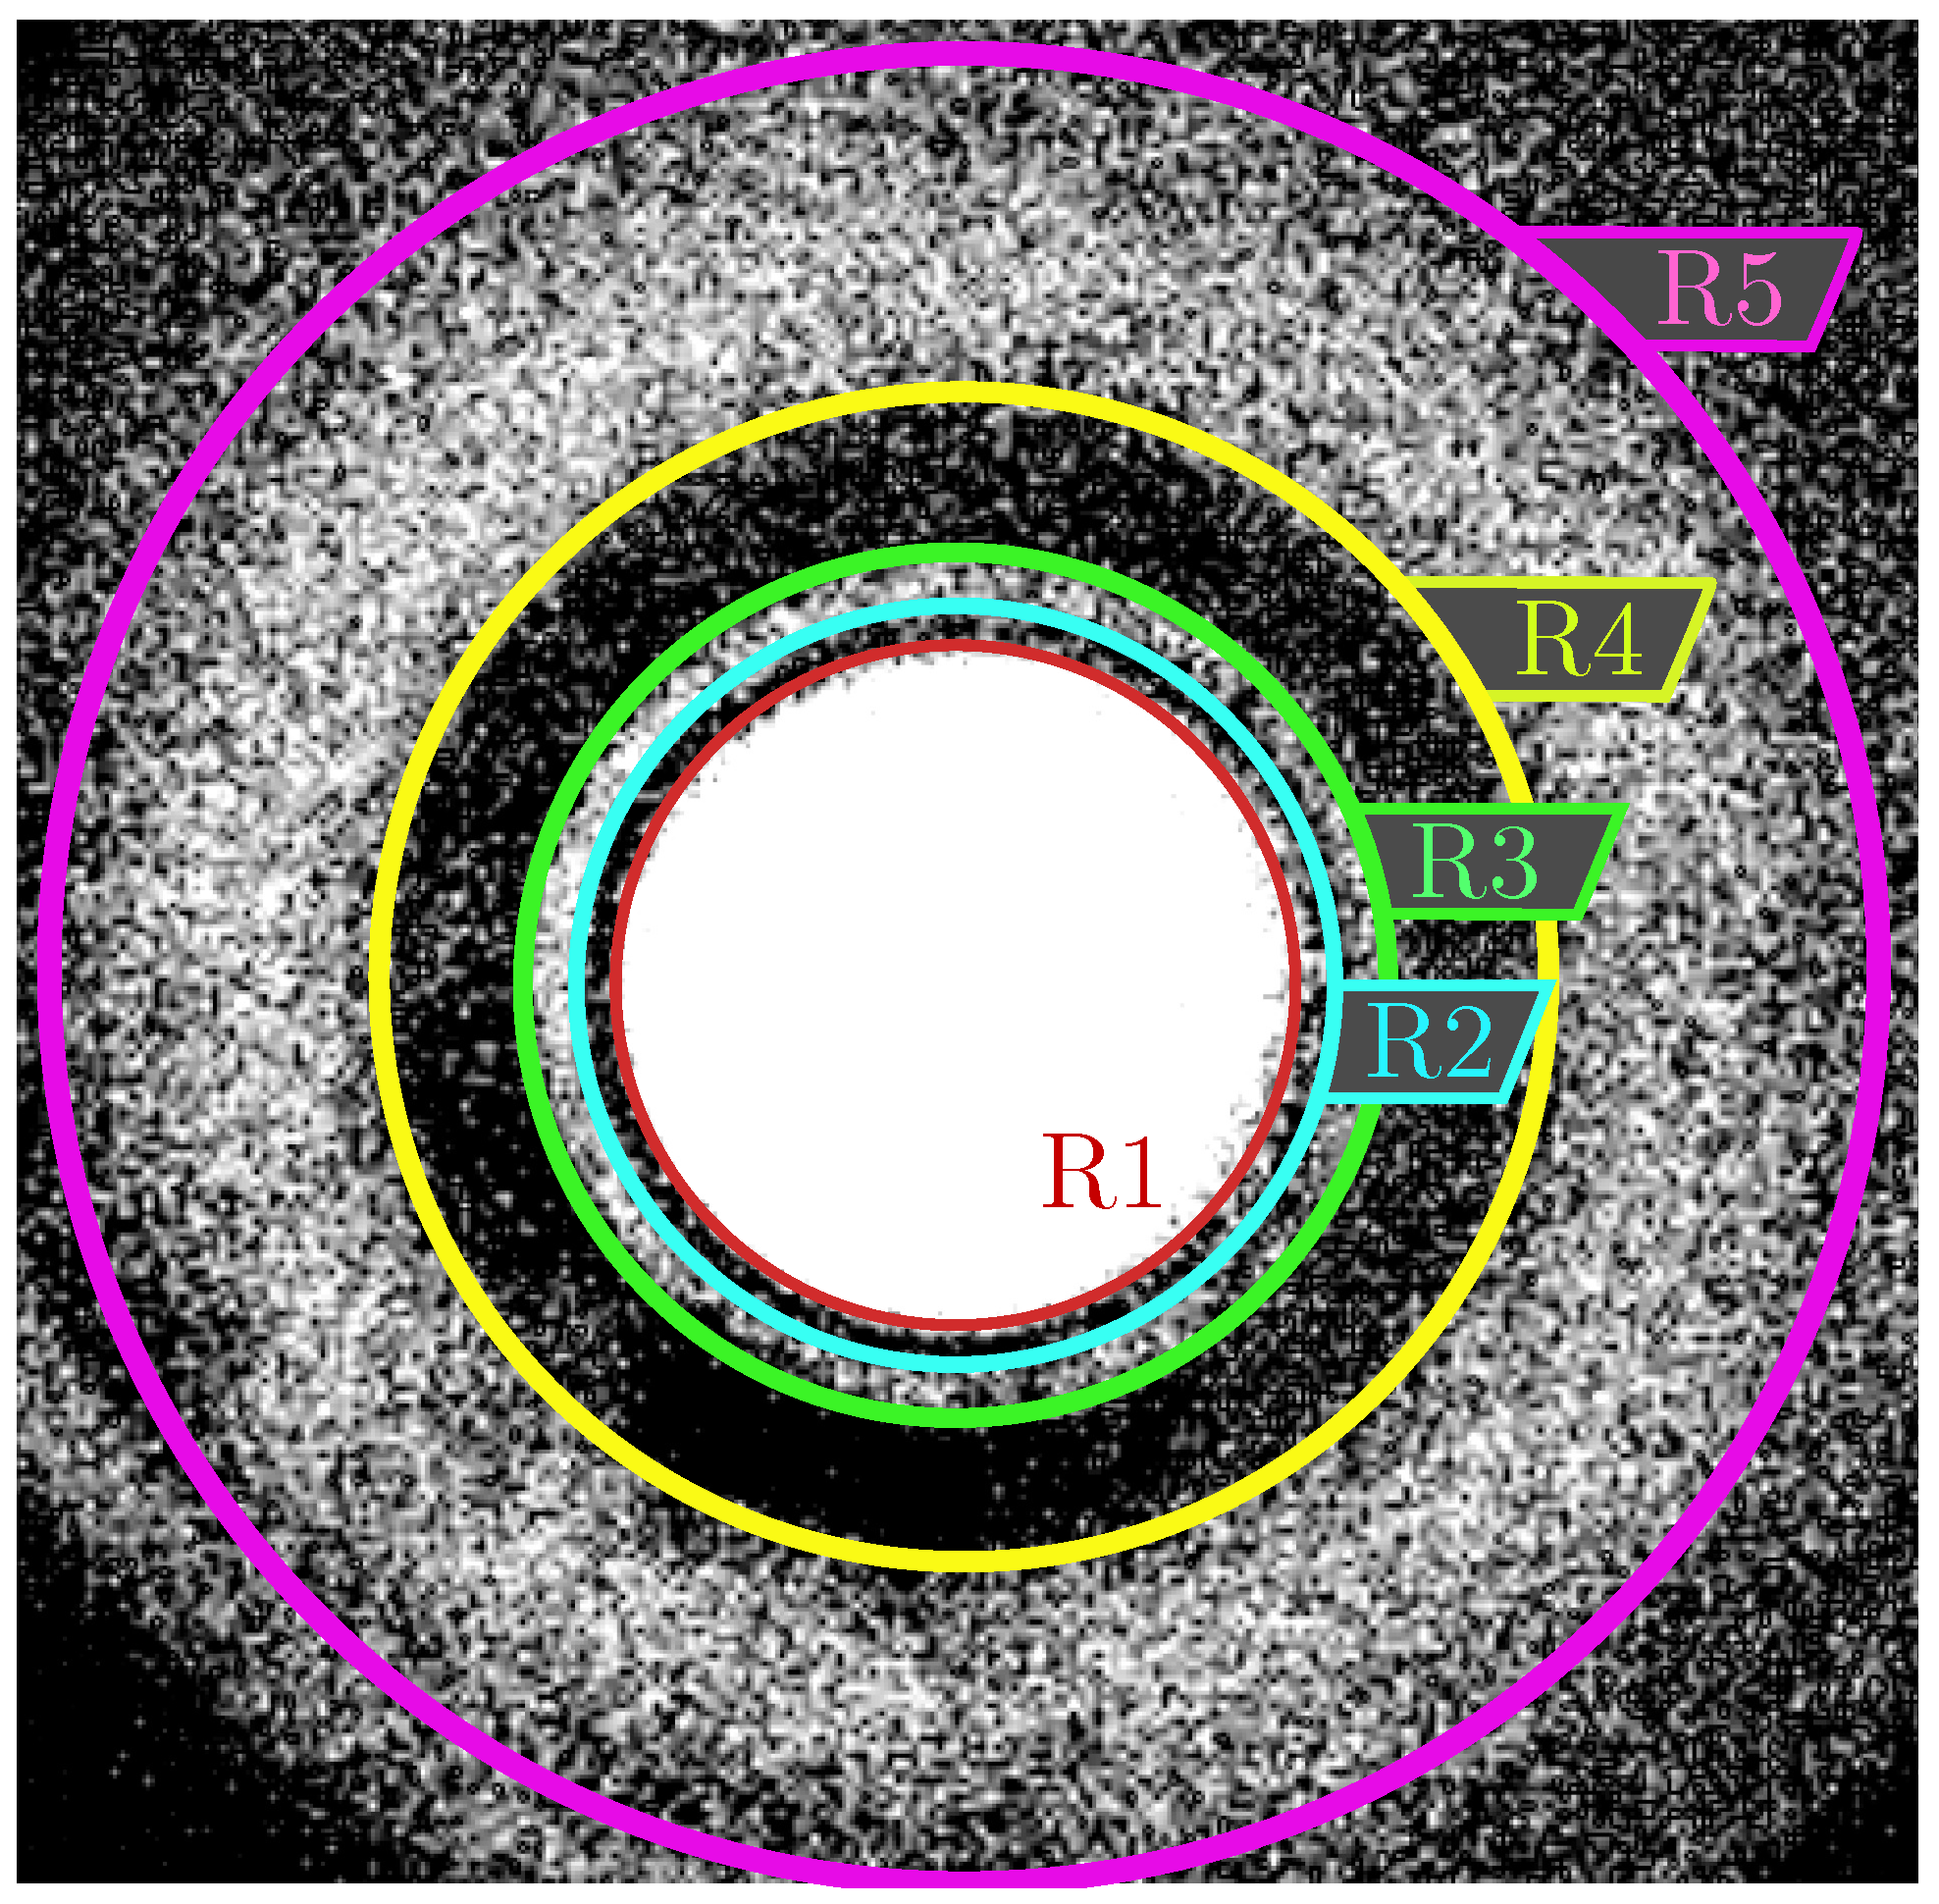
Figure 5.
In the inverted binarized
Figure 5, several circular elements can be observed when the circle with a radius
corresponds to the black isotropic area in
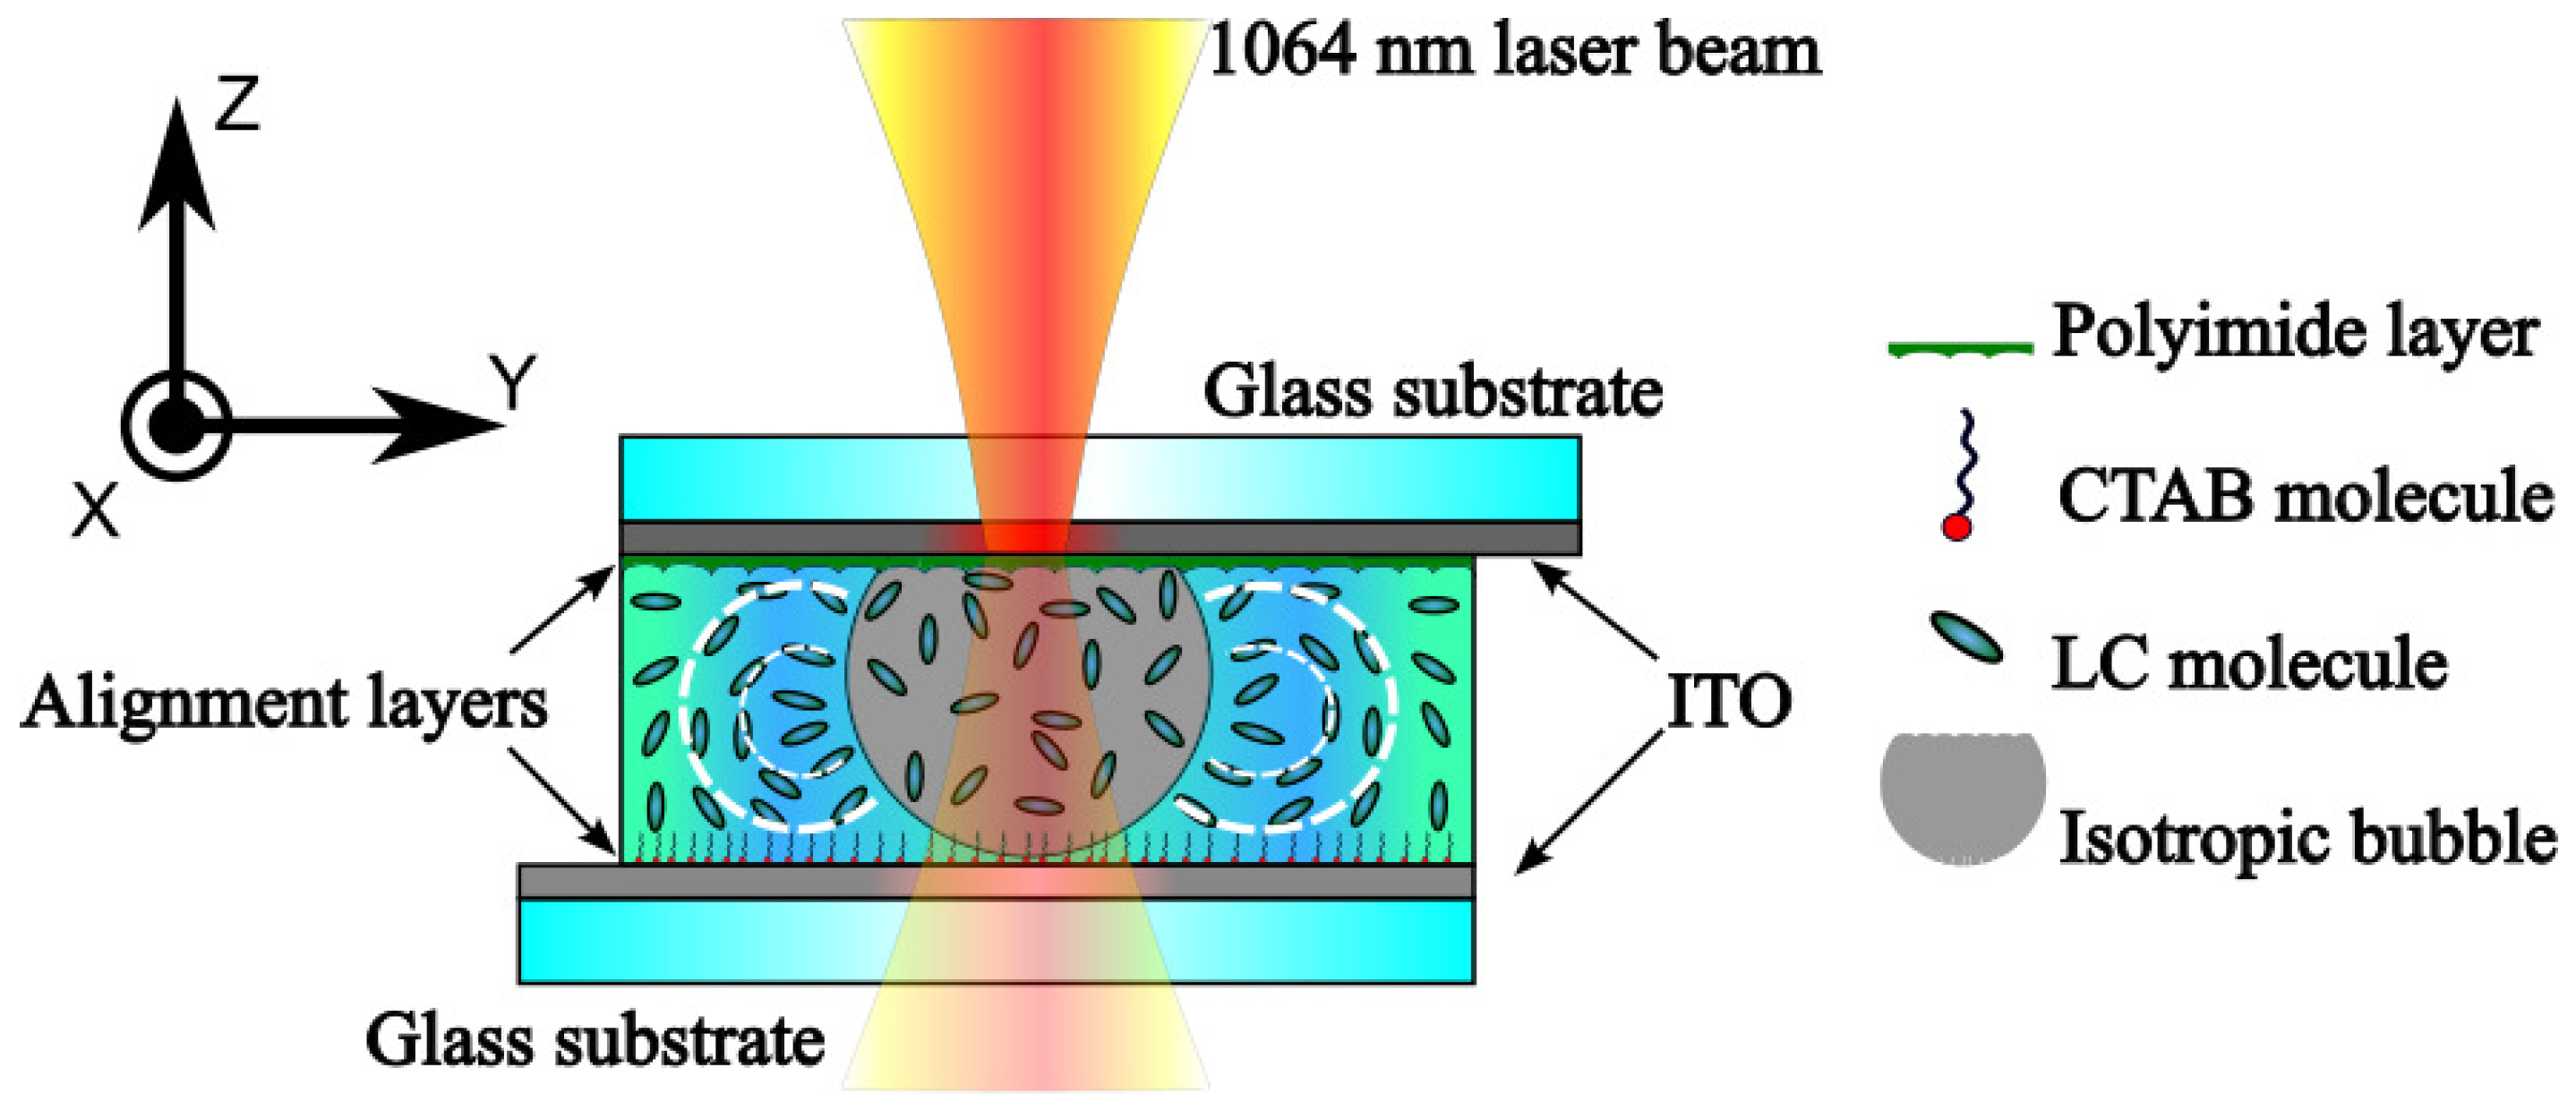
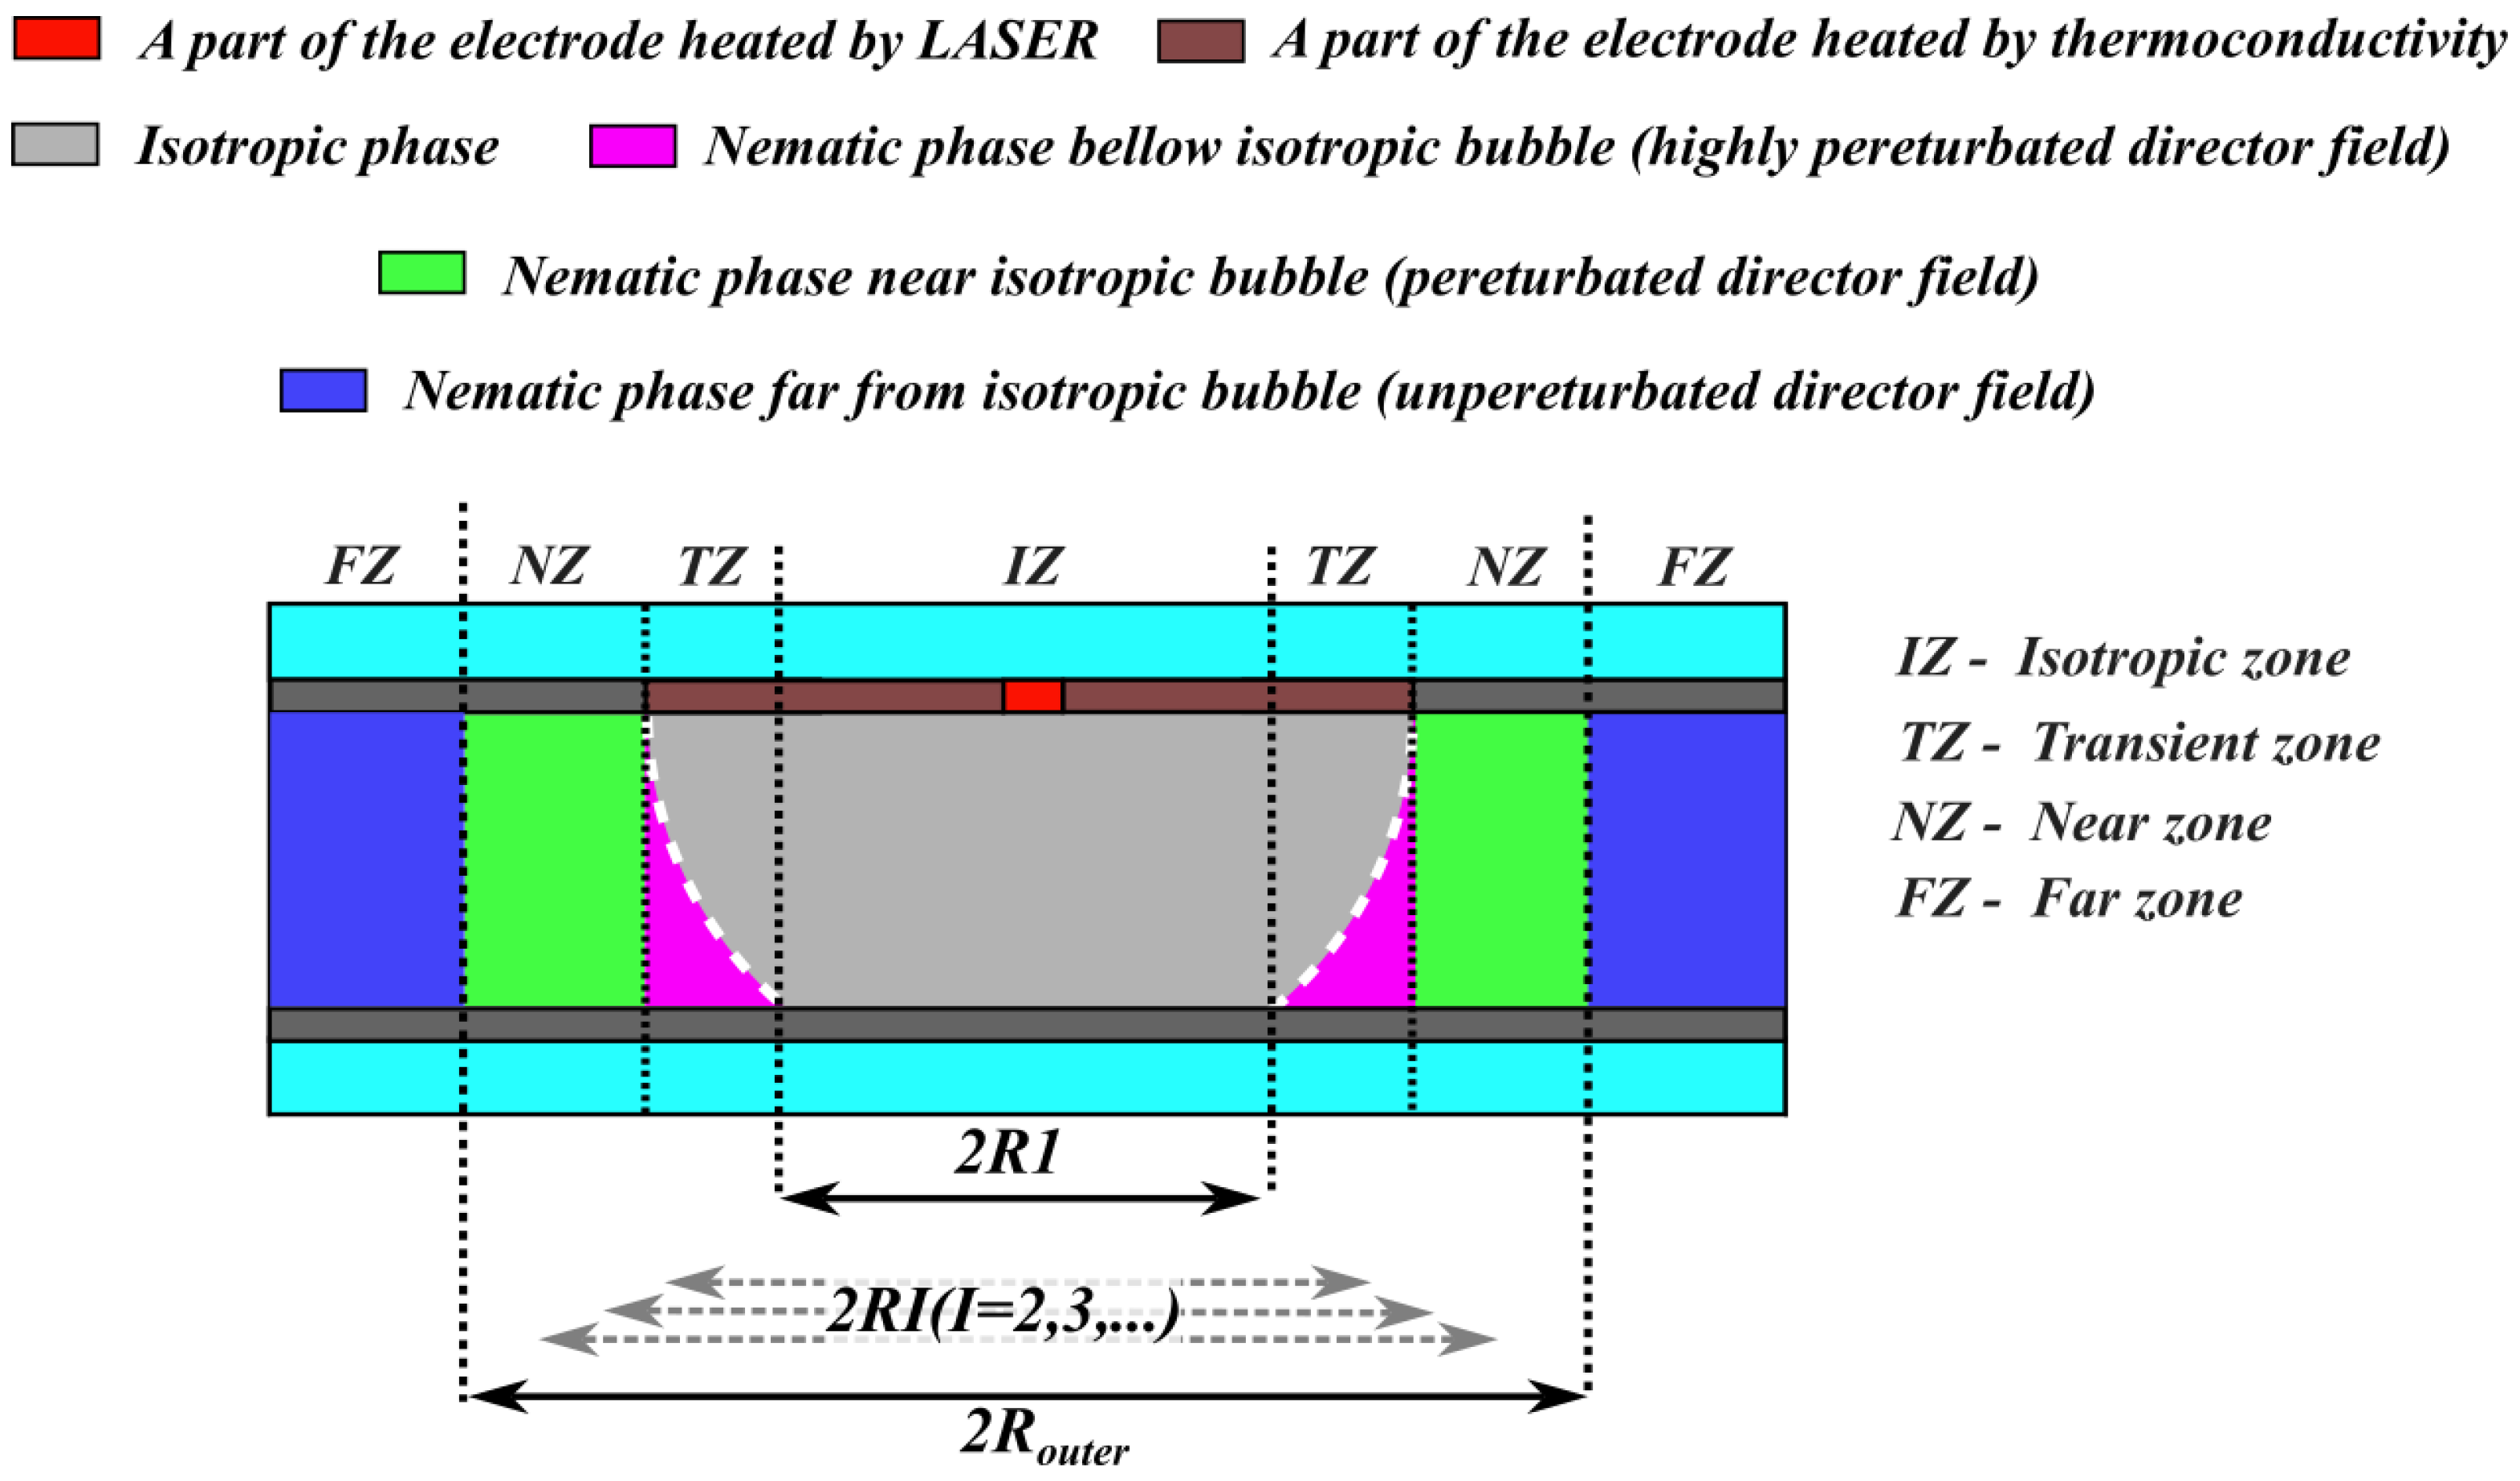
Figure 3a. Other circular elements indicate the sequence of rings that appeared as a result of heating processes. Before we go any further, we need to clarify the physical nature of the texture formed in the polarized microscopic branch. Since the light from the LED propagates from bottom, perpendicular to the substrate, we represent the structure of the LC cell from the optical point of view as a series of vertically oriented zones, as shown in
Figure 6.
To observe the black area in the polarized microscopic image (
Figure 3a), the whole path from the bottom to the top of the substrate must correspond to a completely isotropic area. Thus, the black circular area in
Figure 3a corresponds to the cylindrical volume of the isotropic domain, which contains only an isotropic liquid between substrates. Such a cylindrical zone is labeled as IZ in
Figure 6. However, the total isotropic domain has a shape different from that of the cylinder. Thus, a part of the LC cell can be represented by a vertical zone containing both isotropic and nematic phases. Such a zone is designated as the transition zone (TZ) in
Figure 6. Now it is clear that the radius of
from
Figure 6 corresponds to the radius of the mentioned cylinder base, i.e., corresponds to the IZ-TZ boundary. We can assume that the director field in the nematic part of such zones can be strongly perturbed due to anchoring at the interface with an isotropic volume, possible fluid flows, and temperature gradient effects. Moreover, the thickness of the nematic phase in the TZ zone varies, as schematically shown in
Figure 6. After TZ, we can introduce a zone called the near zone (NZ), with radius
, which has a perturbed director field but no isotropic volume.
As seen in
Figure 3a, in the texture the number of bright and dark rings are observed. From polarized optical microscopy point of view it means that the polarization of light after passing through the cell varied in the xy-plane. Indeed, after passing through a LC cell with induced complex director field topologies, phase transformations and hydrodynamic flows, the light from the LED is characterized by a complex spatial distribution of polarization depending on the local anisotropy. Thus, the textures carry information about the director field perturbation. Such a perturbation is attributed to changes in the director field topology, which determines the birefringence, and to changes in the nematic phase thickness, which determines the optical path through the anisotropic phases. The usage of crossed polarizers allows to transfer spatial topology of light polarization to the spatial topology of light intensity which is captured with CCD camera. Taking into account those thoughts, we can claim that all textural rings with radii
starting from R2 are belonged to the TZ and NZ parts of cell between
and
, respectively (
Figure 6).
Finally, the rest of the LC cell has no perturbations and can be designated as far zone (FZ). Since in FZ there is no spatial perturbation of director field and no isotropic phases, no textural features can be observed in FZ. Thus, the boundary between NZ and FZ (
in
Figure 6) is an outer boundary of all textural features that can be observed. We can assume that number of rings as well as their thicknesses depend on following factors including thickness of the cell, initial configuration of director field, optical and material properties of LC used, parameters of laser irradiation. Further investigations may shed light on the influence of all these factors on formed texture properties.
Here we need to clarify another physical point. Despite the fact that the area of the laser spot on the upper ITO electrodes does not exceed ∼20 µm, the heating area of the electrode is significantly larger due to the limited thermal conductivity of the electrode materials, which is also shown in
Figure 6. We would like to mention, that we have shown the typical textures observed for a given experimental condition; the reproducibility of texture formation features verified on several cells via measuring several times during a week.
3.2. Dynamics of the LC Textures
Now we can go further and focus our attention to the dynamics of texture evolution. As we said previously, the texture formed under the action of laser with power higher than ≈2.5 mW is not static and expands during the radiation exposure. First, we observe the “fast” mode characterized by explosive texture expansion over a typical period of time . We believe that this mode is mainly influenced by the heating of LC materials by a laser spot on the ITO layer and a less pronounced effect of thermal conductivity. Secondly, the “slow” mode, when the isotropic domain slowly increases due to the thermal conductivity of the electrode. This slow mode is characterized by a characteristic time period of .
As can be seen, the boundary between IZ and TZ is defined by a circle with radius
. The first light ring in
Figure 3a corresponds to the area of space between circles with radius
and
in the inverted binarized
Figure 6, the second light ring corresponds to the area of space between the circle with radius
and
, etc. All the bright ring structures observed in
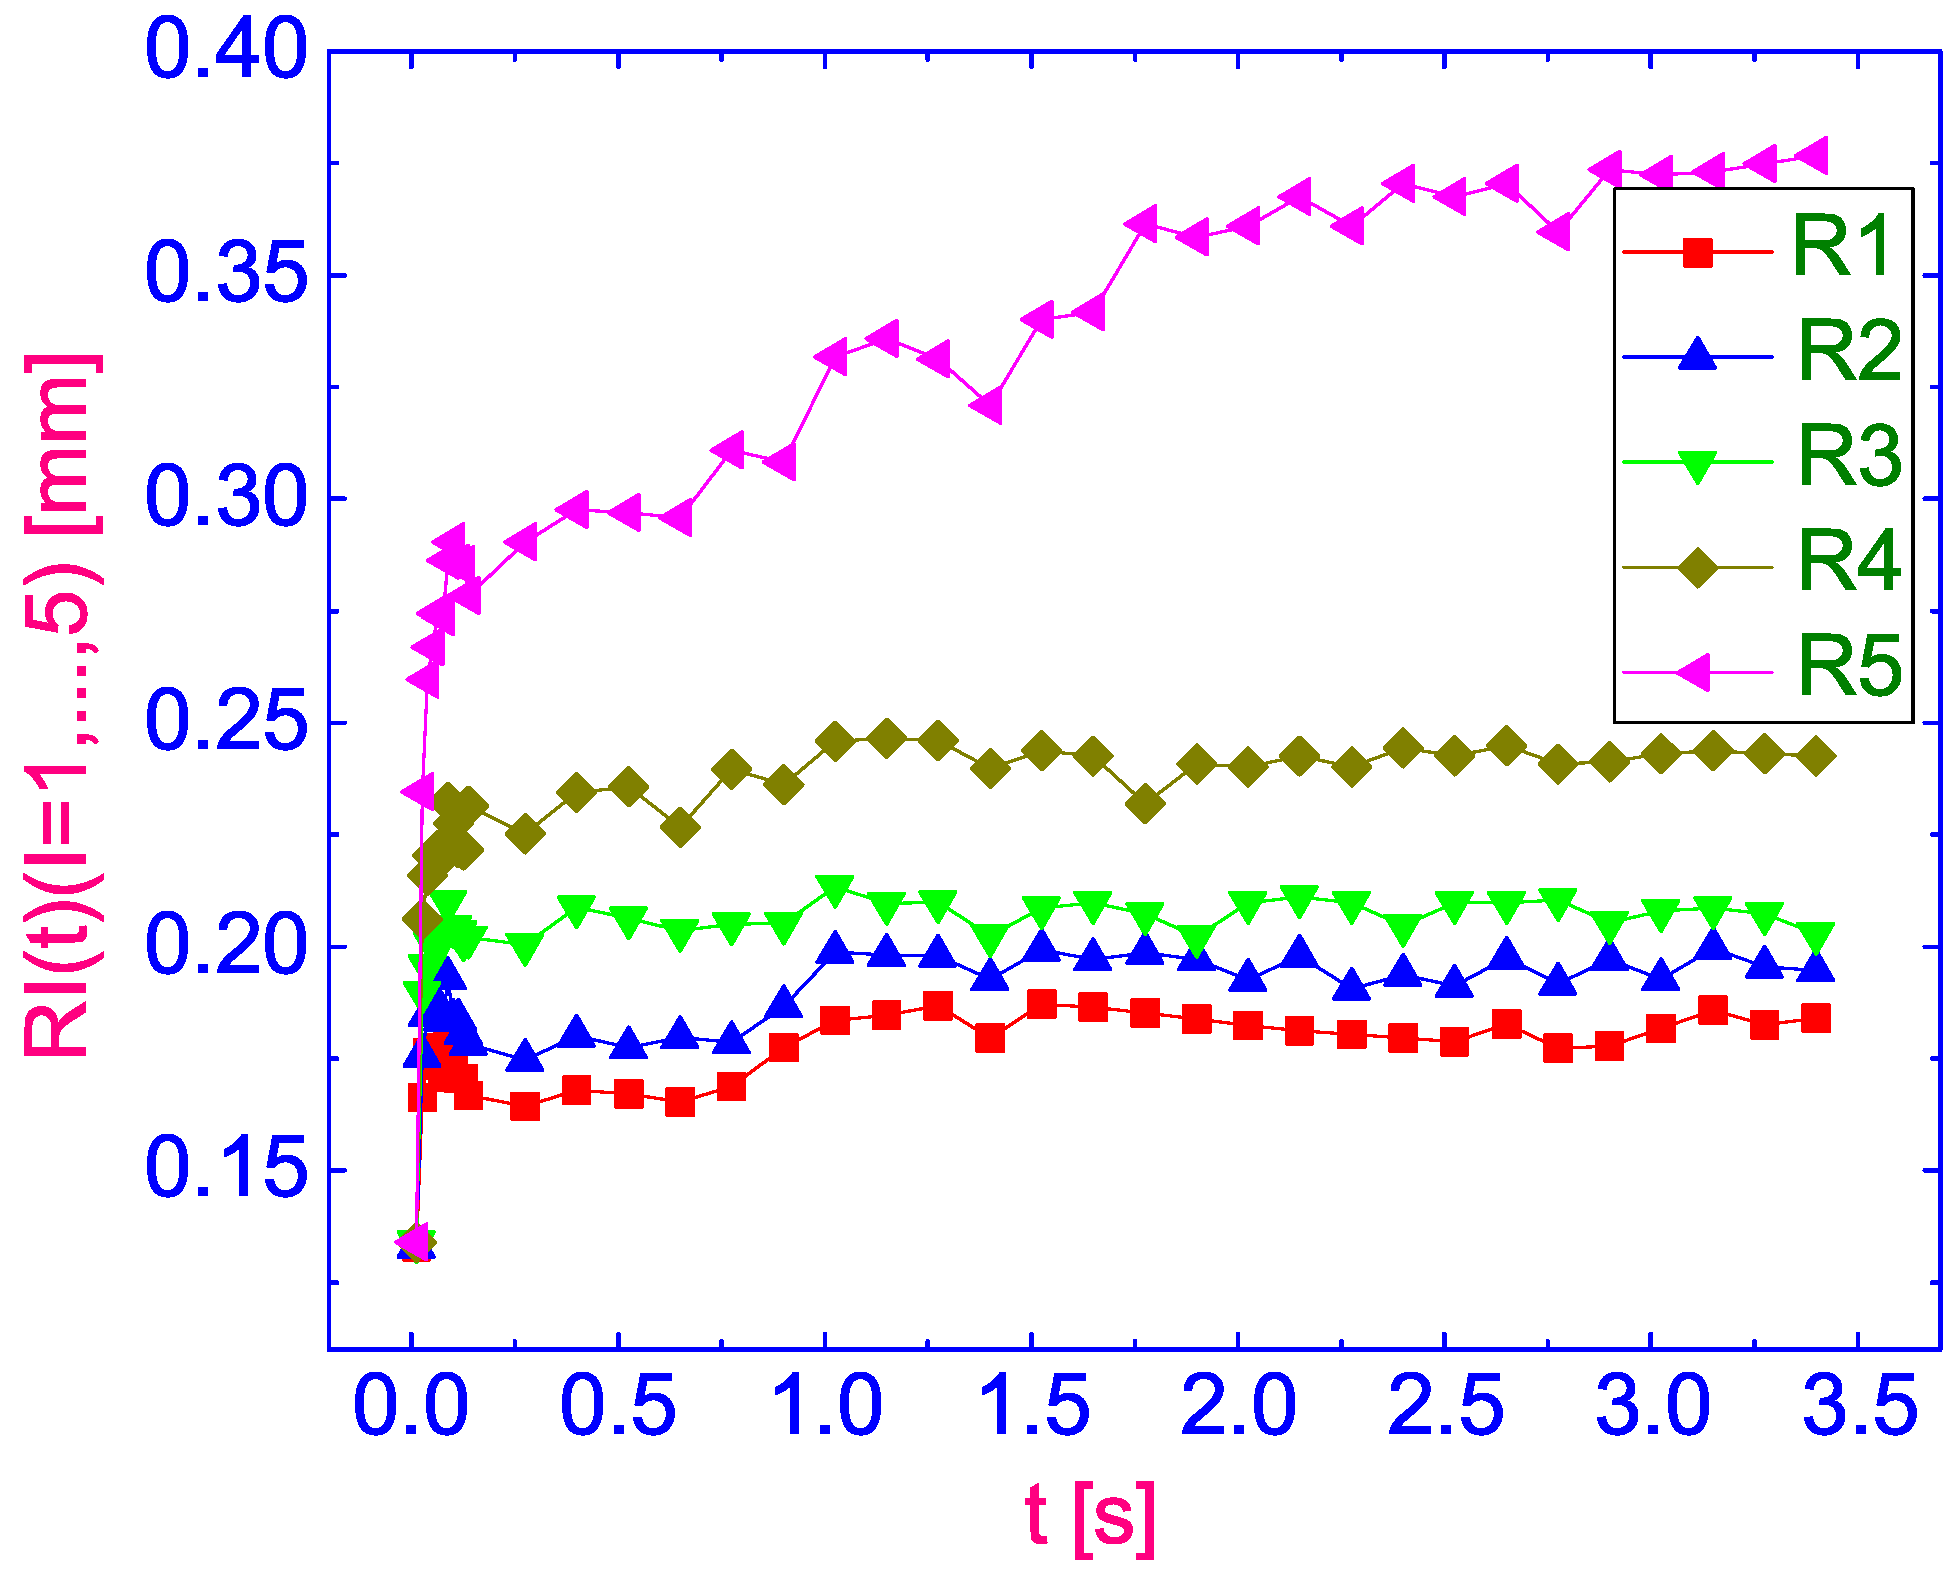
Figure 3a and characterized with R2, R3, etc are attributed to the TZ and NZ where the optical anisotropic properties of LC film is varying as discussed previously. When the laser is turned on, the observed textures and their radii expand. An example of the time dependence of the characteristic radii of a texture is shown in
Figure 7 for
and for optical laser power
.
The data presented in
Figure 7 highlighted an explosive increase in the radius of the isotropic domain and the accompanying concentric rings, followed by a slow transition to a stationary state. The typical explosive growth time is about 0.1–0.2 s. When the laser radiation power is much higher than the threshold value, damped oscillations of the isotropic domain are observed.
Since, depending on the power of the laser radiation, the textures formed have different characteristic radii, and, generally speaking, the rings can extend beyond the frame, it is most advisable to compare the dynamics of texture expansion along the boundary of an isotropic zone.
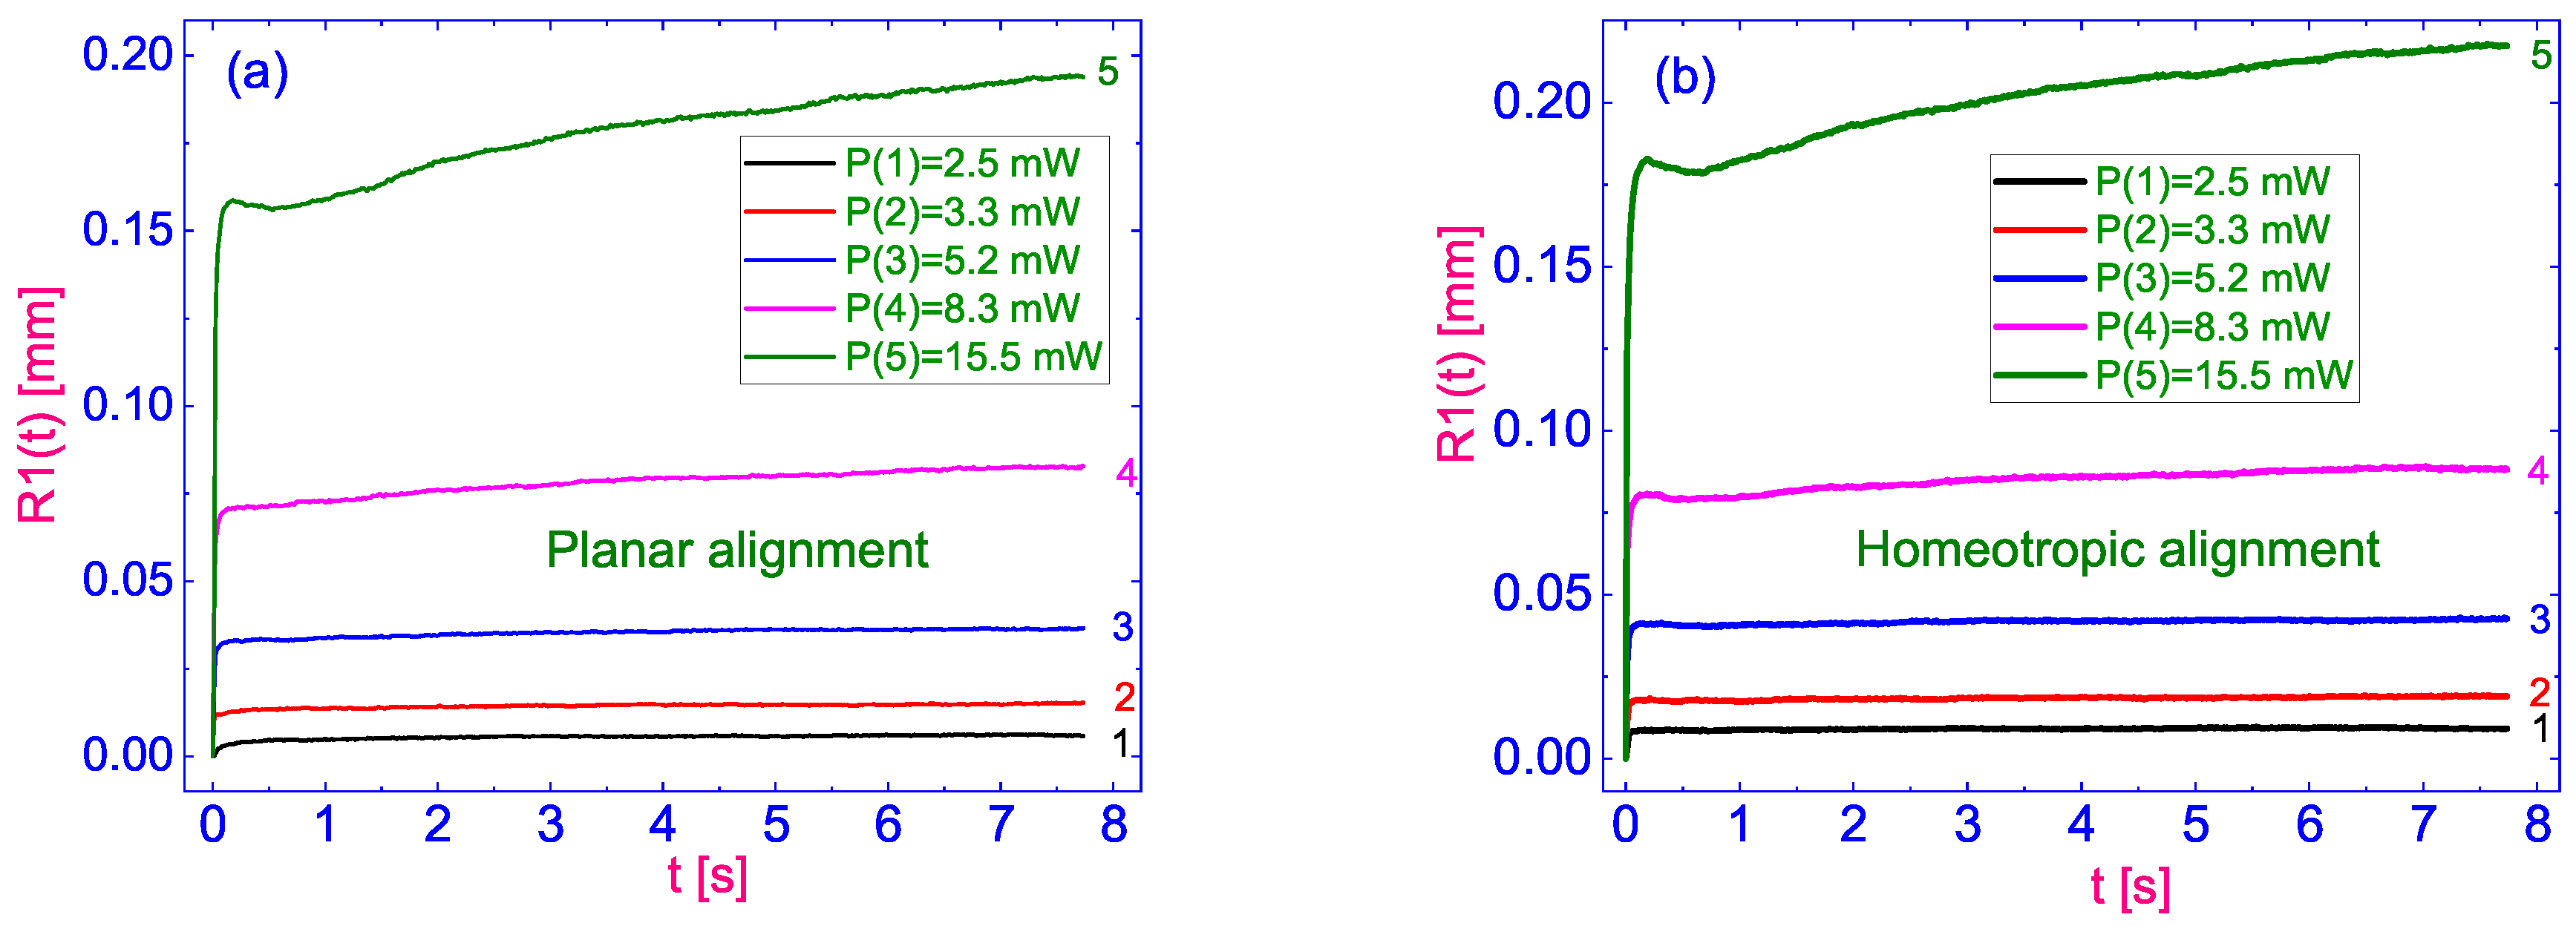
Figure 8 shows the dynamics of the isotropic zone expansion (the dependence of its radius
on time
t when the laser beam is focused on a planar (
) (
Figure 8a) and homeotropic (
) (
Figure 8b) substrates, depending on the power P of the laser radiation. As we can see from
Figure 8a,b, the typical behavior of changing of the radius of zone IZ is the same for both
and
, consisting in explosive expansion and further slow growth. Moreover, damped oscillations are clearly observed at higher optical power values.
However, this phenomenon should be considered in detail in future work, by capturing the dynamics with higher frame rate and camera resolution, as well as by developing a hydrodynamic theoretical description.
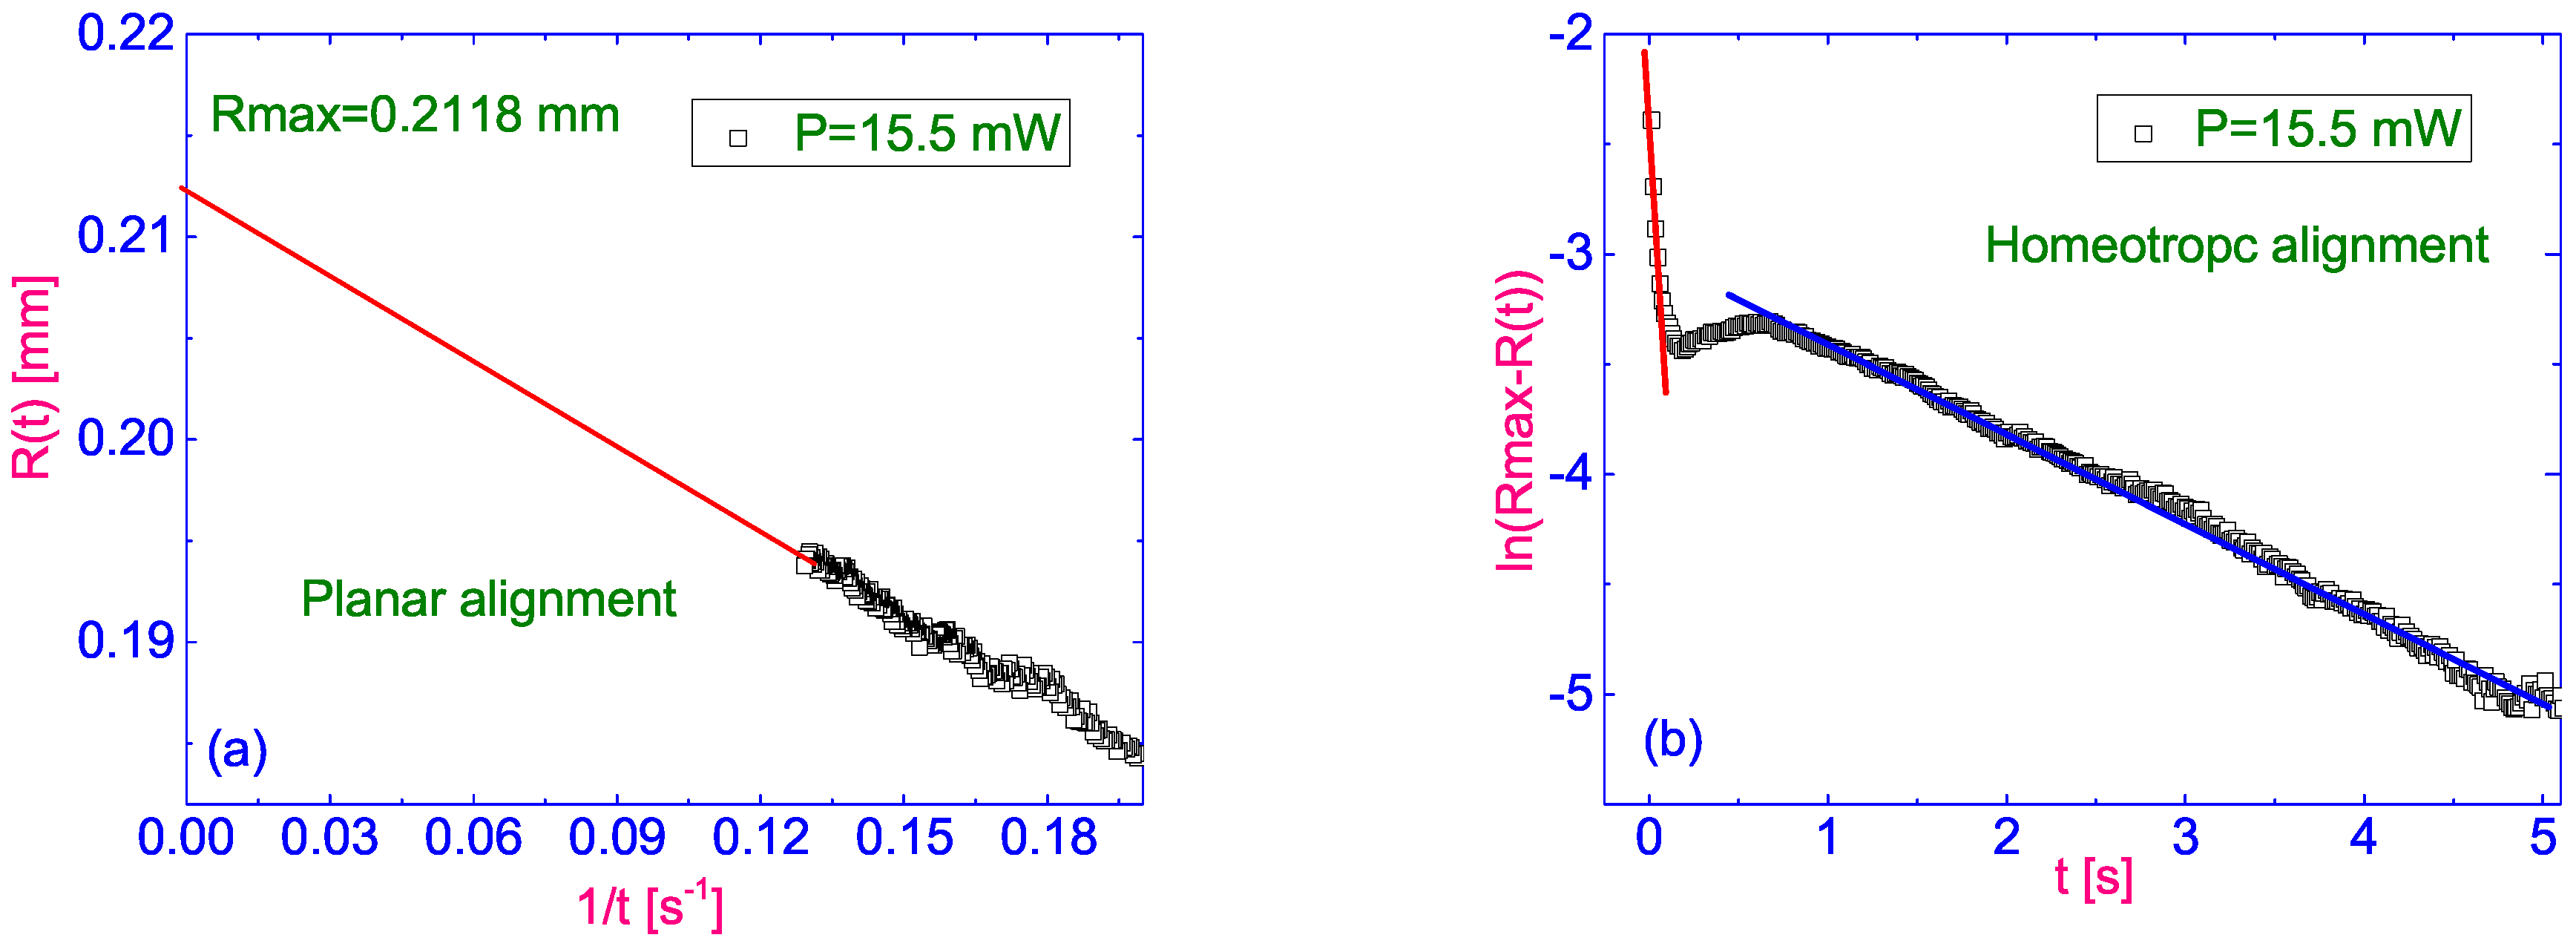
At this stage, we intend to introduce some indicators that allow us to assess the dynamics of evolution more quantitatively. First, we need to estimate the stationary radii of the isotropic zones
that are formed when thermal stabilization in our dynamical system is achieved. To estimate
, we propose to plot the obtained dependencies
in coordinates of
for
. The example of such plotting is shown in
Figure 9a. The dependence of
in this given time range
t takes a linear form and can be extrapolated to the ordinate axis. The ordinate of the intersection point of such a linear approximation with the ordinate axis allows us to estimate the maximum radius of the circular domain
. The example of
determination is shown in
Figure 9a.
Then, it is necessary to propose an algorithm for estimation of the characteristic time periods of the expansion dynamics. We can presume, that dynamics of expansion have multi-exponential behavior. Thus, the characteristic time can be obtained by plotting the time dependence of the IZ radii on logarithmic scale. For plotting convenience it is much easy to work with
which is
. As can be seen in
Figure 9b linear dependence intervals can be observed using such a logarithmic scale when plotting
on
t. Two areas with linear dependencies are clearly distinguished: first, corresponding to the time just after switching on the laser radiation and, second, in the time interval between the
and
seconds. The slope coefficients of the linear approximations correspond to the inverse of the characteristic times
and
. Accordingly, the expected value of the first characteristic of the “fast” time,
, is much less than the corresponding values of the “slow”, time
.
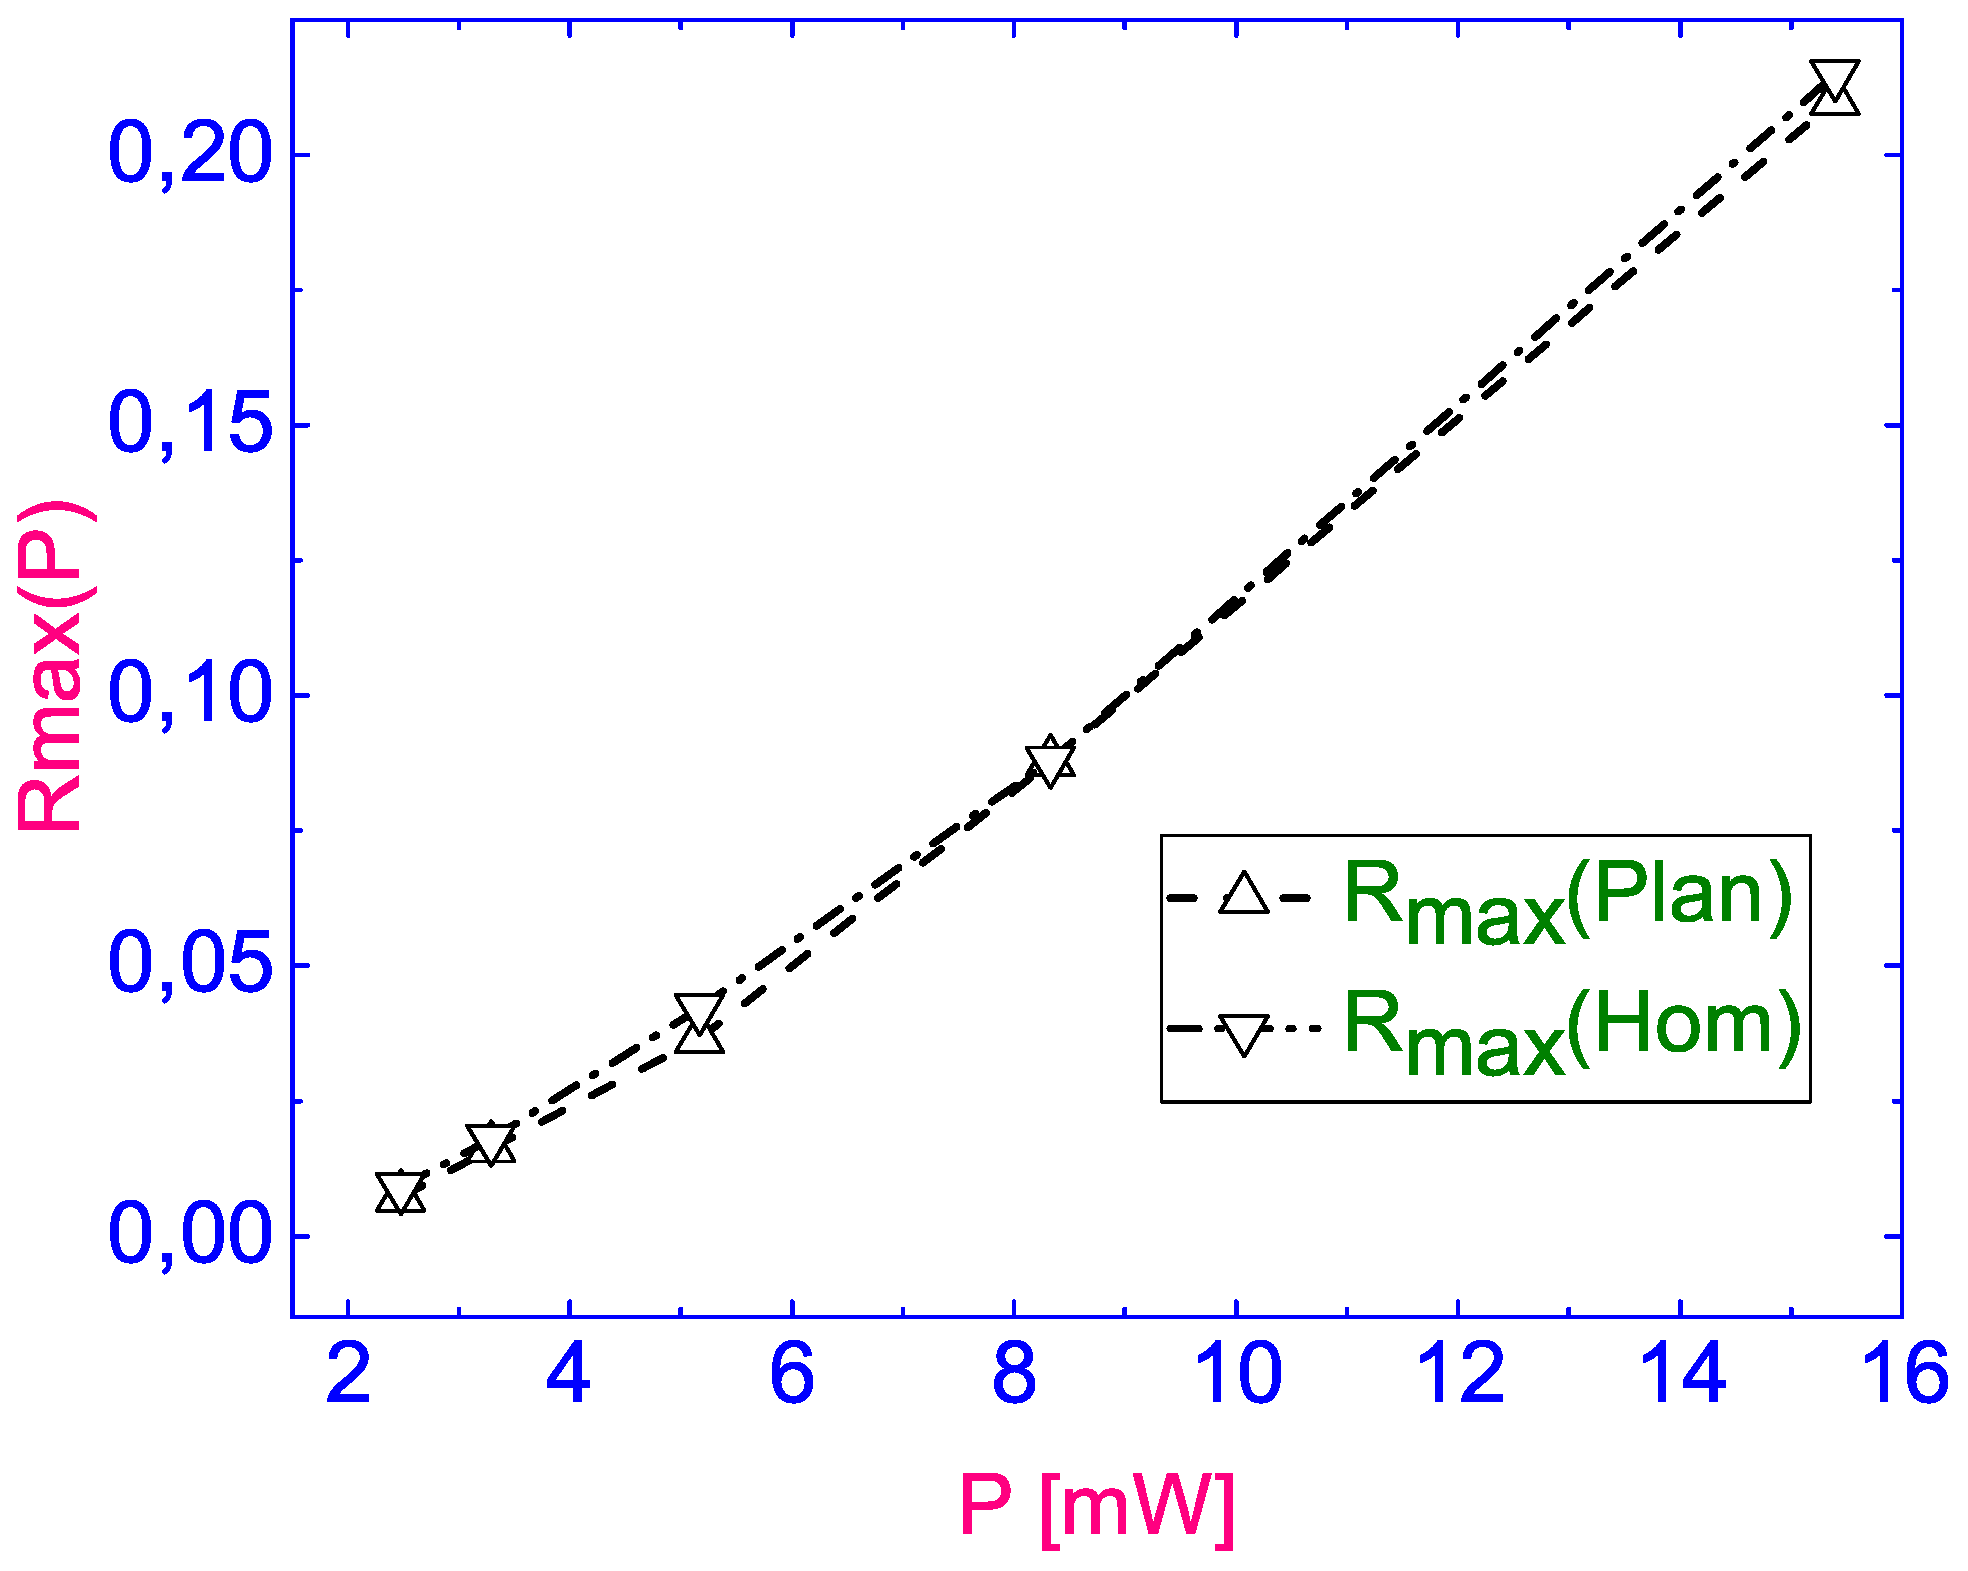
Comparison of the limiting radius
of an isotropic zone depending on the power of P laser radiation when it focuses on both planar (
) (triangles up) and homeotropically (
) (down triangles) aligned substrates are shown in
Figure 10. As can be seen from
Figure 10, the two dependencies almost coincide. This dependence seems logical, since, as a result, the volume of the liquid that has passed into the isotropic phase should be determined by the amount of energy pumped into the system.
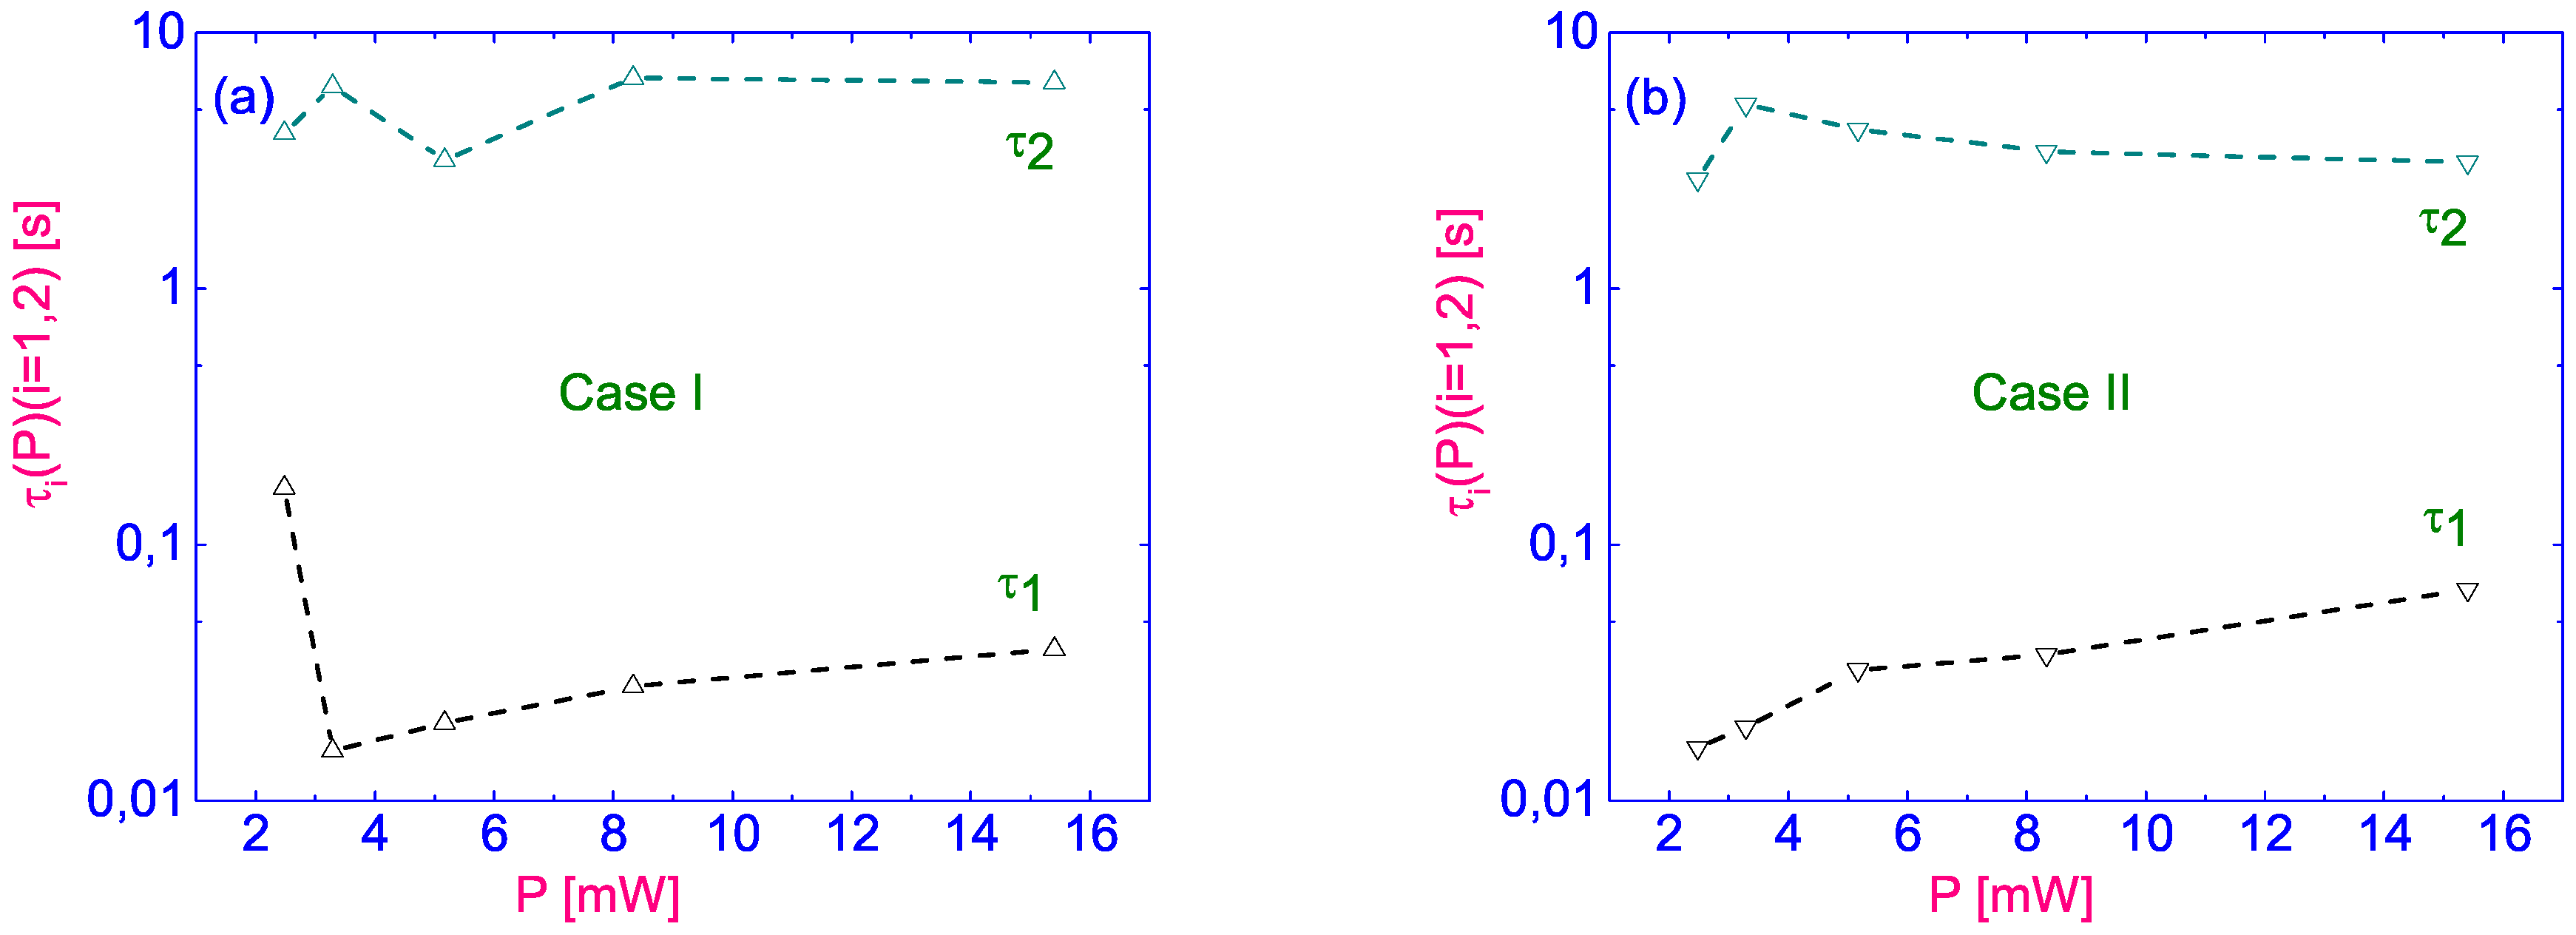
Figure 11 shows the dependences of “fast” (
) and “slow” (
) expansion time of the isotropic circular domain depending on the power P of the laser radiation when it is focused as on the planar,
, (
Figure 11a) and on homeotropic
, (
Figure 11b), substrates. In all cases, we see that
is several orders of magnitude higher than
. Moreover, at this stage we have not identified a clear dependence of
of the laser power. In future work, we intend to obtain data with a smaller power step, which will allow us to investigate the dependence of
on the laser power and the initial configuration of the director’s field. With a lower power P (less than
) and focusing on the planar aligned bounding surface (
), a point appears that deviates sharply from the dependence
. The observed flaw is caused by a technical error that occurred due to the limitation of the maximum time resolution of the CCD camera used (
s). To improve the results of measuring the “fast” time
, in the following studies it is necessary to reduce the power step and shoot at a higher frame rate, which will allow for a more accurate linear approximation. Nevertheless, starting with the power of P exceeding
, both dependencies tend to monotonous growth.
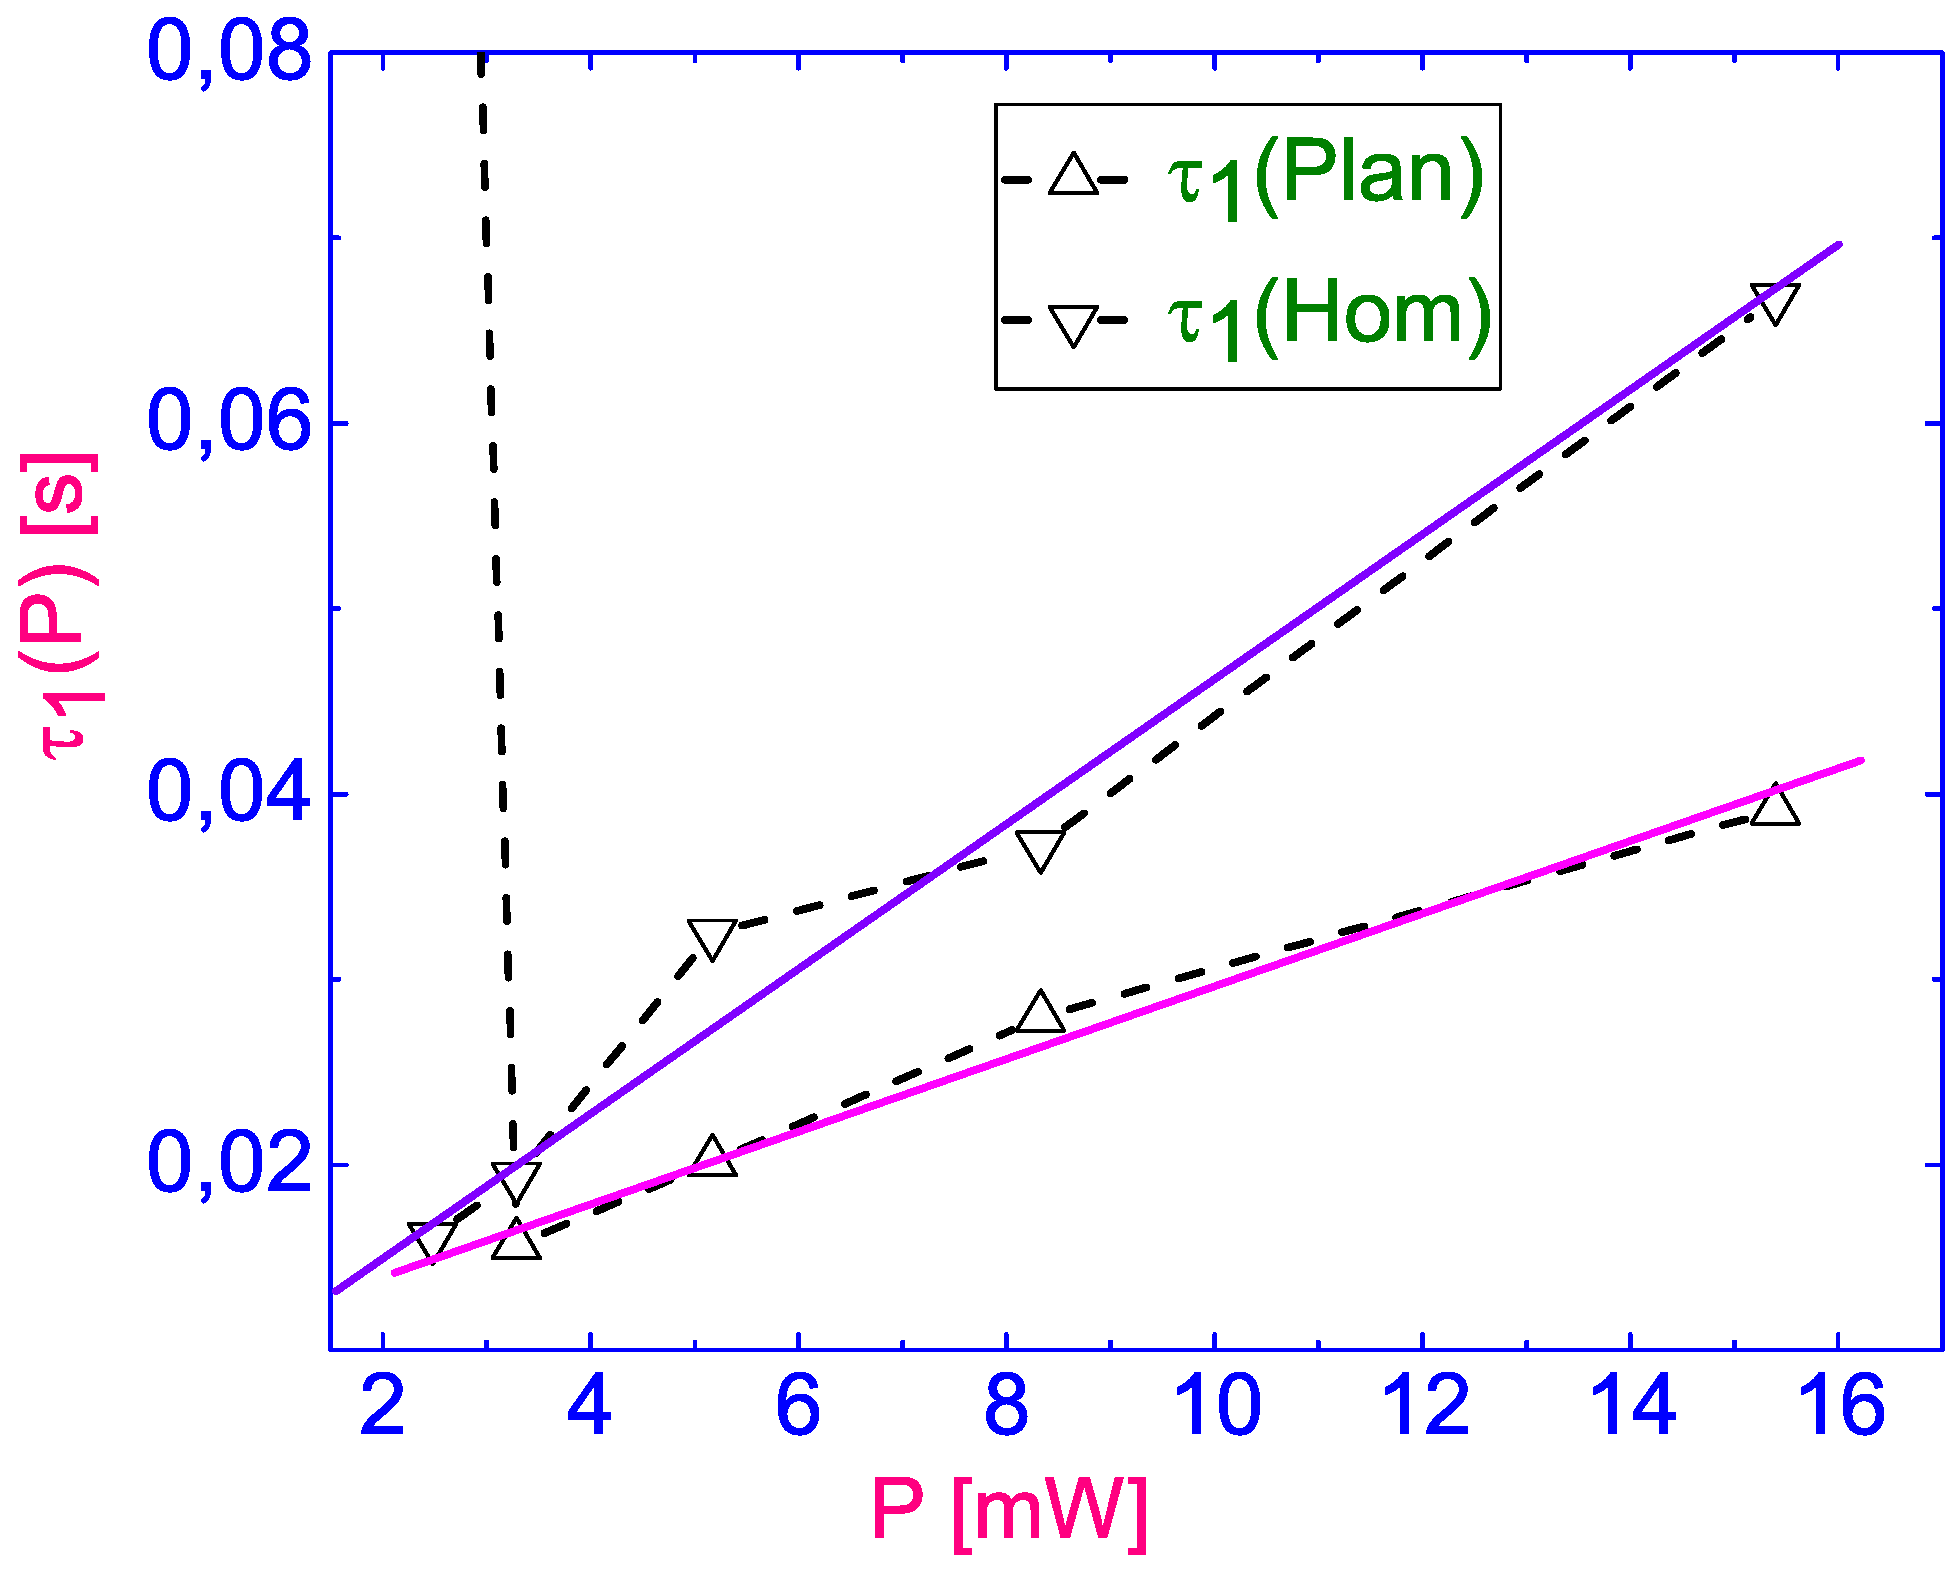
In
Figure 12 we compare the dependence of the “fast” time
on the laser power for both
and
. It can be seen that the growth rates of these dependencies vary markedly. In the case of laser beam focusing on the homeotropically aligned bounding surface (
), the dependence slope is almost twice as high as in the case of focusing on the planar aligned surface. This difference in the growth rates of these dependencies
and
can be explained by the difference in thermal conductivity coefficients
and
(in units
) [
17] corresponding to the parallel and perpendicular direction of the director
.
Despite the fact that this stage of our experimental studies is the first attempt, we can assert that the presented techniques and metrics are sufficient for a comprehensively study of the dynamics of texture evolution in the context of the thermomechanical force in the LC cells with the gradient of both the director’s field and temperature distribution.
