Abstract
The scalable synthesis of high-quality single-crystal diamond films remains pivotal for next-generation extreme-performance devices. Iridium substrates offer exceptional promise for heteroepitaxy, yet early-stage growth mechanisms limiting crystal quality are poorly understood. An integrated multiscale investigation combining first-principles DFT calculations, molecular dynamics simulations, and experimental validation is presented to resolve the oriented attachment process governing diamond growth on Ir(100). Robust interfacial bonding at the interface and optimal carbon coverage are revealed to provide thermodynamic driving forces for primary nucleation. A critical angular tolerance enabling defect-free coalescence through crystallographic realignment is identified by molecular dynamics. Concurrent nucleation growth pathways are experimentally confirmed through SEM, AFM, and Raman spectroscopy, where nascent crystallites undergo spontaneous orientational registry to form continuous epitaxial domains. Grain boundary annihilation is observed upon lattice rotation aligning adjacent grains below the critical angle. Crucially, intrinsic atomic steps are generated on the resultant coalesced layer, eliminating conventional etching requirements for homoepitaxial thickening. This work advances fundamental understanding of single-crystal diamond growth mechanisms, facilitating enhanced quality control for semiconductor device manufacturing and quantum applications.
1. Introduction
Diamond possesses an exceptional combination of properties such as supreme hardness [1], the highest known thermal conductivity at room temperature [2], a wide bandgap (>5.5 eV), exceptional chemical inertness, and remarkable biocompatibility [3], making it the quintessential material for extreme next-generation devices [4,5]. Recent theoretical investigations further corroborate diamond’s exceptional characteristics. First-principles studies have elucidated defect-related electronic properties [6] and excited-state lattice dynamics [7], reinforcing its suitability for extreme-performance devices. High-quality, large single-crystalline diamonds are particularly coveted for applications including high-power/high-frequency electronics [8,9,10], quantum information processing [11,12], particle detection [13], and optical windows [14]. Chemical vapor deposition (CVD) allows for scalable synthesis [15,16]. Two primary CVD routes exist: homoepitaxy, where diamond grows on existing single-crystal diamond substrates [17], offers high quality but inherently restricts wafer size and cost-effectiveness, while heteroepitaxy, where diamond nucleates and grows on a non-diamond substrate, offers the compelling advantage of realizing large-area, high-quality, potentially single-crystalline diamond films on scalable wafers [18,19,20].
Among candidate heteroepitaxial substrates, iridium (Ir), particularly its (100) surface [21,22], has emerged as the most successful platform due to its moderate lattice match and demonstrated potential to achieve heteroepitaxial diamond films with low mosaic spread [23,24]. Yet, achieving a truly single-crystalline, defect-free material comparable to homoepitaxial diamond over large areas remains elusive and hinges critically on understanding the atomistic details governing the initial nucleation and early coalescence stages.
Crystal growth mechanisms are fundamental to understanding the formation and properties of advanced materials [25]. While classical theories, such as layer-by-layer growth via two-dimensional nucleation [26,27] or spiral growth around dislocations [28], describe many systems, they often fall short in explaining the heteroepitaxial growth of complex covalent crystals like diamond, particularly at the early nucleation stages. For diamond heteroepitaxy on non-diamond substrates (e.g., iridium), a non-classical growth pathway plays a critical role: oriented attachment (OA) [29]. The efficacy of OA in driving single-crystal formation has been demonstrated across diverse material systems, including inorganic molybdates [30], organic explosives [31], and functional semiconductors [32].
OA is a particle-mediated mechanism where adjacent crystals (nanograins) with similar crystallographic orientations undergo rotation, translation, and coalescence to form larger, single-crystalline domains (also termed “grains” in this context) [33,34]. This mechanism is crucial for overcoming the large lattice mismatch and interfacial stress inherent in heterosystems [35,36].
In diamond heteroepitaxy, especially on Ir(100), experimental observations consistently show the formation of isolated primary nuclei followed by their coalescence into continuous films. This unique growth trajectory, in which isolated nuclei evolve into coalesced films, demands a mechanistic framework beyond classical models. In contrast to conventional vapor–solid transformation (where adatoms bind to crystal surfaces stochastically) [37,38] or step-flow growth (which requires pre-existing atomic steps as templates) [19,39], OA enables spontaneous crystallographic alignment and coalescence of neighboring islands under near-equilibrium conditions [36]. This mechanism dynamically overcomes traditional kinetic barriers, facilitating low-defect domain formation. Table 1 conceptually contrasts the fundamental distinctions among these three dominant pathways in diamond heteroepitaxy.

Table 1.
Comparative framework of growth mechanisms in diamond heteroepitaxy.
However, despite its significance, the atomistic details and driving forces governing OA-mediated diamond growth remain underexplored. Systematic investigations using computational tools specifically targeted at the OA mechanism in diamond are notably sparse. First-principles calculations, capable of revealing interfacial bonding energetics and electronic structure changes during nucleation, have seldom been applied to elucidate the diamond OA process. Similarly, molecular dynamics (MD) simulations, essential for capturing the dynamic reorientation and attachment kinetics of diamond nuclei under realistic growth conditions, have received limited attention. The scarcity of such multiscale computational studies hinders the development of a predictive understanding and optimization of diamond heteroepitaxy.
This research aims to bridge the gap identified in understanding oriented attachment during diamond heteroepitaxy on Ir(100) through a comprehensive, multi-methodological investigation. First-principles density functional theory (DFT) calculations, molecular dynamics (MD) simulations, and experimental validation provided by scanning electron microscopy (SEM), atomic force microscopy (AFM), and Raman spectroscopy are combined to systematically characterize the growth and connection of diamond crystal nuclei. The integrated insights from these computational and experimental approaches establish a fundamental understanding of OA in diamond growth, providing critical guidance for optimizing single-crystalline diamond film quality via substrate engineering and process control.
2. Materials and Methods
2.1. First-Principles Calculations
First-principles density functional theory (DFT) simulations were carried out using the CASTEP module within Materials Studio 2019. All calculations adopted the generalized gradient approximation (GGA) with the Perdew–Burke–Ernzerhof (PBE) functional to treat exchange–correlation interactions. Electron–ion interactions were described using OTFG (on-the-fly generation) ultrasoft pseudopotentials. A plane-wave energy cutoff of 650 eV was applied throughout, and the TS (Tkatchenko-Scheffler) dispersion scheme for DFT-D correction was applied to address van der Waals interactions. Geometric optimizations were considered converged when at least one of the following criteria was satisfied: the energy difference between consecutive steps fell below 1.0 × 10⁻⁵ eV per atom, the maximum force on any atom was less than 0.03 eV/Å, the maximum stress component was under 0.05 GPa, or the maximum ionic displacement was smaller than 0.001 Å. The self-consistent field (SCF) iteration convergence threshold was rigorously set to 1.0 × 10⁻⁶ eV.
2.1.1. Interface Analysis
The atomic-scale structure of the Ir(100)/diamond (100) interface was investigated using a slab model with the epitaxial orientation relationship [110](001)Ir//[110](001)Diamond (Figure 1). The model consisted of 6 atomic layers of iridium and 8 atomic layers of diamond. To accurately simulate interfacial behavior, the innermost 2 layers of Ir atoms and 2 layers of diamond atoms were fully relaxed during optimization, while the outermost layers remained fixed at their bulk-terminated positions. Integration over the Brillouin zone used a Monkhorst–Pack k-point grid of 6 × 6 × 1. A vacuum layer of 15 Å thickness was introduced normal to the interface to eliminate artificial interactions between periodic images.
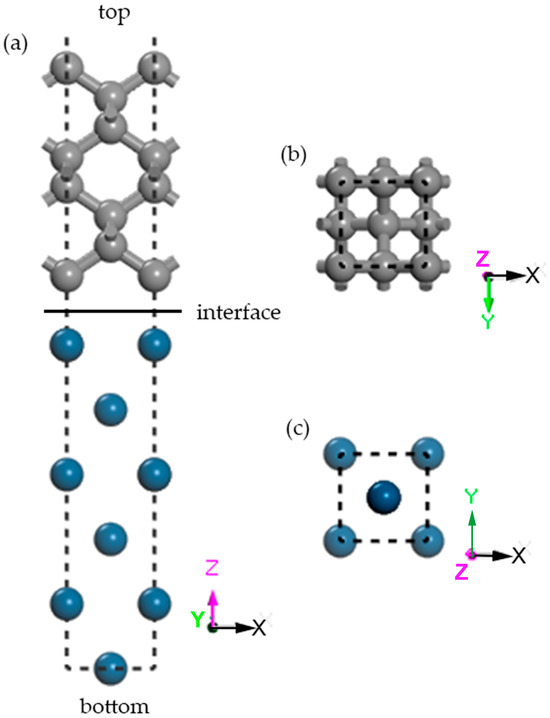
Figure 1.
The interface structure of [110](001)Ir//[110](001)Diamond consists of 6 layers of Ir and 8 diamond atomic layers: (a) front views of the interfaces; (b,c) cross-sectional drawings of atomic layers at the interface of Ir substrates and diamond in the above structures. Different atoms are coded by colors: blue and grey balls represent Ir and C atoms. The coordinate axis and directions are shown.
2.1.2. Diamond Nucleation Growth
The atomistic process of early-stage diamond nucleation on the Ir(100) surface was modeled by systematically increasing carbon atom coverage from 0 ML to 1.00 ML (where 1 ML corresponds to a complete monolayer of carbon atoms adsorbed on all available Ir surface sites), with 0.125 ML increments. Coverage increments represented key stages: At the initial 0.125 ML coverage, carbon adatoms occupied precisely one-eighth of available Ir surface sites, forming isolated adsorption centers. As coverage reached 0.50 ML, half of the Ir surface sites became populated, enabling adatom interactions and preliminary cluster formation. The 0.75 ML stage represented three-quarters surface coverage, where steric constraints necessitated partial development of a secondary carbon layer as adsorption sites became saturated. Finally, the 1.00 ML condition achieved complete monolayer coverage with carbon atoms uniformly blanketing the Ir surface. Throughout these simulations, hydrogen termination effects were deliberately excluded to isolate the fundamental carbon–iridium interaction dynamics. Computational protocols including pseudopotential, functional, and convergence criteria-remained identical to those used for the interface model, while 1 × 6 × 1 k-point meshes were employed.
2.2. Molecular Dynamics Simulations
Grain coalescence mechanisms in polycrystalline diamond were investigated using Forcite. Twin-boundary models capturing specific misorientation angles, from 53.13° to 4.77°, were constructed to represent key grain configurations. Atomic interactions were described by the COMPASS II force field, a high-accuracy parametrization for carbon systems. Prior to dynamic simulations, all structures underwent rigorous geometric optimization until meeting convergence criteria where energy changes stabilized below 1 × 10⁻⁴ kcal/mol, residual forces dropped under 0.005 kcal/mol/Å, stress components reduced to 0.005 GPa, or ionic displacements fell below 5 × 10⁻⁵ Å.
Following geometric optimization, molecular dynamics simulations were conducted to study configuration evolution under controlled conditions. The system underwent progressive thermal equilibration using an NVT ensemble with the Nose–Hoover thermostat. Simulation commenced at 273 K for 5 ps. The temperature was then systematically elevated to 573 K, where it stabilized for another 5 ps, followed by a further increase to 773 K maintained for 5 ps. The target temperature of 1073 K to match experimental diamond growth conditions was subsequently reached and held constant for 50 ps to ensure thorough thermalization. Following this staged heating protocol, the ensemble was switched to NVE with additional 50 ps for production simulation. Throughout both the NVT equilibration phase and the subsequent NVE production phase, a consistent timestep of 1 fs was employed to ensure numerical stability while resolving atomic trajectories with sufficient temporal resolution. Non-bonded electrostatic and van der Waals interactions were computed with full periodicity using the Ewald summation method under 3D boundary conditions.
2.3. Experimental Details
2.3.1. Substrate Preparation
Single-crystal MgO(100) substrates (10 × 10 mm2) were ultrasonically cleaned in acetone and ethanol prior to deposition. A 60 nm thick iridium film was deposited via electron-beam evaporation using a 99.9% pure Ir target under ultrahigh vacuum (base pressure: <1 × 10⁻⁴ Pa). The deposition rate was precisely controlled at 0.2 Å/s, with the substrate maintained at 700 °C to enhance film adhesion and crystallinity. To achieve atomically flat surfaces essential for heteroepitaxy, the Ir/MgO stack underwent post-deposition annealing at 900 °C for 1 h in Ar atmosphere.
2.3.2. Diamond Deposition
Heteroepitaxial diamond growth was executed in a microwave plasma-assisted chemical vapor deposition (MPCVD) system. Table 2 details the four-stage process:
Table 2.
Experimental conditions for bias-enhanced nucleation and growth of diamond on iridium.
- H2 Cleaning (25 min): Pure hydrogen plasma at 700 °C removed surface contaminants.
- Stabilization (5 min): Introduction of 3% CH4/H2 at reduced power enabled plasma equilibrium.
- Bias-Enhanced Nucleation (BEN) (60 min): Critical nucleation phase (−250 V bias at 800 °C) with 3% CH4.
- Growth (120 min): Diamond expansion at 900 °C with 2% CH4 and increased power.
Samples (D-Ir-2#/f2#, D-Ir-3#, and D-Ir-4#) were extracted at 30, 60, and 120 min during the growth stage for phase-specific analysis.
2.3.3. Characterization
To establish structural evolution during diamond growth process, the SEM, AFM, Raman, and XRD analytical techniques were systematically employed. Field-emission scanning electron microscopy (SEM) analysis using an Quanta 200FEG instrument (5–10 kV acceleration voltage, 50–300,000× magnification, FEI Company, Hillsboro, America) was implemented to resolve nucleation topography and grain coalescence dynamics. Surface morphology evolution and roughness quantification were achieved through atomic force microscopy (AFM) performed on a Dimension FastScan system (Bruker, Rheinstetten, Germany) in contact mode (1.0 Hz scan rate). Micro-Raman spectroscopy using a LabRAM HR Evolution confocal spectrometer (HORIBA France SAS, Palaiseau, France) with a 532 nm excitation laser (~1 μm spot diameter, ≤0.35 cm−1 spectral resolution across 50–9000 cm−1 range) and restricted laser power (2 mW) was conducted specifically to unambiguously differentiate sp3/sp2 carbon phases and quantify crystalline quality while precluding thermal degradation. Finally, phase identification of film grown on defective Ir(100) substrate was performed using a X’Pert Pro multipurpose X-ray diffractometer with a PIXcel 1D detector (PANalytical B.V., Almelo, and Netherlands) (Cu Kα radiation, λ = 1.5406 Å, 2.2 kW), which can scan 2θ from 0° to 167° with a minimum step size of 0.0001° and an angular accuracy of ±0.01°.
3. Results and Discussion
3.1. Ir(100)/Dia(100) Interfacial Interactions
The interfacial interactions between Ir(100) and diamond (100) (denoted Dia(100)) were systematically analyzed through adhesive energy calculations, density of states (DOS), differential charge density, interfacial microstress, and Mulliken bond population to gain a comprehensive understanding of the bonding nature and nucleation energetics.
3.1.1. Adhesive Energy and Interfacial Stress
The adhesive energy (Wad) of the Ir(100)/Dia(100) interface was calculated using Equation (1):
where Wad(Ir/Dia), EIr, EDia, and EIr/Dia are the total energies of the isolated Ir slab, diamond slab, and the fully relaxed interface system, respectively, and AIr/Dia is the interface area. A notably high adhesive energy of 8.17 J/m2 was obtained, confirming exceptional interfacial stability and robust film–substrate adhesion that suppresses diamond film delamination. This strong adhesion originates from direct d-sp3 orbital hybridization (Ir 5d and C 2p), providing a thermodynamic driving force for primary diamond nucleation and facilitating orientation adjustment mechanisms (e.g., via grain rotation/translation) during coalescence, enabling the unique diamond growth resilience of iridium. It establishes a new paradigm for extreme-adhesion heterostructure design. Consequently, during the bias-enhanced nucleation (BEN) stage (−250 V bias), densely packed nuclei form on the Ir substrate, experimentally validating the critical role of interfacial bonding in enhancing nucleation density.
However, interfacial stress, evaluated via the stress tensor components (σxx, σyy, and σzz) as detailed in matrix (2), also significantly impacts film integrity.
While pronounced compressive stress in the z-direction inhibits layer-by-layer growth and limits nucleus size, it concurrently induces localized defects due to its potential to exacerbate interfacial shear failure at crack sites. The identified tensile stress along x synergistically compromises interfacial integrity. This tension–compression pairing anisotropic stress state cooperatively creates preferential pathways for disordered nucleation. Moreover, thermal expansion mismatch during heating often causes cracking in Ir films. Substrate cracking leads to disordered grain orientations, hindering oriented attachment when misorientation angles substantially exceed critical thresholds. Optimal temperature control plays a crucial role in preventing this failure mode during film growth.
3.1.2. Electronic Properties
To elucidate the Ir-C bond character beyond adhesive energy, electronic properties, especially density of states (DOS) and differential charge density, were examined. Partial density of states (PDOS) spectra for carbon atoms within the diamond bulk (sixth atomic layer) and at the interface are presented in Figure 2a,b.
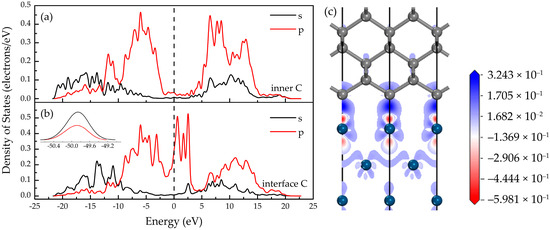
Figure 2.
Electronic properties at the Ir/diamond interface. Partial density of states (PDOS) of C atoms of diamond on Ir(100) substrate: (a) C atom located inside the crystal (sixth atomic layer); (b) C atoms at the interface, with the inset showing the density of states at energies ranging from −50.4 eV to −49.2 eV; (c) differential charge density diagram of the interface model along the [110] direction. The dashed lines represent the Fermi level in (a,b).
Compared to bulk carbon atoms, interfacial C atoms exhibit significant metallization, evidenced by enhanced DOS near the Fermi level in Figure 2b. This correlates with pronounced hybridization between C 2p orbitals and Ir states, forming strong Ir-C bonds. New resonance peaks emerge at −49.9 eV (C 2s/2p) and at 0.59 eV/1.67 eV/2.55 eV (C 2p near EF), attributable to Ir-C orbital hybridization and charge redistribution. This hybridization enhances carbon migration on the Ir surface, facilitating primary nucleus rearrangement. Supporting Mulliken bond population analysis confirms an Ir-C ionic bond (bond population: 0.324 |e|; length: 1.913 Å) dominated by charge transfer (Ir+ → C−), stabilizing adsorption sites.
Differential charge density analysis along the [110] direction (Figure 2c) demonstrates electron accumulation around C atoms (blue regions) and depletion around Ir atoms (red regions), confirming the ionic bonding character. This strong charge polarization generates localized electric fields that suppress layered growth (Frank–van der Merwe mode), instead promoting island growth (Volmer–Weber mode) characterized by discrete nuclei. Ionic bonding concurrently enhances grain boundary closure capabilities, enabling defect annihilation at small misorientation angles.
Collectively, the interfacial properties reveal robust bonding interactions between the iridium substrate and diamond, enabling strong adhesion. However, significant tensile stresses present at the interface may induce delamination or cracking of the Ir film during diamond growth. Crucially, this interface governs the heteroepitaxial pathway: during the nucleation stage, strong adhesion, Ir-C ionic bonding, and electron transfer collectively anchor primary diamond nuclei (<100 nm). In the subsequent growth stage, high tensile stress suppresses uniform spreading, thereby compelling expansion through lateral interconnection of nuclei.
3.2. Stepwise Growth of Diamond Nuclei
3.2.1. Interfacial Geometry and Bond Evolution
The progressive growth of diamond films on the Ir(100) substrate from initial adsorption to full monolayer coverage was systematically modeled at coverages of 0–1 ML, with an interval of 0.125 ML. The evolution of the structure under different coverage rates is shown in Figure 3, which displays differential charge density information as well. Geometric parameters governing interfacial evolution during stepwise diamond growth are quantified in Table 3, delineating coverage-dependent structural transformations.
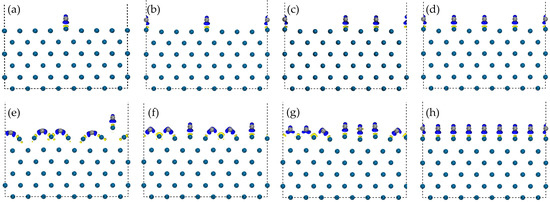
Figure 3.
Stable configurations and electron density differences at different diamond (C atoms) coverage rates on Ir(100) substrate: (a) 0.125 ML; (b) 0.25 ML; (c) 0.375 ML; (d) 0.50 ML; (e) 0.625 ML; (f) 0.75 ML; (g) 0.875 ML; and (h) 1.00 ML. The blue isosurfaces (0.02 e/Å−3) represent electron accumulation, while the yellow ones (0.02 e/Å−3) represent electron depletion. Atom color coding follows Figure 1: blue = Ir; grey = C.
Table 3.
Interfacial geometric parameters during diamond nucleation on Ir(100). Calculated Ir–Ir layer spacings within uncovered substrate regions (dIr-Ir-uncovered), Ir–Ir layer spacings beneath adsorbed carbon atoms (dIr-Ir-covered), and Ir–C bond lengths (dIr-C) at coverages of 0.125–1.00 ML.
Upon carbon adsorption on Ir(100), the substrate separates into two distinct domains below 0.625 ML coverage. Uncovered regions retain near-bulk Ir-Ir spacings (dIr-Ir-uncovered ≈ 1.91–1.95 Å), while covered areas exhibit moderate expansion (dIr-Ir-C atop ≈ 2.21–2.24 Å) with carbon adatoms occupying atop sites. At 0.50 ML coverage, Ir-C bonds reach their local minimum length (dIr-C = 1.737 Å), signifying strong binding. This nucleation-optimized state, where nuclei spacing matches their dimensions, is stabilized by moderate compressive biaxial stresses (σxx = −7.83 GPa; σyy = −7.64 GPa). The corresponding minimal vertical stress (σzz = −0.23 GPa) indicates primarily in-plane lattice contraction, preserving interfacial coherence and creating ideal precursors for oriented attachment growth.
The abrupt transition at 0.625 ML involves carbon relaxation into hollow sites, triggering site-dependent lattice responses: hollow-adsorbed regions show mild expansion (dIr-Ir-C hollow = 2.00 Å), but carbon retention at competing atop sites generates extreme vertical expansion (dIr-Ir-C atop = 5.81 Å) due to direct Ir-C bond pull-up. This dualistic deformation, coupled with Ir-C bond bifurcation (1.712–1.862 Å), reflects local lattice instability driven by site competition, where adjacent hollow/atop adsorption creates incompatible strain fields. This strain-driven instability directly enables diamond nuclei reorientation and coalescence via an oriented attachment mechanism. Concurrent biaxial compression intensification (σxx = −8.47 GPa; σyy = −8.13 GPa) provides the thermodynamic driving force for this attachment transition, while extreme distortion partially delaminates surface Ir atoms, generating shear stresses that locally exceed the yield strength of iridium, amplifying mechanical damage risks.
Post-transition, enhanced dIr-Ir-C atop values (2.27–2.46 Å) and heterogeneous dIr-C (1.736–1.949 Å) confirm interfacial reorganization. At 1.00 ML, compressed dIr-Ir-C atop (2.14 Å) and uniform dIr-C (1.759 Å) signal restored interfacial coherency, establishing a structurally compatible foundation for quasi-homoepitaxial diamond growth.
Thus, 0.50 ML constitutes a metastable nucleation threshold optimized for initiating oriented attachment, while the site competition instabilities at 0.625 ML release sufficient energy to drive kinetically favored diamond nuclei coalescence. This unique strain progression establishes 0.50 ML as the critical node for epitaxial diamond assembly via stress-mediated attachment pathways.
3.2.2. Electron Transfer Kinetics
Differential charge density analysis (Figure 3) unambiguously reveals persistent electron transfer from Ir to C across all coverages, validating ionic bonding character (Ir+ → C−). The evolution of carbon charge populations, quantitatively assessed through Mulliken analysis (Table 4), reveals critical transitions in electronic dynamics during diamond nucleation. These charge transfer patterns directly control interfacial bonding kinetics and regulate mechanically driven assembly processes.
Table 4.
Mulliken charges of carbon adatoms during diamond nucleation on Ir(100).
At low coverages (0.125–0.50 ML), atop-adsorbed carbon exhibits stable charge populations (−0.07 to −0.08), with optimal charge redistribution kinetics emerging at 0.50 ML. Here, minimized barriers enable rapid stabilization of adsorbates through efficient charge transfer pathways during initial diamond nucleation—precisely matching the strain configuration ideal for initiating oriented attachment processes.
The critical transition occurs at 0.625 ML when substrate restructuring forces carbon relaxation into hollow sites. This geometric rearrangement triggers extreme orbital polarization, in which hollow-site carbon exhibits profoundly enhanced electron capture (−0.29), while competing atop carbon retains moderately elevated negativity (−0.10). This bimodal charge distribution directly correlates with the mechanical instability inducing massive layer expansion (dIr-Ir-C atop = 5.81 Å). Crucially, such substantial charge differentiation generates strong electrostatic gradients that accelerate diamond nuclei rotation and alignment—providing the electrostatic driving force for orientation-sensitive coalescence through the proposed oriented attachment mechanism.
As coverage increases further, growing C–C interactions within nascent diamond clusters progressively attenuate polarity per adsorption site. Hollow-site populations moderate from −0.24 (0.75 ML) to −0.22 (0.875 ML), while atop sites weaken to below −0.06. This decline coincides with reduced charge redistribution efficiency at the strained interface. Complete saturation at 1.00 ML restores homogeneous atop adsorption with a mild population (−0.06), indicating partial charge equilibration as the system stabilizes toward a state conducive to subsequent quasi-homoepitaxial diamond growth.
Thus, while 0.50 ML establishes the optimized kinetic platform for initial oriented attachment assembly, the extreme charge polarization at 0.625 ML serves as the electrostatic engine enabling nuclei reorientation and fusion—synergistically aligning with mechanical instabilities to drive epitaxial coalescence.
3.2.3. Formation Energetics and Growth Mode Transition
Diamond nucleation thermodynamics is characterized by two distinct energy metrics that define interfacial evolution: one-step formation energy (ΔEone-step), representing the total energy difference when creating nuclei at a target coverage (0–1.00 ML) directly from pristine Ir(100), and stepwise formation energy (ΔEstep-by-step), quantifying the incremental energy change during sequential addition of 0.125 ML carbon increments. Explicitly, ΔEone-step is defined as (3):
where EIr denotes the energy of the clean Ir(100) surface, EIr/Dia is the energy of the Ir surface covered by diamond nuclei, and EDia-deposited corresponds to the energy contribution of the deposited carbon atoms composing diamond nuclei. Conversely, ΔEstep-by-step for each discrete 0.125 ML growth step is computed as (4):
where En−1 and En represent the system energies before and after adsorption of 0.25 ML carbon, respectively, and EDia−0.25ML is the energy of the newly added carbon adatoms at 0.125 ML.
Comprehensive analysis through Equations (3) and (4) reveals the energetics governing diamond nucleation on Ir(100), as visualized in the energy curves of Figure 4.
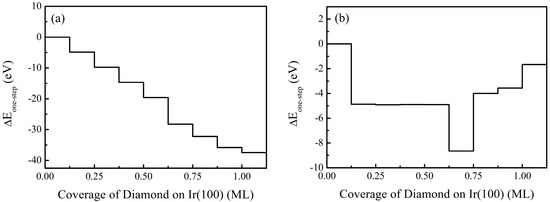
Figure 4.
Energy changes at different diamond coverage rates from 0 ML to 1.00 ML on Ir(100) substrate: (a) one-step formation energy; (b) step-by-step formation energy, with the clean Ir(100) surface set as the reference state, ΔEIr(100) = 0 eV.
Both one-step (ΔEone-step) and stepwise (ΔEstep-by-step) formation energies undergo progressive stabilization with increasing coverage, confirming spontaneous diamond assembly. Notably, the energy landscape exhibits distinctive phase transformations at critical thresholds that govern attachment pathways. For the one-step pathway (Figure 4a), the monotonic energy descent from 0.125 to 1.00 ML (−4.87 to −37.48 eV) shows a dramatically accelerated stabilization between 0.50 and 0.625 ML, where the energy dives by 8.65 eV. While thermodynamically favorable, this steep drop risks driving the system rapidly past the metastable 0.50 ML state, which is the optimal window for oriented attachment where nuclei retain crucial translational and rotational freedom for alignment.
The stepwise energy profile (Figure 4b) further elucidates this mechanical transition window. Sequential additions exhibit minimal energy release (−4.87 to −4.91 eV) below 0.50 ML, characteristic of moderate interfacial reorganization preceding coalescence. The abrupt thermodynamic leap at 0.625 ML (−8.65 eV stepwise change) coincides precisely with maximal mechanical instability (dIr-Ir-C atop = 5.81 Å) and charge polarization (−0.29 e) from our structural analyses, proving this coverage jump provides the primary energetic impetus for oriented attachment. However, the precipitous nature of this transition, which is evidenced by near-fixation of ΔEstep-by-step values thereafter (<4.00 eV after 0.625 ML), risks kinetically freezing diamond nuclei before achieving perfect atomic registry during coalescence.
This dual energetic imperative defines the epitaxy contradiction; that is, the 0.50–0.625 ML region provides maximal driving force for oriented attachment but simultaneously threatens to rapidly deplete the surface carbon mobility essential for alignment perfection. Strategically, suppressing carbon flux toward 0.50 ML coverage maximizes retention of the attachment-ready state while containing supersaturation-triggered relaxation.
To resolve this contradiction and achieve strategic carbon flux control, experimental approaches like patterned epitaxy are essential. Our analysis directly validates the experimental success of patterned nucleation growth by Yoshikawa et al. [40] and ion-bombardment-induced buried lateral growth (IBI-BLG) by Schreck et al. [41]. Artificially engineered nucleation sites replicating the metastable 0.50 ML geometry (Figure 5) prolong the kinetically active attachment phase while overriding natural carbon agglomeration. This spatial confinement (i) enhances interfacial binding by enforcing in-plane registry and (ii) suppresses lateral misalignment during coalescence, mechanically accounting for the documented reduction in mosaic spread in patterned diamond. The subsequent energy drops to −1.67 eV at full coverage confirms lateral attachment dominance over layer-by-layer growth, as diminished energy release beyond 0.625 ML favors strain-minimizing inter-island coupling over vertical stacking.
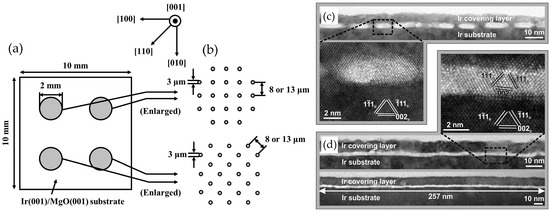
Figure 5.
Uniform diamond distribution with intergranular gaps on patterned Ir(100): (a,b) Yoshikawa et al. [40] (Reprinted with permission from Ref. [40]. Copyright 2015, Elsevier) and (c,d) Schreck et al. [41] (Reprinted with permission from Ref. [41]. Copyright 2017, Matthias Schreck et al). Sites mirror 0.50 ML geometry to enable oriented attachment.
This graphoepitaxial strategy succeeds by exploiting the metastable pre-coalescence state through targeted site generation before growth, thereby bypassing supersaturation-driven kinetic traps. Consequently, strain-minimized lateral attachment predominates over suboptimal layer-by-layer modes, resolving the heteroepitaxial contradiction between thermodynamic driving forces and kinetic alignment requirements.
This mechanistic synergy is rooted in the fundamental growth behavior of the system. The irreversible transition to Volmer–Weber growth is inherent to diamond/Ir heteroepitaxy, where lateral island coalescence replaces layer-by-layer stacking, which is evidenced by the absence of homoepitaxial growth steps in early stages. Geometric and energetic data synergistically delineate a hierarchical mechanism initiated by thermodynamically optimal 0.50 ML nuclei: isolated nuclei spontaneously form, expand via carbon incorporation, and bridge through oriented attachment to establish the first continuous layer. Suppressing carbon flux is essential to regulate connection timing during coalescence by stabilizing nuclei near the 0.50 ML metastable state that preserves mobility for alignment.
3.3. Molecular Dynamics Simulation of Diamond Grain Connection
Molecular dynamics simulations of diamond twin models with varying grain boundary angles were geometrically optimized using the Forcite module.
As illustrated in Figure 6a–e, models with grain boundary angles (Σ) exceeding 11.42° exhibited only minor structural adjustments upon relaxation while largely retaining their original orientations. However, systems below critical angular thresholds displayed transformative behavior. Specifically, boundaries initially near Σ9.53° relaxed into localized small-angle configurations (0.68°) with observable short-range lattice reorientation spanning three to four C-C bond lengths (Figure 6f). This reorientation established coherent interfaces that served as precursors for oriented attachment (OA).
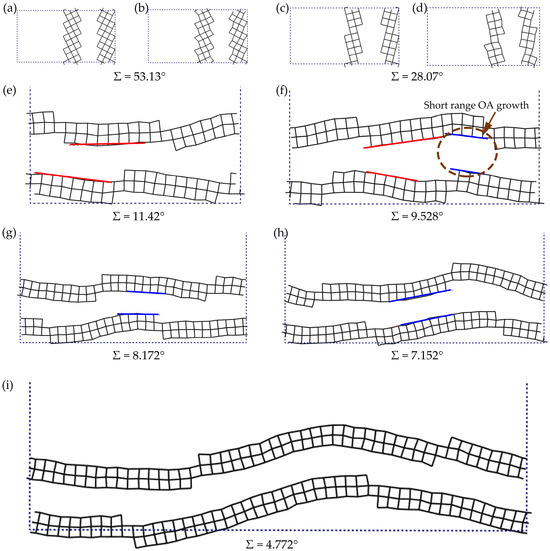
Figure 6.
Structural evolution of diamond grain boundaries upon geometric optimization for varied initial misorientation angles: Σ = 53.13° (a) before and (b) after optimization; Σ = 28.07° (c) before and (d) after optimization; (e–i) Σ = 11.42°, Σ = 9.528°, Σ = 8.172°, Σ = 7.152°, and Σ = 4.772° after optimization, respectively. The black grids represent diamond atoms and bonds, and the dashed lines are the crystal lattices. The red lines indicate the area where no attachment growth have formed, while blue ones highlight reoriented atomic segments achieving crystallographic continuity.
Quantitative relationships between initial grain boundary angles, optimized configurations, and interfacial energetics are systematized in Figure 7. The inverse correlation between initial Σ and binding energy emerged clearly, in which decreasing pre-optimization angles can substantially enhance interfacial stability, with binding energies intensifying from 0.37 kcal/mol·Å2 at Σ53.13° to 0.59 kcal/mol·Å2 at Σ7.15°. A critical deviation from this trend occurs within the Σ ≈ 10° window. Systems at Σ14.25° attained a relatively high binding energy of 0.54 kcal/mol·Å2, whereas subsequent configurations at Σ11.42° and Σ9.53° exhibited anomalously diminished stabilization (about 0.49 kcal/mol·Å2), despite their lower initial angles. This energy depression correlates with heterogeneous structural relaxation where localized lattice elevations create rotational freedom that enables crystallographic realignment in adjacent areas, partially offsetting stabilization through internal strain redistribution. Such transitional configurations represent metastable intermediates during OA initiation. Below this threshold, binding energy dramatically rebounds as initial Σ decreases further. Concurrently, angular contraction post-optimization became progressively more pronounced below Σ < 10°, with boundaries originally at Σ9.53–7.15° reconfigured toward near-parallelism (<1°), solidified by the rebounded energy stabilization.
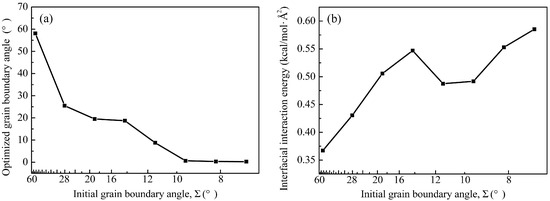
Figure 7.
The relationship between (a) optimized grain boundary angle and (b) interfacial interaction energy with the development of initial grain boundary angle.
This abrupt transition correlates with mosaic spread thresholds observed experimentally. When the grain boundary angle exceeds 11.42° (corresponding to high mosaic spread), grains preferentially undergo independent structural adjustments during growth, minimizing interfacial interactions and preventing crystallographic realignment. Conversely, at grain boundary angles Σ < 10° (low mosaic spread), accumulated lattice distortion enabled cooperative orientation adjustments that drive crystallographic registry, which first establishes short-range coherence <1 nm domains. As initial angles decreased toward Σ < 7°, OA-dominated reconstruction expanded to multi-nanometer scales, becoming nearly pervasive at Σ < 5°. The structural overhaul at Σ4.77° exemplifies this terminal transition, where concerted atomic translation and rotation erased interfacial discontinuities to establish monolithic crystallinity. This mechanism, termed oriented attachment (OA), facilitates the formation of single-crystalline domains through rotation and translation of adjacent crystallites.
Consequently, the initial formation of primarily diamond nuclei with closely aligned orientations (<5° angular deviation) provides the foundation for epitaxial growth. During subsequent stages, nanoscale nuclei formed via nucleation and aggregation processes spontaneously align according to the Ir(100) substrate orientation. Through continuous OA-mediated connection, these nuclei progressively achieve identical crystallographic orientations, ultimately forming high-quality secondary nuclei and the seed layer essential for heteroepitaxy.
3.4. Coalescence Behavior of Epitaxial Diamond Nuclei: Normal Versus Defective Regimes
Figure 8 presents SEM images of sample D-Ir-2#, revealing the connection process among diamond nuclei on the Ir(100) substrate.
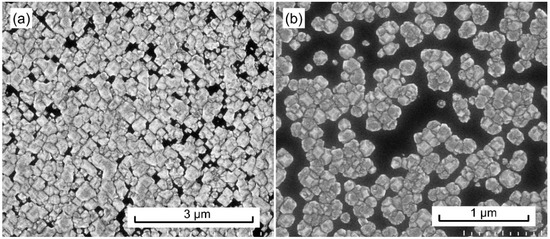
Figure 8.
Coalescence of diamond nuclei on Ir(100) substrate: SEM image. (a) Central region; (b) edge region.
In the central substrate region (Figure 8a), extensive nucleus coalescence is observed, forming aggregated domains (termed “crystallite domains”) wherein numerous nuclei share nearly identical crystallographic orientations. These domains evolve from pre-existing structures generated during bias termination, while peripheral regions exhibit non-epitaxial grains or non-diamond phases (e.g., sp2-hybridized carbon). Notably, such crystallite domains are uniquely critical for diamond heteroepitaxy on Ir(100), as they remain unobserved on other heterosubstrates. In the edge region (Figure 8b), temperature non-uniformity results in less complete connections, yet finer nuclei emerge between larger ones, promoting interfacial bridging.
Three-dimensional AFM topography (Figure 9) further elucidates the atomic-scale connection dynamics. Figure 9a confirms seamless coalescence of small grains with obliterated grain boundaries, while Figure 9b demonstrates primary nuclei merging into a singular enlarged grain.
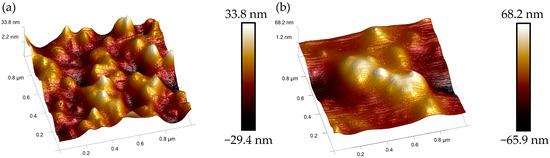
Figure 9.
Atomic-scale coalescence dynamics of diamond nuclei on Ir(100) substrate: 3D AFM topography. (a) Central region; (b) edge region.
Though crystal quality at the substrate edge is slightly inferior to the central region due to thermal fluctuations, its overall acceptability ensures the fundamental integrity of the diamond wafer.
Larger secondary nuclei coalescence (Figure 10) demonstrates micron-scale lateral dimensions (200–500 nm height). These crystallites predominantly expose (100) facets with step features.
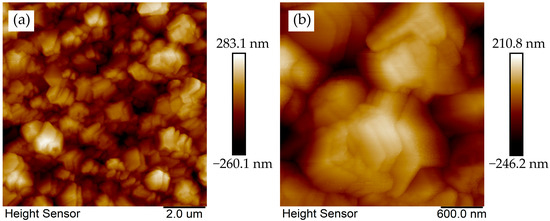
Figure 10.
AFM morphologies of coalesced diamond crystallites on Ir(100) substrate. (a) Two-dimensional topography; (b) magnified view.
Figure 11 inset exhibits substantially enhanced diamond-phase dominance in Raman spectra (Figure 11). The weakened 1150 cm−1 nanocrystalline peak implies progressive consumption of primary nuclei through coalescence, forming coarser epitaxial grains.
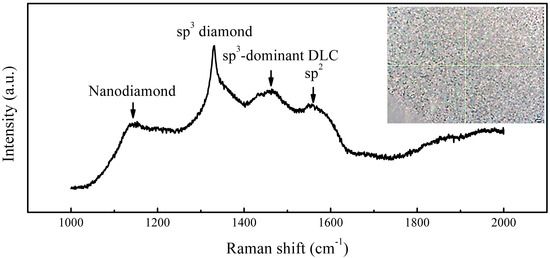
Figure 11.
Raman spectra of coalescing diamond grains on Ir(100) substrate (inset: aggregate location).
Contrastingly, Raman analysis of non-connected regions (“black gap” areas) in sample D-Ir-2# (Figure 12) reveals characteristic diamond peaks at 1332 cm−1 alongside prominent sp2-derived signals (1500–1580 cm−1), indicating residual non-diamond carbon phases. Critically, the distinct 1150 cm−1 peak, a signature of nanocrystalline diamond, confirms in situ generation of new primary nuclei within these regions. These nascent nuclei will subsequently grow and coalesce with pre-existing domains, ultimately integrating into the epitaxial film.
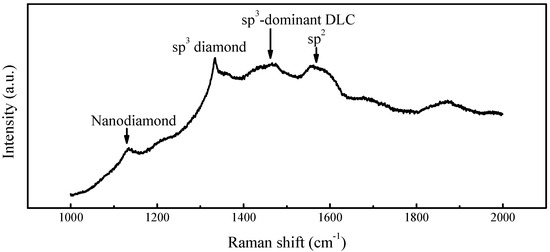
Figure 12.
Characterization of unconquered interfacial gaps: Raman spectra from non-coalesced regions on Ir(100) substrate.
To further elucidate the structural differences between coalesced and non-coalesced regions, peak fitting of Raman spectroscopy data was performed in the 1200–1700 cm−1 range (Figure 13). The quantitative parameters of peaks are listed in Table 5.
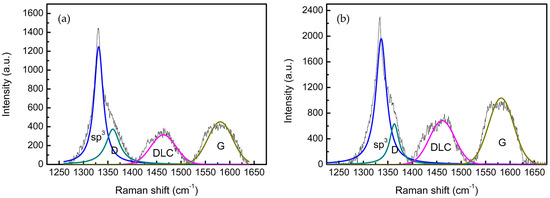
Figure 13.
Fitted Raman spectra for (a) diamond nucleus coalesced region (corresponding to Figure 11) and (b) non-coalesced region (corresponding to Figure 12). The black line is the original data after removing the background. Peak assignments: diamond (sp3)—blue; graphite (D and G bands)—cyan and dark yellow; DLC (diamond-like carbon) fragments—magenta.
Table 5.
Raman spectral peak fitting parameters for the coalesced and non-coalesced regions of diamond films. Parameters include peak centers (cm−1), full width at half maximum (FWHM), analytical peak areas, relative shifts from ideal sp3 diamond (1333 cm−1), ID/IG ratio, and area ratios of sp2-graphite and diamond-like carbon (DLC) to perfect sp3 diamond.
The Raman spectra reveal distinct structural signatures correlated with diamond coalescence behavior. In coalesced regions (Figure 13a), the sp3 diamond peak exhibits a significant left-shift to 1329.74 cm−1, Δ = −3.26 cm−1 relative to stress-free diamond (1333 cm−1) alongside a reduced FWHM (21.97 cm−1), explicitly confirming lattice tensile strain and enhanced crystallinity resulting from inter-grain interactions and atomic realignment. This is mechanistically consistent with the computationally predicted in-plane tensile stress (σxx) arising from interfacial and inter-grain interactions during diamond deposition and oriented attachment. Moreover, these regions feature higher perfect sp3 dominance, evidenced by 32% lower sp2/sp3 area ratios (0.68 vs. 0.86) and 21% lower DLC/sp3 ratios (0.47 vs. 0.57) compared to non-coalesced zones. The elevated ID/IG ratio (0.67) further indicates disordered sp2 configurations, providing thermodynamic driving forces for sp3 conversion during grain integration.
In contrast, non-coalesced regions (Figure 13b) display a near-ideal sp3 peak position (1333.09 cm−1, Δ = +0.09 cm−1) with broader FWHM (25.49 cm−1), confirming strain-free growth of isolated diamond microcrystals without mutual interaction. These areas harbor greater proportions of structurally ordered sp2 carbon (ID/IG = 0.33) and higher DLC content (DLC/sp3 = 0.57), creating nucleation-active domains primed for secondary crystal formation.
Nucleation and growth processes are inherently concurrent, where the distinction is blurred when nucleus density reaches a critical threshold enabling inter-particle contact. New “primary nuclei” continuously form during the growth phase, while existing nuclei connect to form “secondary nuclei” (aggregated domains). This terminology reflects structural hierarchy rather than temporal sequence; any newly formed isolated nucleus is “primary”, whereas assemblies arising from connections become “secondary”. Simultaneously during secondary coalescence, additional primary nuclei may emerge, driving continuous crystalline domain expansion.
Conversely, localized substrate failure fundamentally alters coalescence dynamics. In regions where interfacial cracking occurred due to thermomechanical stress (sample D-Ir-f2#), SEM and AFM images demonstrate defective epitaxy with persistent angular mismatches exceeding computational thresholds (Figure 14 and Figure 15).
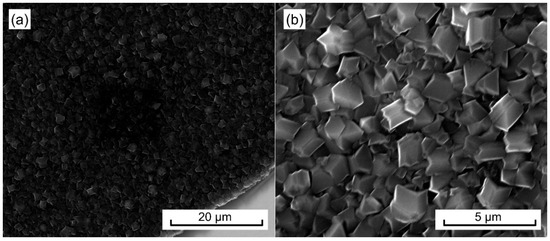
Figure 14.
Defective growth on fractured Ir film: SEM images of diamond grains. (a) Diamond grains on detached Ir fragment; (b) magnified view.
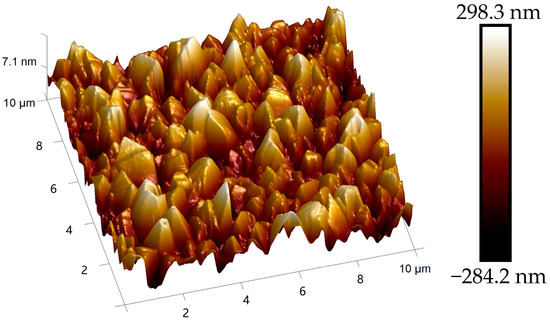
Figure 15.
Topographic disorder on cracked substrate: AFM height image of diamond crystallites grown on fractured Ir(100).
Crucially, this misorientation prevents the boundary annihilation observed in intact regions. Instead, crystallites develop pyramidal morphologies characterized by exposed (111) facets, while Raman spectroscopy reveals coexistence of multiple diamond polymorphs. Beyond the dominant cubic diamond peak at 1333 cm−1, distinct phonon modes appear (Figure 16), corresponding to hexagonal diamond phases.
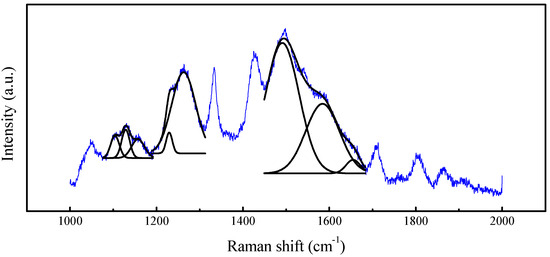
Figure 16.
Raman signatures of diamond grains developed on defective Ir(100) substrate. The blue line represents the measurement data, and the black line represents the fitted multiple Raman peaks indicating the disorder of crystal forms in the sample.
The phenomenon can be further confirmed by XRD patterns shown in Figure 17, which demonstrate characteristic peaks especially at 43.1° and 45.5° 2θ, indexed to hexagonal diamond (100) and (101) planes, coexisting with cubic diamond signatures. The persistence of these metastable polymorphs, likely stabilized by interfacial strain energies during non-equilibrium growth, along with unreduced sp2 carbon signatures, directly correlates with compromised coalescence efficiency in defective regions.
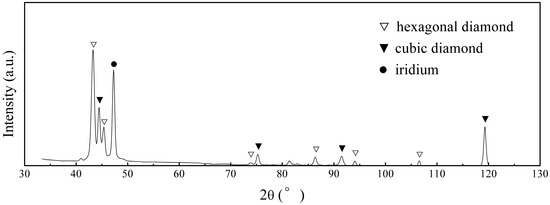
Figure 17.
XRD patterns of diamond films grown on defective Ir(100) substrate.
These contrasting behaviors establish substrate integrity as a prerequisite for oriented attachment-mediated growth. In intact Ir(100) regions, nuclei undergo crystallographic realignment leading to single-crystal domain formation. Where interfacial cracking occurs due to stress accumulation; however, the loss of epitaxial registry locks nuclei into irreversible misorientations. This kinematic constraint inhibits coherent coalescence, ultimately promoting polycrystalline growth with mixed diamond phases.
3.5. Grain Boundary Annihilation During Coalescence
The progression from interconnected secondary nuclei to a continuous epitaxial film is governed by the critical process of grain boundary annihilation. As evidenced in the SEM image of sample D-Ir-3#, coalesced domains evolve from initial aggregation (Figure 18a) to regions exhibiting progressive boundary elimination.
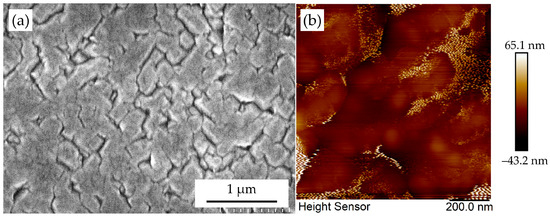
Figure 18.
The (a) SEM and (b) AFM morphology of sample D-Ir-3#, which show grain boundary annihilation of diamond crystals on Ir(100) substrate.
Atomic force microscopy (AFM) analysis also reveals distinct morphological transitions: boundaries between adjacent grains become partially fragmented and ultimately degenerate into linear defects rather than fully coherent interfaces (Figure 18b). This phenomenon arises from crystallographic realignment dynamics amplified by strong covalent rebonding at coherent facets.
The atomistic mechanism underlying boundary annihilation correlates directly with computational insights from grain connection simulations (Section 3.3). When the angular deviation between neighboring nuclei falls below a critical threshold, interfacial strain fields drive mutual lattice rotation and translation. This facilitates covalent bond reorganization across the boundary plane, replacing disordered interfaces with continuous lattices.
This microstructural evolution yields a near-continuous diamond layer primed for subsequent epitaxial thickening, while residual dislocations do not compromise seeding capability. Collectively, these observations establish boundary annihilation as the definitive transitional state preceding the formation of fully coherent epitaxial films.
3.6. Formation of Epitaxial Diamond Thin Films
Prolonged diamond deposition culminates in the formation of a continuous epitaxial film, as exemplified by sample D-Ir-4# after 120 min of growth. Scanning electron microscopy (SEM) reveals near-perfect coalescence across the central substrate region, characterized by seamless domains exceeding 5 μm in lateral dimension with minimal residual grain boundaries (Figure 19a). This progression marks the final stage of the hierarchical assembly process: primary nucleation, oriented-attachment-mediated coalescence (Section 3.4), and grain boundary annihilation (Section 3.5) collectively yield a closed sp3-bonded network.
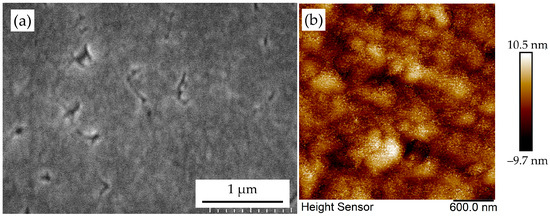
Figure 19.
The (a) SEM and (b) AFM morphology of sample D-Ir-4# in which a basically continuous diamond film has been formed.
Surface topography quantified by atomic force microscopy (AFM) confirms the transition to a continuous layer (Figure 19b). Measured surface roughness (Ra = 2.22 nm) represents a significant reduction compared to intermediate growth stages. Crucially, the line defects observed during boundary annihilation (Figure 18) are largely subsumed into the lattice, evidenced by the disappearance of discontinuous interfacial features. Residual topography dominantly reflects step-flow growth kinetics on the now-established diamond surface rather than grain misregistry, a key signature of single-crystalline character.
Raman spectroscopic analysis underscores the film’s high crystalline quality (Figure 20). The diamond phonon peak at 1332.90 cm−1 exhibits a narrow full width at half maximum (FWHM) of 5.64 cm−1, approaching values characteristic of high-purity homoepitaxial diamond (typically 2–3 cm−1). Concurrently, the complete suppression of graphitic (1500–1580 cm−1) and nanocrystalline diamond (1150 cm−1) signals confirms phase purity achieved through OA-mediated coalescence. The absence of hexagonal or rhombohedral diamond signatures further validates sustained heteroepitaxial alignment maintained throughout film closure.
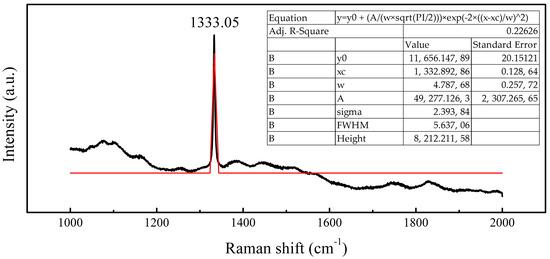
Figure 20.
Raman spectra of epitaxial diamond film, in which the diamond peak is fitted. The black line represents the measurement data, and the red line represents the fitted diamond Raman peak.
Formation of this continuous diamond layer establishes a functional “seed layer” for subsequent growth. Its crystallographic coherence enables homoepitaxial thickening modes analogous to those on bulk diamond substrates. Importantly, the naturally formed step edges on this coalesced surface act as continuous nucleation sites, eliminating the need for the plasma etching pretreatment typically required in conventional homoepitaxy. This inherent step-flow growth mode promotes layer-by-layer expansion, ultimately yielding superior crystal quality.
4. Conclusions
Heteroepitaxial diamond growth has traditionally faced challenges in achieving atomically coherent films due to complex nucleation and coalescence dynamics. This study clarifies these processes through a multiscale framework integrating computational modeling and experimental characterization. Thermodynamically, the system transitions from an interfacial energy-dominated state (Ir/diamond adhesive energy: 8.17 J/m2) toward bulk diamond cohesive energy dominance during film thickening. A complete heteroepitaxial pathway is demonstrated: optimal density nuclei form at ~0.50 ML carbon coverage, followed by OA-driven crystallographic alignment during coalescence, stress-assisted grain boundary elimination, and eventual film closure.
Molecular dynamics simulations established <5° as the critical misorientation angle enabling grain fusion, beyond which persistent defects form. The resulting coalesced layer exhibits residual threading dislocations propagating normal to the interface and sub-nanometer roughness, serving as a functional seed layer. Subsequent vertical expansion under reduced carbon flux progressively reduces defect density. Crucially, substrate thermo-mechanical integrity must be maintained to prevent mosaic spread exceeding the critical ~5° threshold that disrupts OA-mediated coalescence.
Experimental validation via SEM morphology, AFM roughness, and Raman FWHM measurements quantitatively aligns with MD-predicted grain fusion energetics and DFT-derived interfacial electronic restructuring. This agreement confirms OA as the dominant mechanism for crystallographic registry on intact Ir(100). The spontaneously formed atomic steps on coalesced surfaces preclude conventional etching pretreatment requirements for homoepitaxy.
Collectively, this work elucidates the atomistic pathways governing oriented attachment in diamond heteroepitaxy. The successful integration of multiscale simulations (DFT/MD) with experimental diagnostics establishes a transferable paradigm for resolving non-classical crystal growth mechanisms in covalently bonded materials, providing foundational insights for synthetic advancement of electronic-grade diamond.
Author Contributions
Conceptualization, methodology, investigation, writing—original draft preparation, data curation, visualization, writing—review and editing, and funding acquisition, Y.W.; conceptualization, methodology, investigation, writing—original draft preparation, data curation, and visualization, J.C.; validation, formal analysis, and writing—review and editing, Z.L. and S.Y.; software, supervision, and funding acquisition, J.Z. All authors have read and agreed to the published version of the manuscript.
Funding
This research was funded by the National Key Research and Development Program of China, grant number 2020YFA0709700; the National Natural Science Foundation of China, grant numbers 52072087, 52102039, and 52261135545; and the Scientific Research Project of Hunan University of Science and Engineering, grant number 22XKY031.
Data Availability Statement
The data presented in this study are available on request from the corresponding author. The data are not publicly available due to ongoing research and potential patent application.
Conflicts of Interest
The authors declare no conflicts of interest.
References
- Ma, Y.L.; Ding, Y.; Sun, Z.G.; Ren, J.; Zhao, J.L.; Zhou, Q.Q. Achieving uniform diamond distribution in impregnated bits through multi-stage encapsulation and stage-by-stage sieving: A pathway to enhanced drilling performance. Int. J. Refract. Met. Hard Mater. 2025, 133, 107338. [Google Scholar] [CrossRef]
- Hao, X.; Liu, B.; Li, Y.; Zhao, J.; Zhang, S.; Wen, D.; Liu, K.; Dai, B.; Han, J.; Zhu, J. Diamond single crystal-polycrystalline hybrid microchannel heat sink strategy for directional heat dissipation of hot spots in power devices. Diam. Relat. Mater. 2023, 135, 109858. [Google Scholar] [CrossRef]
- Augustine, R.; Kalva, S.N.; Dalvi, Y.B.; Varghese, R.; Chandran, M.; Hasan, A. Air-jet spun tissue engineering scaffolds incorporated with diamond nanosheets with improved mechanical strength and biocompatibility. Colloids Surf. B 2023, 221, 112958. [Google Scholar] [CrossRef] [PubMed]
- Cesaroni, S.; Bombarda, F.; Bollanti, S.; Cianfarani, C.; Claps, G.; Cordella, F.; Flora, F.; Marinelli, M.; Mezi, L.; Milani, E.; et al. Conceptual design of CVD diamond tomography systems for fusion devices. Fusion Eng. Des. 2023, 197, 114037. [Google Scholar] [CrossRef]
- Cheng, C.; Li, R.; Gui, Q.; Wu, G.; Liang, K.; Dong, F.; Guo, Y.; Zhang, Z.; Liu, S. Structural design and electronic performance at MOx/diamond (M = Hf, Zr, Ti, Al, Sc, Y) interfaces for MOS device applications. Appl. Surf. Sci. 2025, 679, 161231. [Google Scholar] [CrossRef]
- Rusevich, L.L.; Kotomin, E.A.; Popov, A.I.; Aiello, G.; Scherer, T.A.; Lushchik, A. The electronic, vibrational and dielectric properties of diamond crystals with neutral vacancies: First principles study. Opt. Mater. 2024, 150, 115222. [Google Scholar] [CrossRef]
- Tian, Y.; Meng, F.; Wu, D.; Yang, D.; Tao, X.; Li, Z.; Tang, J.; Sun, X.; Pan, J. First-principles investigation of excited-state lattice dynamics and mechanical properties in diamond. Micromachines 2025, 16, 668. [Google Scholar] [CrossRef] [PubMed]
- Zhu, X.; Bi, T.; Yuan, X.; Chang, Y.; Zhang, R.; Fu, Y.; Tu, J.; Huang, Y.; Liu, J.; Li, C.; et al. C-Si interface on SiO2/(111) diamond p-MOSFETs with high mobility and excellent normally-off operation. Appl. Surf. Sci. 2022, 593, 153368. [Google Scholar] [CrossRef]
- Abdelrahman, A.; Ohmagari, S.; Yoshitake, T. Reverse characterization prediction of diamond Schottky barrier power devices using machine learning: Predicting breakdown voltage and Baliga figure of merit. Diam. Relat. Mater. 2024, 149, 111645. [Google Scholar] [CrossRef]
- Yu, C.; He, Z.Z.; Zhou, C.J.; Guo, J.C.; Song, X.B.; Cai, S.J.; Feng, Z.H. High frequency hydrogen-terminated diamond MESFET with an fmax of 103GHz. Mater. Today Commun. 2021, 28, 102489. [Google Scholar] [CrossRef]
- Kudryashov, S.I.; Danilov, P.A.; Vins, V.G.; Pomazkin, D.A.; Gorevoy, A.V.; Skorikov, M.L.; Chen, J.; Smirnov, N.A.; Paholchuk, P.P.; Kornilov, N.V.; et al. Resonant and non-resonant ultrafast non-linear photonics of quantum NV− emitters in diamond. Diam. Relat. Mater. 2025, 153, 112081. [Google Scholar] [CrossRef]
- Song, Z.; Yuan, H.; Fan, P.; Li, M.; Shen, J.; Wang, S.; Bian, G. Enhancing fluorescence of diamond NV− centers for quantum sensing: A multi-layer optical antireflection coating. Diam. Relat. Mater. 2024, 141, 110584. [Google Scholar] [CrossRef]
- Schirru, F.; Chokheli, D.; Kiš, M. Thin single crystal diamond detectors for alpha particle detection. Diam. Relat. Mater. 2014, 49, 96–102. [Google Scholar] [CrossRef]
- Chan, S.; Tu, J.; Huang, K.; Yang, Z.; Liu, P.; Zheng, L.; Liu, J.; Chen, L.; Wei, J.; Li, C. Oriented growth of 5-inch optical polycrystalline diamond films by suppressing dark features. Ceram. Int. 2024, 50 Pt 8, 37111–37118. [Google Scholar] [CrossRef]
- Li, Y.; Dai, B.; Ralchenko, V.G.; Lyu, J.; Hao, X.; Zhao, J.; Zhang, S.; Liu, K.; Han, J.; Bolshakov, A.P.; et al. Growth of single-crystal diamond by microwave plasma CVD with high precursor utilization using cyclic gas injection and control of carbonaceous species content with optical emission spectroscopy. Vacuum 2022, 206, 111529. [Google Scholar] [CrossRef]
- Banik, S.; Indhu, R.; Arunachalam, N.; Rao, M.S.R. Femtosecond laser-induced surface structuring for improved surface characteristics of single crystal diamond. Diam. Relat. Mater. 2025, 154, 112240. [Google Scholar] [CrossRef]
- Hu, X.; Li, M.; Wang, Y.; Peng, Y.; Tang, G.; Wang, X.; Li, B.; Yang, Y.; Xu, M.; Xu, X.; et al. Growth of 2-inch diamond films on 4H–SiC substrate by microwave plasma CVD for enhanced thermal performance. Vacuum 2023, 211, 111895. [Google Scholar] [CrossRef]
- Zhao, J.; Yang, Y.; Weng, C.; Zhu, W.; Lou, L.; Wang, G. The quality of epitaxial lateral overgrown diamond on substrate with laser-cut holes of varying shapes and side orientations. Diam. Relat. Mater. 2024, 148, 111488. [Google Scholar] [CrossRef]
- Ralchenko, V.; Bolshakov, A.; Sovyk, D.; Artemov, V.; Vasiliev, A.; Krylov, Y.; Martyanov, A.; Fedorova, I.; Masalov, V.; Popovich, A.; et al. Epitaxial lateral overgrowth of single crystal diamond through self-assembled highly ordered porous colloidal SiO2 opal mask. Mater. Sci. Semicond. Process. 2025, 196, 109642. [Google Scholar] [CrossRef]
- Li, D.; Lv, X.; Wang, Q.; Wu, X.; Sun, G.; Xu, S.; Han, S.; Li, L.; Zou, G. Epitaxial lateral overgrowth of single crystalline diamond with different periodic trench geometries fabricated by laser cutting. Appl. Surf. Sci. 2025, 702, 163361. [Google Scholar] [CrossRef]
- Wang, Y.; Wang, W.; Shu, G.; Fang, S.; Dai, B.; Zhu, J. Virtues of Ir(100) substrate on diamond epitaxial growth: First-principle calculation and XPS study. J. Cryst. Growth 2021, 560–561, 126047. [Google Scholar] [CrossRef]
- Dong, C.; Zhang, K.; He, L.; Liu, J.; Zhang, Z.; Lv, X.; Wang, Q.; Li, L.; Zou, G. Interfacial improvement of Ir/MgO substrate by post-deposition annealing for heteroepitaxial growth of single crystal diamond. J. Alloys Compd. 2025, 1036, 182174. [Google Scholar] [CrossRef]
- Fischer, M.; Gsell, S.; Schreck, M.; Brescia, R.; Stritzker, B. Preparation of 4-inch Ir/YSZ/Si(001) substrates for the large-area deposition of single-crystal diamond. Diam. Relat. Mater. 2008, 17, 1035–1038. [Google Scholar] [CrossRef]
- Li, J.; Zhou, B.; Piliptsou, D.G.; Sun, H.; Wu, Y.; Hei, H.; Gao, J.; Yu, S. Pre-planting amorphous carbon films based on Ir composite substrates for diamond nucleation. J. Cryst. Growth 2025, 649, 127945. [Google Scholar] [CrossRef]
- Lee, J.; Konaté, A.; Guibert, C.; Landoulsi, J. Biomimetic mineral layer over layer-by-layer assemblies: Growth mechanism directed by collagen fibrils. Surf. Interfaces 2023, 40, 103059. [Google Scholar] [CrossRef]
- Singh, C.P.; Ghosh, K. Two-stage superlattice growth approach integrating two-dimensional polarization enhancement mechanism for optimized p-type heterostructures in AlGaN DUV-LEDs. Mat. Sci. Eng. B-Adv. 2025, 322, 118601. [Google Scholar] [CrossRef]
- Chen, P.; Shen, W.; Chen, Z.; Li, C.; Han, S.; Wu, Y.; Hang, T.; Li, M. Surface atom migration-involved two-dimensional nucleation and growth of nanotwinned copper in DC electrodeposition. Acta Mater. 2024, 262, 119468. [Google Scholar] [CrossRef]
- Kazantsev, D.M.; Akhundov, I.O.; Rudaya, N.S.; Kozhukhov, A.S.; Alperovich, V.L.; Latyshev, A.V. Thermal roughening of GaAs surface by unwinding dislocation-induced spiral atomic steps during sublimation. Appl. Surf. Sci. 2020, 529, 147090. [Google Scholar] [CrossRef]
- Li, F.-Y.; Song, G.-Y.; Zhang, Q.-X.; Hou, M.-H.; Zhou, L.; Tai, J.-C. Understanding the growth mechanism of Al-bearing hematite nanoparticles via two-dimensional oriented attachment. J. Cryst. Growth 2023, 620, 127360. [Google Scholar] [CrossRef]
- Wang, X.; Wu, Y.; Chen, X.; Liu, D.; Zhang, L.; Zhai, X.; Li, M. Fabrication of single crystal molybdate: A new protocol of coupling metal ion interaction and oriented-attachment with assistance of supercritical CO2. Mat. Sci. Eng. B-Adv. 2025, 319, 118379. [Google Scholar] [CrossRef]
- Zhou, X.; Zhou, X.; Jiao, F.; Xu, R.; Hao, S.; Li, H.; Zhang, Q. Oriented Attachment Growth of 2,6-Diamino-3,5-dinitropyrazine-1-oxide Mesocrystals: Morphological Evolution, Regulation, and Mechanism. Cryst. Growth Des. 2024, 24, 2764–2774. [Google Scholar] [CrossRef]
- Meshina, K.; Barabanov, N.; Tkachenko, D.; Vorontsov-Velyaminov, P.; Bobrysheva, N.; Voznesenskiy, M.; Osmolowsky, M.; Osmolovskaya, O. Zinc oxide nanoobjects for dye removal: Effective photocatalyst design via oriented attachment process. Surf. Interf. 2025, 60, 106006. [Google Scholar] [CrossRef]
- Aguilar-Chan, G.; Flores, E.; Alvarado-Gil, J.J.; Rodríguez-Gattorno, G. Oriented attachment of silver nanoparticles in DMSO by collapsing under thermal stress. Colloids Surf. A 2024, 703, 135210. [Google Scholar] [CrossRef]
- Ma, J.; Guo, Z.; Dai, S.; Liu, Y.; Hu, H.; Li, P.; Jin, L.; Ao, Y. Sizing agent induces the oriented attachment of 2D nanosheets for preparing high-performance carbon fiber composites. Surf. Interf. 2024, 51, 104549. [Google Scholar] [CrossRef]
- Fu, Y.S.; Song, Y.F.; Kulinich, S.A.; Sun, J.; Liu, J.; Du, X.W. Single-crystal ZnO flocky sphere formed by three-dimensional oriented attachment of nanoparticles. J. Phys. Chem. Solids 2008, 69, 880–883. [Google Scholar] [CrossRef]
- Dideikin, A.T.; Eidelman, E.D.; Kidalov, S.V.; Kirilenko, D.A.; Meilakhs, A.P.; Shakhov, F.M.; Shvidchenko, A.V.; Sokolov, V.V.; Babunz, R.A.; Vul, A.Y. Oriented-attachment growth of diamond single crystal from detonation nanodiamonds. Diam. Relat. Mater. 2017, 75, 85–90. [Google Scholar] [CrossRef]
- Ren, Y.; Lv, W.; Li, X.; Dong, H.; Wöhrl, N.; Yang, X.; Li, Z.; Wang, T. Effect of nitrogen on growth and optical properties of single-crystal diamond synthesized by chemical vapor deposition. Materials 2024, 17, 1311. [Google Scholar] [CrossRef]
- Arnault, J.-C.; Saada, S.; Ralchenko, V. Chemical vapor deposition single-crystal diamond: A review. Phys. Status Solidi-Rapid Res. Lett. 2022, 16, 2100354. [Google Scholar] [CrossRef]
- Yang, T.-I.; Chuang, C.-Y.; Chang, L. Enhancement of crystalline quality of homoepitaxial (100) diamond by microwave plasma chemical vapor deposition with a tungsten wire. Diam. Relat. Mater. 2025, 154, 112237. [Google Scholar] [CrossRef]
- Yoshikawa, T.; Kodama, H.; Kono, S.; Suzuki, K.; Sawabe, A. Wafer bowing control of free-standing heteroepitaxial diamond (100) films grown on Ir(100) substrates via patterned nucleation growth. Thin Solid Films. 2015, 594, 120–128. [Google Scholar] [CrossRef]
- Schreck, M.; Gsell, S.; Brescia, R.; Fischer, M. Ion bombardment induced buried lateral growth: The key mechanism for the synthesis of single crystal diamond wafers. Sci. Rep. 2017, 7, 44462. [Google Scholar] [CrossRef] [PubMed]


Disclaimer/Publisher’s Note: The statements, opinions and data contained in all publications are solely those of the individual author(s) and contributor(s) and not of MDPI and/or the editor(s). MDPI and/or the editor(s) disclaim responsibility for any injury to people or property resulting from any ideas, methods, instructions or products referred to in the content. |
© 2025 by the authors. Licensee MDPI, Basel, Switzerland. This article is an open access article distributed under the terms and conditions of the Creative Commons Attribution (CC BY) license (https://creativecommons.org/licenses/by/4.0/).