1. Introduction
Gallium nitride (GaN) is a semiconductor material of exceptional importance due to its wide bandgap, high breakdown voltage, and superior thermal stability. These properties make GaN crucial for high-power, high-frequency, and optoelectronic devices, including light-emitting diodes (LEDs), laser diodes, and high-electron-mobility transistors (HEMTs) [
1,
2,
3]. However, the performance and reliability of GaN-based devices fundamentally depend on the structural quality of the GaN crystals and substrates used in their fabrication. As such, the growth of bulk GaN with minimal number of defects and high crystalline uniformity remains a critical challenge in materials science and semiconductor manufacturing.
Among the available growth techniques, the ammonothermal method has emerged as one of the most effective approaches for crystallizing bulk GaN with the highest structural quality [
4]. This method, which operates under supercritical ammonia with mineralizers (alkaline in presented study), allows for slow and controlled bulk crystal growth in a closed autoclave environment. Unlike other methods primarily used for epitaxial layers, such as halide vapor phase epitaxy (HVPE), or alternative bulk methods like the sodium flux technique, the alkaline (basic) ammonothermal technique enables the synthesis of GaN with extremely low threading dislocation densities (TDDs) [
5]. The structural perfection achieved using this method, especially on native GaN seeds [
6], has made it a focal point for further research and industrial development.
Despite its advantages, optimizing the ammonothermal growth process remains complex due to the challenges of controlling fluid flow and heat transport inside the autoclave. These factors critically influence local supersaturation and temperature gradients, which in turn affect crystal growth rates and defect formation mechanisms. To address these challenges, numerical modeling using computational fluid dynamics (CFD) has become an invaluable tool for visualizing and optimizing the internal conditions of the growth zone, conditions that are otherwise difficult to measure directly [
7,
8]. A comprehensive overview of CFD applications in ammonothermal GaN growth was presented by Schimmel et al. (2021) [
9], summarizing key modeling approaches and challenges in simulating such systems.
In this work, we present a detailed CFD-based study of fluid dynamics and thermal distribution in an industrial-scale ammonothermal autoclave. Specifically, we investigate two configurations of the internal installation, focusing on the arrangement and geometry of the seed crystals. The simulations aim to evaluate how design modifications influence flow uniformity, temperature gradients, and transient fluctuations. Experimental results from growth runs using both configurations are compared with simulation data to validate the modeling approach and assess its effectiveness in guiding autoclave optimization. Ultimately, this study demonstrates how CFD modeling can support the development of more stable, efficient, and scalable ammonothermal GaN crystal growth systems, providing valuable insights for future improvements in crystal structural quality and then scalability of substrate production.
2. Materials and Methods
The ammonothermal growth process was carried out in an industrial-scale autoclave, which was analyzed numerically using CFD simulations. The CFD model investigated convective flow behavior within the growth zone for two different configurations of the internal assembly (
Figure 1).
The autoclave used in this study had an inner diameter of 100 mm and an internal height of approximately 1800 mm. The growth zone was located in the lower part of the vessel, with a length of approximately 600 mm—corresponding to one-third of the internal volume—and was separated from the feedstock zone by a double baffle.
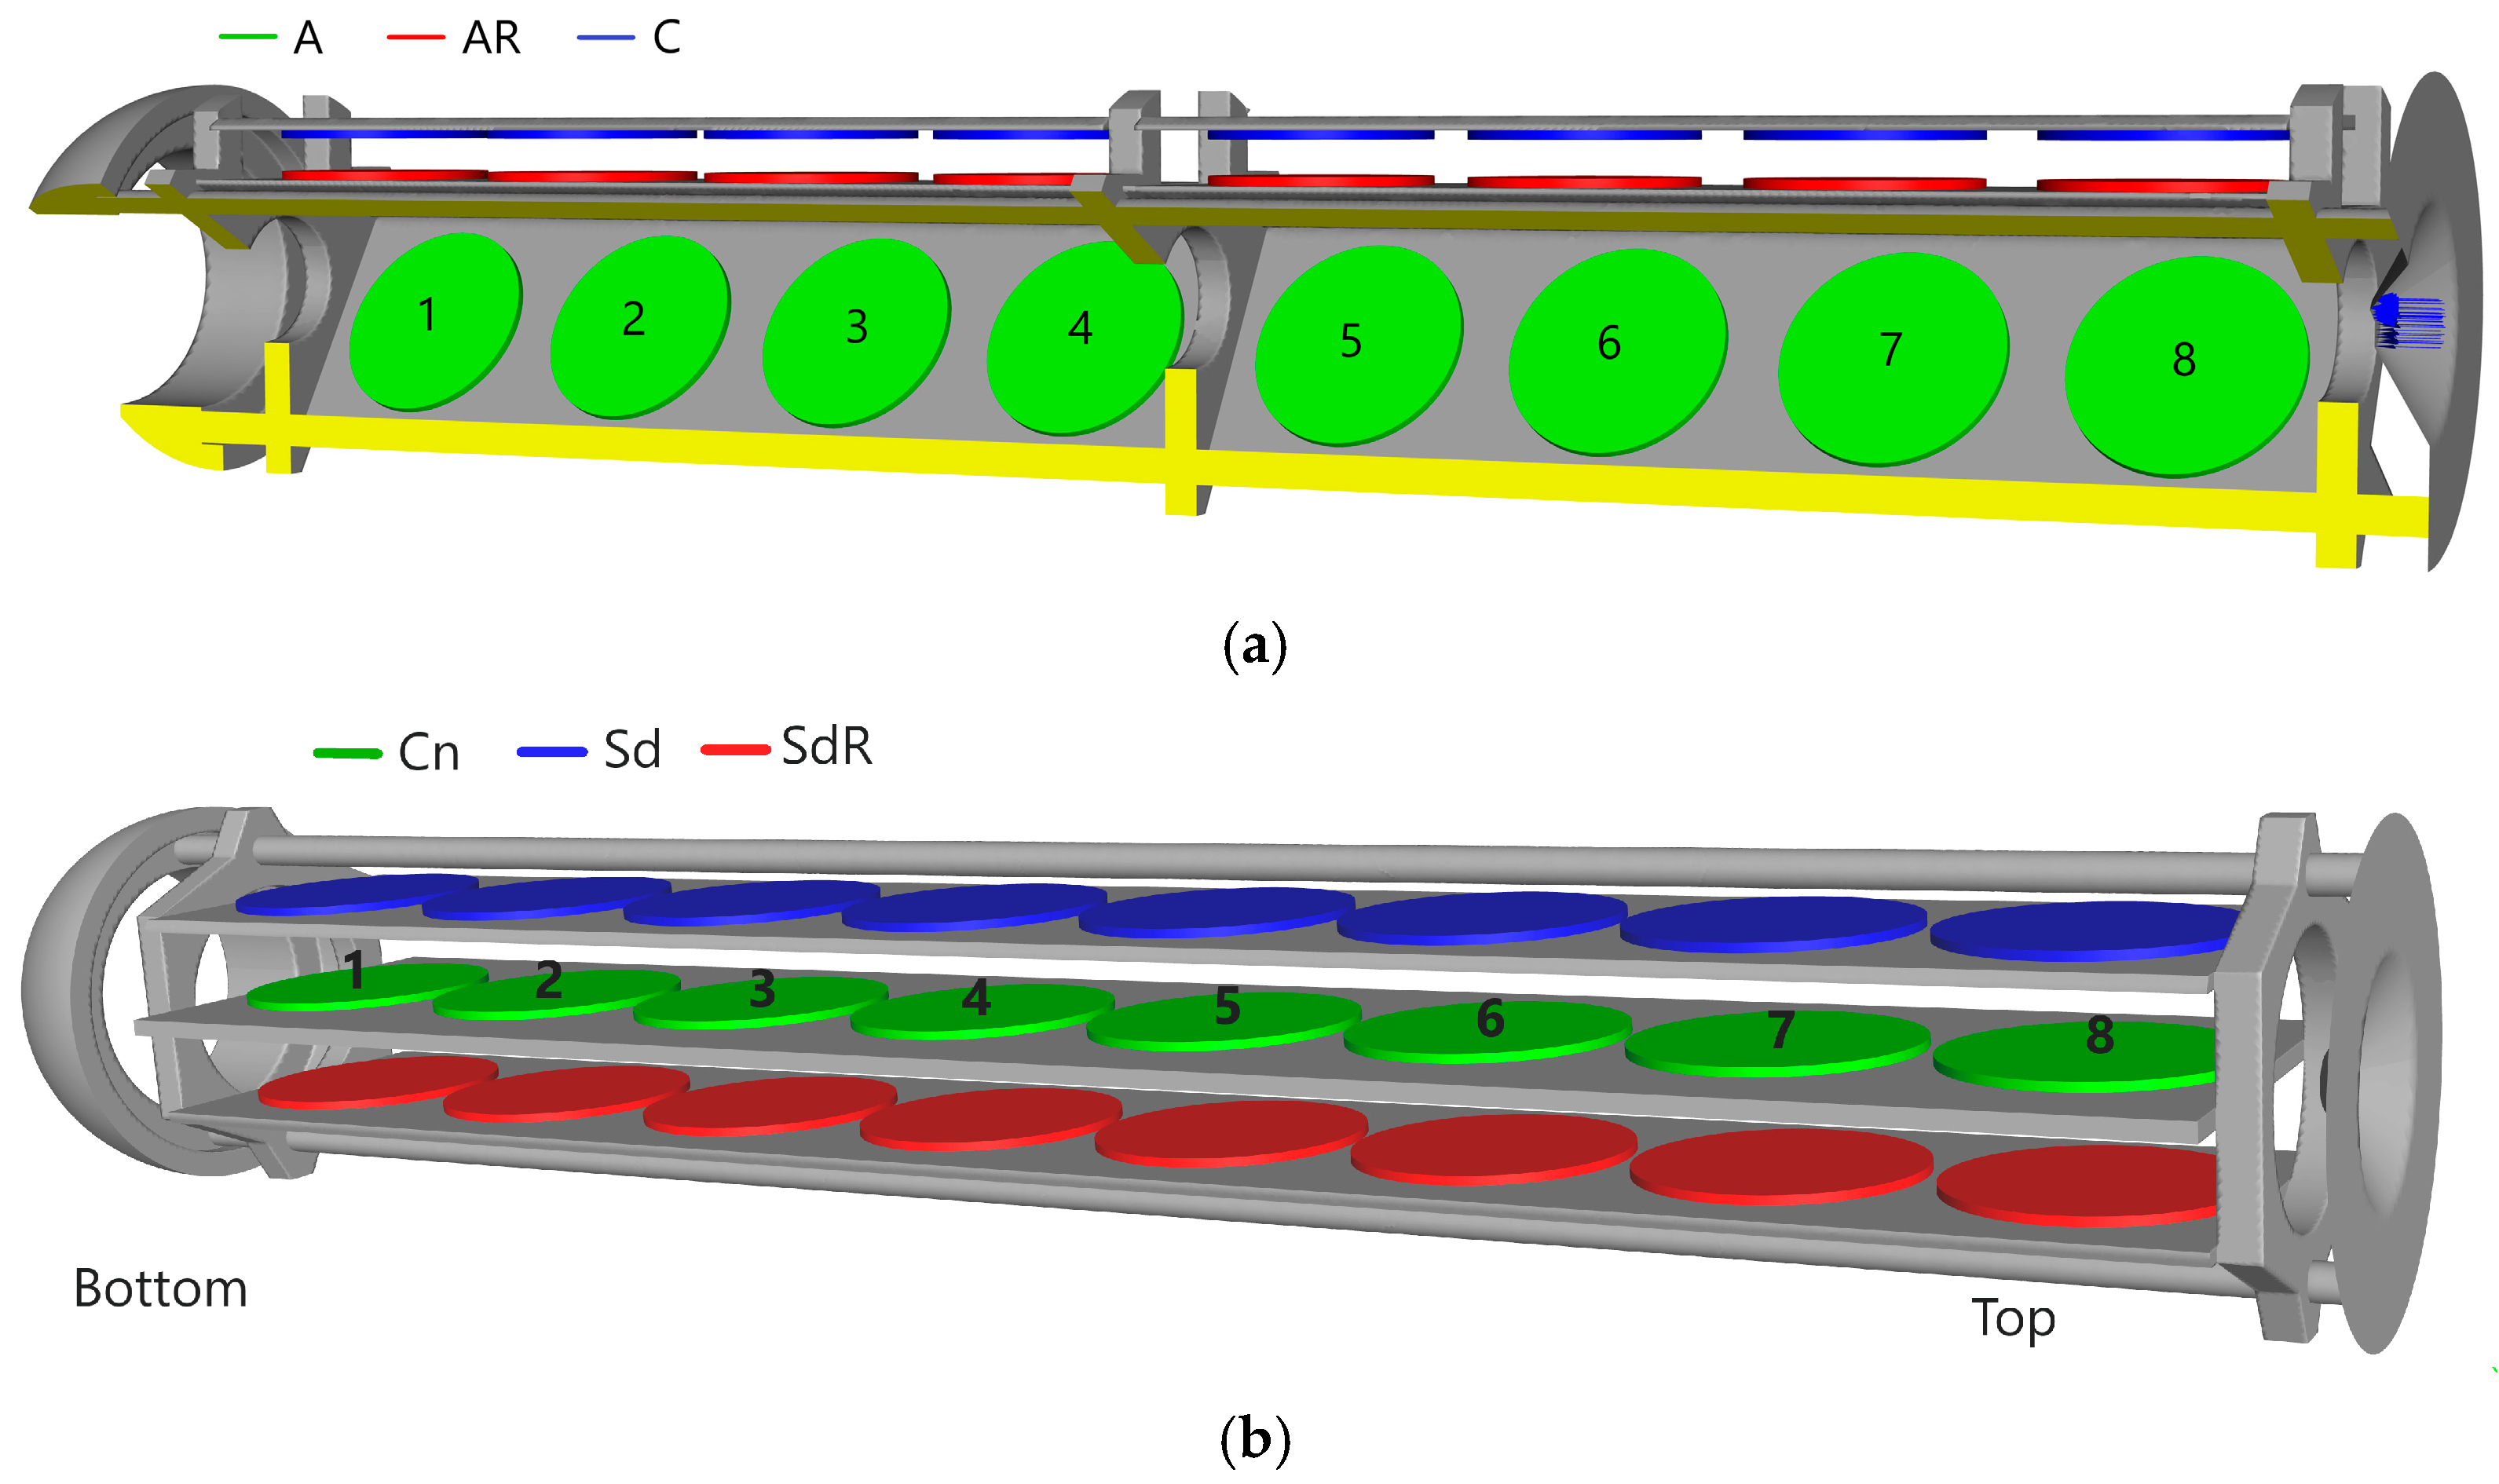
The growth zone was equipped with an internal structure consisting of supports and crystal holders. Two configurations of this setup, referred to as A and B, were investigated through both computational modeling and experimental growth runs, and subsequently compared (
Figure 1). Each configuration featured eight vertical levels and three radial positions for seed placement. The seed crystals were modeled as disks with a thickness of 2 mm. In Installation A, the seed diameter was 40 mm, whereas in Installation B, it was increased to 60 mm.
Both setups were subjected to the same thermal program and feedstock preparation procedure. For more detailed information regarding the autoclave design, thermal profile, and process parameters, see our previous publications [
10,
11].
The 3D model domain was confined to the inner walls of the autoclave, the baffle, and the baffle orifice (serving as the inlet, which allows for reverse flow). The domain was further reduced to one third of the circumference for configuration A and to one half for configuration B. Symmetry conditions were applied to the planes limiting the computational domain. The inlet was positioned at the baffle orifice and is indicated by blue arrows in
Figure 1. The metal casing of the chamber and the external furnace surrounding the autoclave walls were excluded from the model.
Installation A consisted of twelve crystal holders arranged on two vertical levels connected by a mounting ring. Each level contained six holders arranged in a triangular pattern with two holders on each side. Additional structural elements connected the holders. Holders closer to the autoclave axis supported seeds on both sides, whereas holders near the wall had seeds on only one side.
Installation B consisted of three parallel crystal holders connected by structural elements. Each holder supported seeds on both sides. Small mounting components, such as screws and wires, were excluded from both geometries.
Configurations with marked vertical levels and different horizontal seed positions are presented in
Figure 2.
The analysis of convective transport of the supercritical fluid in the growth zone of the ammonothermal autoclave was performed using a 3D model in ANSYS FLUENT 2023 R1 (Ansys Inc., Canonsburg, PA, USA [
12]). The unstructured mesh consisted of approximately 1,000,000 polyhedral elements for configuration A and about 2,000,000 elements for configuration B. The element size ranged from 1 mm to 3 mm across most of the domain, except near the inlet and its immediate vicinity, where 0.5 mm elements were applied. Additionally, five boundary layers with a growth ratio of 1.1–1.2 were added to each solid wall in the fluid region, resulting in a first layer thickness below 1 mm.
Good convergence was achieved, with an absolute continuity criterion of 10−4 and all other residuals below this threshold. Further mesh refinement and smaller time steps produced similar convergence behavior and consistent results. To obtain a quasi-steady, transient solution, several days of computation were required. Simulations were run on an Intel® CoreTM i9-9980XE CPU (Santa Clara, California, USA) with 64 GB DDR4 RAM using 18 cores. One time step required up to 60 substeps and approximately 2–3 min to converge.
Gallium nitride transport and deposition on crystals was not modeled and crystal thickness was constant at 2 mm each.
The fluid was modeled as a mixture of ammonia and hydrogen. Hydrogen content was determined based on stoichiometric ratios. Ammonia properties were approximated and extrapolated as linear functions of temperature [
10] (see also [
11,
13,
14]). Hydrogen was modeled with constant properties taken for the mean system temperature (~840 K) and pressure of 350 MPa.
Hydrogen properties were as follows [
14]:
- i.
Density: ρ = 58.5 kg/m3;
- ii.
Viscosity: μ = 2.6487 × 10⁻⁵ kg/(m·s);
- iii.
Specific heat: Cp = 14,646 J/(kg·K);
- iv.
Thermal conductivity: k = 0.724 W/(m·K).
- v.
Density: ρ = 8900 kg/m3;
- vi.
Specific heat: Cp = 460.6 J/(kg·K);
- vii.
Thermal conductivity: k = 91.74 W/(m·K).
- i.
Density: ρ = 6100 kg/m3;
- ii.
Specific heat:
Cp = 590 J/(kg·K) [
15];
- iii.
Thermal conductivity: k = 75 W/(m·K) [
16,
17].
The method for calculating the individual mixture properties is presented below (for more details, see [
18,
19]):
- i.
Density—volume weighted mixing law:
- ii.
Viscosity—mass weighted mixing law:
- iii.
Specific heat—mass weighted mixing law:
- iv.
Thermal conductivity—mass weighted mixing law:
where
—species ;
—mass fraction of species .
Temperature boundary conditions were derived from experimental measurements conducted in an air-filled autoclave, as described in previous work [
10]. These data were interpolated using a polynomial method to define the boundary temperature profile, shown in
Figure 3.
Since the computational domain included only the growth zone, boundary conditions had to be specified for the baffle and its orifice. The baffle temperature (T = 830 K), highlighted in red at the right edge of
Figure 3a, and the temperature at the pressure inlet (T = 800 K) were obtained from a separate simulation that covered both the growth and feedstock zones (
Figure 3a). A pressure inlet with backflow capability was defined at the baffle orifice, as indicated by the blue arrows in
Figure 1 and
Figure 2. In addition, turbulence inlet conditions were specified using a turbulence intensity of 2%.
A transient, pressure-based solver employing the κ–ω SST turbulence model was used throughout the simulations [
20,
21]. The time step was varied between 0.05 s and 0.5 s until repeatable transient behavior and thermal stabilization of the solid components were achieved. For the results presented here, the time step was set to 0.05 s.
Since the computations and results were transient, both instantaneous and mean velocity and temperature distributions are presented in this work. For Installation A, mean values were calculated over at least three full oscillatory cycles (equivalent to three minutes of flow time), while for Installation B, one minute of flow time was used for time-averaging.
Experimental results from three growth runs using each installation were used to compare and validate the CFD calculations. The only differences between the runs were the installation type and the seed configuration, including seed size and distribution. Each run followed the same thermal program and lasted approximately 90 days, with stable growth conditions—determined from CFD simulations—maintained for around 64 days. The total seed area was comparable across all runs, averaging about 1350 cm2.
To establish baseline growth conditions, sodium was added as a mineralizer at a molar concentration of 4% (mol Na/mol NH3), and the pressure during growth was maintained at a minimum of 350 MPa. After each process, all crystals were measured for thickness increase at three points and weighed before and after the run. These measurements provided the basis for statistical analysis. The structural quality was also assessed; however, these results are not discussed here.
3. Results
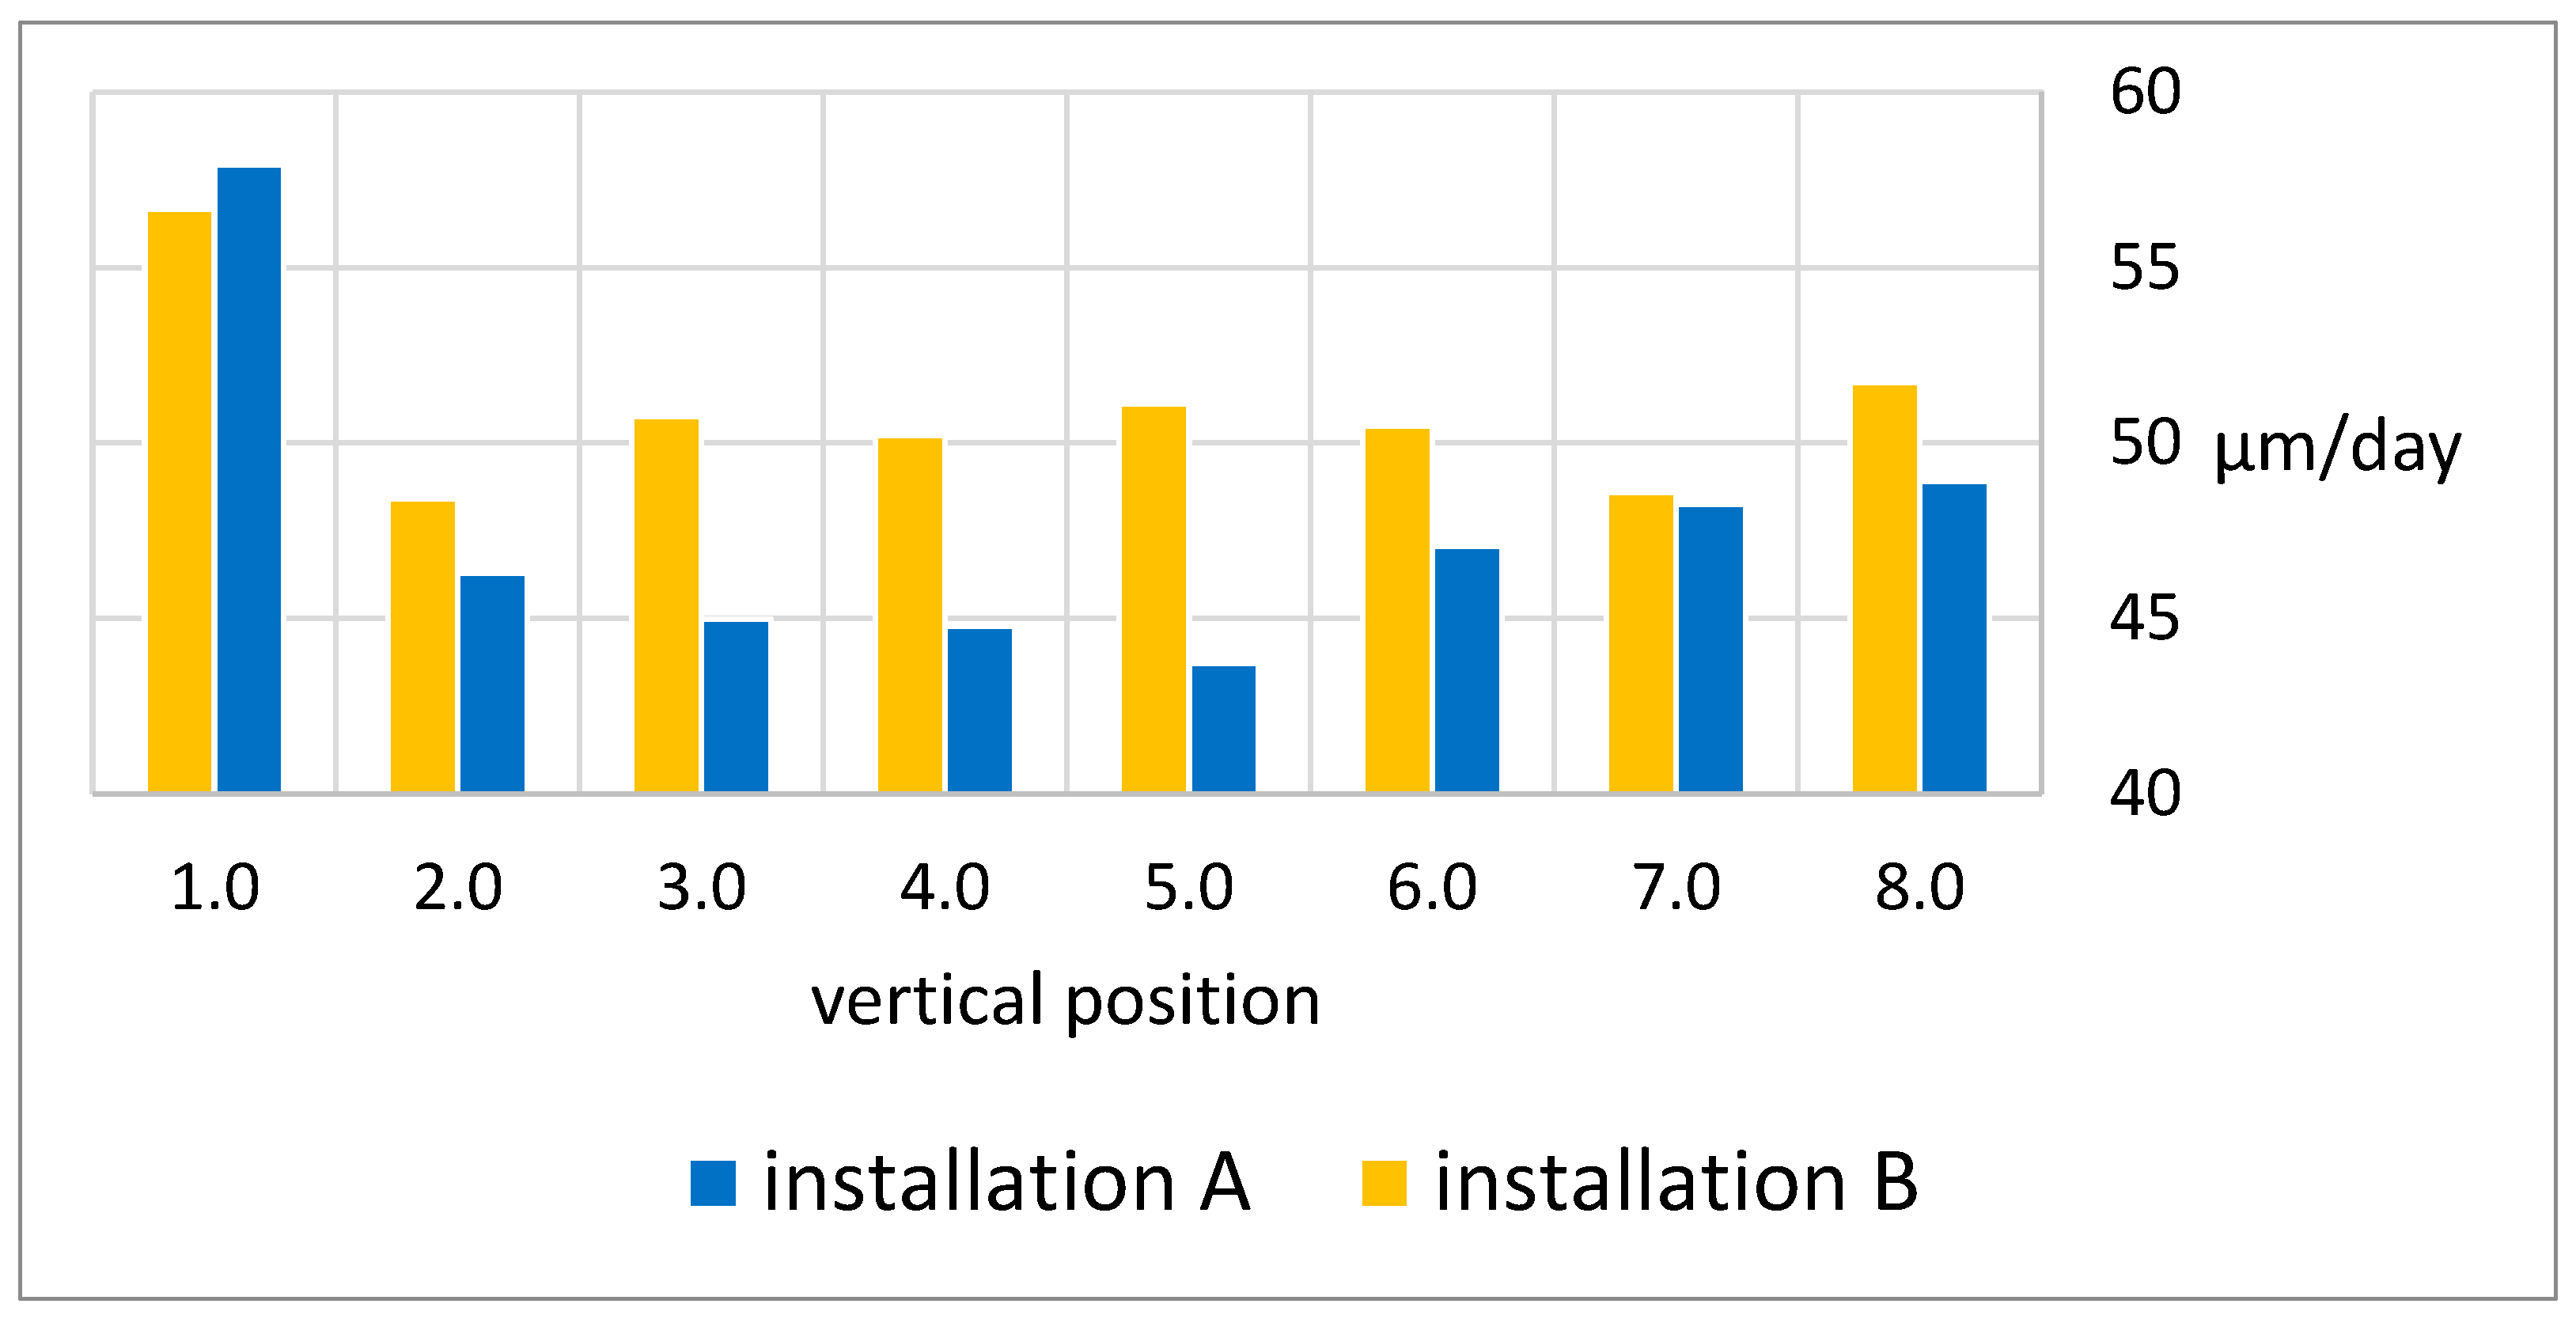
A comparison of growth rates between the installations is presented in
Figure 4 (for more experimental data see
Supplementary Material). Mean growth rates were calculated for the growth stage of the process (approximately 64 days for the standard duration) independently at each vertical level (1–8). For individual runs, growth rates ranged from a minimum of 40 μm/day to nearly 60 μm/day. Installation A exhibited a more scattered distribution of growth rates, with differences between maximum and minimum mean values reaching up to 17 μm/day. In contrast, Installation B showed a much more uniform distribution, with a maximum–minimum difference of only up to 8.3 μm/day. The mean growth rate in Installation B was also higher at all levels except for level 1. Level 1 (the bottom of the growth zone) exhibited the highest growth rates overall; however, in Installation B, it was only approximately 1 μm/day lower compared to Installation A.
Variation in growth rates between positions for individual runs was similar and depended on the specific run. Although Installation B improved the mean growth rate values overall, individual seed positions still exhibited differences in growth rates depending on the run.
For the Installation A, the simulation results confirmed the transient nature of the flow, with pronounced variations in both velocity flow direction and magnitude, but also temperature. These variations exhibited an almost oscillatory behavior, with a full cycle lasting approximately one minute (see [
11] for details). In contrast, the Installation B showed smaller fluctuations, which were more chaotic and lacked a clearly repeatable pattern or consistent interval. In both cases, the flow remained highly turbulent. Only mean velocity distributions are presented (
Figure 5 and
Figure 6), while both instantaneous and mean temperature distributions are shown (
Figure 7,
Figure 8 and
Figure 9).
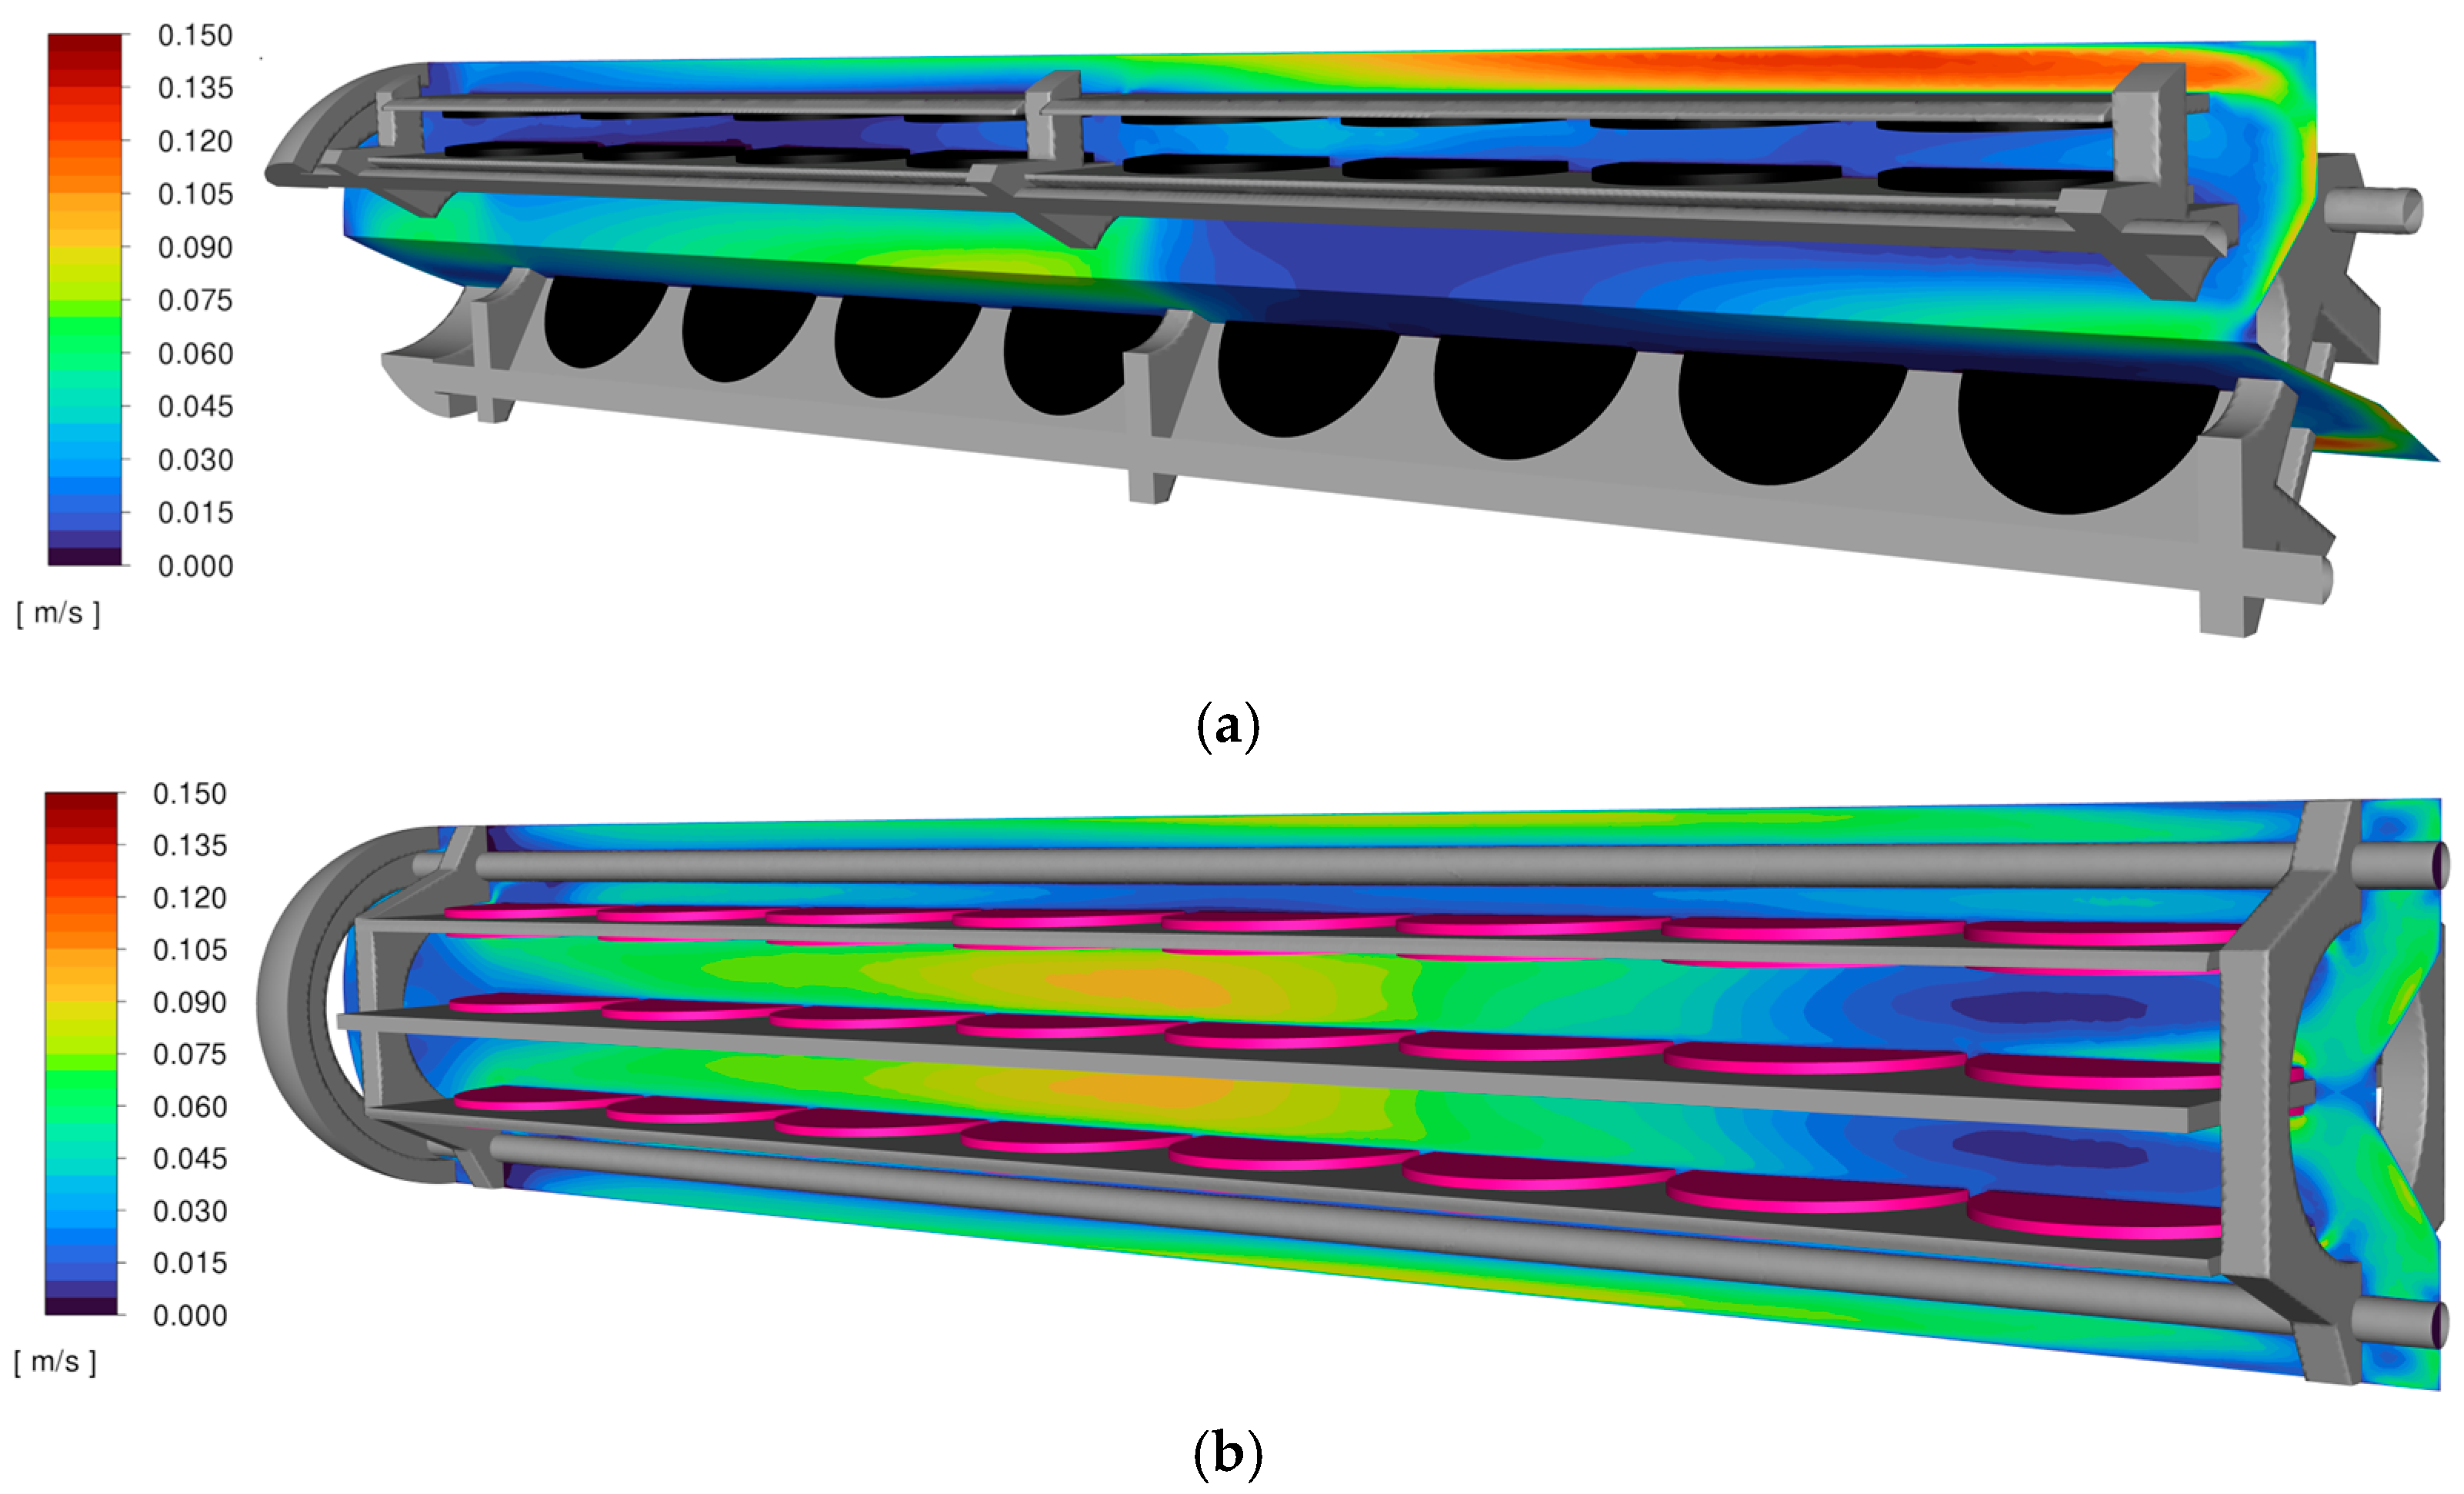
The mean velocity distribution in the midplane intersecting the crystals and their holders is presented in
Figure 5. For Installation A (
Figure 5a), velocity values range from 1 cm/s to 15 cm/s, while in Installation B the maximum velocity reaches 12 cm/s. In configuration A (
Figure 5b), regions of very low and very high velocity were more extensive than in the new setup, with peak values occurring near the wall and in the upper part of the growth zone. In contrast, the velocity distribution in Installation B was more uniform.
Two distinct low-velocity regions were identified in Installation B. The first was located near the baffle between the crystal holders, adjacent to the central (Cn) and side-reversed (SdR) positions at levels 7–8 (for position names see
Figure 2). The second was observed next to the side-positioned (Sd) crystals facing the wall, approximately in the middle of the axial length of the growth zone (levels 4–6). The maximum mean velocity of 12 cm/s occurred between the holders near the mid-height of the growth zone (levels 3–5).
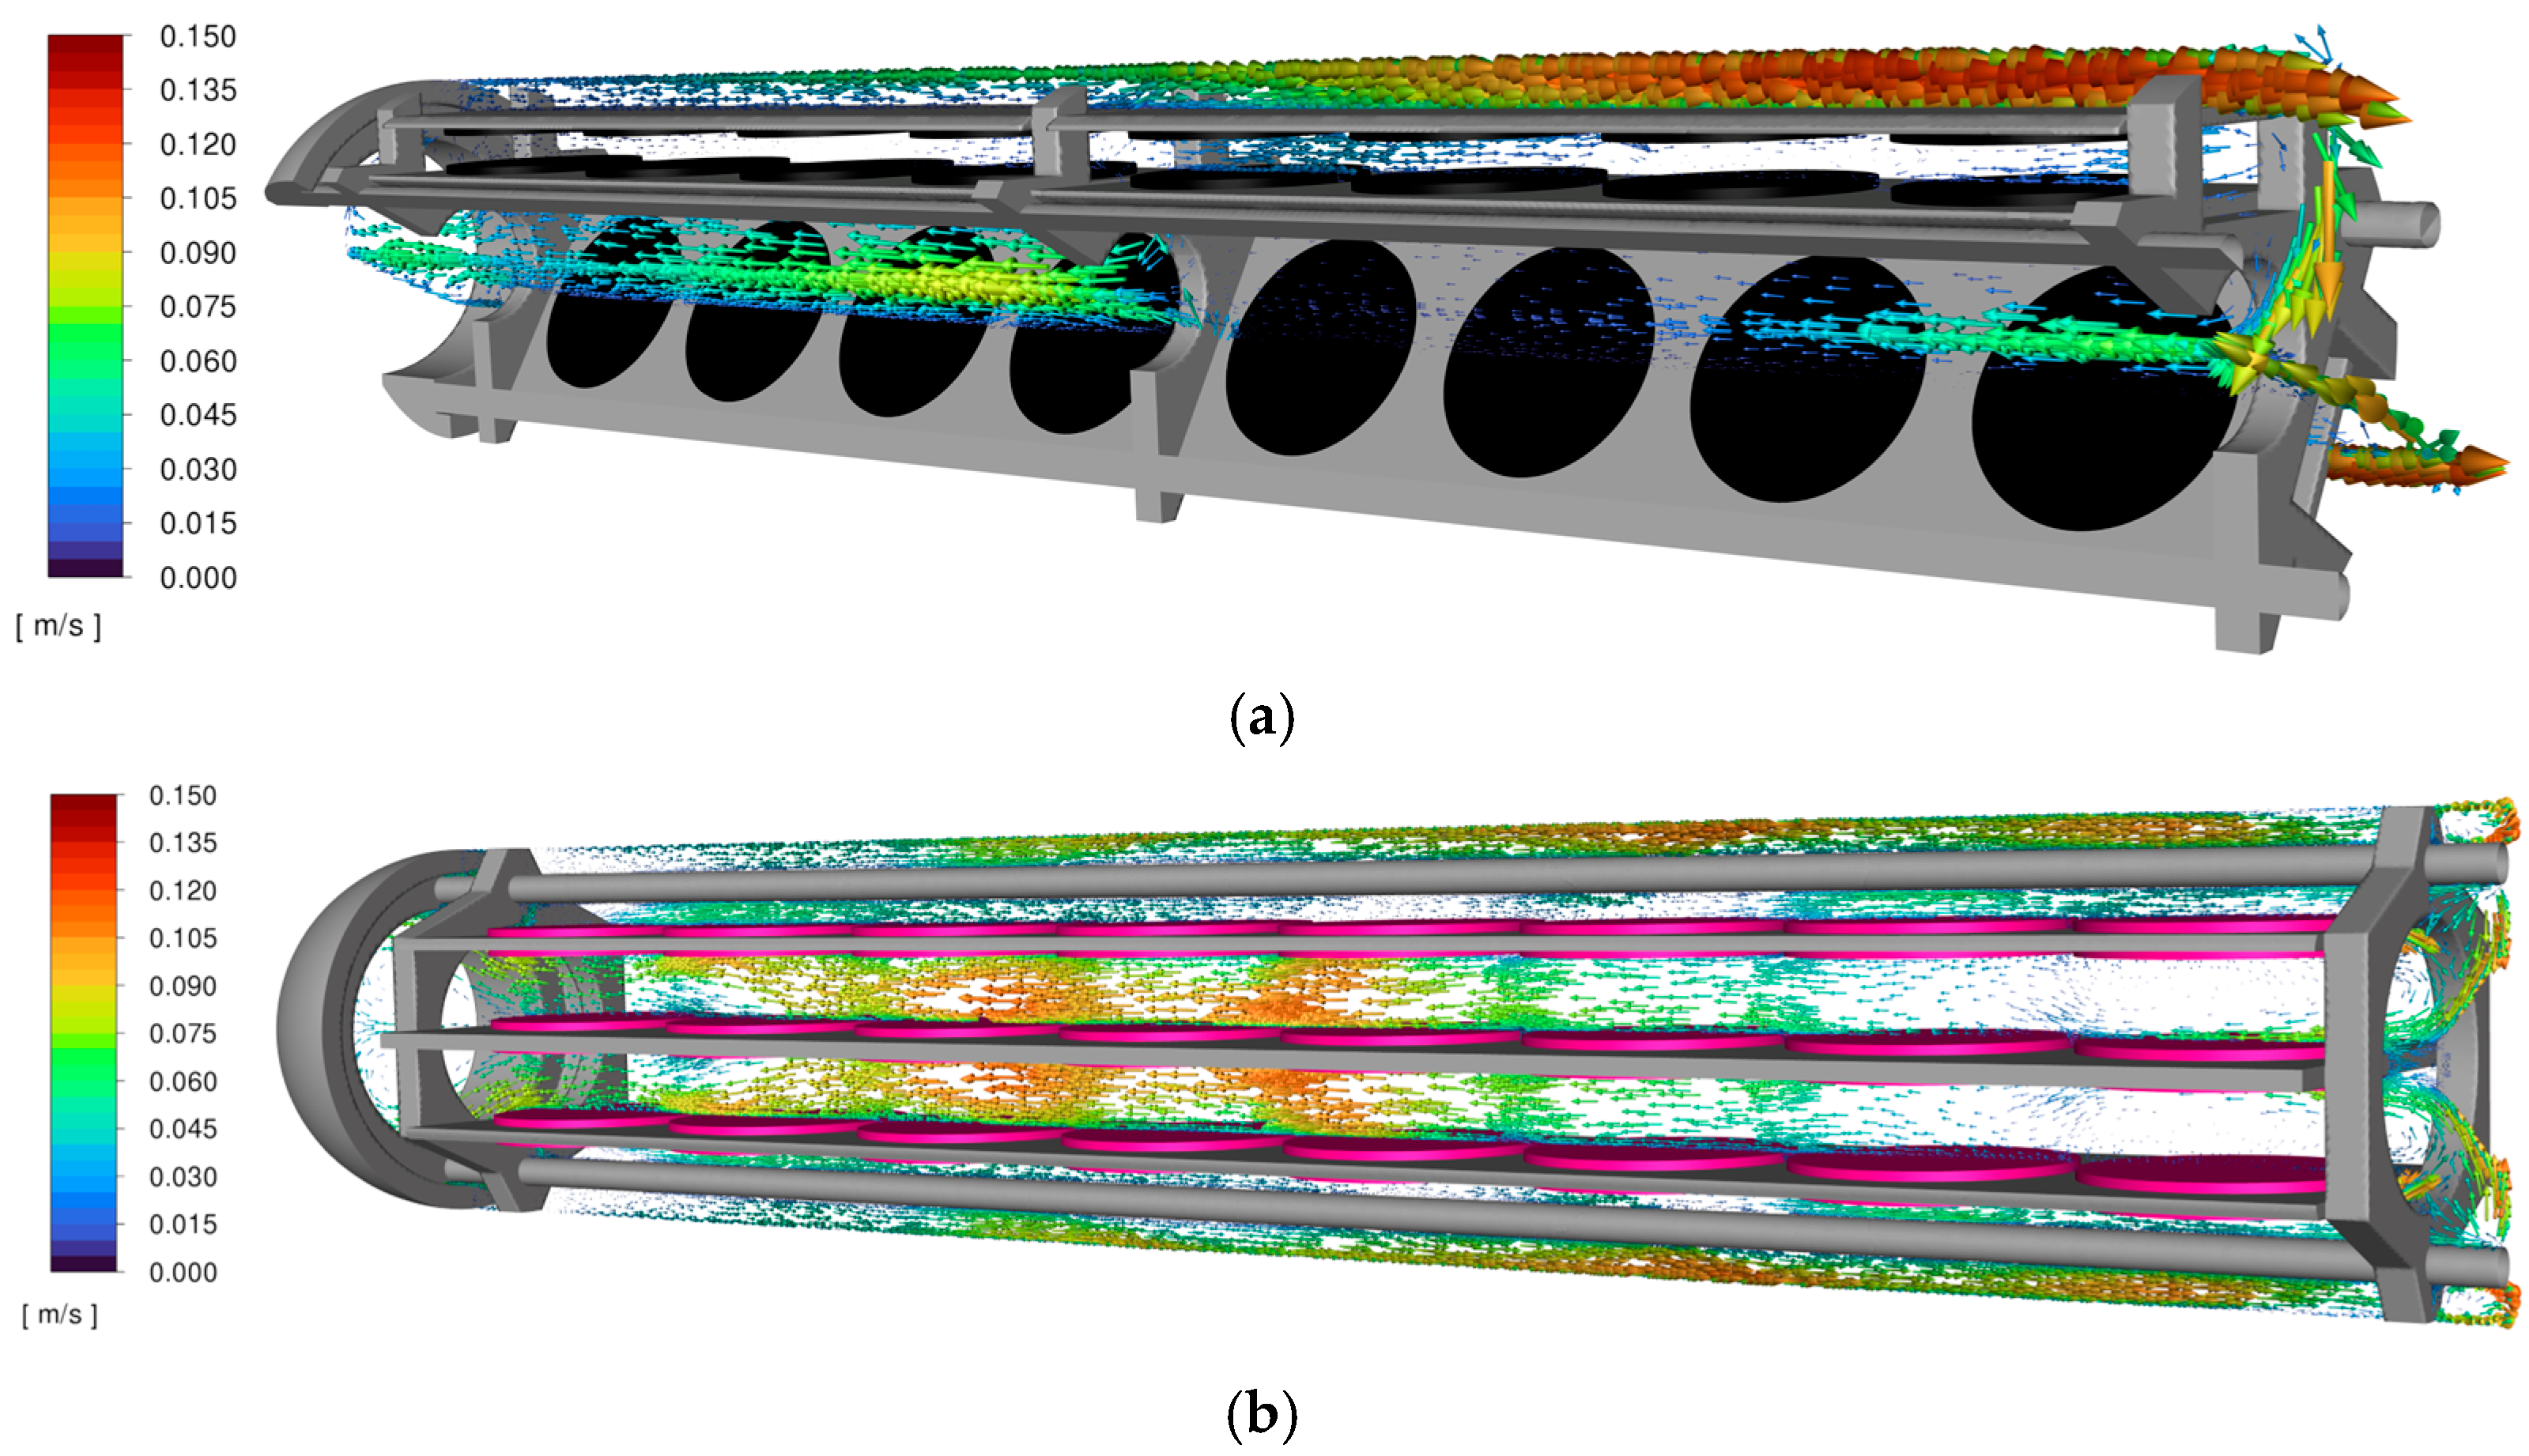
Figure 6 shows the mean velocity vectors in the same midplane intersecting the crystals and holders. The mean flow direction in these planes is predominantly axial. In Installation A (
Figure 6a), the flow in the region between the first holder and the central axis was primarily directed downward. Between the plates, velocity magnitudes were low and the flow direction varied without a dominant orientation. In contrast, in Installation B (
Figure 6b), the flow between the plates was predominantly downward, while, in the region between the side holder and the autoclave wall, the velocity direction was mostly upward.
The velocity distribution is closely linked to the temperature distribution, as both fields are mutually dependent.
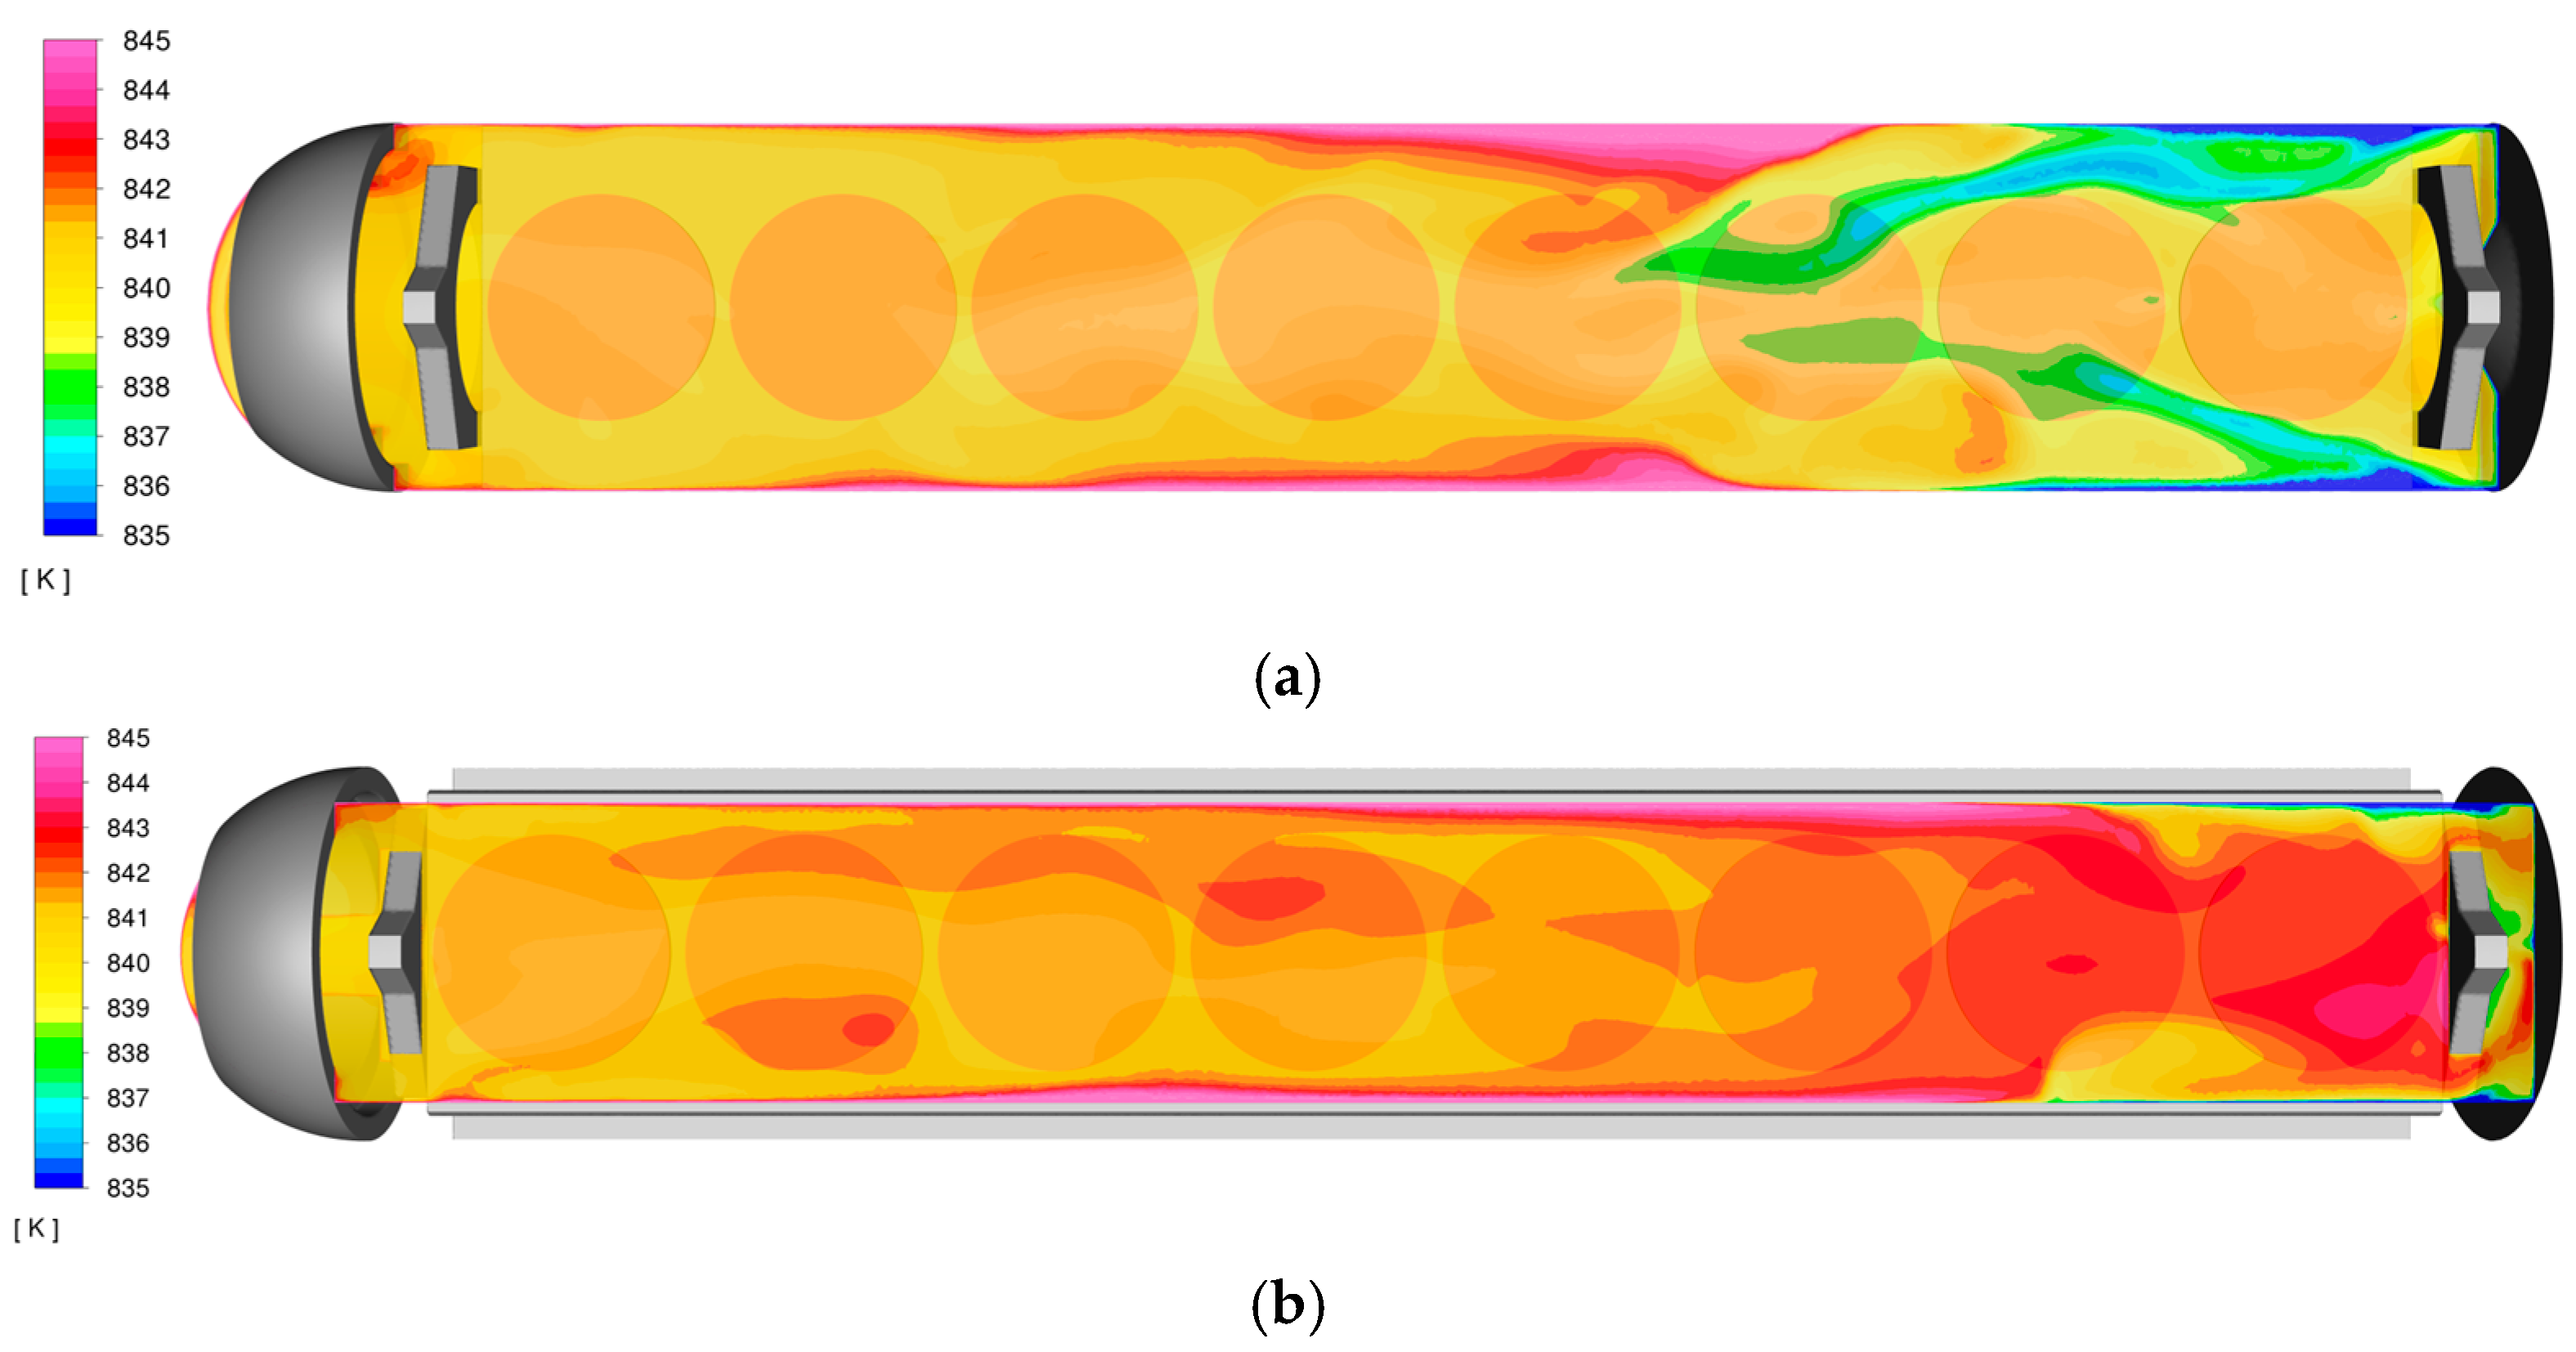
Figure 7 presents a comparison of the mean temperature fields for both configurations in the midplane intersecting crystals. Temperature values range from 805 K at the inlet to nearly 855 K. In both cases, the highest temperatures were observed near the top center of the domain and adjacent to the wall. The high-temperature region was more extensive in Installation A.
In configuration A, the mean temperature near the seed crystals ranged from approximately 839 K to 848 K (
Figure 7a). In contrast, in Installation B (
Figure 7b), the mean temperature near the seeds was more uniform, typically ranging between 840 K and 841 K. An exception was observed at the top three levels (6–8) of the Sd position, where the seeds face the autoclave wall and slightly higher temperatures, up to 843 K, were recorded.
A comparison of the instantaneous thermal fields near the crystal surfaces for the two installations is shown in
Figure 8 and
Figure 9, at arbitrarily selected time points. The thermal distribution is presented in planes located 2 mm above the top surfaces of the crystals. These results reveals higher local temperature gradients in configuration A (see also the
Supplementary Material and [
11]). Installation A also exhibited greater variations in temperature magnitude, particularly at Levels 3–5. In contrast, Installation B displayed a more uniform and less variable temperature distribution, with fluctuations that appeared more chaotic and of lower magnitude.
4. Discussion
This study used CFD modeling to analyze thermal and fluid dynamics in the autoclave crystal growth zone, comparing Installation A and Installation B configurations. Simulations revealed transient flow structures and temperature distributions that are difficult to capture experimentally, offering guidance for process improvement. The κ–ω SST turbulence model was used for its ability to handle sharp velocity gradients and recirculation zones, especially around crystal holders [
20,
21]. Mesh sensitivity was addressed through refinement, balancing computational cost and accuracy. Simulations required several days of computation for a few minutes of physical time, with residuals below 10
−4.
Limitations include assuming fully turbulent flow across the domain, which may overestimate turbulence, for example, near crystal surfaces. While not critical for analyzing mean conditions, transition-sensitive turbulence models [
20,
22,
23] could better support direct growth rate predictions, because of possibility of more precise boundary layer flow prediction. There is also possibility of overestimating of turbulence intensity. Geometry and boundary conditions were simplified, and thermal radiation was excluded. Radiation influence on the thermal distribution could lead to changes in temperature field.
A major enhancement was including hydrogen in the fluid. While its effect were not studied in this work, inclusion of hydrogen in authors’ opinion is important. Hydrogen’s impact on supersaturation and diffusion of GaN (Ga-based compounds) could be relevant, because of its low density, viscosity and particle size. Future models should consider its role more comprehensively. Though ammonia decomposition, which produces hydrogen in the system, was excluded due to high pressure (~350 MPa) [
13], this should be considered, particularly in lower-pressure systems.
Installation B aimed to improve uniformity by dividing the volume into four sections using fewer plates and minimizing wall clearance. The aim was to have two symmetrical loops with flow directed to the bottom in sections close to the axis and to the top in sections next to the wall. Installation B had fewer crystal positions (48 compared to 72 in Installation A). However, due to the larger crystal diameter (60 mm vs. 40 mm), the total growth surface area was comparable or even higher, based on the crystal distribution used in the calculations. In actual growth processes, the seed area varies depending on both the size and distribution of the crystals. CFD results showed more uniform velocity and temperature distributions in Installation B, confirmed by
Figure 4,
Figure 5,
Figure 6,
Figure 7 and
Figure 8. Velocity fields were more stable and directional.
Figure 7 and
Figure 8 showed that temperature gradients next to the seeds in Installation A reached 4 °C, while Installation B maintained more uniform temperature field. More stable fields with lower transient fluctuations were also observed for installation B. In previous work, it was shown that instantaneous thermal fields can be correlated with the structural quality of the grown crystals [
11]. In particular, high temperature gradients in the fluid adjacent to the seed surface were found to contribute to the occurrence of the SIPE (Stress-Induced Polarization Effect) [
5].
In the case of Installation B, instantaneous temperature gradients (
Figure 9) were lower and more consistent, reducing SIPE risk, confirmed by experimental runs showing no SIPE defects. The elimination of SIPE formulation was a big step in improvement of crystal structural quality.
Experimental growth ratios (
Figure 4) were more uniform in Installation B, though run-to-run variability remained. It is also worth noting that average growth rate across the whole system in configuration B was higher. One should note that operational practices are still being optimized, but the new design shows improved consistency and potential for better control and repeatability of the growth process.
CFD analysis supported experimental results at a general level, offering insights into convective behavior and boundary conditions at the crystal surface. The applied use of CFD for optimization and validation of the growth zone was demonstrated in this work and confirmed by experimental runs. While not replacing experimental work, simulations help refine seed positioning and process repeatability, which gives possibility of further scalability and optimization.
Future work can focus on incorporating supersaturation distribution directly into CFD, along with improved turbulence modeling. On the other side, this approach has a drawback of long computational times. For the presented model, computation of one minute of the flow took between 1 and 2 days. Although the governing diffusion equations are well established, their implementation is limited by the lack of experimentally validated diffusion coefficients, values which strongly depend on turbulence intensity and mixture composition. Therefore, precise turbulence modeling is not only a fluid mechanics issue but also essential for accurate mass transport and growth predictions.
5. Conclusions
This work demonstrated the effective use of CFD modeling to analyze and optimize the ammonothermal GaN crystal growth process at an industrial scale. By comparing the original and modified autoclave configurations, the simulations provided valuable insights into flow dynamics and thermal distributions that are difficult to capture experimentally. Installation B, with its segmented flow structure and reduced wall clearance, yielded more uniform velocity and temperature fields, contributing to improved crystal growth uniformity and the suppression of SIPE-related defects, results supported by experimental observations.
Despite certain simplifications—such as idealized geometry, omission of thermal radiation, and the use of a two-equation RANS model—the CFD approach proved to be a practical and informative tool for guiding design improvements. The simulations, combined with experimental data, confirmed the value of this methodology in supporting reactor optimization and advancing the understanding of crystal growth behavior.
Future work should focus on incorporating supersaturation and reaction–diffusion models. Whether these should be integrated directly into the CFD framework remains open for debate, although examples of such implementations do exist. Inclusion of GaN compound concentration would help leverage recent advances in solubility data and kinetic understanding [
24]. Further improvements in turbulence modeling, thermophysical property databases, and the treatment of radiation will also increase predictive accuracy. However, increasing model fidelity must be balanced against computational cost and stability, especially for three-dimensional simulation domains similar to the one presented here.
Overall, this study highlights the utility of CFD not only for understanding internal reactor phenomena but also as a validated and practical tool for optimizing growth zone design and enhancing reproducibility in ammonothermal GaN crystal growth. While more complex models—accounting for turbulence, diffusion, and chemical kinetics—do exist and have been demonstrated in the literature, few studies have applied them to fully three-dimensional domains. In the authors’ opinion, there remains a substantial need for research that integrates applied CFD with experimental validation, an area to which this work makes a meaningful contribution.

