Next Article in Journal
Microstructure and Mechanical Property Tailoring in Asymmetrically Shear-Extruded Mg-2.0Al-0.8Sn-0.5Ca Alloys via Zn Addition
Previous Article in Journal
ANN-Based Prediction of OSL Decay Curves in Quartz from Turkish Mediterranean Beach Sand
 
 
crystals-logo
Article Menu

Article Menu

Article

Coarse-Graining and Classifying Massive High-Throughput XFEL Datasets of Crystallization in Supercooled Water

by
Ervin S. H. Chia
1,
Tim B. Berberich
2,
Egor Sobolev
2,
Jayanath C. P. Koliyadu
2,
Patrick Adams
3,
Tomas André
4,
Fabio Dall Antonia
2,
Sebastian Cardoch
4,
Emiliano De Santis
5,
Andrew Formosa
6,7,
Björn Hammarström
8,
Michael P. Hassett
3,
Seonmyeong Kim
9,
Marco Kloos
2,
Romain Letrun
2,
Janusz Malka
2,
Diogo Melo
2,
Stefan Paporakis
3,
Tokushi Sato
2,
Philipp Schmidt
2,
Oleksii Turkot
2,
Mohammad Vakili
2,
Joana Valerio
2,
Tej Varma Yenupuri
10,
Tong You
10,
Raphaël de Wijn
2,
Gun-Sik Park
9,
Brian Abbey
6,7,
Connie Darmanin
6,7,
Saša Bajt
11,12,
Henry N. Chapman
11,12,13,
Johan Bielecki
2,
Filipe R. N. C. Maia
10,
Nicusor Timneanu
4,
Carl Caleman
4,
Andrew V. Martin
3,
Ruslan P. Kurta
2,
Jonas A. Sellberg
8,* and
Ne-te Duane Loh
1,14,*
add Show full author list remove Hide full author list
1
Department of Physics, National University of Singapore, Singapore 119077, Singapore
2
European XFEL, Holzkoppel 4, 22869 Schenefeld, Germany
3
School of Science, RMIT University, Melbourne, VIC 3001, Australia
4
Department of Physics and Astronomy, Uppsala University, Box 516, 75120 Uppsala, Sweden
5
Department of Chemistry—BMC, Uppsala University, Box 576, 75123 Uppsala, Sweden
6
Department of Mathematical and Physical Sciences, School of Computing Engineering and Mathematical Science, La Trobe University, Bundoora, Melbourne, VIC 3086, Australia
7
La Trobe Institute for Molecular Science, La Trobe University, Bundoora, Melbourne, VIC 3038, Australia
8
Department of Applied Physics, KTH Royal Institute of Technology, 10691 Stockholm, Sweden
9
Center for THz-Driven Biomedical Systems, Department of Physics and Astronomy, Institute of Applied Physics, College of Natural Sciences, Seoul National University, Seoul 08826, Republic of Korea
10
Department of Cell and Molecular Biology, Uppsala University, Box 596, 75124 Uppsala, Sweden
11
Center for Free-Electron Laser Science CFEL, Deutsches Elektronen-Synchrotron DESY, Notkestr. 85, 22607 Hamburg, Germany
12
The Hamburg Centre for Ultrafast Imaging, Universität Hamburg, Luruper Chaussee 149, 22761 Hamburg, Germany
13
Department of Physics, Universität Hamburg, Luruper Chaussee 149, 22761 Hamburg, Germany
14
Department of Biological Sciences, National University of Singapore, Singapore 117558, Singapore
*
Authors to whom correspondence should be addressed.
Crystals 2025, 15(8), 734; https://doi.org/10.3390/cryst15080734
Submission received: 13 June 2025 / Revised: 8 August 2025 / Accepted: 15 August 2025 / Published: 19 August 2025

Abstract

Ice crystallization in supercooled water is a complex phenomenon with far-reaching implications across scientific disciplines, including cloud formation physics and cryopreservation. Experimentally studying such complexity can be a highly data-driven and data-hungry endeavor because of the need to record rare events that cannot be triggered on demand. Here, we describe such an experiment comprising 561 million images of X-ray free-electron laser (XFEL) diffraction patterns (2.3 PB raw data) spanning the disorder-to-order transition in micrometer-sized supercooled water droplets. To effectively analyze these patterns, we propose a data reduction (i.e., coarse-graining) and dimensionality reduction (i.e., principal component analysis) strategy. We show that a simple set of criteria on this reduced dataset can efficiently classify these patterns in the absence of reference diffraction signatures, which we validated using more precise but computationally expensive unsupervised machine learning techniques. For hit-finding, our strategy attained 98% agreement with our cross-validation. We speculate that these strategies may be generalized to other types of large high-dimensional datasets generated at high-throughput XFEL facilities.

1. Introduction

X-ray free-electron lasers (XFELs) can interrogate diverse and dynamic ensembles, whether disordered [1,2] or crystalline [3,4]. High peak brightness, femtosecond time resolution, and short wavelengths are properties of XFELs that enable observations of dynamic processes at high spatiotemporal resolutions [5]. At these short length and time scales, structural information at near-atomic length scales is probed faster than thermal motion, obtaining snapshots of atomic arrangements that are effectively frozen in time. With advanced instruments and detectors, XFELs are capable of interrogating ensembles up to the MHz repetition-rate regime [6]. Coupled with high-performance computing, fast input–output, and massive storage, we can study diverse structural dynamics [4,7] in complex systems.
These capabilities make XFELs powerful tools for studying the anomalies of water [8]. Several anomalous properties of water have been linked to its liquid–liquid phase separation [9,10,11], where liquid water is hypothesized to spontaneously separate into two structural motifs: a low-density phase where molecules are tetrahedrally coordinated and a high-density phase with five nearest-neighbors. Signatures of this phase separation become more apparent when water is deeply supercooled [12,13]. However, under such conditions, liquid water spontaneously crystallizes in microseconds [14,15], making it difficult to separate signatures from fluid polymorphism and ice coarsening. The femtosecond time resolution of XFELs, their extreme brilliance, and high throughput allow us a window to study the structural motifs of supercooled water with atomic resolution prior to and during the disorder–order transition.
A meaningful, consistent, and robust description of water’s disorder–order transition requires measuring many deeply supercooled water droplets. We expect a wide variety of structural motifs to manifest in these droplets at different stages of nucleation and crystallization [16]. Even droplets at the same supercooling stage will nucleate and crystallize stochastically and differently, likely leading to a diverse range of structural features. Such large and diverse datasets that are complex and complicated to analyze propose a challenge to extract meaningful information.
To meet this challenge, we demonstrate a combination of data and dimensionality reduction that allows scalable and interpretable classification of petabytes of diverse diffraction patterns. First, we reduced the data with angular coarse-graining of simple summarizing statistics. We then used principal component analysis (PCA) to identify important feature combinations. A second set of intuitive outlier statistics was computed on these feature combinations that could effectively classify these patterns.

2. Approach

2.1. Experimental Background

We used the SPB/SFX instrument [17] at the European XFEL (EuXFEL) to probe millions of evaporatively supercooled water droplets to understand their disorder–order pathways and propensities (Figure 1). Micrometer-sized droplets (2 μ m to 12 μ m ) were formed by a gas-focused liquid jet that undergoes Rayleigh breakup [18,19]. X-ray laser pulses randomly probed these droplets as they were evaporatively cooled to different temperatures. The nozzle-to-pulse vertical distance was varied from 0.3 m m to 60 m m to evaporatively cool the droplets to different temperatures.
As such, our ultrafast high-throughput XFEL imaging of water droplets produced enormous quantities of data. Approximately 561 million diffraction patterns were recorded over four days of continuous data acquisition with the single-photon counting Adaptive Gain Integrated Pixel Detector (AGIPD) [20,21] during the experiment. The AGIPD comprises sixteen front-end modules, each with sixteen square Application-Specific Integrated Circuits (ASICs). Each ASIC, in turn, comprises 64 × 64 pixels, which totals more than one million pixels on all ASICs of the entire detector. Including experimental metadata, the total raw dataset occupies approximately 2.3 PB of storage, ballooning to 4.5 PB after initial processing.

2.2. Data Description and Processing

Each pattern was corrected for known systematic variations. These variations arise from the beam, experimental, and instrument conditions. These include effects from the incident X-ray polarization, the variations in solid angles subtended by individual detector pixels, pixel-resolved gain, and thermally-induced fluctuations [22]. Finally, certain pixels were identified and omitted from each diffraction pattern because they became unresponsive to incident signals, likely due to prior overexposure to high-energy X-rays.
Then there are measurement uncertainties. Water’s low scattering cross-section, despite the extremely brilliant XFEL pulses, makes each XFEL diffraction pattern inevitably photon-limited. Such noisy patterns are susceptible to false-positive photon counts that arise from detector thermal noise or other artifacts (even a false positive rate of 0.001% can lead to dozens of false photons on a megapixel detector). Furthermore, each diffraction pattern contains hidden variables that must be inferred (e.g., crystallite orientations and structural motifs, and each water droplet’s random position with respect to the X-ray pulse, etc.). These hidden variables can confuse both hit-finding and hit-classification [23].
We also detected a very low level of background X-ray photons that were scattered from upstream optical elements, which were present as long as X-ray pulses were reaching the detector, even without samples. Although the average scattering pattern from this background was static, it covered a substantial fraction of our detector, making it infeasible to mask out. Fortunately, this background only contributed to a small minority of photons per pattern. This shot-noise-limited background meant that we could not subtract the average value from every single pattern without incurring negative values. However, it also meant that they could be ignored since they are unlikely to affect pattern classification.

2.3. Considerations for Classification

Studying the stochastic disorder–order transitions amongst millions of droplets involves classifying them by their WAXS diffraction patterns. This classification comprises two steps. First, we have to identify the patterns that contain significant diffraction scattering from droplets, a procedure that is commonly referred to as hit-finding. Thereafter, we must classify the structural motifs found in droplet-containing diffraction patterns (i.e., hit classification).
Classifying hits by their diffraction signatures is non-trivial for two reasons. First, each of the probed droplets could contain a diverse range of structural motifs in nanometer-sized frustrated nascent crystals. The diffraction signatures of these crystals are neither those of microcrystals seen in well-established Serial Femtosecond Crystallography (SFX) [24,25] nor structurally homogeneous like those expected in single-particle imaging [22,26]. Robust classification procedures, including peak finding and data reduction routines, have been developed for these imaging conditions [27,28]. Without references for the diffraction signatures of these motifs, we typically turn to unsupervised learning, which dimensionally reduces each WAXS pattern and then compares different pairs of such patterns for classification. This brings us to the second challenge: each diffraction pattern comprises many pixels (i.e., high-dimensional raw feature vectors), which makes pairwise comparisons amongst the many millions of WAXS patterns computationally expensive. Hence, it is necessary to coarse-grain the raw feature vectors, where we reduce the data so that it is small enough to store and compute efficiently while retaining sufficiently discriminating features for classification.

2.4. Angular Coarse-Graining with Means and Maxes

Naturally, this entire 2.3 PB dataset of raw detector data is too cumbersome for many classification routines in unsupervised machine learning. Suppose we represent this full dataset as a two-dimensional design matrix X comprising N rows of measurements (i.e., diffraction patterns) and D columns of measurement features (i.e., number of pixels per pattern). The time-complexity of unsupervised classification techniques that interrogate pairs of measurements at a time increases quadratically with N. Hence, such methods are infeasible with N = 5.6 × 10 8 patterns.
Coarse-graining in physics is the process of simplifying a complex system by reducing its number of degrees of freedom to focus on macroscopic behavior. This process is analogous to data reduction, where less important details are integrated or averaged out in order to scale up to larger datasets.
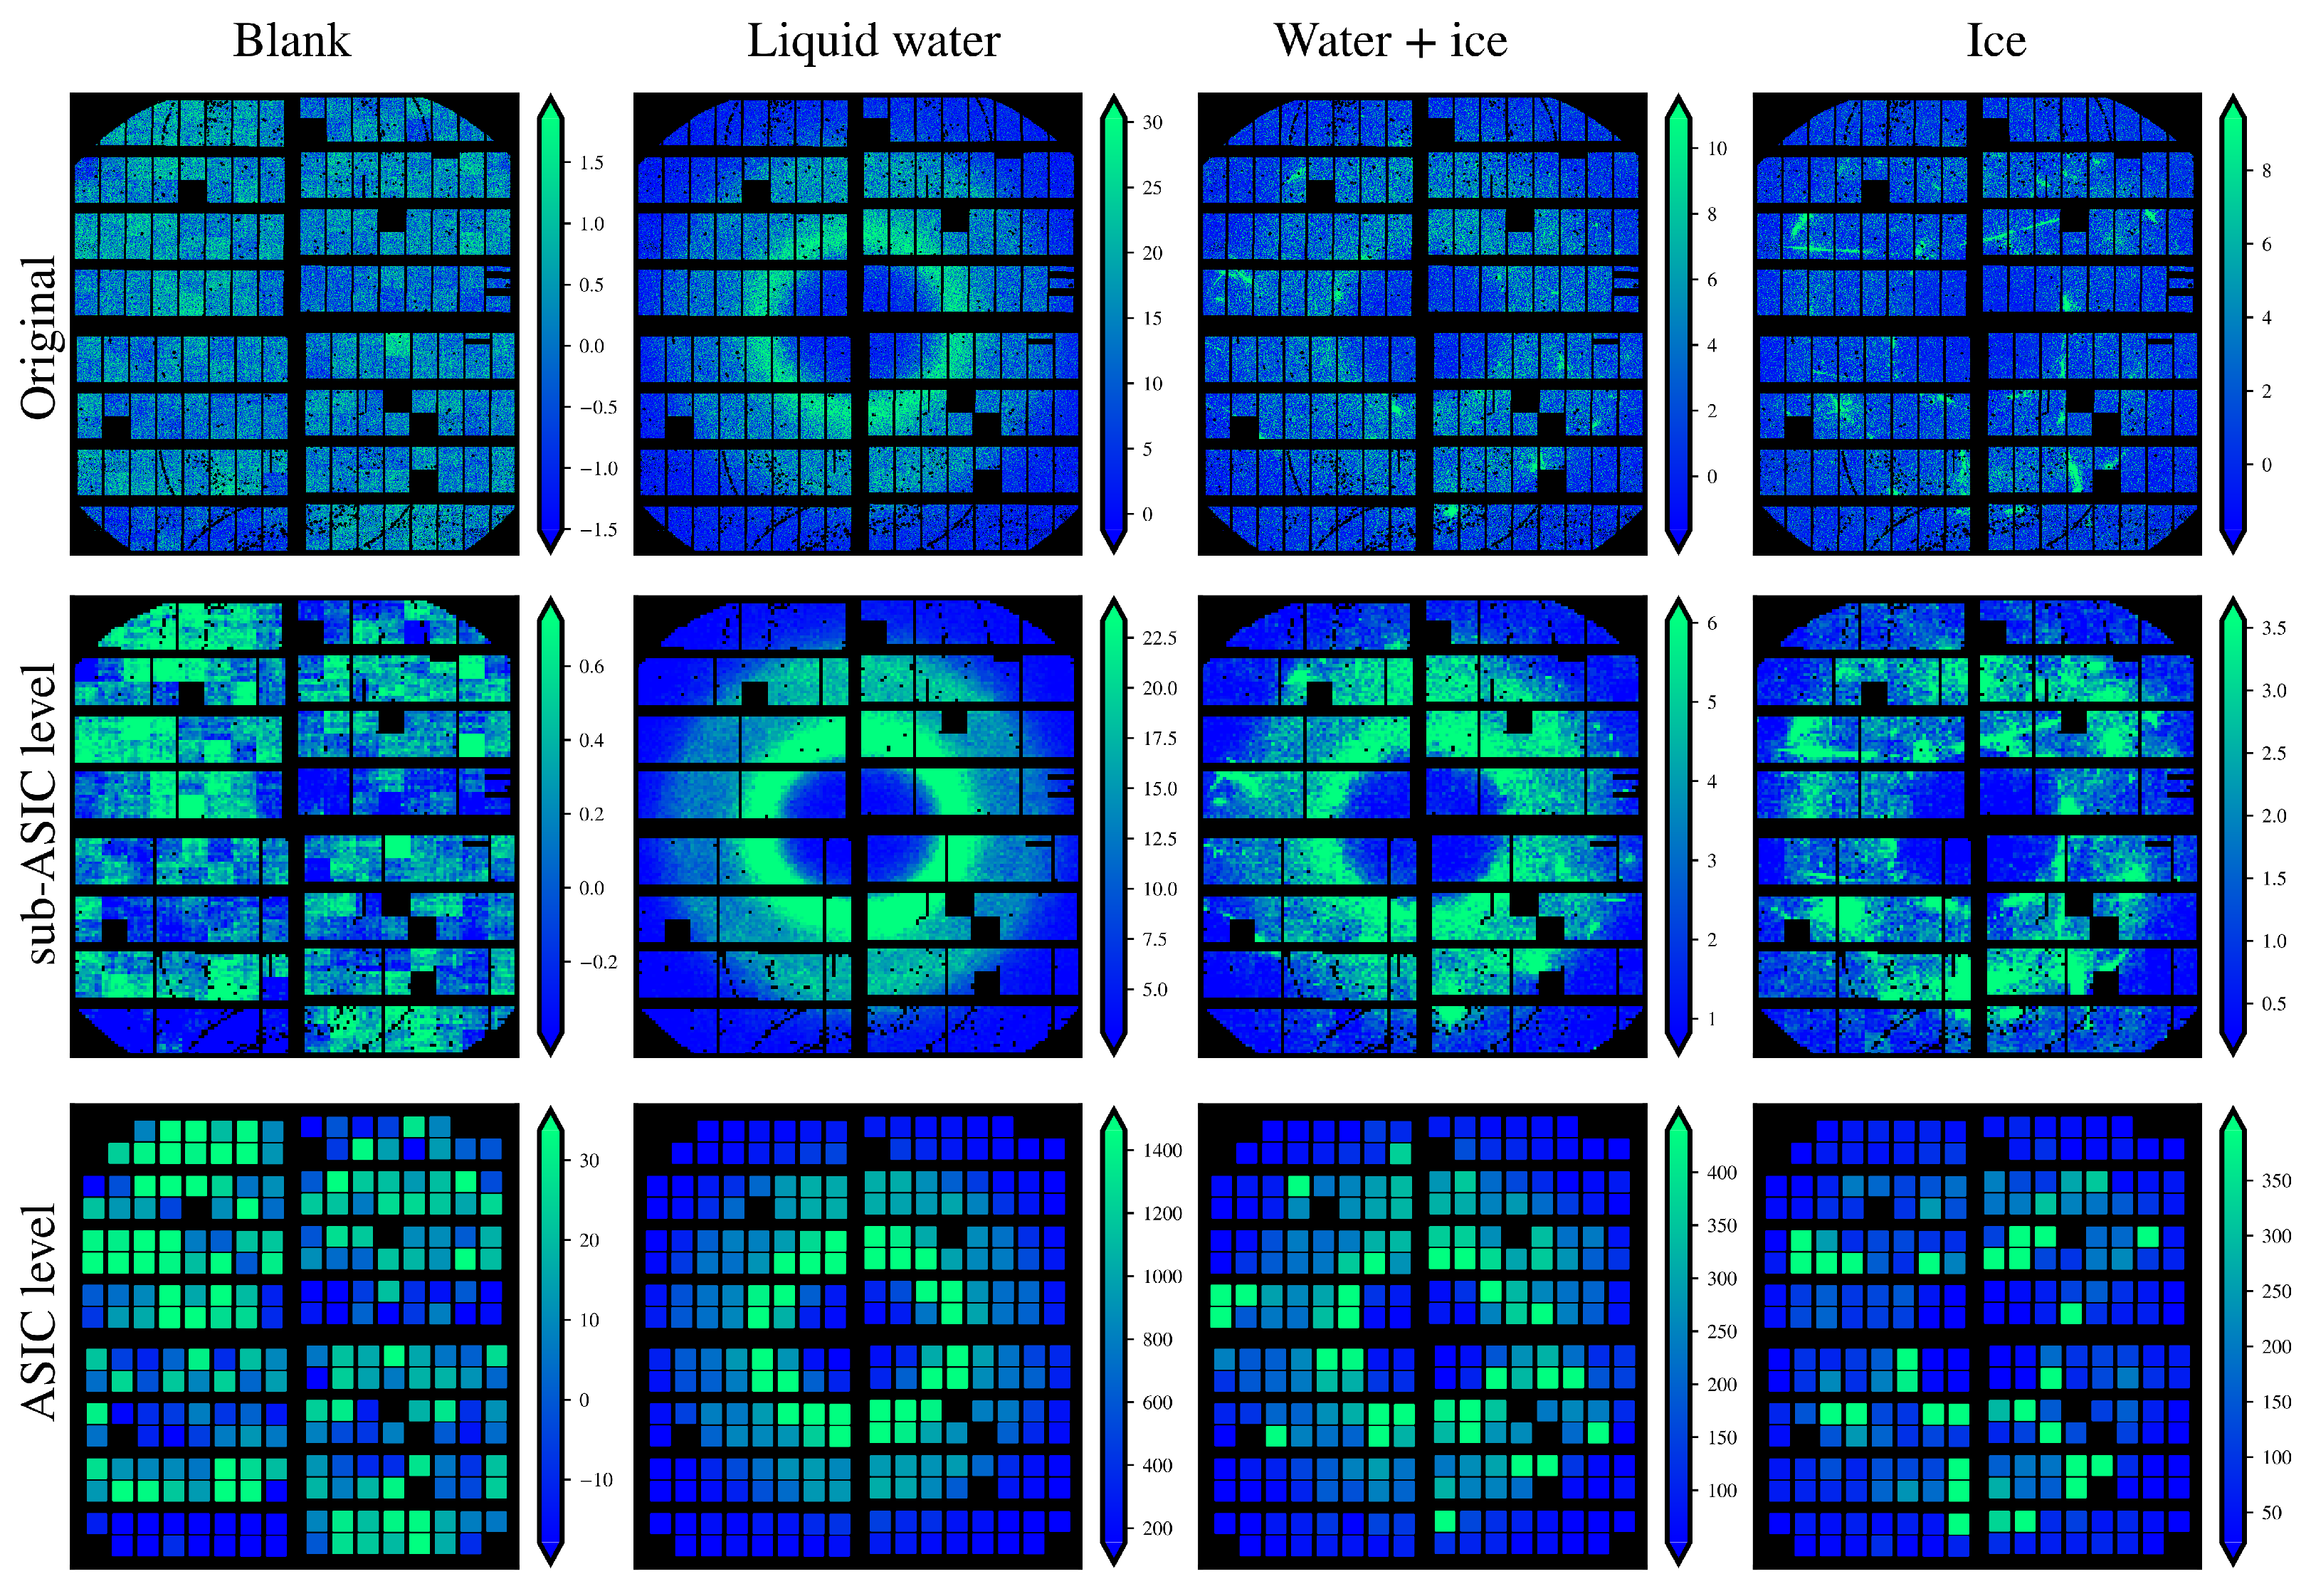
Here, to efficiently compare all the 5.6 × 10 8 patterns, we coarse-grained away scattering information contained in high resolutions of q values, retaining summarizing statistics of the signal received by each of the 256 ASICs of the AGIPD (Figure 2). When there are few small ice crystals in each droplet, this coarse-graining loses information about their shape and strain since their Bragg transforms lie within the angular scale spanned by single ASICs. Should there be many large crystals in an illuminated water droplet, this coarse-graining makes the number of crystals in the droplet less apparent.
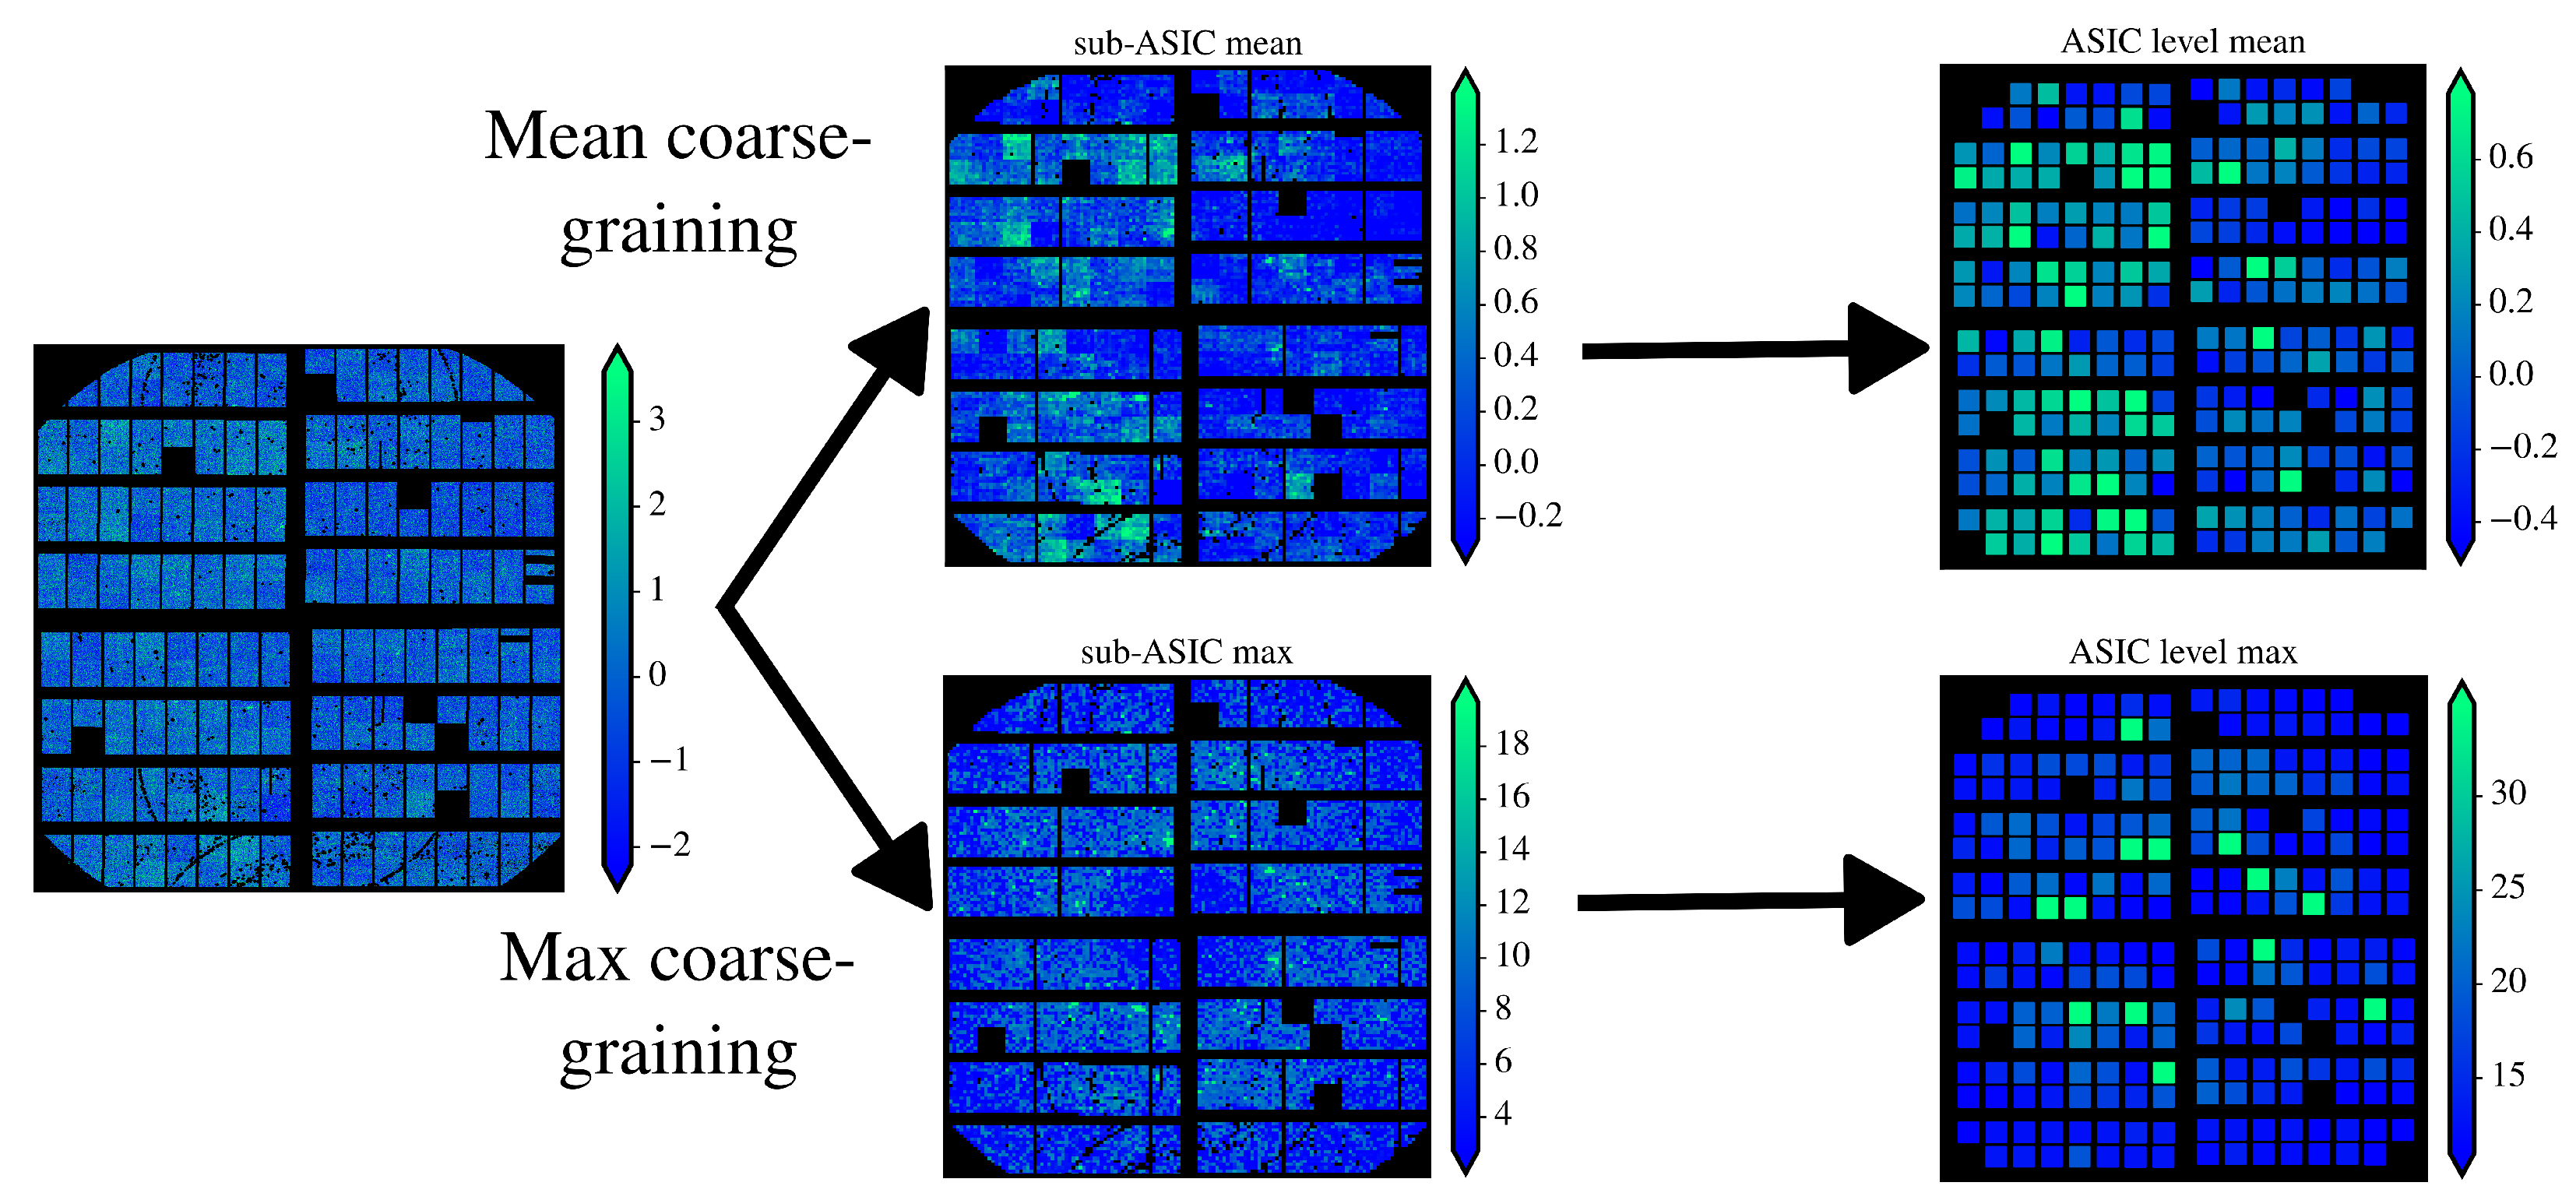
Nevertheless, this coarse-graining allows us to effectively reduce our dataset sizes by orders of magnitude, dramatically speeding up downstream machine learning. In this study, we pursued two levels of coarse-graining: the intensity mean and maximum of the 64 × 64 pixels on an ASIC (i.e., ASIC level) or non-overlapping 8 × 8 pixel blocks within each ASIC (i.e., sub-ASIC level) (Figure 3).
Notably, this coarse-graining is different from simply binning pixels on our detector since we are also computing the maximum values within each set of pixels (i.e., max-pooling). Binning either at the ASIC or sub-ASIC level is a natural way of coarse-graining the diffuse scattering pattern of liquid water (i.e., hits), and distinguishing these from misses (i.e., no water droplet was substantially illuminated by X-rays). Maximum-pooling routines are commonly used to detect when Bragg scattering from sub-micrometer crystals rises above the diffuse scattering of amorphous water [24,29]. Overall, ASIC-level and sub-ASIC-level coarse-graining resulted in a 4096-fold and 64-fold data reduction per pattern, respectively.
Whereas sub-ASIC-level coarse-graining retains some information about shape transforms and number densities of crystals within each illuminated droplet (middle row of Figure 2), ASIC-level coarse-graining already has sufficient discriminating power to classify patterns into misses and different types of hits (bottom row of Figure 2).

2.5. Covariance as a Statistical Criterion for Feature Attention

Not all of the coarse-grained features of the detector are equally informative. For example, some scattering angles do not receive much signal because they do not correspond to persistent or prevalent structural ordering in the sample. Furthermore, scattering signals within a single pattern can be correlated due to symmetry in the sample (e.g., rotational symmetry in liquid water; discrete symmetries in nascent crystals). In both cases, we turn to feature covariances to quantify which sets of coarse-grained features deserve attention for downstream pattern classification.
Principal component analysis (PCA) can efficiently identify co-varying sets of features and rank them by statistical significance [30]. Commonly employed as a dimensionality reduction technique, PCA reprojects each measurement into a new linear basis spanned by the eigenvectors of the data’s feature covariance matrix. Each eigenvector is composed of a linear combination of detector features. Crucially, these eigenvectors are ranked by their ability to explain the covariance seen across all the measurements (i.e., patterns in our case). Hence, PCA allows us to reproject each diffraction pattern onto the most statistically significant feature combinations (i.e., eigenvectors with highest explained variance).
The design matrix of our coarse-grained dataset X cg R N × D has far more rows (i.e., N = 5.6 × 10 8 measurements) than columns (i.e., D = 256 or D = 16 , 384 resultant features for ASIC vs. sub-ASIC coarse-graining, respectively). Hence, we compute its PCA by diagonalizing the D × D feature covariance matrix (averaged over the N patterns) as opposed to naively performing singular value decomposition on the far larger N × D design matrix (Appendix A).

3. Results

3.1. Impact of Coarse-Graining

To a limited degree, the mean-features after angular coarse-graining amplified the signal-to-noise ratio within each ASIC (or 8 × 8 pixel sub-ASIC block). This amplification was because summing correlated signals within each ASIC (e.g., extended shape transforms of crystals, or diffuse water ring) allowed them to outpace the contributions from uncorrelated detector thermal noise, which was calibrated to fluctuate around 0 analog-to-digital units (ADUs). This amplification is most apparent, for example, when signals from diffuse liquid scattering fill an ASIC. The summative signal on the entire ASIC grows linearly with the number of its pixels, but uncorrelated noise grows with the square root of the number of pixels instead.
Figure 2 shows that different types of information necessary for classification are retained at the two coarse-graining levels. The columns of Figure 2 show the four broad categories of classification: blanks (i.e., misses), hits containing only liquid water, hits containing both liquid water and ice, and hits that are mostly if not all ice. Whereas these four categories are distinguishable with just the mean-features at the ASIC level (bottom row), the important Bragg shape transforms of the nascent crystals are only resolvable at the sub-ASIC level.

3.2. Principal Component Analysis

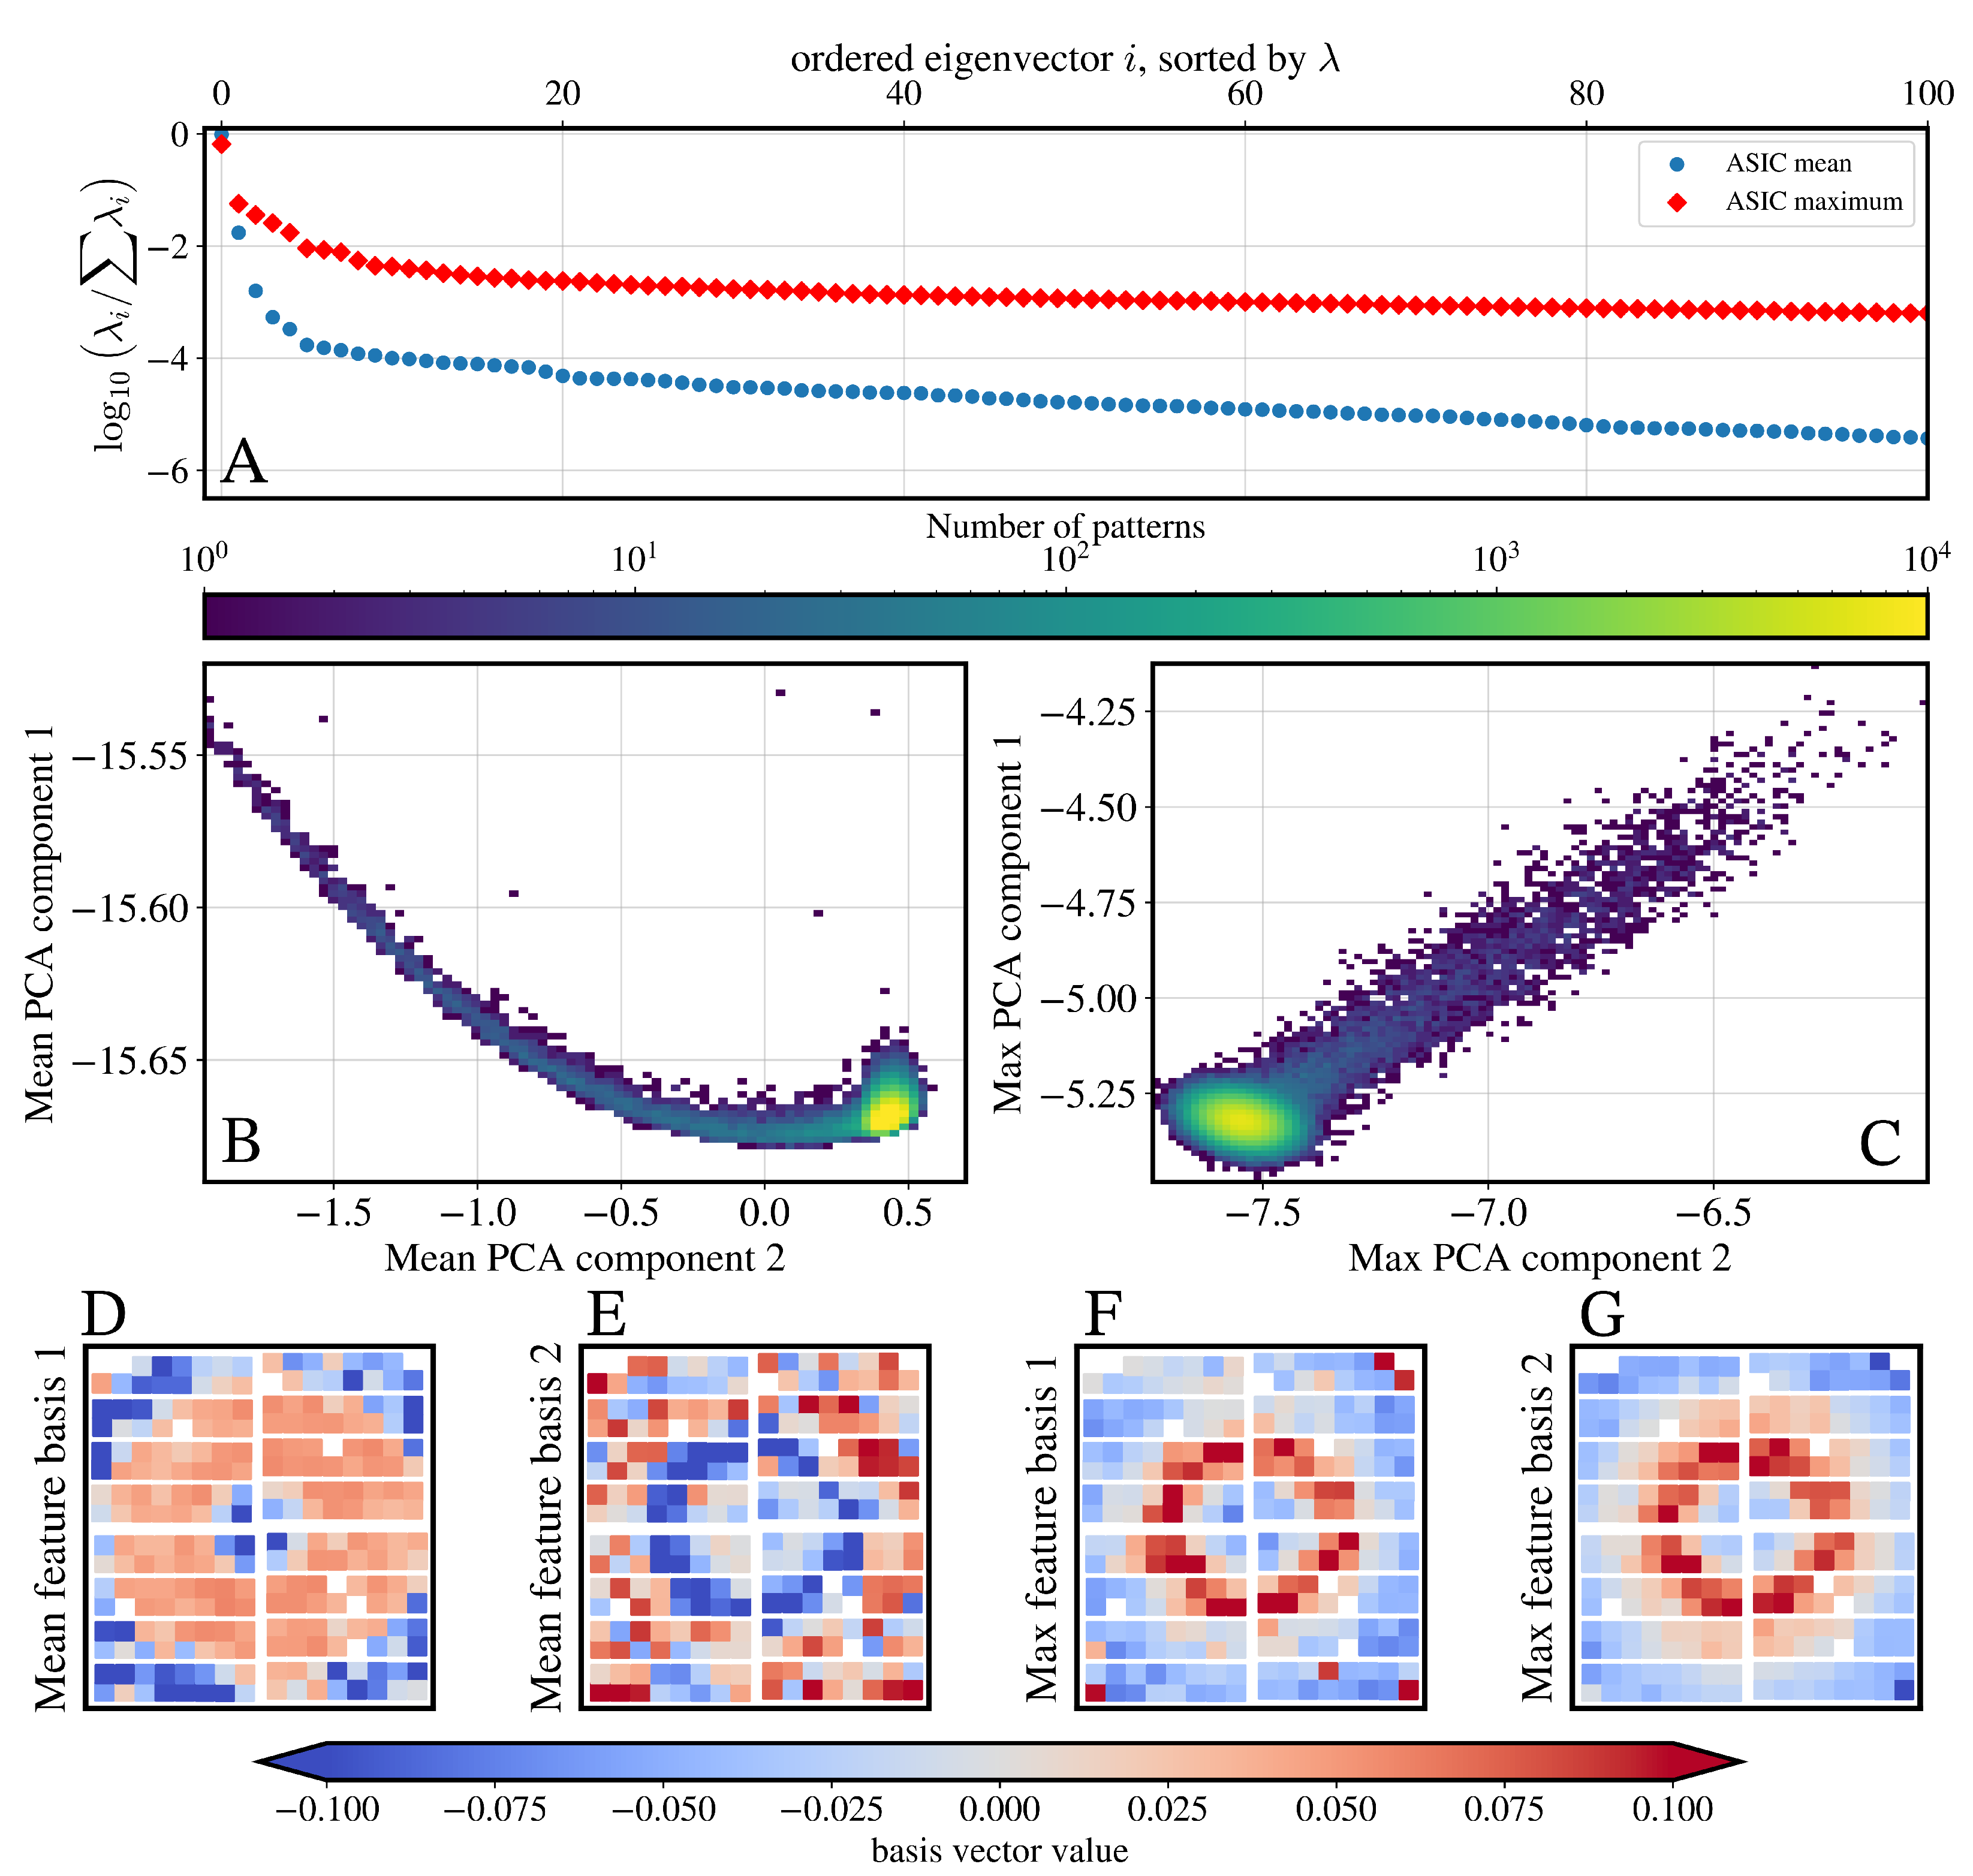
Figure 4 shows that more than 99.9% of the total variance of the ASIC-level mean-features across the entire dataset was captured by the three most significant PCA modes. The first PCA mode of the ASIC-level mean-features mostly describes variations in the diffuse liquid water scattering (with negligible changes in the detector-sample distance and photon energy). The second PCA mode of the mean-features mostly describes deviations that are orthogonal to the first mode’s diffuse scattering due to Bragg scattering from illuminated ice nuclei or crystals.
The ASIC-level max-features are more sensitive to where ice scattering is expected. For comparison, the bottom row of Figure 4 also shows the first two PCA modes of the ASIC-level max-features. Recall that max-features retain the maximum pixel intensity within each ASIC, which are tuned to capture coherent Bragg scattering when long-range order starts developing in nascent nanometer-size ice crystals. Comparing the PCA modes of max-features with those from mean-features, we see that the amplitudes of the former are larger where ice scattering is expected. This implies that these two modes capture most of the variations in the maxes amongst patterns due to ice scattering.
Note that these PCA modes show some rotational symmetry about the optical axis, largely because the signatures of liquid water and ice scattering should have this invariance when averaged over single observations of millions of water droplets. Deviations from this symmetry are likely owing to asymmetries in the detector’s response to photons.
Finally, the middle row of Figure 4 does not readily offer clear decision boundaries to classify misses from hits, nor amongst the different types of hits. PCA enables a re-encoding of the diffraction patterns. By projecting each pattern onto the found PCA modes, we are able to succinctly express our patterns as loadings onto these projections. The patterns can be largely reconstructed using the loadings from the modes with the highest explained variance λ . Hence, these loadings are an effective form of data compression.
Naively projecting the diffraction patterns from one run (i.e., a continuous burst of data collected in a 10-minute interval, typically comprising 10 6 patterns) onto its first two PCA mean-feature or max-feature modes does not yield physically interpretable decision boundaries for the four pattern categories (column labels of Figure 2). This absence of interpretability is typical of PCA since this data reduction is engineered to determine linear combinations of existing features that explain the data covariance; these new combinations of existing features suggested by PCA are not guaranteed to have a physical interpretation. Additional PCA modes and distributions can be found in Appendix A (Figure A3 and Figure A4). In Section 3.3 below, we propose a secondary dimensionality reduction based upon PCA that automatically suggests interpretable statistics for classification.

3.3. Outlier Statistics on Ice-Sensitive ASICs for Classification

Recall that our task at hand is to classify patterns into misses versus hits, then subclassify hits into different categories (Figure 2). Hits could contain scattering signatures from liquid water and crystalline ice in different mixtures. Fortunately, Figure 4 demonstrates that the principal modes of the ASIC-level max-features can be used to identify the subset of ASICs on the detector that are sensitive to ice-scattering. So, in principle, we can refocus our classification efforts onto features from this subset of ASICs that are sensitive to ice scattering (i.e., ice-sensitive ASICs).
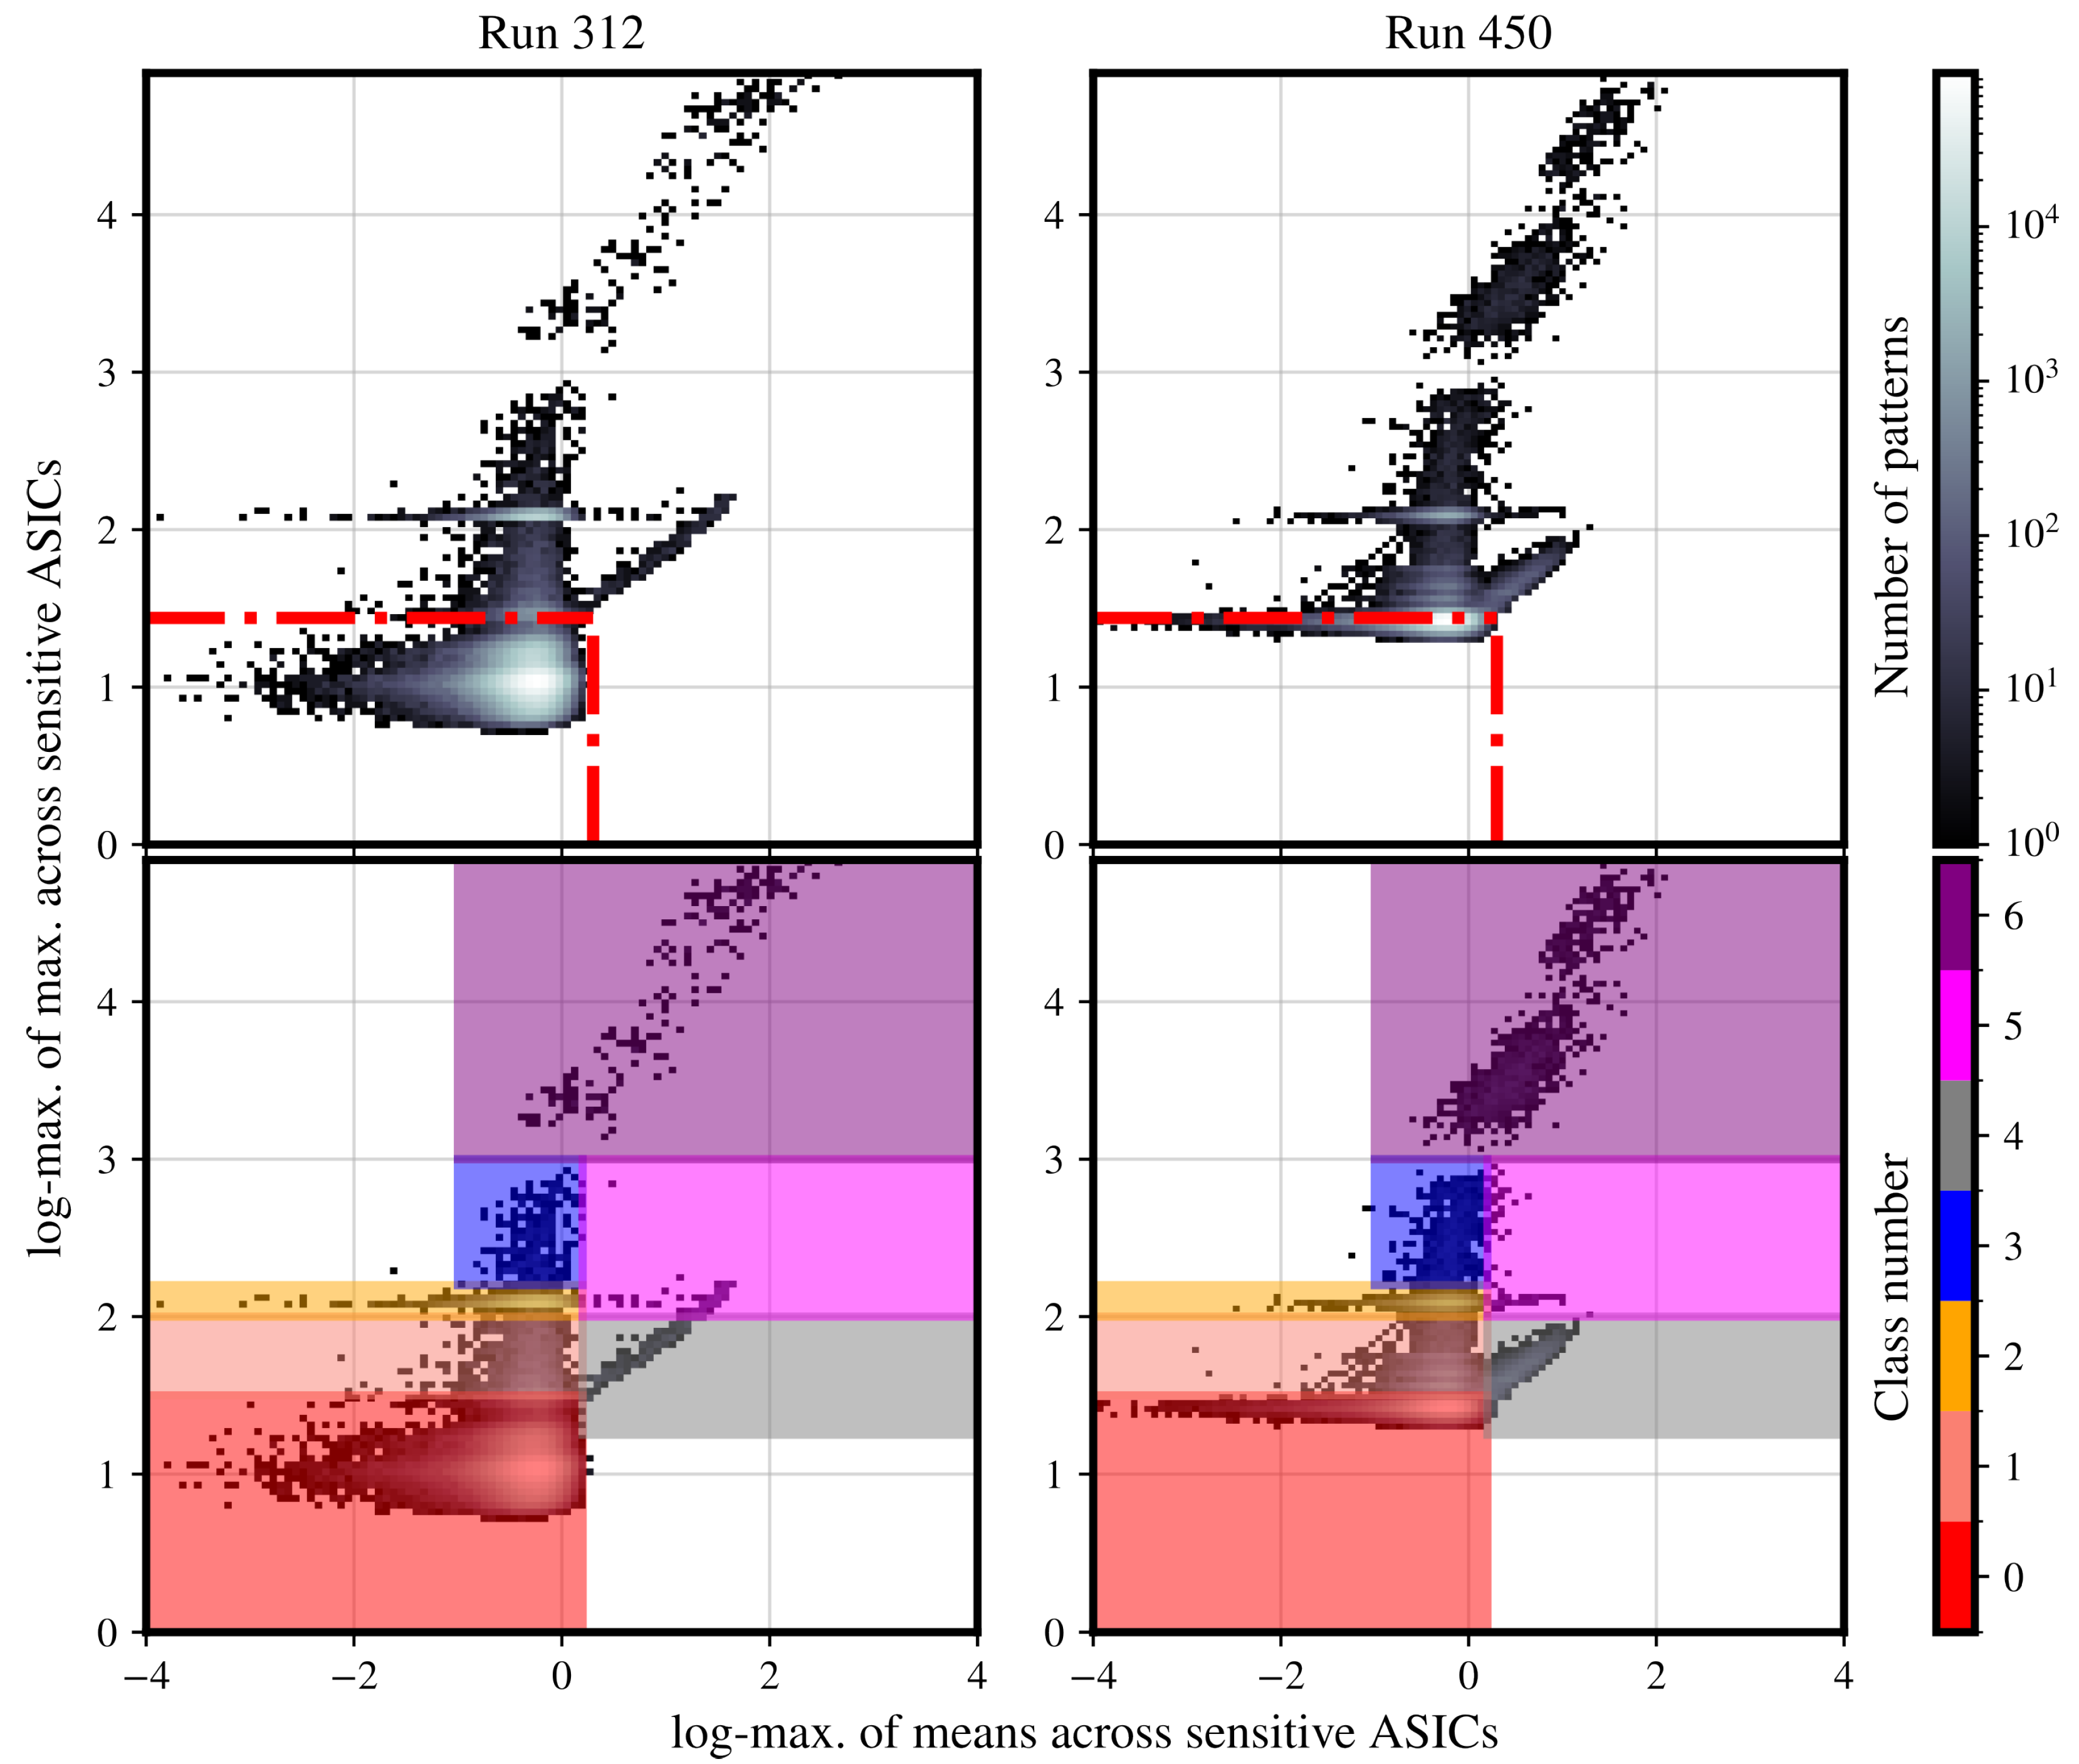
Figure 5 shows the distribution of outlier statistics of these ice-sensitive ASICs for approximately two million patterns in two different XFEL runs. Specifically, these statistics are simply the maxima of each pattern’s ASIC-level max-features and mean-features, but only for its ice-sensitive ASICs. This distribution of outlier statistics shows far more structure than the naive PCA projection of all ASICs' features Figure 4. By inspecting the distribution in Figure 5, we determine thresholds in this two-dimensional feature space of outlier statistics defined on the ice-sensitive ASICs. We initially proposed thresholds based on persistent features in the mean–max distributions. We inspected that the frames within these boundaries corresponded to the descriptions in Table 1. These features are influenced by the adaptive gain-switching of the detector, particularly when strong hits are observed, resulting in the detector switching from high to low gain.
We first identified a group of patterns, which we label as class 0, that are demarcated by the lower left rectangle (red in Figure 5), corresponding to high-confidence misses. The spread in the maximum of mean-features within this class (horizontal axis in Figure 5) arose from low levels of static background scattering, plus uncertainties in these ASICs in the absence of scattering from a droplet (see discussion in Section 2.2). In Figure 5, class 1 patterns are candidate misses with exceptional outliers in thermal noise (see Section 2.2). Similarly, class 2 patterns are also misses but where a few unmasked ‘hot-pixels’ had bright fluctuations. These localized fluctuations increased the max-features (upper Figure 5) more than they increased the mean-features (right in Figure 5).
The relationship between mean-features and max-features regarding ASICs is expected to be different for ice versus liquid water scattering. At hard X-ray energies, the scattering intensity from liquid water scales linearly with the total number of illuminated electrons n e . Comparatively, the Bragg diffraction intensities scale quadratically I ( q ) n e 2 . This difference is exaggerated by AGIPD’s adaptive gain, which switched from high to medium gain when a pixel received a high number of photon counts (e.g., Bragg scattering from ice).
Here, the spread in each pattern’s maxima of mean-features in their ice-sensitive ASICs is dominated by the fraction of droplet’s mass that is illuminated by X-ray pulses.
These droplets (2–12 μ m diameter) arrived randomly at the nominal focus of the ensemble of X-ray pulses (100 nm full-width half-max beam diameter). The pattern’s total intensity is inversely proportional to the distance between the illuminating X-ray pulse’s centroid from each droplet’s center of mass: illuminated n e increases as the pulse strikes closer to each droplet’s center. Conversely, droplets that are illuminated by weak wide-intensity tails of the X-ray pulses [31] result in lower mean-features. Although the X-ray pulse energies fluctuated from pulse-to-pulse, the positional jitter of the partially synchronized water droplets accounts for the majority of the intensity variations between patterns within each class.
As such, the patterns in class 3 were observed to be hits with weak ice scattering plus a very weak diffuse water ring. These class 3 patterns could be due to ice scattering from the low-intensity tails of X-ray pulses. The patterns in class 4 shown in Figure 5 primarily contain liquid water scattering. The most striking patterns are those in classes 5 and 6, which contain strong Bragg scattering from ice with a spread of intensities in the diffuse water ring.

3.4. Massive Hit-Finding and Hit-Classification

Compared to identifying blanks with only the total signal of each recorded pattern, classifying patterns using the two outlier statistics in Figure 5 is more robust against uncertainties in detector response, background counts, and variations.
A second outlier statistic enables us to distinguish different classes more carefully. For example, if only the mean outlier statistic was used, the distributions in Figure 5 would be projected down to the x-axis, causing classes 4, 5, and 6 to be indistinguishable.
Remarkably, the fixed ADU thresholds on these statistics (as shown in Figure 5) allowed us to automatically classify 4.5 × 10 8 patterns across Table 1.
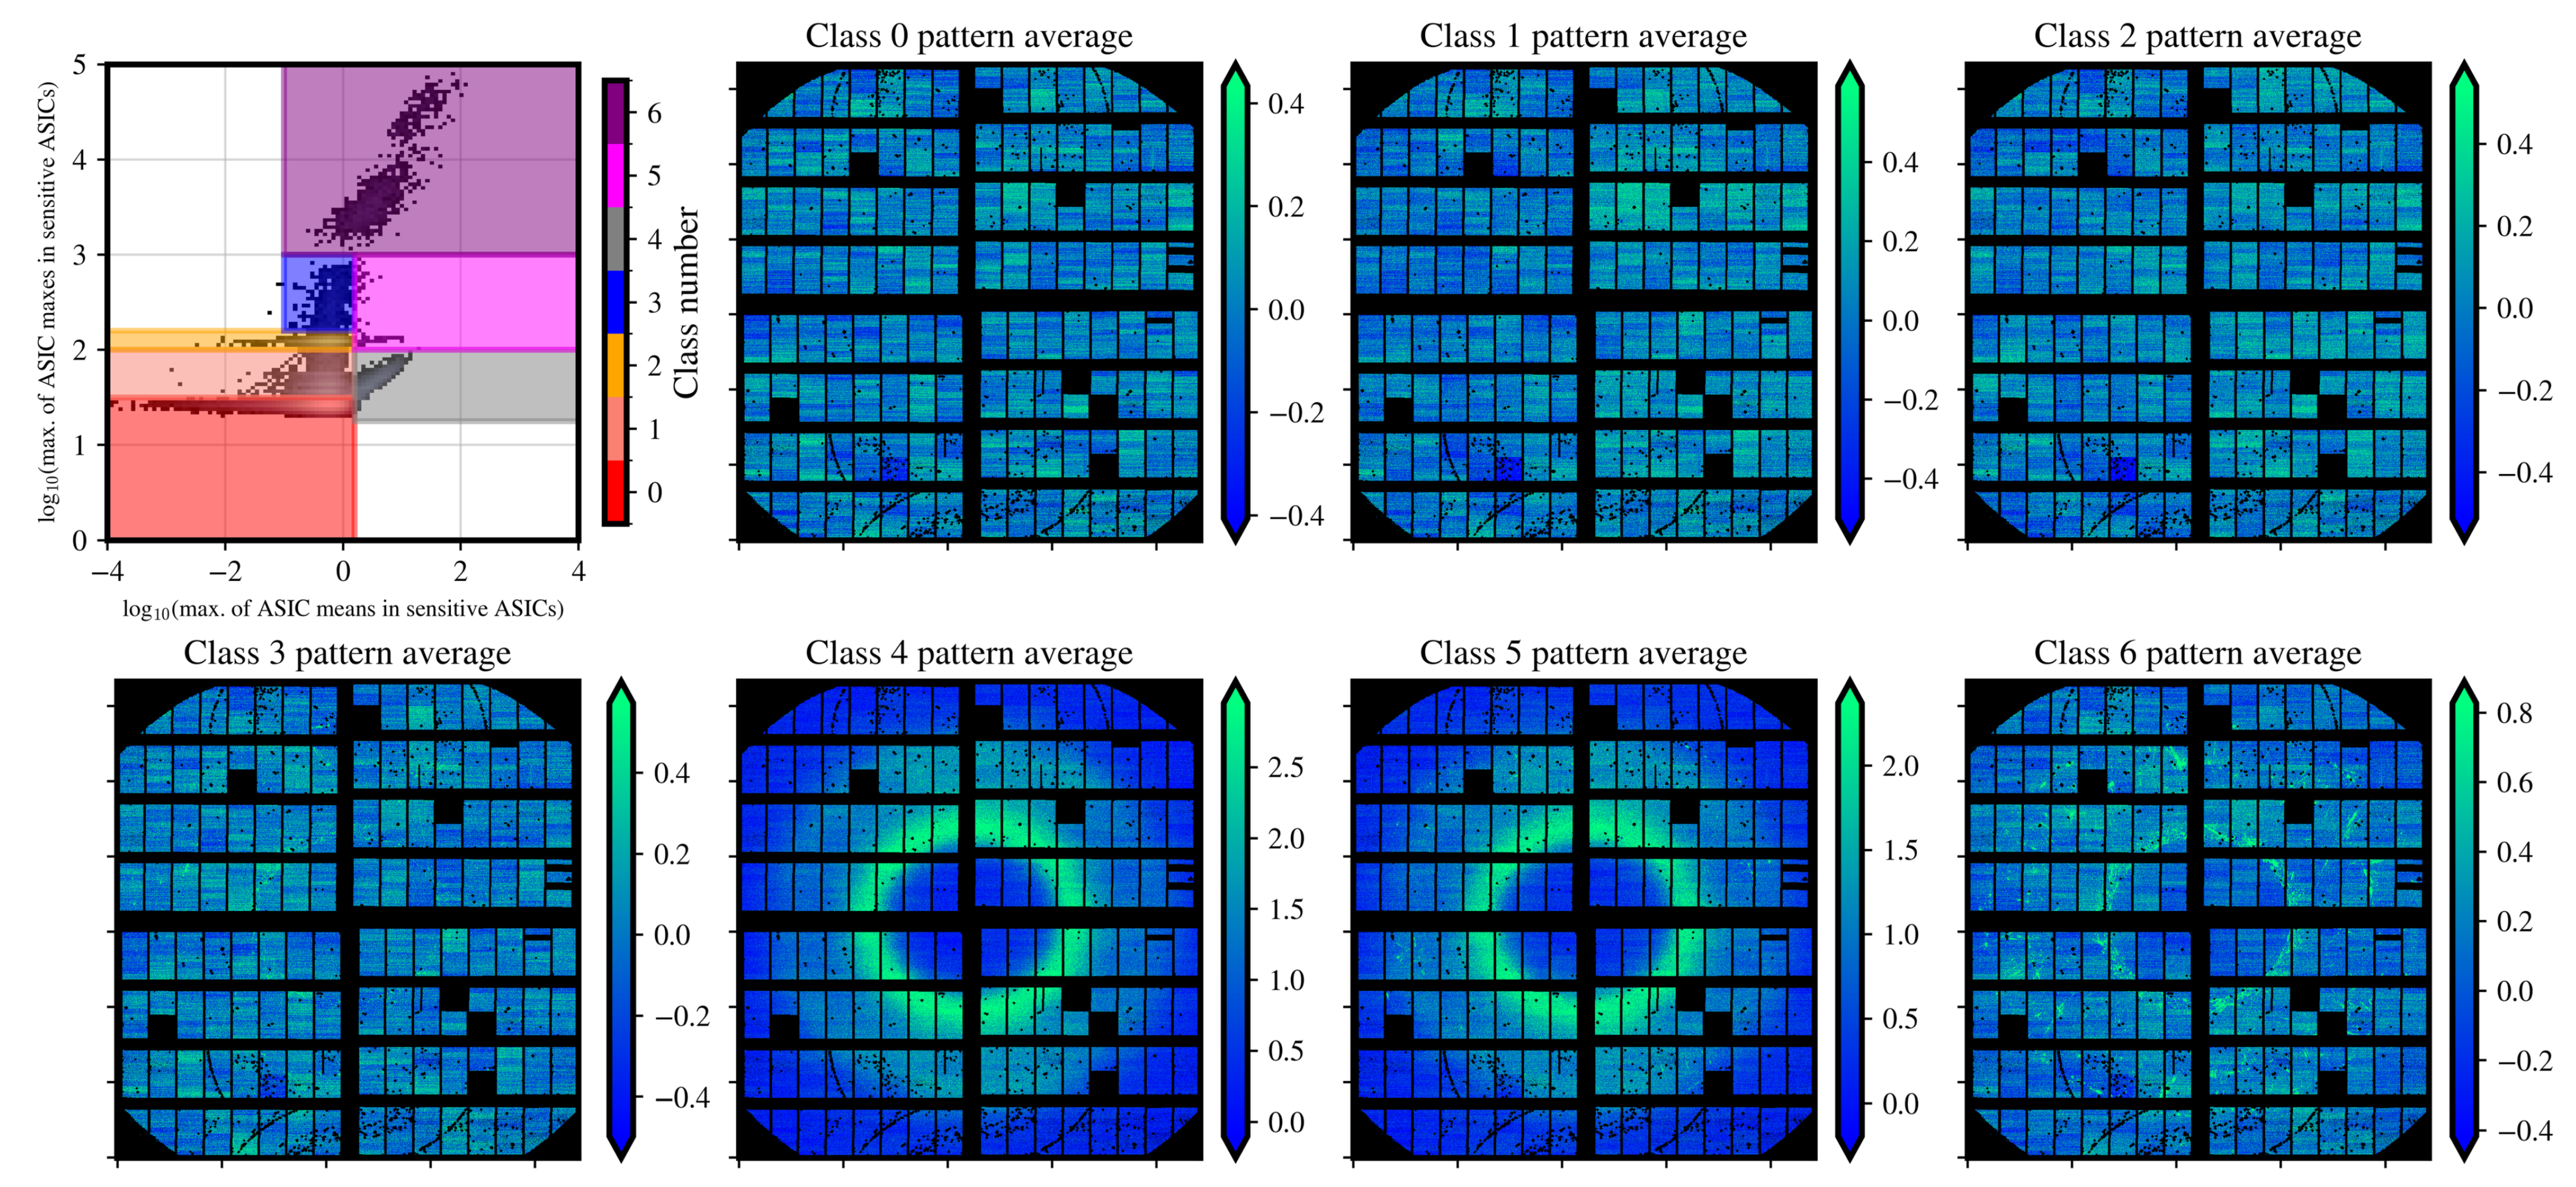
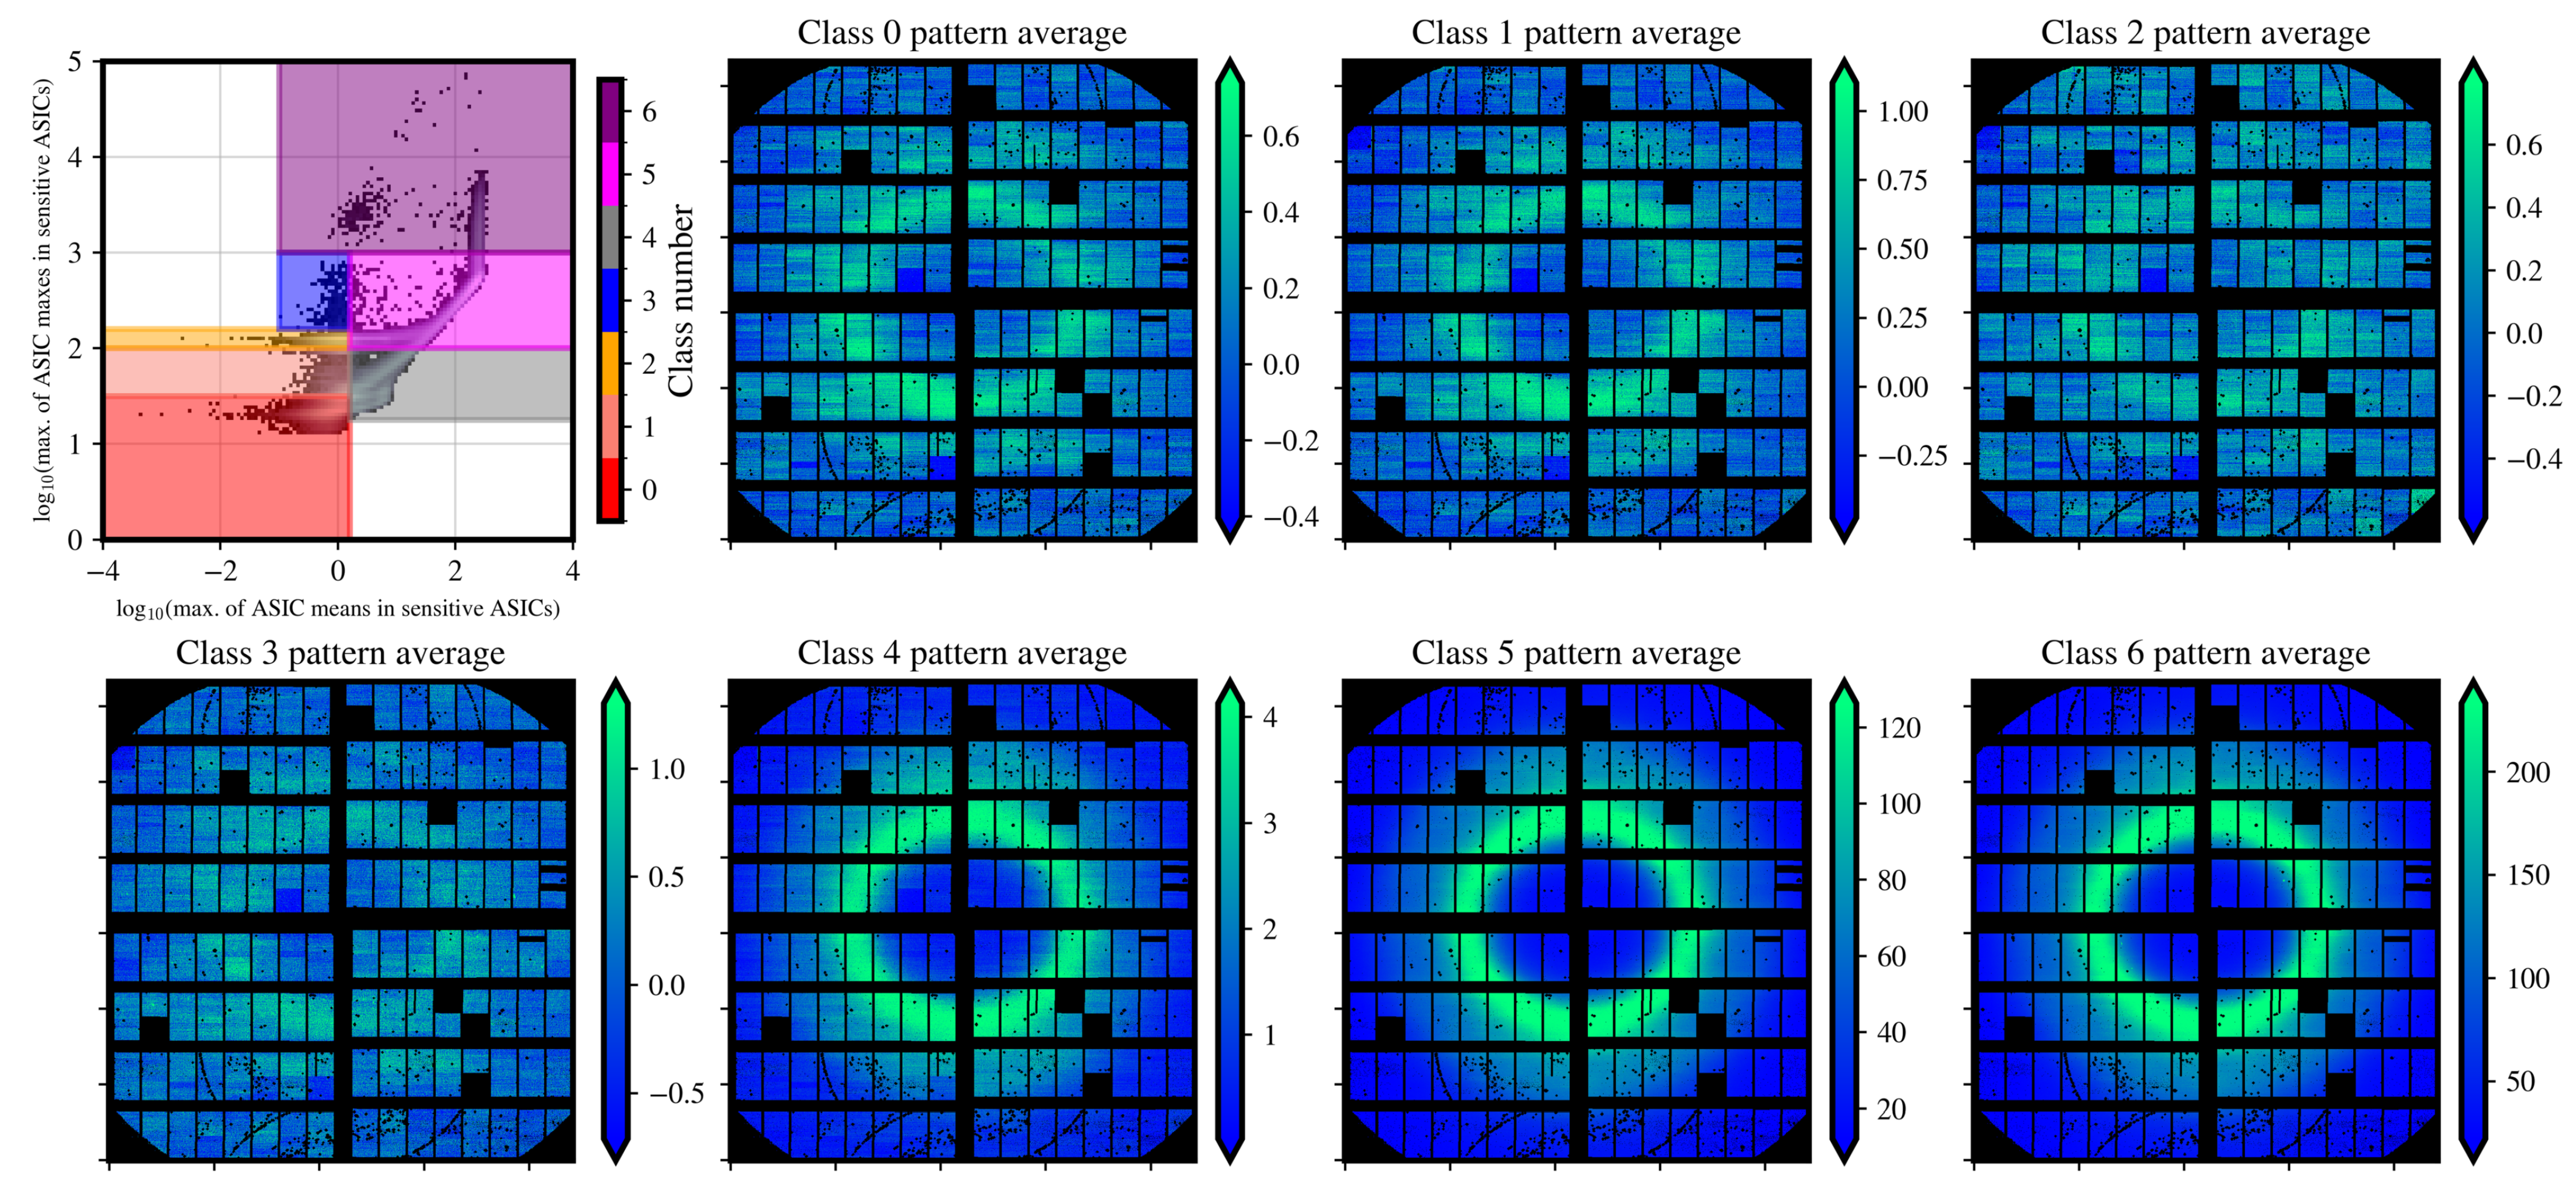
Validating our classification of 10 8 individual patterns by manual inspection is infeasible. Nevertheless, for each of the 555 runs, we checked that the class boundaries matched the ADU thresholds in Figure 5. In runs where the beam attenuation was intentionally adjusted, the class boundaries would cross these thresholds and their automatic classification would fail. Furthermore, we also pooled together the average patterns from random subsets of 100 patterns within each class of each run. In total, we created seven such average patterns for each run and manually inspected these averages for diffraction features expected for each type. Examples of these averages can be found in Figure A1 and Figure A2.
While these inspection techniques were simplistic, they allowed us to quickly ascertain that pattern classification was self-consistent for 440 of the 555 runs. This was completed by ensuring that class 0 averages had no water-related scattering signatures. The classification statistics for these 440 runs are tabulated in Table 1. The more careful validation in Section 3.5 suggested the hit/blank classification was statistically more robust than the classification within each hit class.

3.5. Cross-Validating Hits and Blanks

Since it is impractical to validate the classification in Section 3.4 by individually inspecting hundreds of millions of patterns, we instead cross-validated these class labels using unsupervised machine learning. One option combines manifold learning and clustering, where patterns are projected into a low-dimensional embedding, and like-patterns on this embedding are then clustered into classes. The computational complexity to initialize this unsupervised learning approach essentially scales quadratically with the number of patterns, which limits our cross-validating to 10 6 patterns of a single run at a time.
Further, the memory footprint of individual patterns for this cross-validation exercise was still unnecessarily large. Figure 4 shows that we could dimensionally reduce each pattern’s ASIC-level feature vectors by representing them as the weights of their mean- and max-features. Projecting the patterns as PCA weights captures 99.9% of the observed variance in the patterns within the first three modes, which, as we shall see below, was sufficient to discern the boundaries amongst blanks and different types of hits. We recast each pattern into its ten-dimensional (10D) feature vector: the concatenation of the five PCA weights/projections of each pattern’s ASIC-level mean- and max-features, respectively. We chose to use five instead of three modes each as Figure 4A shows that the explained variance ratio distinctly flattens off after five components. We believe that including two more modes as a precautionary measure to retain smaller variations would aid classification without incurring significant computational costs. This projection reduced each pattern’s feature vector from a dimensionality of D = 2 × 256 to D = 10 .
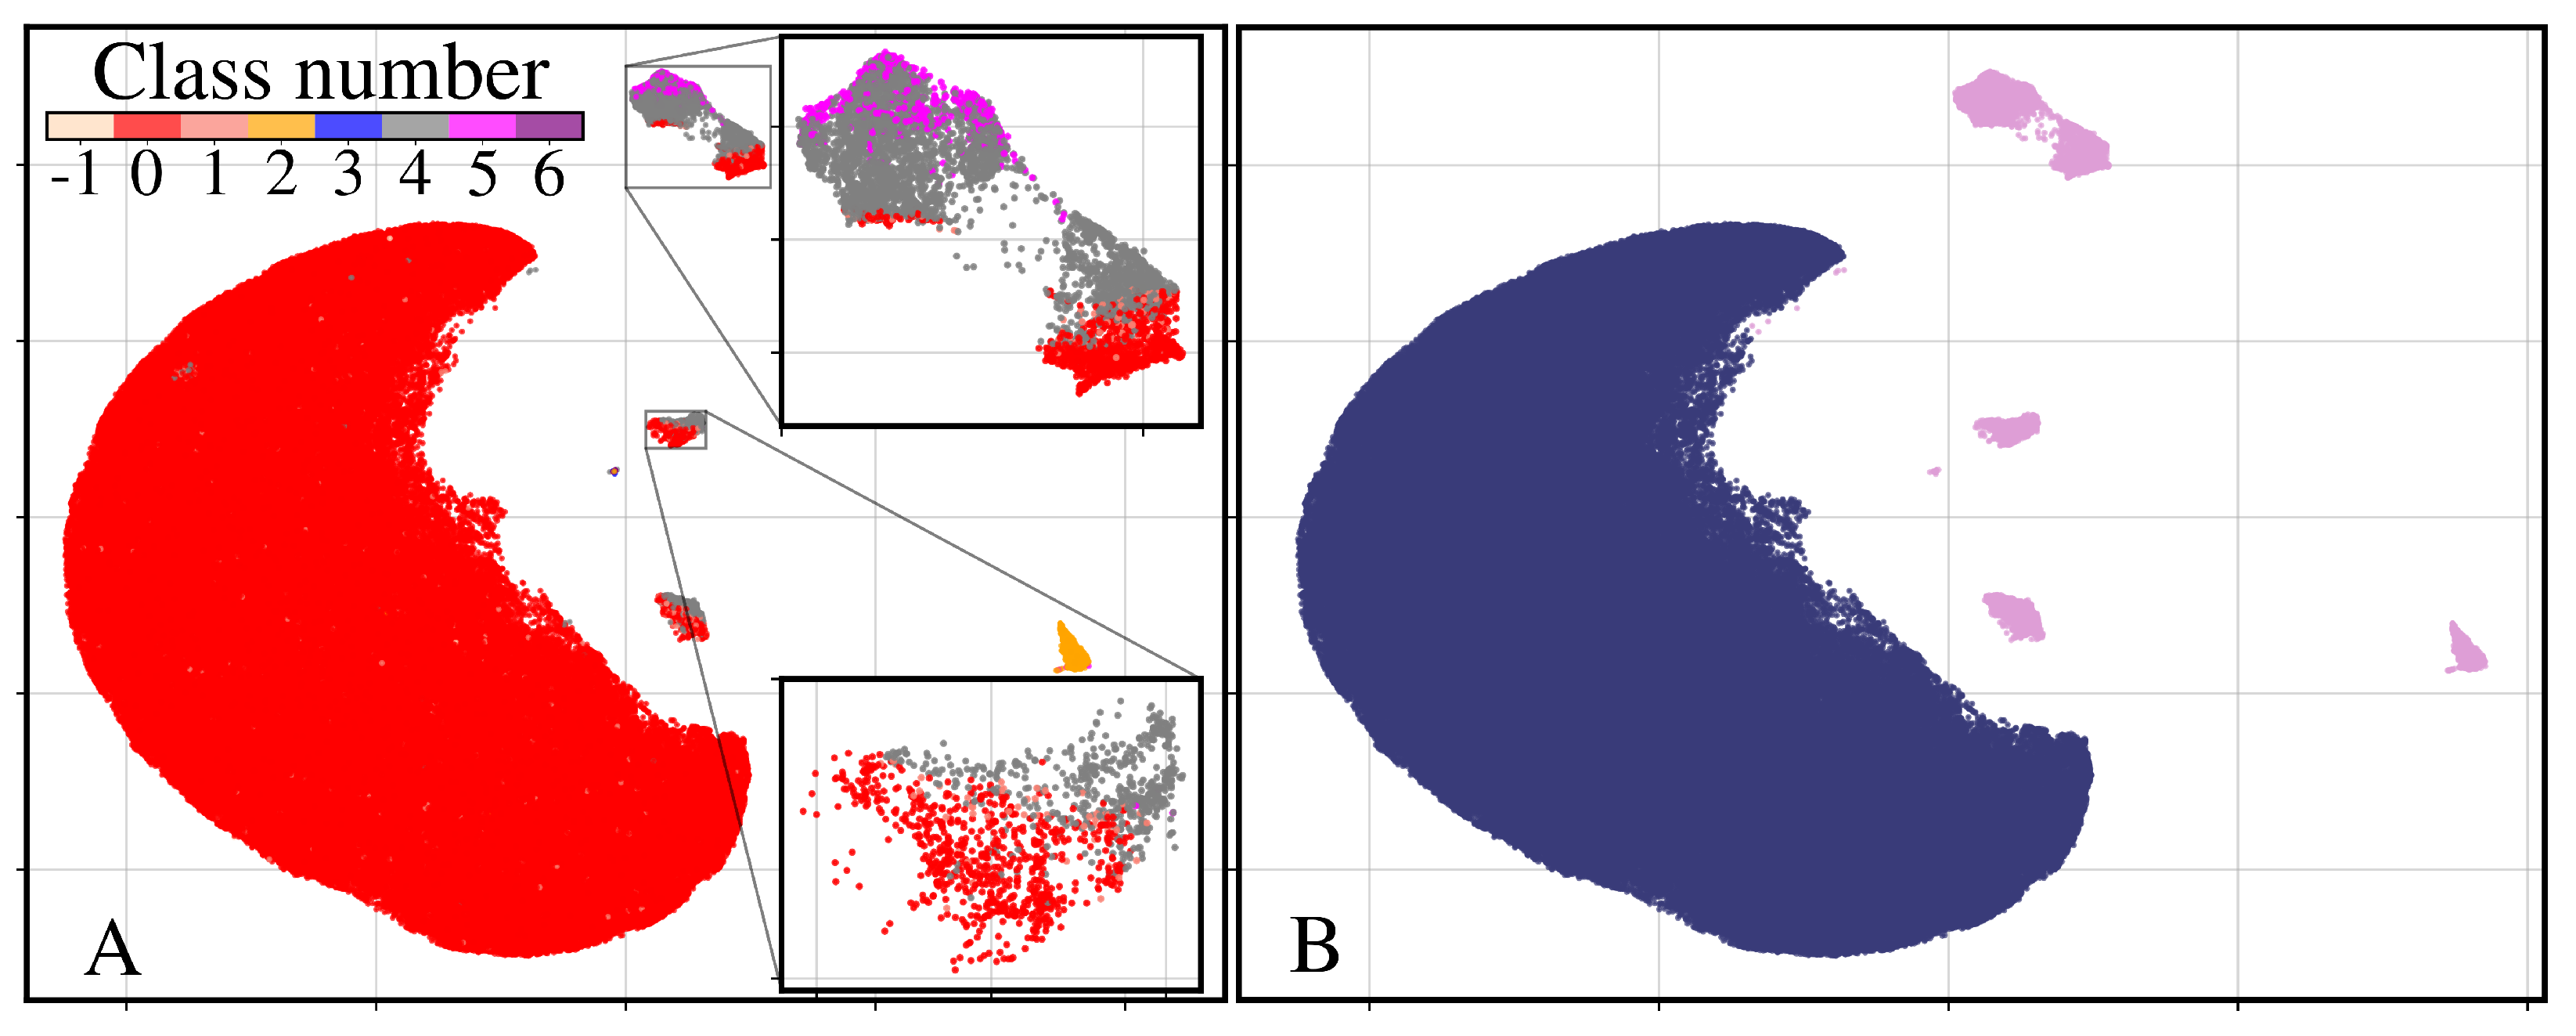
Two-dimensional (2D) embedding of 10 6 patterns (i.e., single run) was learned using the Uniform Manifold Approximation Projection (UMAP) [32] (Figure 6A). Whereas the details of this 2D embedding depend on how it was randomly initialized, the embedding’s decision boundaries are primarily dictated by the similarities and differences amongst the patterns’ 10D feature vectors. Typically, the dimensions of UMAP’s learned embedding do not have an obvious physical interpretation.
The class boundaries in the UMAP embedding (Figure 6) are clearer than those in Figure 5. These clearer boundaries might arise because the former compared 10D feature vectors (derived from PCA) rather than only 2D outlier features in the latter. Recall that the 2D outlier statistics were based on ice-sensitive ASICs identified from the first PCA mode.
The most striking feature in UMAP's embedding is that it contains a single large cluster of patterns surrounded by far smaller clusters. This large cluster mostly contains blanks (class 0 shown in red), while the smaller clusters primarily hold the remaining classes. Class 2 hits (yellow points), which, as we recall from Table 1, are blanks with hot pixels, are isolated in a small cluster, indicating strong unique features on such patterns. Although we can discern blanks from hits in the UMAP embedding, class 0 blanks occasionally appeared in the smaller clusters (insets of Figure 6A). Class 4 patterns (gray) were unevenly distributed amongst the smaller cluster, indicating that the simple thresholds using the outlier statistics in Figure 5 were insufficiently discriminating.
We used Density-based Spatial Clustering of Applications with Noise (DBSCAN) to automatically cluster the patterns in their UMAP embedding into hits versus blanks. It is straightforward to identify which DBSCAN clusters are predominately class 0 blanks: since the experimental hit-rates are expected to be low, the most populous cluster should be classified as blanks. Figure 6B shows UMAP-DBSCAN’s binary class labels of blanks (dark blue) versus hits (pink).
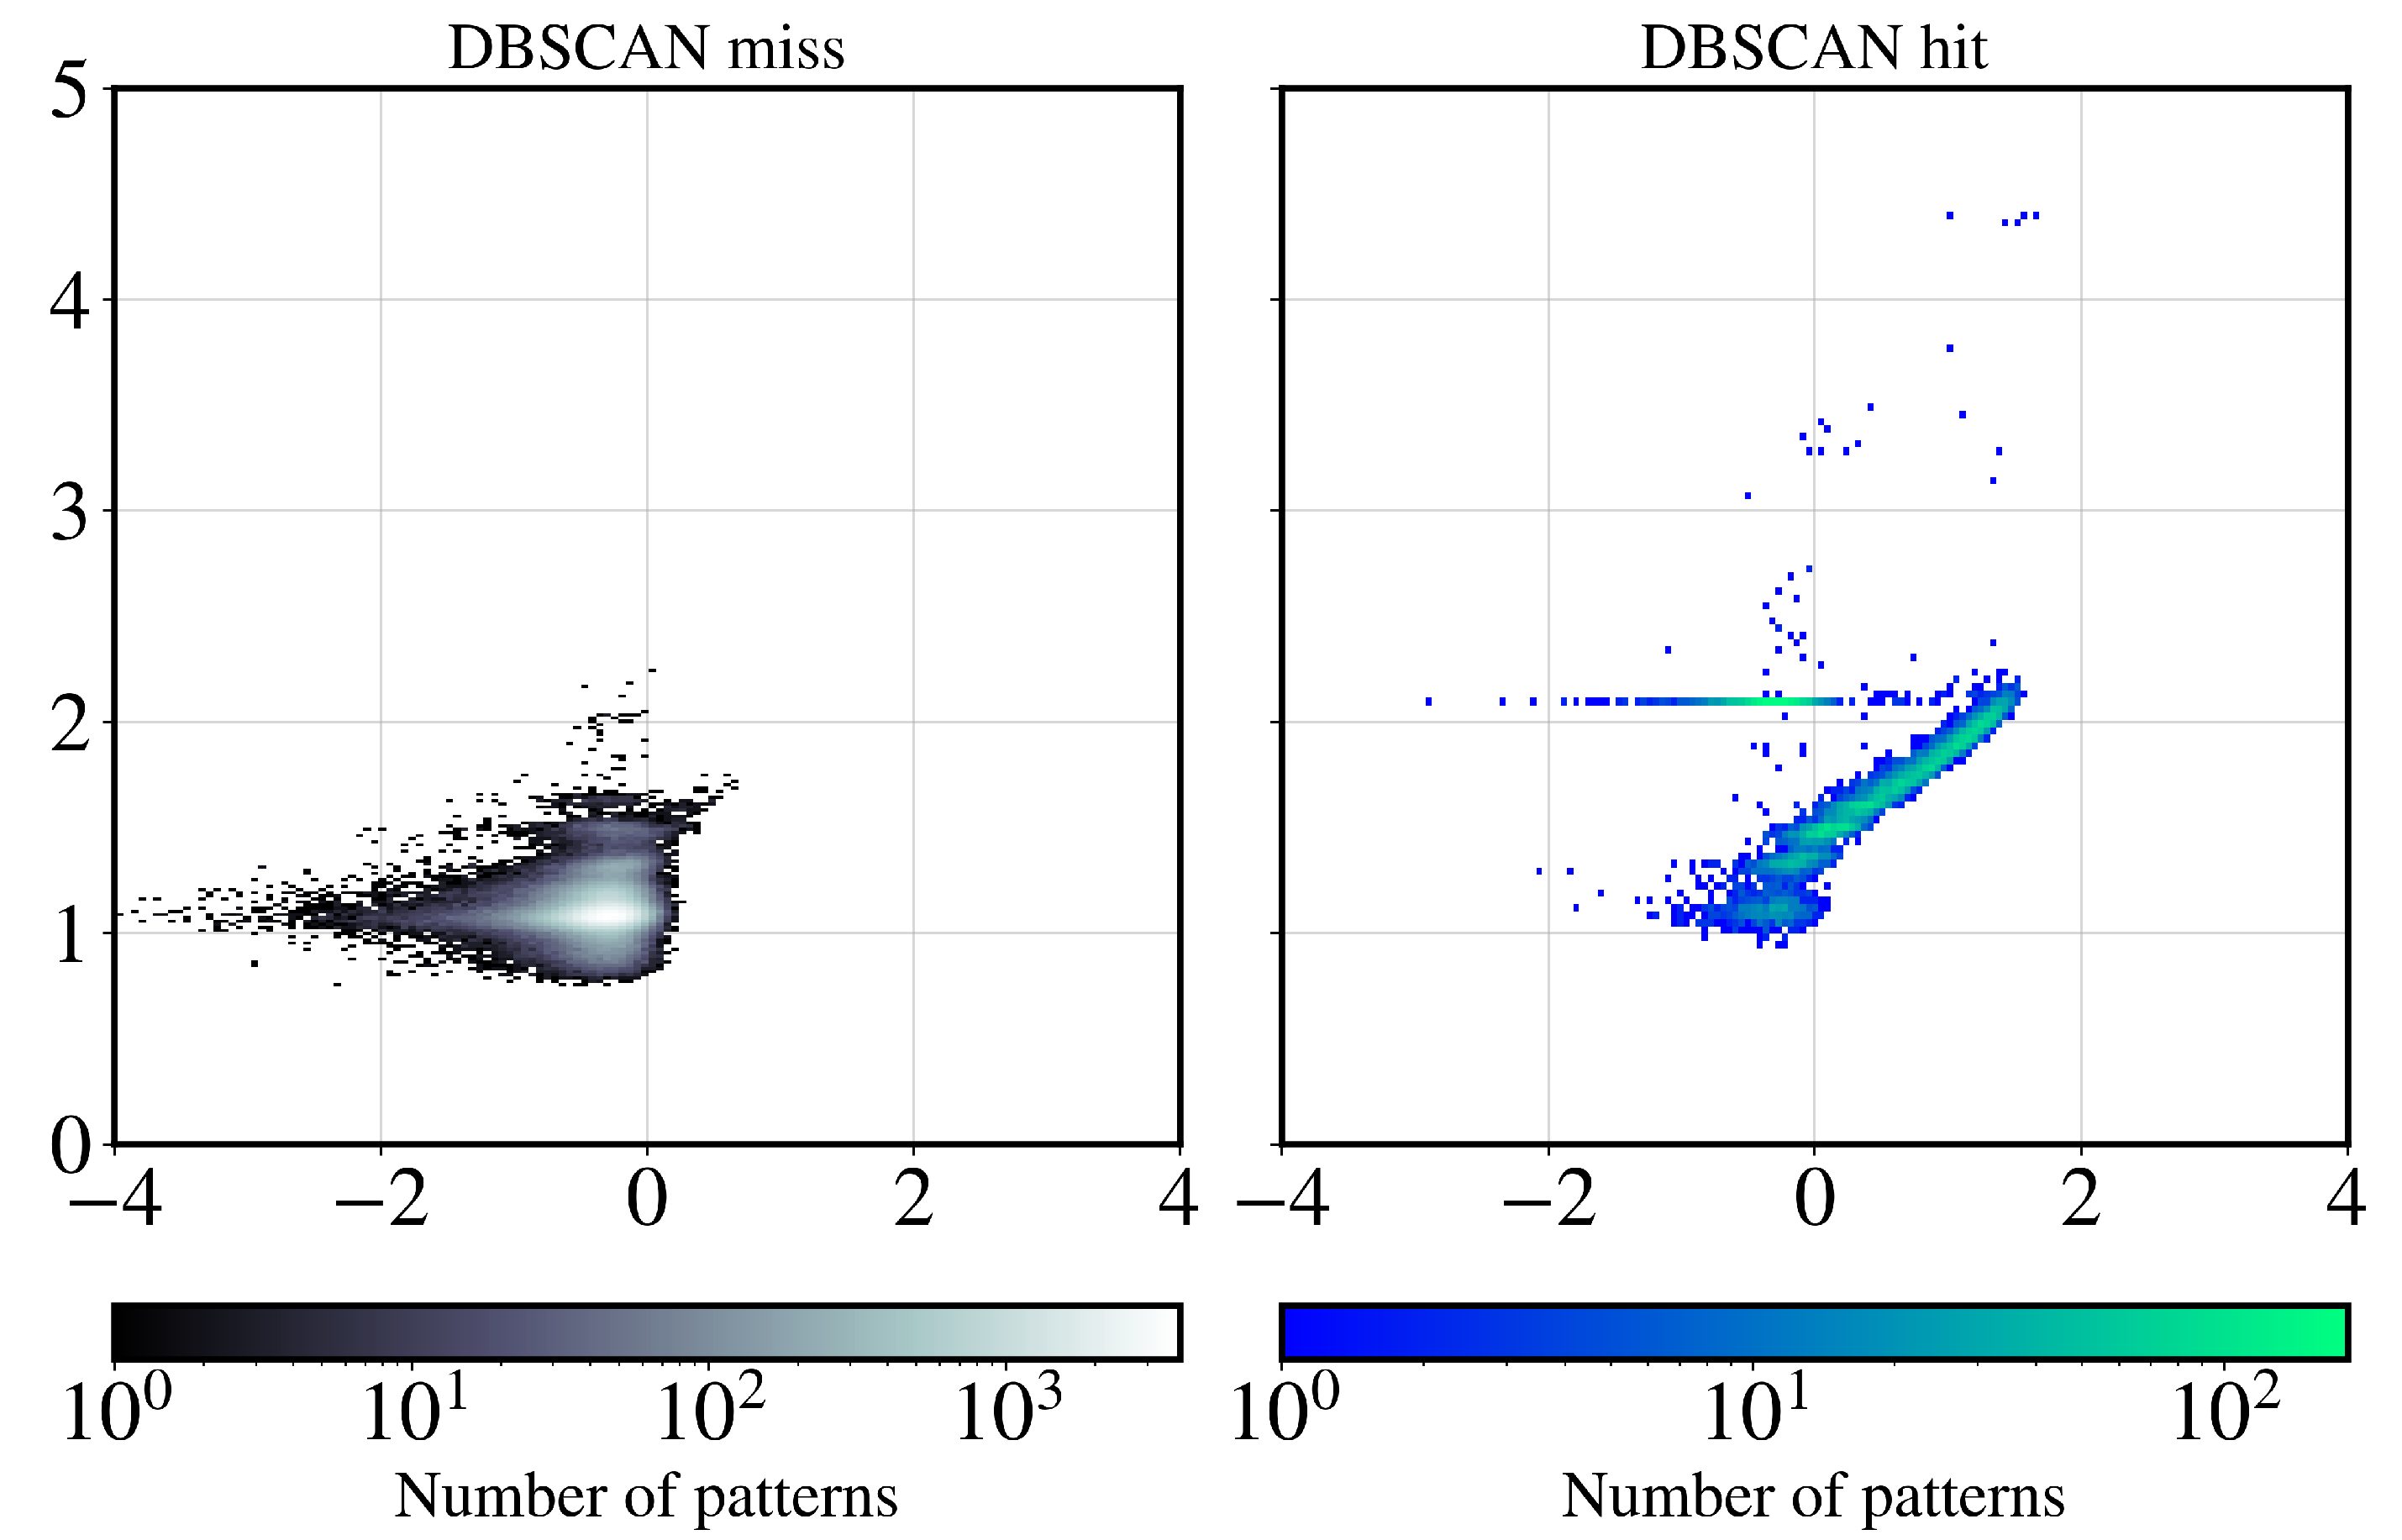
We iterate that hit-finding using UMAP-DBSCAN on 10D PCA-reduced feature vectors appears to be better defined than conducting the same with simplistic thresholds on 2D outlier statistics, as laid out in Section 3.3. The limitations of hit-finding using the 2D outlier statistics become evident when we visualize UMAP-DBSCAN’s hit-blank labels in the 2D axes of outlier statistics in Figure 7. Separately plotted, the DBSCAN’s blanks occur within the class 0 threshold boundaries proposed in Section 3.3. However, a small fraction of UMAP-DBSCAN’s hits extend into the same region occupied by the blank classes. From this overlap, we conclude that outlier statistics can be used to identify class boundaries to classify the diffraction patterns, but this process is not refined enough to do so with high accuracy. We iterate that manually labeling a million patterns is infeasible and subjective. Henceforth, we treat UMAP-DBSCAN’s class labels as the presumptive ‘ground truth’.
The confusion matrix in Table 2 shows the correspondence between classification of patterns in one run by UMAP-DBSCAN (rows) and by outlier statistics (columns). The diagonal entries of the table represent how well the two methods agree, and they are considered the ‘true’ positives (for hits) and ‘true’ negatives (for blanks). Patterns that fall into these diagonal entries are consistently classified by both methods and thus likely reliable. Most of the patterns (95%) were labeled as blanks by both methods. The off-diagonal entries, which account for 2% of the patterns, indicate where the two sets of classifications disagree.
The discussion above for 10 6 patterns might tempt us to cross-validate the hits found with outlier statistics against those from the UMAP-DBSCAN binary clustering for all 10 8 patterns across all 440 runs in Table 1. However, UMAP-DBSCAN clustering is still computationally expensive and may require manual hyperparameter tuning when a run’s experimental conditions deviate from the majority. For instance, the density and structure of the UMAP embedding are defined by its n_neighbors and min_dist hyperparameters, which govern the emphasis on the local or global data structure and how close UMAP is allowed to embed similar patterns together, respectively. Additionally, DBSCAN’s clustering is highly dependent on the eps hyperparameter that specifies the maximum distance between points to be considered as part of a cluster. Runs with fewer patterns would inevitably have a sparser distribution of patterns in the embedding, which would necessitate an increase in the eps hyperparameter to achieve the same clustering results.

4. Discussion

Classifying massive numbers of diffraction patterns can be accelerated with machine learning. If strong priors about patterns and interrogated structures such as preferred molecular structures are available, supervised learning trained on data that enforces these priors can be a good option [33,34]. However, supervised learning is not expected to generalize to out-of-distribution samples, which makes them unreliable for classifying previously unseen novel phenomena such as the complex structural dynamics in nucleating water.
Absent such priors, unsupervised machine learning for dimensionality reduction and classification can be a powerful alternative. Unsupervised approaches that use pairwise comparisons between unlabeled patterns require little to no prior knowledge for classification. This self-descriptive method also circumvents human biases that influence data interpretation. However, limited human supervision is inevitable for hyperparameter tuning and for inspecting and batch-validating the class boundaries. Nevertheless, these unsupervised approaches can drastically reduce the efforts of human supervision by orders of magnitude, where, instead of inspecting individual patterns, we only need to inspect large groups of patterns for intra-class uniformity and sensible inter-class separations.
Although massive XFEL datasets take up a great deal of storage, they are often highly reducible. From Table 1, we see that high-confidence blanks comprise 92.7% of the patterns among the 440 runs analyzed. Removing these high-confident blanks ( N 4.21 × 10 8 ), which individually uses 4.2 MB of storage, amounts to saving 1.77 PB of processed data. Unsupervised learning, as shown in this paper, can rapidly identify classes of uninformative patterns (e.g., blanks), which can be discarded to reduce data storage.
Naively, dimensionality reduction of hits (e.g., using PCA or UMAP) can also reduce data storage. However, in practice, we recommend keeping the raw detector data for the hits alongside a hierarchy of dimensionally reduced representations (e.g., ASIC level or sub-ASIC level). This three-tiered hierarchy naturally leads to a divide-and-conquer strategy for pattern classification: efficient hit-finding with only the ASIC-level features of all the patterns; hit-classification with the sub-ASIC-level features for just the hits; and using the sub-ASIC-level features to quickly identify and extract signatures of structural motifs from different regions of each raw detector pattern. Finally, precise and expensive analysis can be reserved for a much smaller subset of the original patterns, identified by hit-classification. Each step in this strategy analyzes fewer patterns than the previous steps, which helps with the burgeoning dimensionality of pattern features as we step forward.
These PCA-reduced representations might be useful for efficiently computing photon correlations, using orthogonal bases to compute realspace structural correlations [35]. Perhaps an efficient transformation to PCA’s orthogonal basis could speed up the computation of these correlations.
We must be aware of classification errors when using automated hit-finding to reduce data storage. These errors are commonly termed false positives (Type I error) and false negatives (Type II error), which depend on the hit-finding approach and hyperparameters. The experimenter must ultimately decide whether these error rates are tolerable.
Table 2 estimated the ‘false’ negative (0.7%) and ‘true’ positive (2.21%) rates for two runs. Since these runs are characteristic of the other 438 runs, we expect these rates to subsequently be similar as well. Although the ‘false’ negative rate appears acceptable, this is still a substantial 31% of the actual ‘true’ positives. Concretely, we had to decide whether permanently ignoring 10 3 out of 10 4 hits is tolerable for subsequent analyses. The experimenter can choose to spend more time reducing this false positive rate, but arguably with diminishing returns.
False positives also impact downstream analyses, but with less severity than false negatives. These blanks can still be identified and removed in more careful subsequent classification, for example using the cross-validation methods in Section 3.5. These unsupervised methods are likely to be computationally expensive (e.g., the UMAP analysis in Figure 6) and require manual inspection to ensure that the newly proposed blanks do not contain meaningful scattering signals. Until such a classification method is developed, the prudent strategy would be to keep the false positives.
A possible but often impractical way to reduce these error rates is to perform unsupervised learning on the entire dataset. However, pairwise comparisons between patterns are commonly used in unsupervised learning routines to learn embeddings, which can quickly become prohibitively expensive as the number of patterns increases. This poor scaling is related to the fact that clustering is known to be an NP-hard problem [36].
Unsupervised hit-classification is even more difficult with imbalanced classes. In XFEL experiments where the hit-rates are low, hits are severely under-represented in the entire dataset (see Table 1). Such severe class imbalances are known to cause minority classes to be merged, misrepresented, or ignored entirely by clustering algorithms.
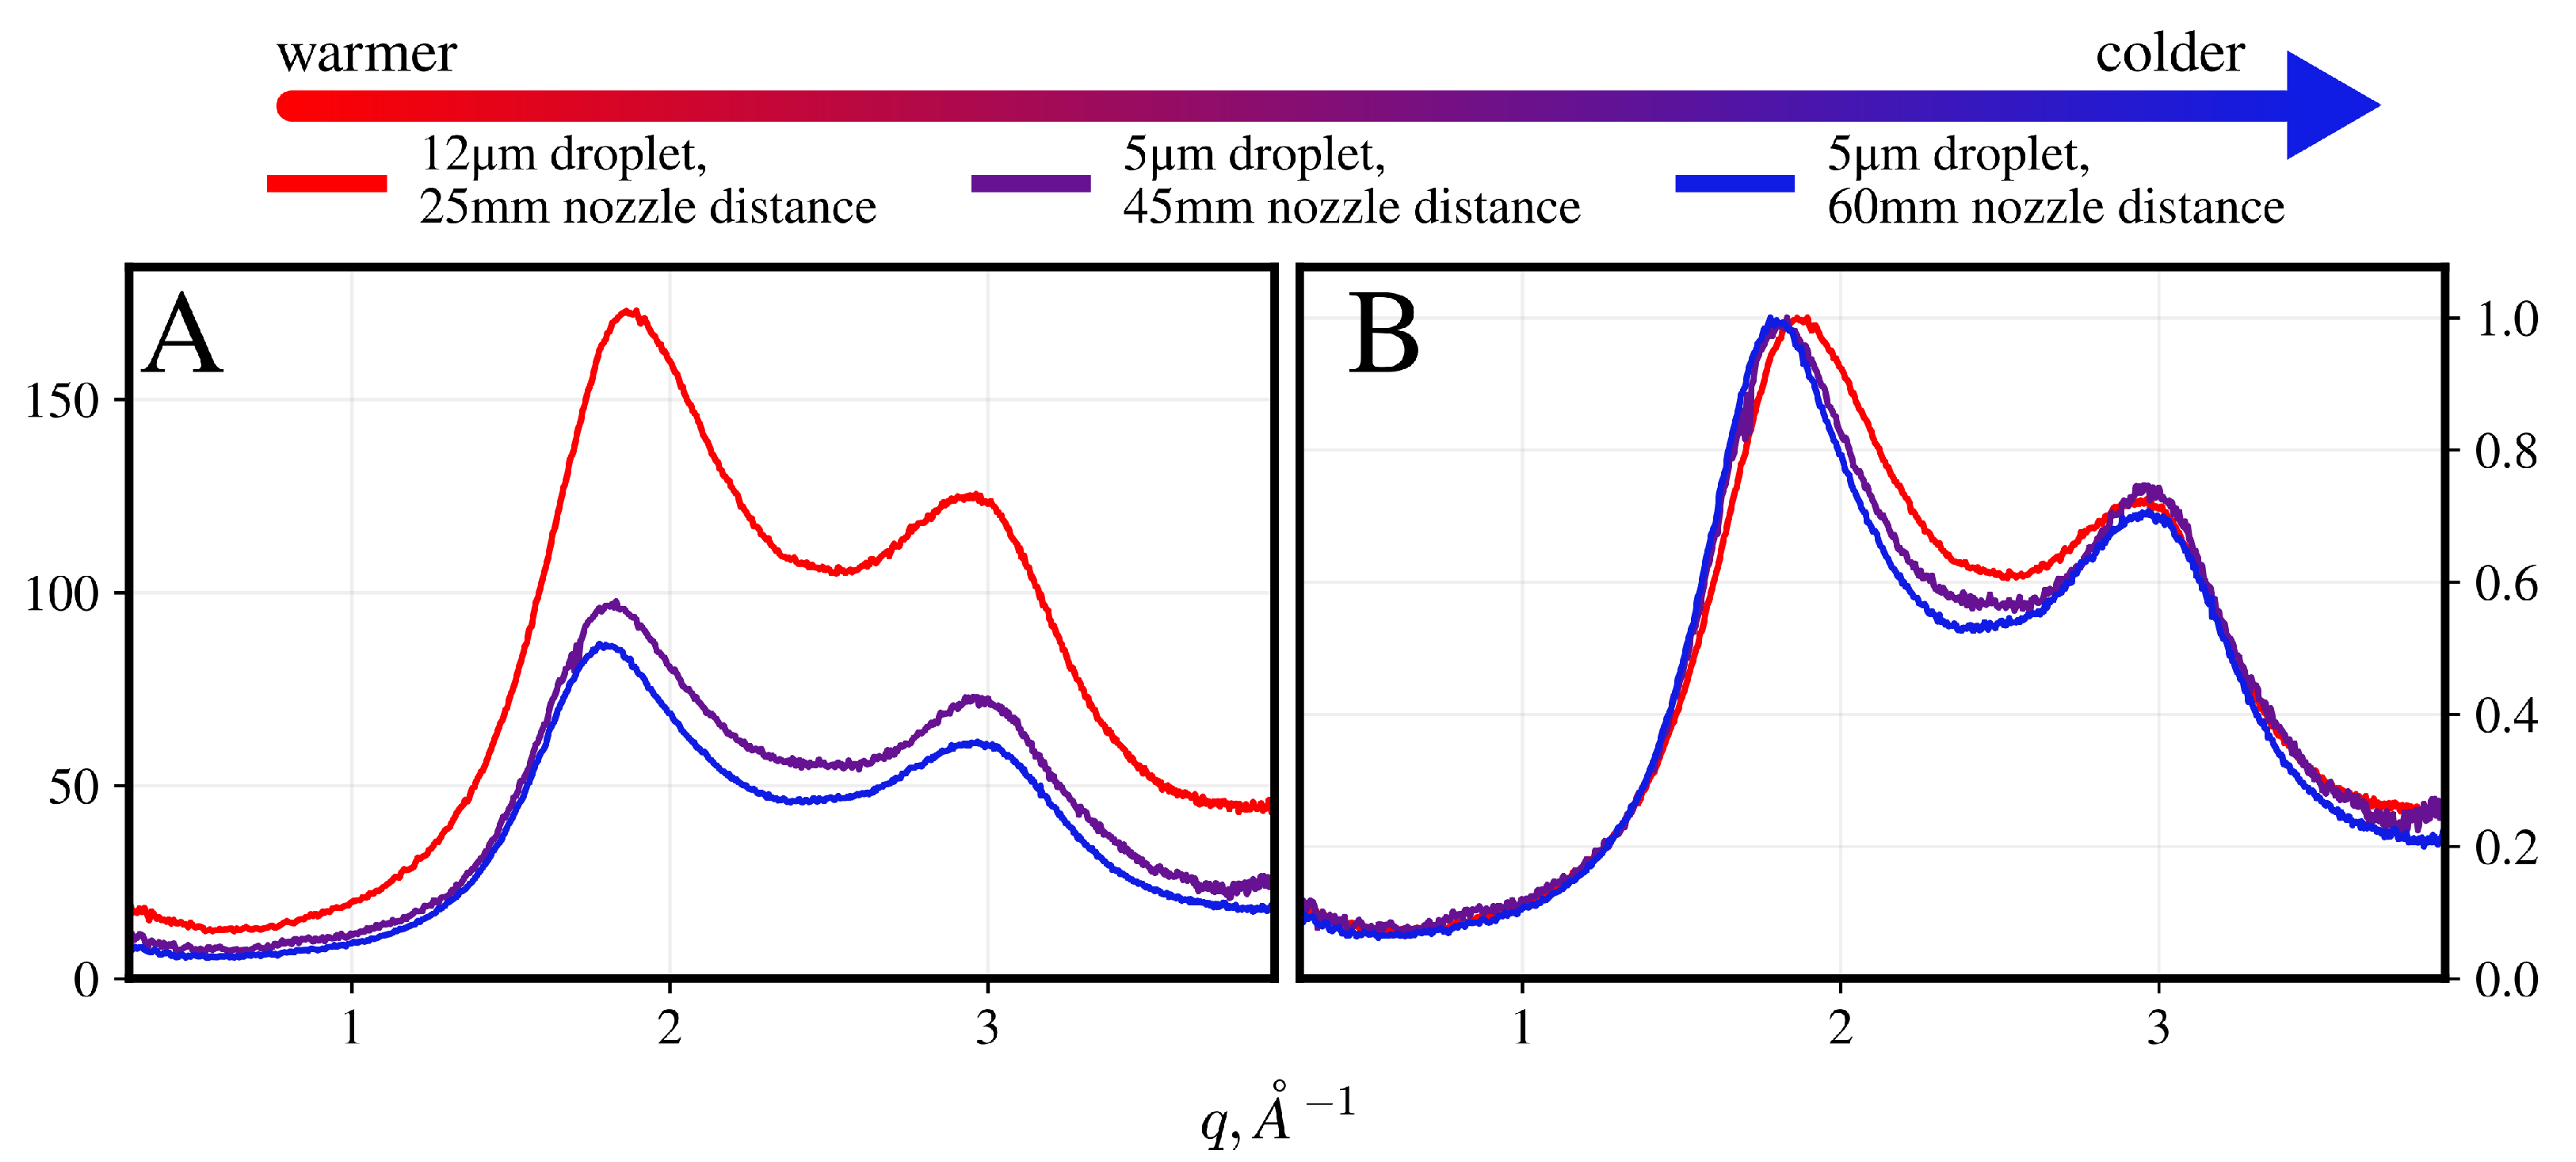
To validate the different hit classes, we selected three runs conducted with different droplet sizes and nozzle distances and inspected the average one-dimensional radial fluence-normalized profiles of a hundred random patterns from classes 6 and 4 (Table 1) in each run (Figure 8 and Figure 9, respectively). Although we did not directly measure the droplet temperatures, we were able to rank these three runs by droplet temperature. Ranking was conducted via nozzle distance (corresponding to evaporation time) and droplet size, which are factors known to affect the final temperature of the droplets [37].
In the ice-rich class 6, crystal diffraction peaks were observed at Miller indices of hexagonal ice. However, the peaks in the hundred-pattern averages showed significant peak broadening, especially around the triplet (010), (002), (011). This broadening is likely attributed to the shape transforms of small crystals [38]. The average of one hundred patterns is scant enough to prevent averaging away the shape transforms, but it is insufficient to show fully formed powder rings. Therefore, a new classification strategy that focuses on these shape transforms is needed to classify the different ice patterns, which will be the subject of a future study.
In the water-rich class 4, we observed a sensible trend in fluence as a function of droplet size, as well as a temperature dependence of the first two scattering peaks that corroborated with previously published results [3]. The patterns from the warmest configuration of 12 μ m droplets and 25 m m nozzle distance are approximately twice as bright as in the other two runs. This is because the X-ray-illuminated droplet volume of the former is slightly more than twice that of the latter pair. Upon normalization to account for this, the peak shifting becomes prominent (Figure 9B). This peak shift is seen most prominently for the first peak, while the second peak appears as a weak shoulder forming.
Although it largely succeeds at classifying patterns by scattering signatures, coarse-graining could lead to misclassification of different types of hits. For example, shape information from small crystals would be coarse-grained away and not register a significantly high maximum to be detected as ice scattering instead of liquid-only scattering.
Overall, while unsupervised learning on very large numbers of patterns can be made easier with coarse-graining and dimensionality reduction, efficient and accurate pairwise comparisons between patterns will still be a bottleneck. In principle, we can achieve such efficiency by cleverly picking representative subsamples of the entire dataset to learn the rules for classifying the entire dataset.

5. Conclusions

To summarize, we present a strategy to reduce massive XFEL datasets for hit-finding and hit-classification. This strategy includes coarse-graining detector features, then using PCA to find significant feature combinations on the detector (Section 3.3). We show that simplistic outlier statistics from these feature combinations can quickly inform interpretable classification. This classification is largely consistent with those found using more careful unsupervised learning on a small subset of the entire dataset, described in Section 3.5.
Developing these strategies for data reduction and hit-finding requires sufficient storage, compute, and high-performance computing expertise provided by the experimental facilities. This work serves as a strong example of how close collaboration between users and the experimental facility can bring clear benefits to the broader XFEL community by co-creating general data reduction approaches that help to streamline storage and accelerate analyses.
Our cautious success here makes us hopeful that our coarse-graining and dimensionality-reduction approach should also work for other microcrystal experiments at XFELs. Further, it paves the way toward live hit-finding and classification during data acquisition, albeit with safeguards to minimize false negatives even if at the expense of admitting substantial numbers of false positives.

Author Contributions

Methodology, N.-t.D.L., C.C., N.T., C.D., B.A., M.K., D.M., M.V., J.V., T.V.Y., E.S.H.C. and G.-S.P.; data collection, J.A.S., C.C., N.T., N.-t.D.L., P.A., M.P.H., A.F., E.D.S., S.K., R.d.W., J.B., T.S., B.H., T.A. and T.Y.; software and analysis, F.R.N.C.M., N.-t.D.L., P.S., T.B.B., R.P.K., O.T., R.L., F.D.A., E.S. and E.S.H.C.; investigation, J.C.P.K., M.V., S.C., P.A., S.P., A.F. and A.V.M.; resources, C.D., J.M., M.K., M.V., R.L., J.V., R.d.W. and G.-S.P.; data curation, C.C., P.S., J.M., J.B. and O.T.; supervision, J.A.S., N.T., F.R.N.C.M., N.-t.D.L., A.V.M. and G.-S.P.; project administration, J.A.S. and C.C.; funding acquisition, C.C., N.T., F.R.N.C.M., J.A.S. and B.A.; writing—original draft preparation, E.S.H.C., review and editing, S.B., H.N.C., J.M., N.-t.D.L. and J.A.S. All authors have read and agreed to the published version of the manuscript.

Funding

This research was funded by the Swedish National Research Council, Starting Grant No. 2017-05128 (J.A.S.), the Göran Gustafsson Foundation, Grant No. 1808 (J.A.S.), Carl Trygger Foundation, Grant No. 21:1427 (J.A.S.), the Swedish Research Council Grants No. 2018-00740, 2019-03935, 2023-03900 (C.C.), 2019-03935, 2023-03900 (N.T., S.C.), 2018-00234, and 2019-06092 (F.R.N.C.M.), the ERC Consolidator Grant 101088426 (F.R.N.C.M.), the Australian Research Council Grant DP220103679 (B.A.), the Australian Research Council Discovery Project grant DP190103027 (A.V.M.), the National Research Foundation of Korea (NRF2016R1A3B1908336) (G.S.P.), and the Ministry of Education in Singapore (Ph.D. fellowship for E.S.H.C.; AcRF Tier-1 grant for N.-t.D.L.).

Data Availability Statement

The data that support the findings will be available at https://doi.org/10.22003/XFEL.EU-DATA-003378-00 following an embargo from the date of publication.

Acknowledgments

The authors would like to acknowledge the European XFEL in Schenefeld, Germany, for provision of X-ray free-electron laser beamtime at the Scientific Instrument SPB/SFX (Single Particles, Clusters, and Biomolecules and Serial Femtosecond Crystallography) under proposal number 3378 through the Topical Call on Molecular Water Science (2022). The authors would like to thank the staff for their assistance, including Gerhard Grübel and Sakura Pascarelli for coordinating the Topical Call on Molecular Water Science. We acknowledge the contributions of others involved in the project: Ibrahim Dawod, Alessandra Hankel, Marcin Sikorski, Lena Worbs, Richard Bean, Konstantin Kharitonov, and Dominik Oberthür. We acknowledge the support of the Deutsche Forschungsgemeinschaft (EXC 2056, project ID 390715994) through the Cluster of Excellence ‘Advanced Imaging of Matter’. Additional support was provided by Deutsches Elektronen-Synchrotron DESY, a member of the Helmholtz Association (HGF), and the University of Hamburg. B.A. would like to acknowledge the support of the Biomedical and Environmental Sensor Technology (BEST) Centre.

Conflicts of Interest

The authors declare no conflicts of interest. The funders had no role in the design of the study; in the collection, analyses, or interpretation of data; in the writing of the manuscript; or in the decision to publish the results.

Appendix A

The sum of squares matrix is the covariance of features in a dataset. Following the convention of the design matrix X having dimensions N measurements × D dimensions , the D × D sum of squares matrix S is defined as the sum of outer products of measurements:
S X T X = n = 1 N x n x n T
Since the covariances of features are only concerned with the variations from the mean, the design matrix can be centered by measurements (rows) and dimensions (columns).
The singular value decomposition (SVD) of X is equivalent to finding its principal components, allowing it to be written as
X = U X S X V X T
In this form, the row and column-normalized scatter matrix Σ X can be written as
Σ = X T X = V X S X T U X T U X S X V X T = V X S X 2 V X T
Because the left and right singular vectors, U and V , respectively, are unitary, the product simplifies and the scatter matrix can be succinctly represented with V and the corresponding singular values S . SVD, however, takes O ( N D 2 ) + O ( D 3 ) time to solve exactly, making it extremely expensive to compute for large dataset problems such as ours.
Instead, consider the eigen-decomposition of Σ :
Σ = U Σ Λ Σ U Σ 1
Match Equations (A1) and (A2) by setting
Λ Σ = S X 2 , U Σ = V X
We can compute the SVD of X by computing the eigen-decomposition of Σ instead. This is significantly faster and more viable than straightforward SVD as the scatter matrix only scales with number of dimensions D and not the number of measurements N [39].
The singular values λ i represent the amount of variance within the dataset explained by its corresponding singular vector v i . To obtain the weights of the patterns, they are projected onto the basis of singular vectors.
For our analysis, we first rescaled each column to lie between [ 1 , 1 ] . Each measurement was then centered to a mean of 0 and rescaled to a variance of 1.
To compute Σ , the mean across the entire dataset must first be computed. This is achieved with a first pass through the dataset, accumulating the sum from each ASIC (dimension) while also keeping track of the maximum, minimum, and number of entries N.
In a second pass through the dataset, the covariance matrix is accumulated by retrieving chunks of data by runs, performing the necessary centering and scaling, and then computing the outer product.
Figure A1. Averages from 100 patterns of classes for a run that was successfully classified. Such series of images were used to validate if the automatic classification by the class boundaries successfully classified the patterns into their expected class definitions as tabulated in Table 1. Colors cover the 5th to 95th percentile ADU in pattern.
Crystals 15 00734 g0a1
Figure A2. Averages from 100 patterns of classes for a run that was not successfully auto-classified. Residual signals can still be found in class 0 patterns, which should correspond to high-confidence blanks. Colors cover the 5th to 95th percentile ADU in pattern.
Crystals 15 00734 g0a2
Figure A3. Top 5 PCA components, ranked by their explained variance, for mean (above) and maximum (bottom) coarse-graining. The distribution of points for a single run ( N 10 6 ) is shown in Figure A4. The first three PCA mean modes appear to describe scattering rings, while the fourth and fifth appear to capture detector asymmetry at large scattering angles. The first two PCA maximum modes capture a similar scattering pattern, but the subsequent three suggest detector hotspots at high scattering angles co-occurring with the central scattering band.
Crystals 15 00734 g0a3
Figure A4. Pairwise log-density plots for distribution of patterns projected to the top 5 components for mean (A) and maximum (B) from one run ( N 10 6 ). These 5 components correspond to the modes shown in Figure A3.
Crystals 15 00734 g0a4

References

  1. Loh, N.D.; Hampton, C.Y.; Martin, A.V.; Starodub, D.; Sierra, R.G.; Barty, A.; Aquila, A.; Schulz, J.; Lomb, L.; Steinbrener, J.; et al. Fractal morphology, imaging and mass spectrometry of single aerosol particles in flight. Nature 2012, 486, 513–517. [Google Scholar] [CrossRef]
  2. Hantke, M.F.; Hasse, D.; Maia, F.R.N.C.; Ekeberg, T.; John, K.; Svenda, M.; Loh, N.D.; Martin, A.V.; Timneanu, N.; Larsson, D.S.D.; et al. High-throughput imaging of heterogeneous cell organelles with an X-ray laser. Nat. Photonics 2014, 8, 943–949. [Google Scholar] [CrossRef]
  3. Sellberg, J.A.; Huang, C.; McQueen, T.A.; Loh, N.D.; Laksmono, H.; Schlesinger, D.; Sierra, R.G.; Nordlund, D.; Hampton, C.Y.; Starodub, D.; et al. Ultrafast X-ray probing of water structure below the homogeneous ice nucleation temperature. Nature 2014, 510, 381–384. [Google Scholar] [CrossRef]
  4. Shen, Z.; Xavier, P.L.; Bean, R.; Bielecki, J.; Bergemann, M.; Daurer, B.J.; Ekeberg, T.; Estillore, A.D.; Fangohr, H.; Giewekemeyer, K.; et al. Resolving Nonequilibrium Shape Variations among Millions of Gold Nanoparticles. ACS Nano 2024, 18, 15576–15589. [Google Scholar] [CrossRef] [PubMed]
  5. Cramer, S.P. Free-Electron Lasers. In X-Ray Spectroscopy with Synchrotron Radiation; Springer International Publishing: Cham, Switzerland, 2020; pp. 295–310. [Google Scholar]
  6. Sobolev, E.; Zolotarev, S.; Giewekemeyer, K.; Bielecki, J.; Okamoto, K.; Reddy, H.K.N.; Andreasson, J.; Ayyer, K.; Barak, I.; Bari, S.; et al. Megahertz single-particle imaging at the European XFEL. Commun. Phys. 2020, 3, 97. [Google Scholar] [CrossRef]
  7. Ayyer, K.; Xavier, P.L.; Bielecki, J.; Shen, Z.; Daurer, B.J.; Samanta, A.K.; Awel, S.; Bean, R.; Barty, A.; Bergemann, M.; et al. 3D diffractive imaging of nanoparticle ensembles using an x-ray laser. Optica 2021, 8, 15–23. [Google Scholar] [CrossRef]
  8. Gallo, P.; Amann-Winkel, K.; Angell, C.A.; Anisimov, M.A.; Caupin, F.; Chakravarty, C.; Lascaris, E.; Loerting, T.; Panagiotopoulos, A.Z.; Russo, J.; et al. Water: A Tale of Two Liquids. Chem. Rev. 2016, 116, 7463–7500. [Google Scholar] [CrossRef]
  9. Pettersson, L.G.M.; Nilsson, A. The structure of water; from ambient to deeply supercooled. J. Non-Cryst. Solids 2015, 407, 399–417. [Google Scholar] [CrossRef]
  10. Nilsson, A.; Schreck, S.; Perakis, F.; Pettersson, L.G.M. Probing water with X-ray lasers. Adv. Phys. X 2016, 1, 226–245. [Google Scholar] [CrossRef]
  11. Gallo, P.; Stanley, H.E. Supercooled water reveals its secrets. Science 2017, 358, 1543–1544. [Google Scholar] [CrossRef]
  12. Pathak, H.; Späh, A.; Kim, K.H.; Tsironi, I.; Mariedahl, D.; Blanco, M.; Huotari, S.; Honkimäki, V.; Nilsson, A. Intermediate range O–O correlations in supercooled water down to 235 K. J. Chem. Phys. 2019, 150, 224506. [Google Scholar] [CrossRef] [PubMed]
  13. Chris Benmore, L.C.G.; Soignard, E. Intermediate range order in supercooled water. Mol. Phys. 2019, 117, 2470–2476. [Google Scholar] [CrossRef]
  14. Mason, B. The supercooling and nucleation of water. Adv. Phys. 1958, 7, 221–234. [Google Scholar] [CrossRef]
  15. Kalita, A.; Mrozek-McCourt, M.; Kaldawi, T.F.; Willmott, P.R.; Loh, N.D.; Marte, S.; Sierra, R.G.; Laksmono, H.; Koglin, J.E.; Hayes, M.J.; et al. Microstructure and crystal order during freezing of supercooled water drops. Nature 2023, 620, 557–561. [Google Scholar] [CrossRef]
  16. Esmaeildoost, N.; Jönsson, O.; McQueen, T.A.; Ladd-Parada, M.; Laksmono, H.; Loh, N.T.D.; Sellberg, J.A. Heterogeneous Ice Growth in Micron-Sized Water Droplets Due to Spontaneous Freezing. Crystals 2022, 12, 65. [Google Scholar] [CrossRef]
  17. Mancuso, A.P.; Aquila, A.; Batchelor, L.; Bean, R.J.; Bielecki, J.; Borchers, G.; Doerner, K.; Giewekemeyer, K.; Graceffa, R.; Kelsey, O.D.; et al. The Single Particles, Clusters and Biomolecules and Serial Femtosecond Crystallography instrument of the European XFEL: Initial installation. J. Synchrotron Radiat. 2019, 26, 660–676. [Google Scholar] [CrossRef]
  18. DePonte, D.P.; Weierstall, U.; Schmidt, K.; Warner, J.; Starodub, D.; Spence, J.C.H.; Doak, R.B. Gas dynamic virtual nozzle for generation of microscopic droplet streams. J. Phys. D Appl. Phys. 2008, 41, 195505. [Google Scholar] [CrossRef]
  19. Vakili, M.; Bielecki, J.; Knoška, J.; Otte, F.; Han, H.; Kloos, M.; Schubert, R.; Delmas, E.; Mills, G.; de Wijn, R.; et al. 3D printed devices and infrastructure for liquid sample delivery at the European XFEL. J. Synchrotron Radiat. 2022, 29, 331–346. [Google Scholar] [CrossRef]
  20. Henrich, B.; Becker, J.; Dinapoli, R.; Goettlicher, P.; Graafsma, H.; Hirsemann, H.; Klanner, R.; Krueger, H.; Mazzocco, R.; Mozzanica, A.; et al. The adaptive gain integrating pixel detector AGIPD a detector for the European XFEL. Nucl. Instrum. Methods Phys. Res. Sect. A Accel. Spectrometers Detect. Assoc. Equip. 2011, 633, S11–S14. [Google Scholar] [CrossRef]
  21. Mezza, D.; Allahgholi, A.; Arino-Estrada, G.; Bianco, L.; Delfs, A.; Dinapoli, R.; Goettlicher, P.; Graafsma, H.; Greiffenberg, D.; Hirsemann, H.; et al. Characterization of AGIPD1.0: The full scale chip. Nucl. Instrum. Methods Phys. Res. Sect. A Accel. Spectrometers Detect. Assoc. Equip. 2016, 838, 39–46. [Google Scholar] [CrossRef]
  22. Ayyer, K.; Lan, T.Y.; Elser, V.; Loh, N.D. Dragonfly: An implementation of the expand-maximize-compress algorithm for single-particle imaging. J. Appl. Crystallogr. 2016, 49, 1320–1335. [Google Scholar] [CrossRef]
  23. Loh, N.D.; Bogan, M.J.; Elser, V.; Barty, A.; Boutet, S.; Bajt, S.; Hajdu, J.; Ekeberg, T.; Maia, F.R.N.C.; Schulz, J.; et al. Cryptotomography: Reconstructing 3D Fourier Intensities from Randomly Oriented Single-Shot Diffraction Patterns. Phys. Rev. Lett. 2010, 104, 225501. [Google Scholar] [CrossRef]
  24. White, T.A.; Kirian, R.A.; Martin, A.V.; Aquila, A.; Nass, K.; Barty, A.; Chapman, H.N. CrystFEL: A software suite for snapshot serial crystallography. J. Appl. Crystallogr. 2012, 45, 335–341. [Google Scholar] [CrossRef]
  25. Jönsson, H.O.; Caleman, C.; Andreasson, J.; Tîmneanu, N. Hit detection in serial femtosecond crystallography using X-ray spectroscopy of plasma emission. IUCrJ 2017, 4, 778–784. [Google Scholar] [CrossRef]
  26. Liu, J.; van der Schot, G.; Engblom, S. Supervised classification methods for flash X-ray single particle diffraction imaging. Opt. Express 2019, 27, 3884–3899. [Google Scholar] [CrossRef] [PubMed]
  27. Rahmani, V.; Nawaz, S.; Pennicard, D.; Setty, S.P.R.; Graafsma, H. Data reduction for X-ray serial crystallography using machine learning. J. Appl. Crystallogr. 2023, 56, 200–213. [Google Scholar] [CrossRef] [PubMed]
  28. Galchenkova, M.; Tolstikova, A.; Klopprogge, B.; Sprenger, J.; Oberthuer, D.; Brehm, W.; White, T.A.; Barty, A.; Chapman, H.N.; Yefanov, O. Data reduction in protein serial crystallography. IUCrJ 2024, 11, 190–201. [Google Scholar] [CrossRef]
  29. Hadian-Jazi, M.; Messerschmidt, M.; Darmanin, C.; Giewekemeyer, K.; Mancuso, A.P.; Abbey, B. A peak-finding algorithm based on robust statistical analysis in serial crystallography. J. Appl. Crystallogr. 2017, 50, 1705–1715. [Google Scholar] [CrossRef]
  30. Maćkiewicz, A.; Ratajczak, W. Principal components analysis (PCA). Comput. Geosci. 1993, 19, 303–342. [Google Scholar] [CrossRef]
  31. Daurer, B.J.; Sala, S.; Hantke, M.F.; Reddy, H.K.N.; Bielecki, J.; Shen, Z.; Nettelblad, C.; Svenda, M.; Ekeberg, T.; Carini, G.A.; et al. Ptychographic wavefront characterization for single-particle imaging at x-ray lasers. Optica 2021, 8, 551–562. [Google Scholar] [CrossRef]
  32. McInnes, L.; Healy, J.; Melville, J. UMAP: Uniform Manifold Approximation and Projection for Dimension Reduction. arXiv 2020, arXiv:1802.03426. [Google Scholar] [CrossRef]
  33. Cruz-Chú, E.R.; Hosseinizadeh, A.; Mashayekhi, G.; Fung, R.; Ourmazd, A.; Schwander, P. Selecting XFEL single-particle snapshots by geometric machine learning. Struct. Dyn. 2021, 8, 014701. [Google Scholar] [CrossRef]
  34. Assalauova, D.; Ignatenko, A.; Isensee, F.; Trofimova, D.; Vartanyants, I.A. Classification of diffraction patterns using a convolutional neural network in single-particle-imaging experiments performed at X-ray free-electron lasers. J. Appl. Crystallogr. 2022, 55, 444. [Google Scholar] [CrossRef]
  35. Martin, A.V. Orientational order of liquids and glasses via fluctuation diffraction. IUCrJ 2017, 4, 24–36. [Google Scholar] [CrossRef]
  36. Mahajan, M.; Nimbhorkar, P.; Varadarajan, K. The planar k-means problem is NP-hard. Theoret. Comput. Sci. 2012, 442, 13–21. [Google Scholar] [CrossRef]
  37. Schlesinger, D.; Sellberg, J.A.; Nilsson, A.; Pettersson, L.G.M. Evaporative cooling of microscopic water droplets in vacuo: Molecular dynamics simulations and kinetic gas theory. J. Chem. Phys. 2016, 144. [Google Scholar] [CrossRef] [PubMed]
  38. Robinson, I.K. Crystal truncation rods and surface roughness. Phys. Rev. B 1986, 33, 3830–3836. [Google Scholar] [CrossRef] [PubMed]
  39. Murphy, K.P. Probabilistic Machine Learning: An introduction; MIT Press: 2022. Available online: http://probml.github.io/book1 (accessed on 14 August 2025).
Figure 1. (Top row) Simplified schematic of the experiment at the SPB/SFX beamline at the European XFEL (EuXFEL). We serially interrogated single water droplets of different temperatures and sizes by adjusting the vertical displacement of the nozzle and the droplet size. (Bottom row) Exemplary patterns on the AGIPD detector showcase the variety of diffraction features of extended shape transforms of small truncated ice crystals that are growing in water droplets.
Crystals 15 00734 g001
Figure 2. Examples of different classes of patterns (columns) at different levels of mean coarse-graining (rows). Whereas these classes are evident with mean-features at both the ASIC level and sub-ASIC level, discriminating details are much better preserved with the latter. Colors range from 10th to 90th percentile ADU in pattern.
Crystals 15 00734 g002
Figure 3. Effects of coarse-graining a pattern with strong ice scattering and very weak liquid water scattering. We coarse-grain the mean-features (top row) and max-features (bottom row) of this pattern either at the sub-ASIC level (middle column) or the ASIC level (right column). For sub-ASIC coarse-graining, details of the crystal shape/size transforms can still be observed. Upon further coarse-graining to the ASIC level, only the presence of ice scattering can be determined. The max-features are more sensitive to the presence of crystallinity, while the mean-features are more attuned to broader scattering features of liquid water. Colors range from 5th to 95th percentile ADU in pattern.
Crystals 15 00734 g003
Figure 4. Results of principal component analysis (PCA). (A): Normalized explained variance ratios (Appendix A) λ for mean (blue) and maximum (red) features for all 5.6 × 10 8 patterns. This variance rapidly falls off within the first ten principal components, indicating that most feature covariations can be captured within the first ten PCA modes. Distribution of PCA mean-feature (B) and max-feature (C) weights for the first two components across one run. The first two principal components of the mean-features (D,E) and max-features (F,G).
Crystals 15 00734 g004
Figure 5. Distribution of patterns from two experiment runs based on two outlier statistics (see axis labels). The high-confidence blanks are defined by signal limits (average of 0.2 photons and maximum of 3 photons per ASIC), which are demarcated by red dashed lines. Boundaries for classification were guided by separating dense clusters of patterns with similar combinations of outlier statistics.
Crystals 15 00734 g005
Figure 6. (A): UMAP embedding from one run (≈ 10 6 patterns), colored by the assigned class from classification. (B): Automated re-labeling of the patterns in the UMAP embedding with DBSCAN. The large cluster dominated by the blank class (red in (A)) is re-categorized as a new set of blanks (dark blue in (B)), while all other hits were treated as hits (pink in (B)).
Crystals 15 00734 g006
Figure 7. Hit–miss binary classification from DBSCAN clustering in the UMAP embedding, individually plotted as a function of the patterns’ outlier statistics.
Crystals 15 00734 g007
Figure 8. One-dimensional (1D) fluence-normalized profiles, averaged from 100 ice-rich class 6 patterns alongside their respective 2D average diffraction patterns. In the warmest configuration ((A), 12 μ m droplets, 25 m m nozzle distance), there is still significant diffuse liquid scattering that can be observed on top of the ice. For colder and smaller droplets ((B), 5 μ m droplets, 45 m m nozzle distance and (C), 5 μ m droplets, 60 m m nozzle distance), there is no longer a significant liquid scattering signal, revealing crystalline shape transforms that are convolved upon the hexagonal ice Bragg peaks. Miller indices of hexagonal ice are indicated in the figures (red in 1D profile; white in 2D patterns). Two-dimensional patterns are rendered with a dynamic range spanning from 5th to 95th percentile of ADU values.
Crystals 15 00734 g008
Figure 9. One-dimensional (1D) profiles, averaged from 100 water-rich class 4 patterns. (A): Beam fluence-normalized profiles show that the 12 μ m droplets are approximately twice as bright as 5 μ m droplets as the volume illuminated by the X-ray pulse scales approximately linearly with droplet radius. (B): Beam fluence-normalized profiles rescaled to the first intensity maximum near 1.9/Å−1. In this rescaling, the differences in profile shape are easier to compare. The observed peak shifts near 1.9/Å−1 and 3.0/Å−1 are consistent with earlier published results, and most prominent for the first peak compared to the second.
Crystals 15 00734 g009
Table 1. Representing 454,775,678 patterns across 440 runs that were automatically labeled according to the decision boundaries in Figure 5. The signal thresholds for both max-feature and mean-feature in each class are also included. Fewer than 0.01% of the patterns did not fall into these seven classes.
Class LabelNum. PatternsMean Limits (Photons)Max Limits (Photons)Interpretation
04.21 × 10⁸ (92.69%)[10−5, 0.17][0.1, 3.4]blanks (high-confidence)
14.32 × 10⁶ (0.98%)[10−5, 0.17][3.4, 10.8]blanks with high thermal noise
21.75 × 10⁷ (3.80%)[10−5, 0.17][10.8, 17.0]blanks (hot pixels activated)
32.62 × 10⁵ (0.06%)[10−5, 0.17][17.0, 107.5]weak hits
45.01 × 10⁶ (1.12%)[0.17, 1075][1.9, 10.8]strong liquid water hits
55.94 × 10⁶ (1.28%)[0.17, 1075][10.8, 108]liquid water and ice hits
62.61 × 10⁵ (0.06%)[0.01, 1075][108, 10800]strong ice hits
Table 2. Hit-finding confusion matrix between classification by UMAP-DBSCAN and outlier statistics for two characteristic runs. Classes from outlier statistics were binarized by setting classes 1 to 6 as hits and class 0 as blanks to compare with the binary classification found with unsupervised learning.
Hit (Outlier Statistics)Miss (Outlier Statistics)
Hit (UMAP-DBSCAN)2.86 × 10⁴, 2.21%9.31 × 10³, 0.72%
Miss (UMAP-DBSCAN)1.67 × 10⁴, 1.29%1.24 × 10⁶, 95.79%
Disclaimer/Publisher’s Note: The statements, opinions and data contained in all publications are solely those of the individual author(s) and contributor(s) and not of MDPI and/or the editor(s). MDPI and/or the editor(s) disclaim responsibility for any injury to people or property resulting from any ideas, methods, instructions or products referred to in the content.