This section presents the experimental findings, including the OSL dose–response behavior of quartz samples, their reusability under repeated irradiation cycles, and the predictive performance of the developed ANN models. The results are discussed in the context of luminescence mechanisms and ANN-based approaches that capture the relationship between absorbed dose and luminescence intensity, providing accurate predictions relevant to dosimetric applications.
3.1. OSL Dose–Response
The OSL decay curve represents the time-dependent luminescence emitted as trapped charge carriers are released from energy traps within the crystal lattice under optical stimulation, providing a direct relationship between the measured luminescence intensity and the absorbed radiation dose [
1,
7]. This dose–response behavior enables a detailed characterization of the trapping and recombination processes [
19] and is crucial for precise dose estimation and retrospective dosimetry in both geological and synthetic materials [
6,
20].
In this study, systematic dose–response experiments were conducted on quartz samples using the OSL method over a wide dose interval ranging from 0.1 Gy to 1034.9 Gy. For each dose point, the samples were irradiated with a calibrated beta source, preheated to remove unstable signal components, and subsequently stimulated under controlled conditions using blue LEDs to record the corresponding OSL decay curves. The OSL decay curves recorded as a function of absorbed dose are shown in
Figure 1, plotted as OSL intensity versus time on both linear and log–log scales to demonstrate the signal behavior more clearly.
Figure 1a,b illustrate the OSL decay curves of the quartz samples plotted as a function of time for various radiation dose values ranging from 0.1 Gy to 1034.9 Gy. As shown in
Figure 1a,b, the overall shape of the OSL decay curves remains consistent across different doses (exponential decay curves), whereas the initial OSL intensities systematically increase with increasing absorbed dose. This increase in OSL signal with dose is a well-documented behavior in the literature and is mainly attributed to the higher population of charge carriers trapped in luminescence centers (electron traps) as the irradiation dose increases [
1,
8,
21]. This dose–response relationship is generally linear over low-to-moderate dose ranges but may exhibit supralinearity or saturation at higher doses due to limitations in trap filling or recombination mechanisms [
22,
23]. Studies have shown that quartz and other silicate minerals demonstrate a predictable increase in OSL intensity with increasing dose, making them suitable for dosimetric applications in geological and archeological contexts [
6,
19]. The proportional growth in OSL intensity with dose reflects the larger number of trapped electrons that are released during optical stimulation, emitting luminescence as they recombine [
21,
24].
The initial OSL intensities as a function of the corresponding ionizing radiation dose are shown on a log–log scale in
Figure 2. Each data point represents the mean initial OSL value measured from five identical aliquots mounted on rimmed stainless-steel disks, with error bars indicating the standard deviation of the replicate measurements.
The dose–response behavior of the quartz samples, as presented in
Figure 2, demonstrates that the initial OSL intensities increase proportionally with the absorbed beta dose up to approximately 10 Gy, indicating a well-defined linear region suitable for precise dosimetric and dating applications [
1,
4,
8]. This linearity at low-to-moderate doses is consistent with previous studies on quartz OSL properties, which have shown that the intensity of the fast OSL component increases linearly with dose due to the steady accumulation of charge carriers in stable traps [
6]. Beyond about 20 Gy, the data points gradually deviate from the extrapolated linear trend and begin to fall below it, indicating the onset of a sublinear region. It is worth noting that the dose–response behavior observed in this study displays a relatively extended linear range up to approximately 20 Gy before entering a sublinear growth region. Although some quartz samples in the literature are reported to reach saturation at significantly lower doses, or even show signal reduction at high doses due to competition among trapping and recombination centers, the quartz used in this study exhibited stable and gradual signal growth up to several hundred Gray. This variation is consistent with findings by Feathers and Pagonis (2015) [
25], who emphasized the role of different bleaching components and their interactions in determining the saturation characteristics of quartz OSL signals. This sublinear behavior is attributed to the progressive filling of available traps and recombination centers, which limits the further accumulation of trapped charge carriers and thus reduces the growth rate of the luminescence signal [
19,
22]. Similar sublinear trends have been widely reported in quartz OSL studies, confirming that saturation effects and trap competition can occur at higher doses [
23,
26]. No significant supralinearity was observed in the dose range analyzed, suggesting that no additional deeper or new traps are activated under these irradiation conditions [
6]. Overall, this response supports the suitability of the studied quartz samples for reliable OSL dosimetry and dating within the low-to-moderate dose range, which is a key requirement for retrospective dosimetric applications in geology and archeology [
19,
23,
27].
3.2. Reusability
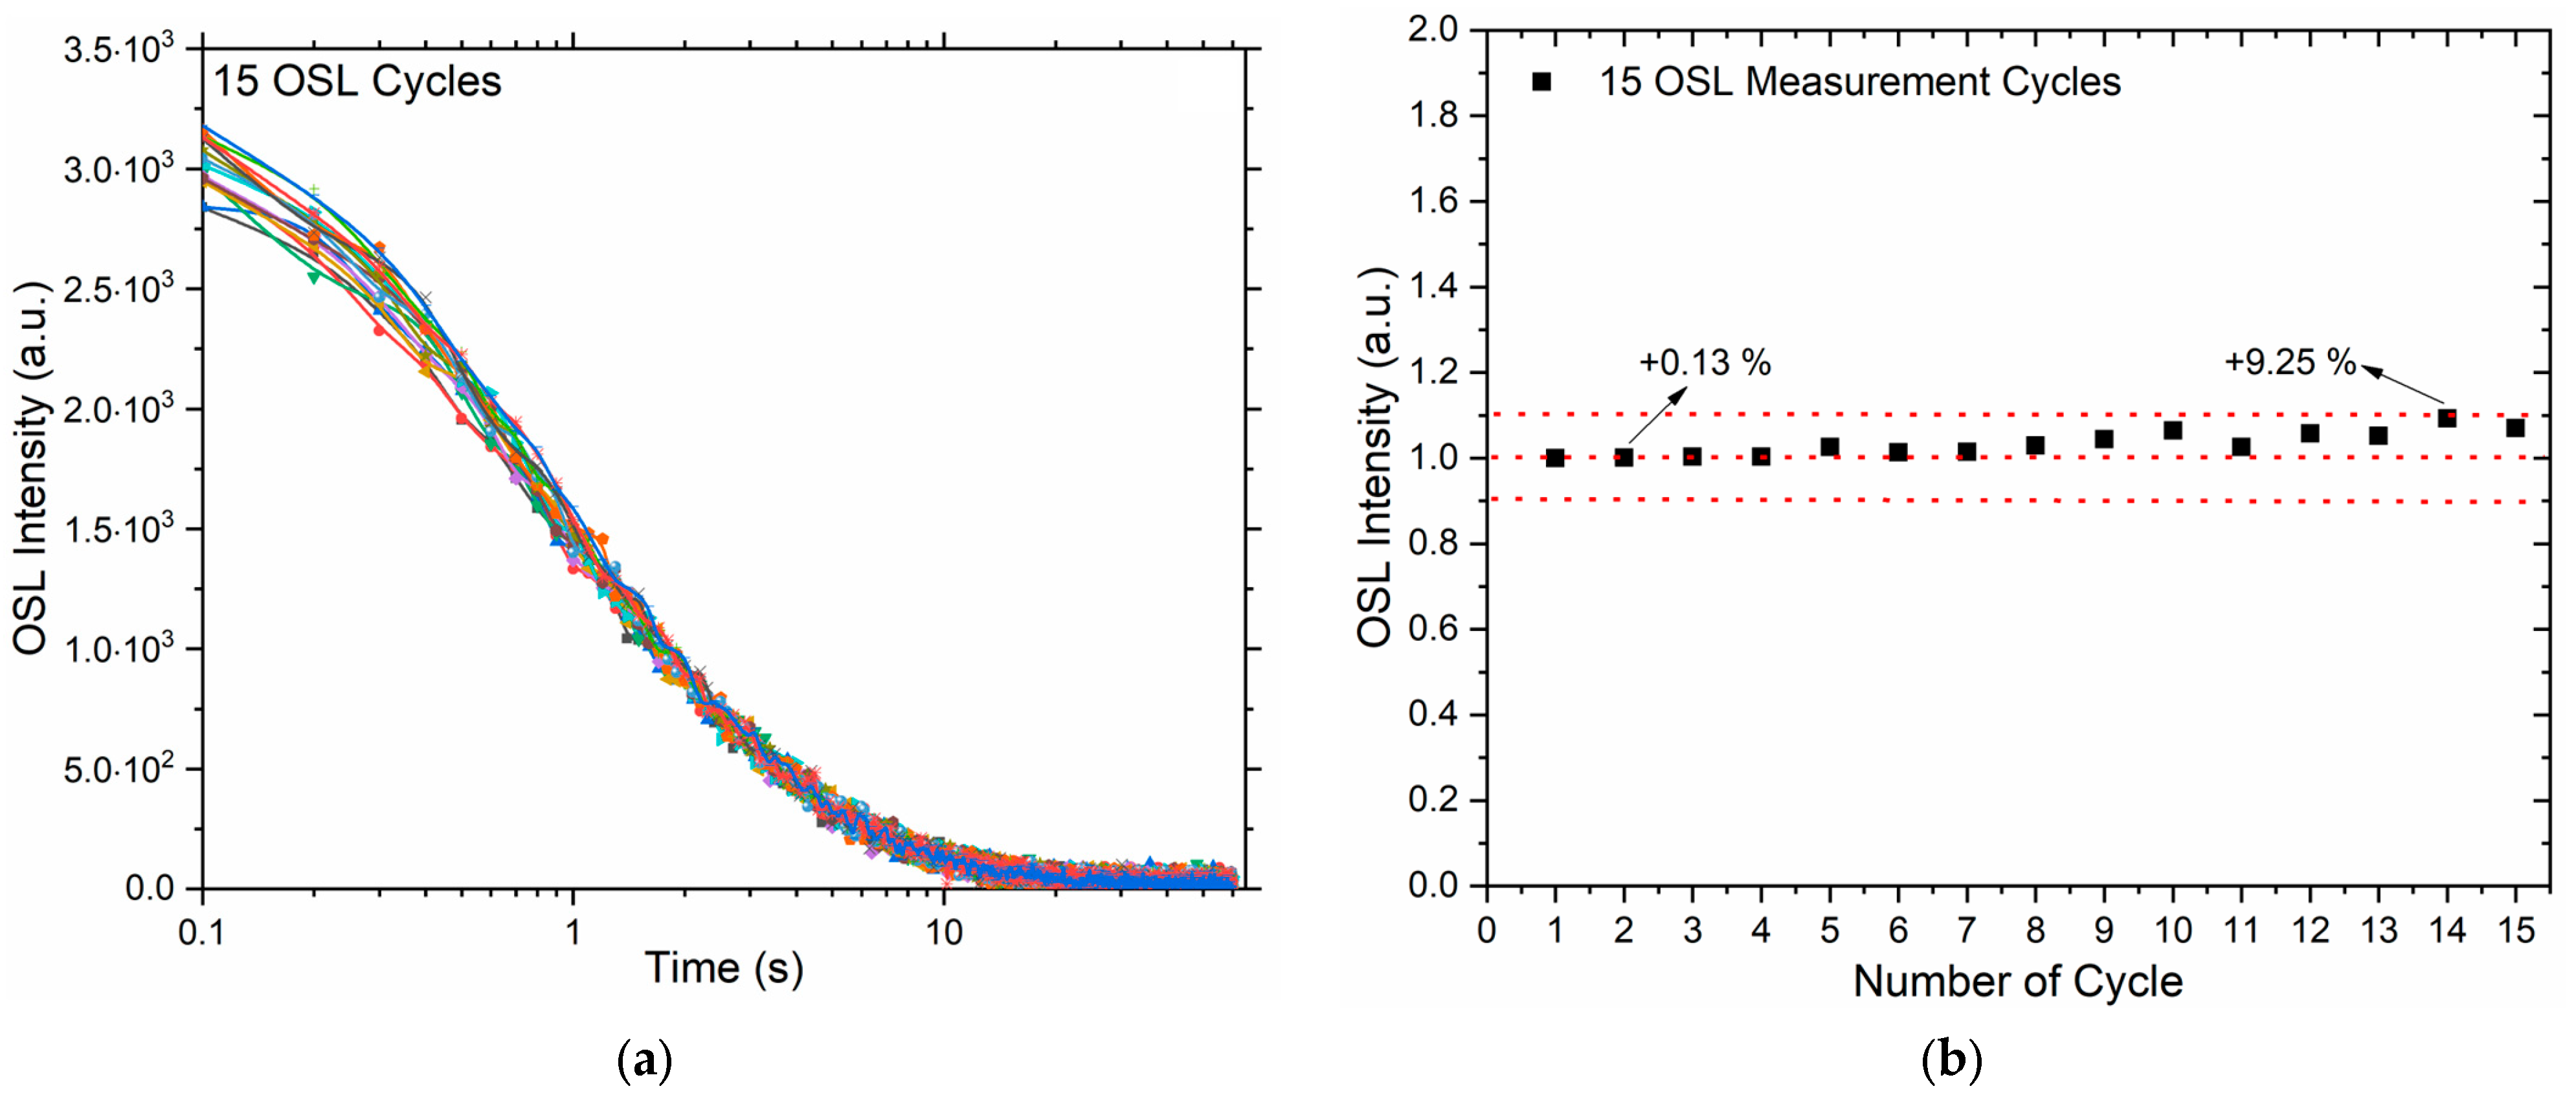
Reusability is a fundamental requirement for any reliable OSL dosimeter material. A quartz sample cannot be considered suitable for practical dosimetric applications if its OSL sensitivity changes significantly with repeated irradiation and readout cycles. In this study, the reusability of the quartz samples was thoroughly evaluated under controlled laboratory conditions. Prepared aliquots were repeatedly irradiated with a fixed 10 Gy test dose using a beta source, then quickly cooled to room temperature and read out using identical preheat and optical stimulation protocols for each cycle. This irradiation–readout sequence was repeated for a total of 15 cycles while keeping all other experimental parameters constant. The relationship between the OSL intensity and the number of reuse cycles obtained from these measurements is presented in
Figure 3.
Figure 3a shows the OSL decay curves recorded during each measurement cycle, plotted as OSL intensity versus time. The curves exhibit consistent exponential decay behavior across all cycles, with no significant variation in the overall shape or decay rate.
This behavior is in agreement with many studies showing the high reproducibility of quartz OSL lifetime determinations under repeated isothermal decay and dose recovery experiments.
Buylaert et al. demonstrated that isothermal decay and dose recovery protocols yield highly reproducible quartz OSL lifetimes, supporting signal stability [
28]. Similarly, Preusser et al. analyzed variations in OSL sensitivity across dose ranges and highlighted consistent behavior in quartz samples, reinforcing their suitability for dose estimation and repeated usage [
21].
Figure 3b summarizes the relationship between the normalized initial OSL intensities and the number of reuse cycles. The plot shows that the OSL signal intensity remains remarkably stable over 15 cycles, with the maximum observed deviation being approximately 9.25% relative to the initial measurement. This minor variation is within acceptable experimental uncertainty and further confirms the excellent reusability of the quartz samples for multiple OSL measurements. Previous studies by Truscott et al. [
29] and McKeever et al. [
30] have similarly reported that natural quartz can maintain stable OSL sensitivity across repeated cycles when consistent preheat and stimulation conditions are applied.
Taken together, these results demonstrate that the tested quartz samples exhibit excellent reusability under repeated irradiation and readout, supporting their suitability for retrospective dosimetry, dose recovery experiments, and routine quality control in luminescence dating applications.
3.3. Artificial Neural Network (ANN)
OSL measurements require the accurate modeling of dose–response relationships to characterize the behavior of materials exposed to varying levels of ionizing radiation. Quartz is widely studied in various scientific fields, including dosimetric applications, geological dating, and archeological research, due to its ability to store radiation energy and its stable luminescence properties. Understanding and modeling the general behavior of the OSL decay curves recorded in response to absorbed radiation doses is therefore crucial for reliable dose estimation. In this study, an artificial neural network (ANN) model was developed to predict the OSL decay curves of quartz samples using varying beta radiation dose values as input. The input dataset consisted of 45 distinct radiation dose values, and each corresponding output dataset was represented by an OSL decay curve comprising 200 data points. Prior to training, all data were preprocessed and normalized using min–max scaling to ensure stable convergence. The normalized dataset was then divided into training (70%), validation (15%), and testing (15%) subsets using a stratified partitioning technique to ensure representative sampling across the full dose range. The ANN architecture, as shown in
Figure 4, was designed with an input layer containing one neuron to receive the radiation dose, a hidden layer with ten neurons to capture non-linear relationships, and an output layer of two hundred neurons corresponding to the OSL decay curve points. The entire model was developed and implemented using the Deep Learning Toolbox 23.2 (with Neural Net Fitting app) in MATLAB 2023b for data preparation, training, and performance evaluation.
In this study, the prediction performance of ANN models developed using three different training algorithms—Levenberg–Marquardt (LM), Bayesian Regularization (BR), and Scaled Conjugate Gradient (SCG)—was systematically investigated to estimate the OSL decay curves of quartz samples. To ensure sufficient convergence and performance stability, the training process was carried out with a maximum of 1000 epochs. The comparative evaluation was based on three main criteria: (i) the performance trends illustrated by the training–validation–test mean squared error (MSE) plots, (ii) the regression analysis results including correlation coefficients (R values), and (iii) the accuracy of the predicted OSL decay curves at three representative dose levels: low (1 Gy), medium (72.4 Gy), and high (465.7 Gy).
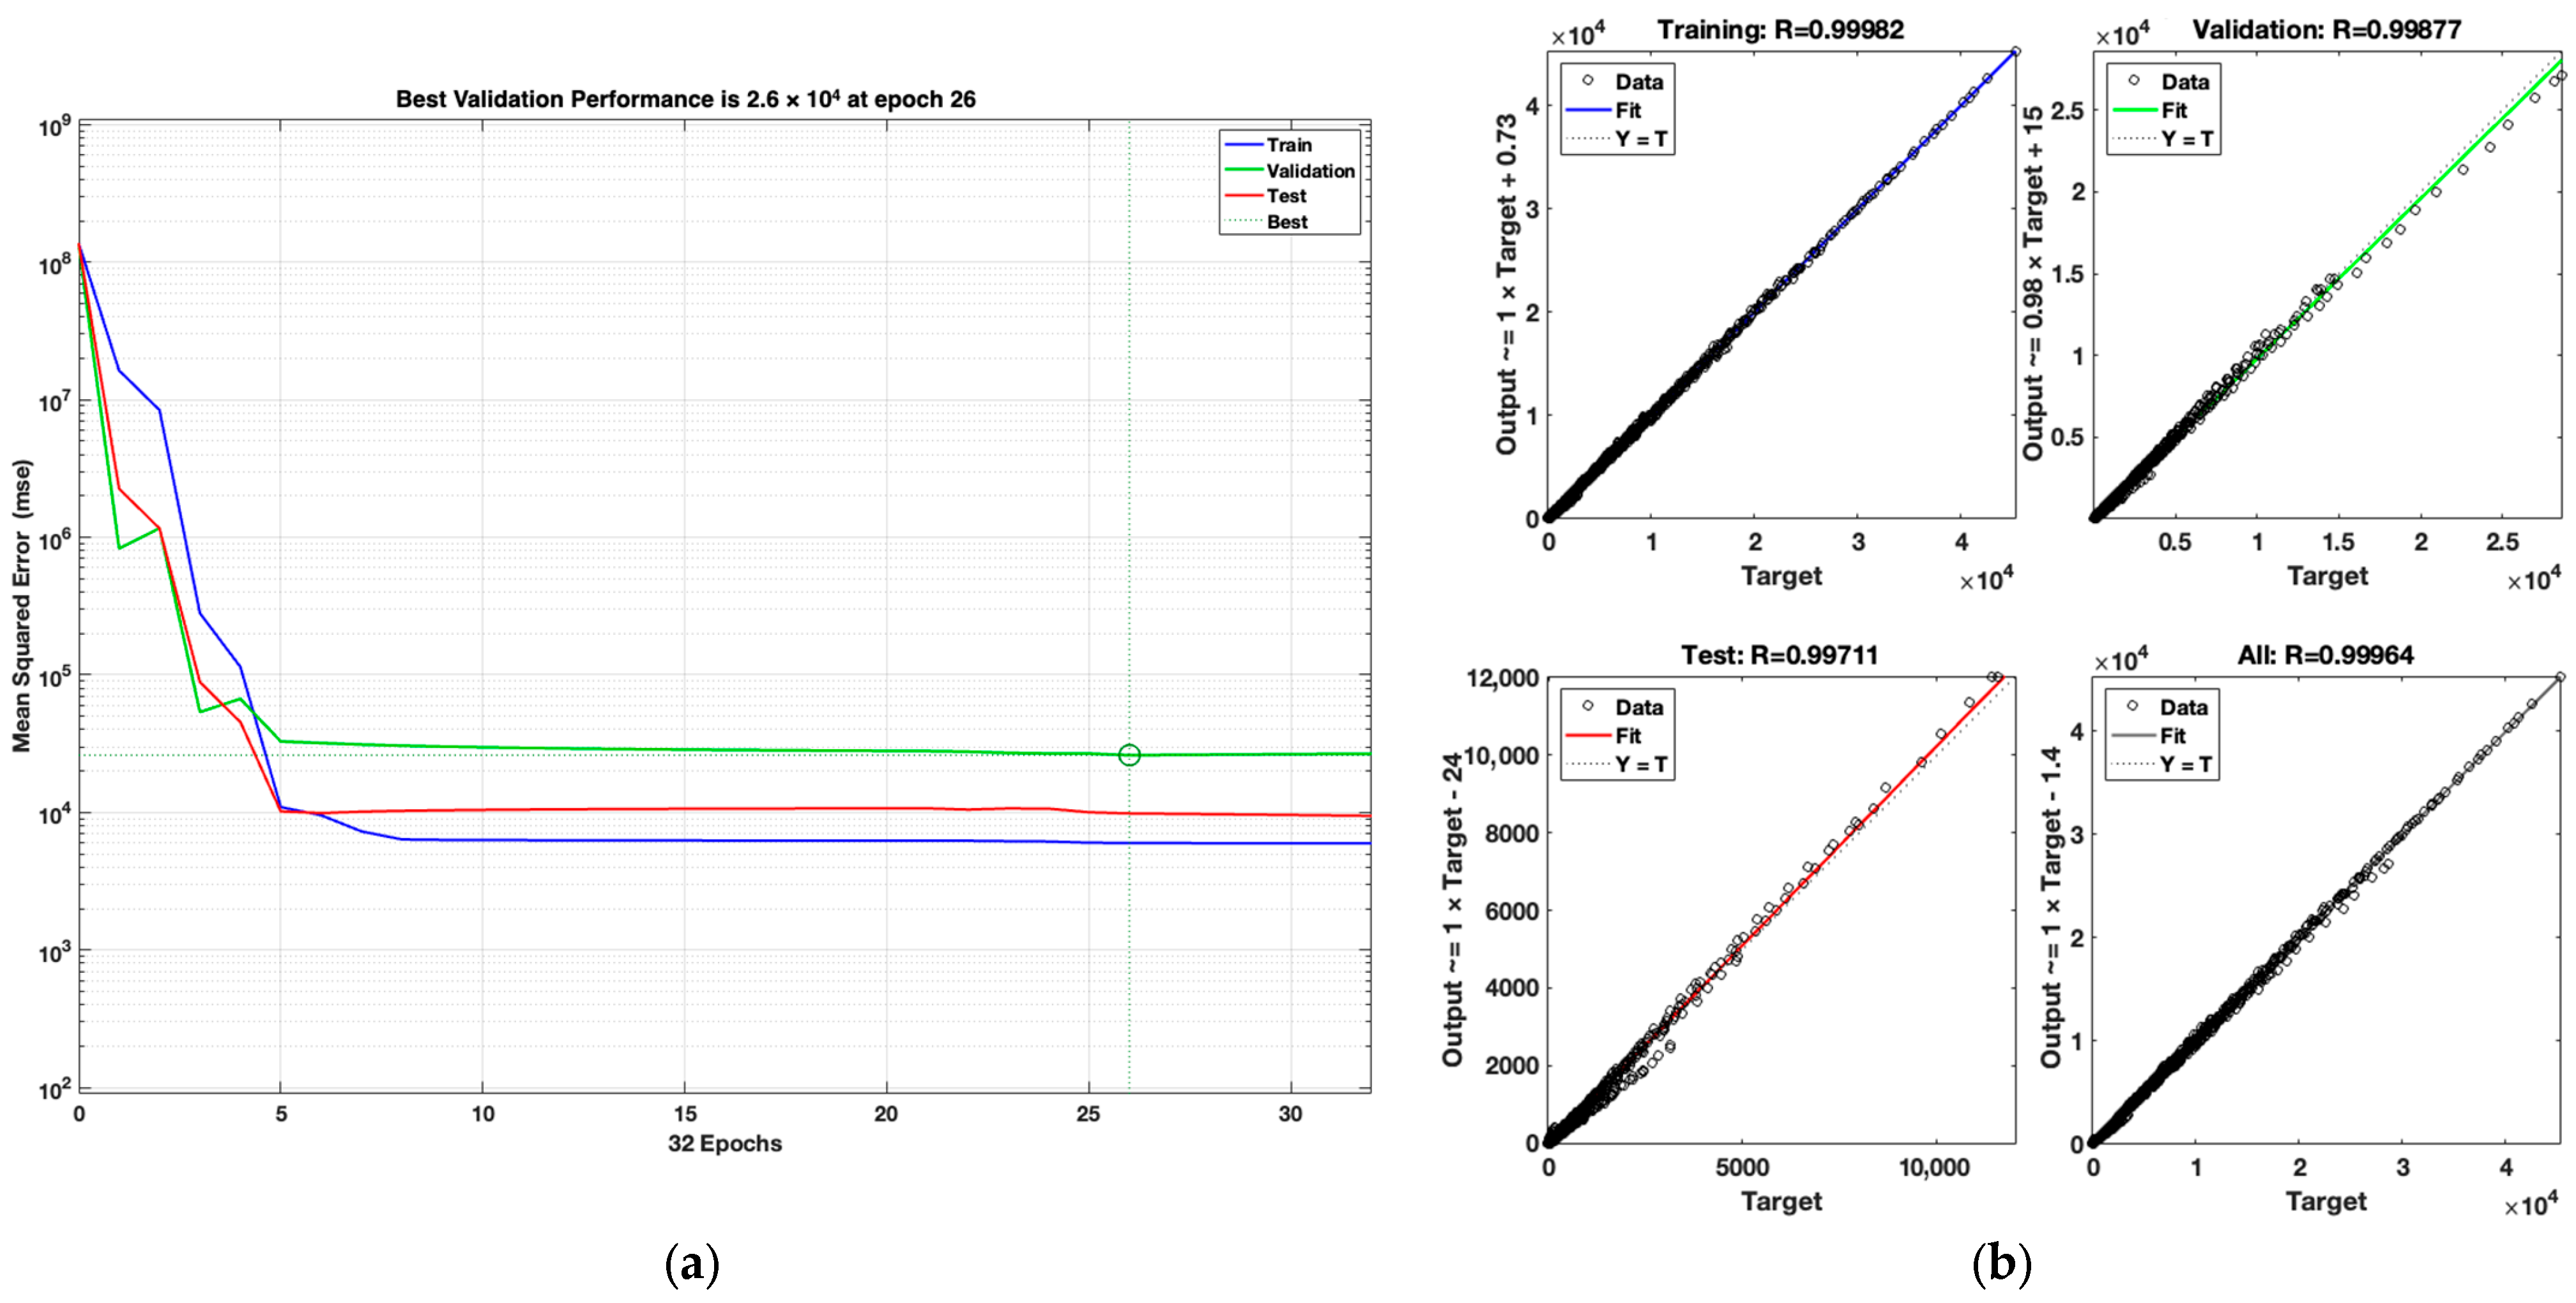
Figure 5 shows the performance of the LM optimization algorithm’s simulation and regression results.
The performance plot for the LM algorithm shows that the MSE rapidly decreases within the first few epochs and reaches its minimum validation value of 26,048.34 at epoch 26. After this point, the training, validation, and test curves remain nearly parallel, indicating that the model does not suffer from overfitting. The regression results demonstrate high prediction accuracy with correlation coefficients of R = 0.99982 (training), R = 0.99877 (validation), R = 0.99711 (test), and R = 0.99964 (overall).
Figure 6 shows the performance of the BR optimization algorithm’s simulation and the results of its regression.
The BR algorithm demonstrates robust generalization capability with a longer training time, reaching its best training MSE of 1477.85 at epoch 921. The regression results indicate excellent model fit with R = 0.99995 (training), R = 0.99974 (test), and R = 0.99994 (overall), verifying that BR effectively minimizes overfitting.
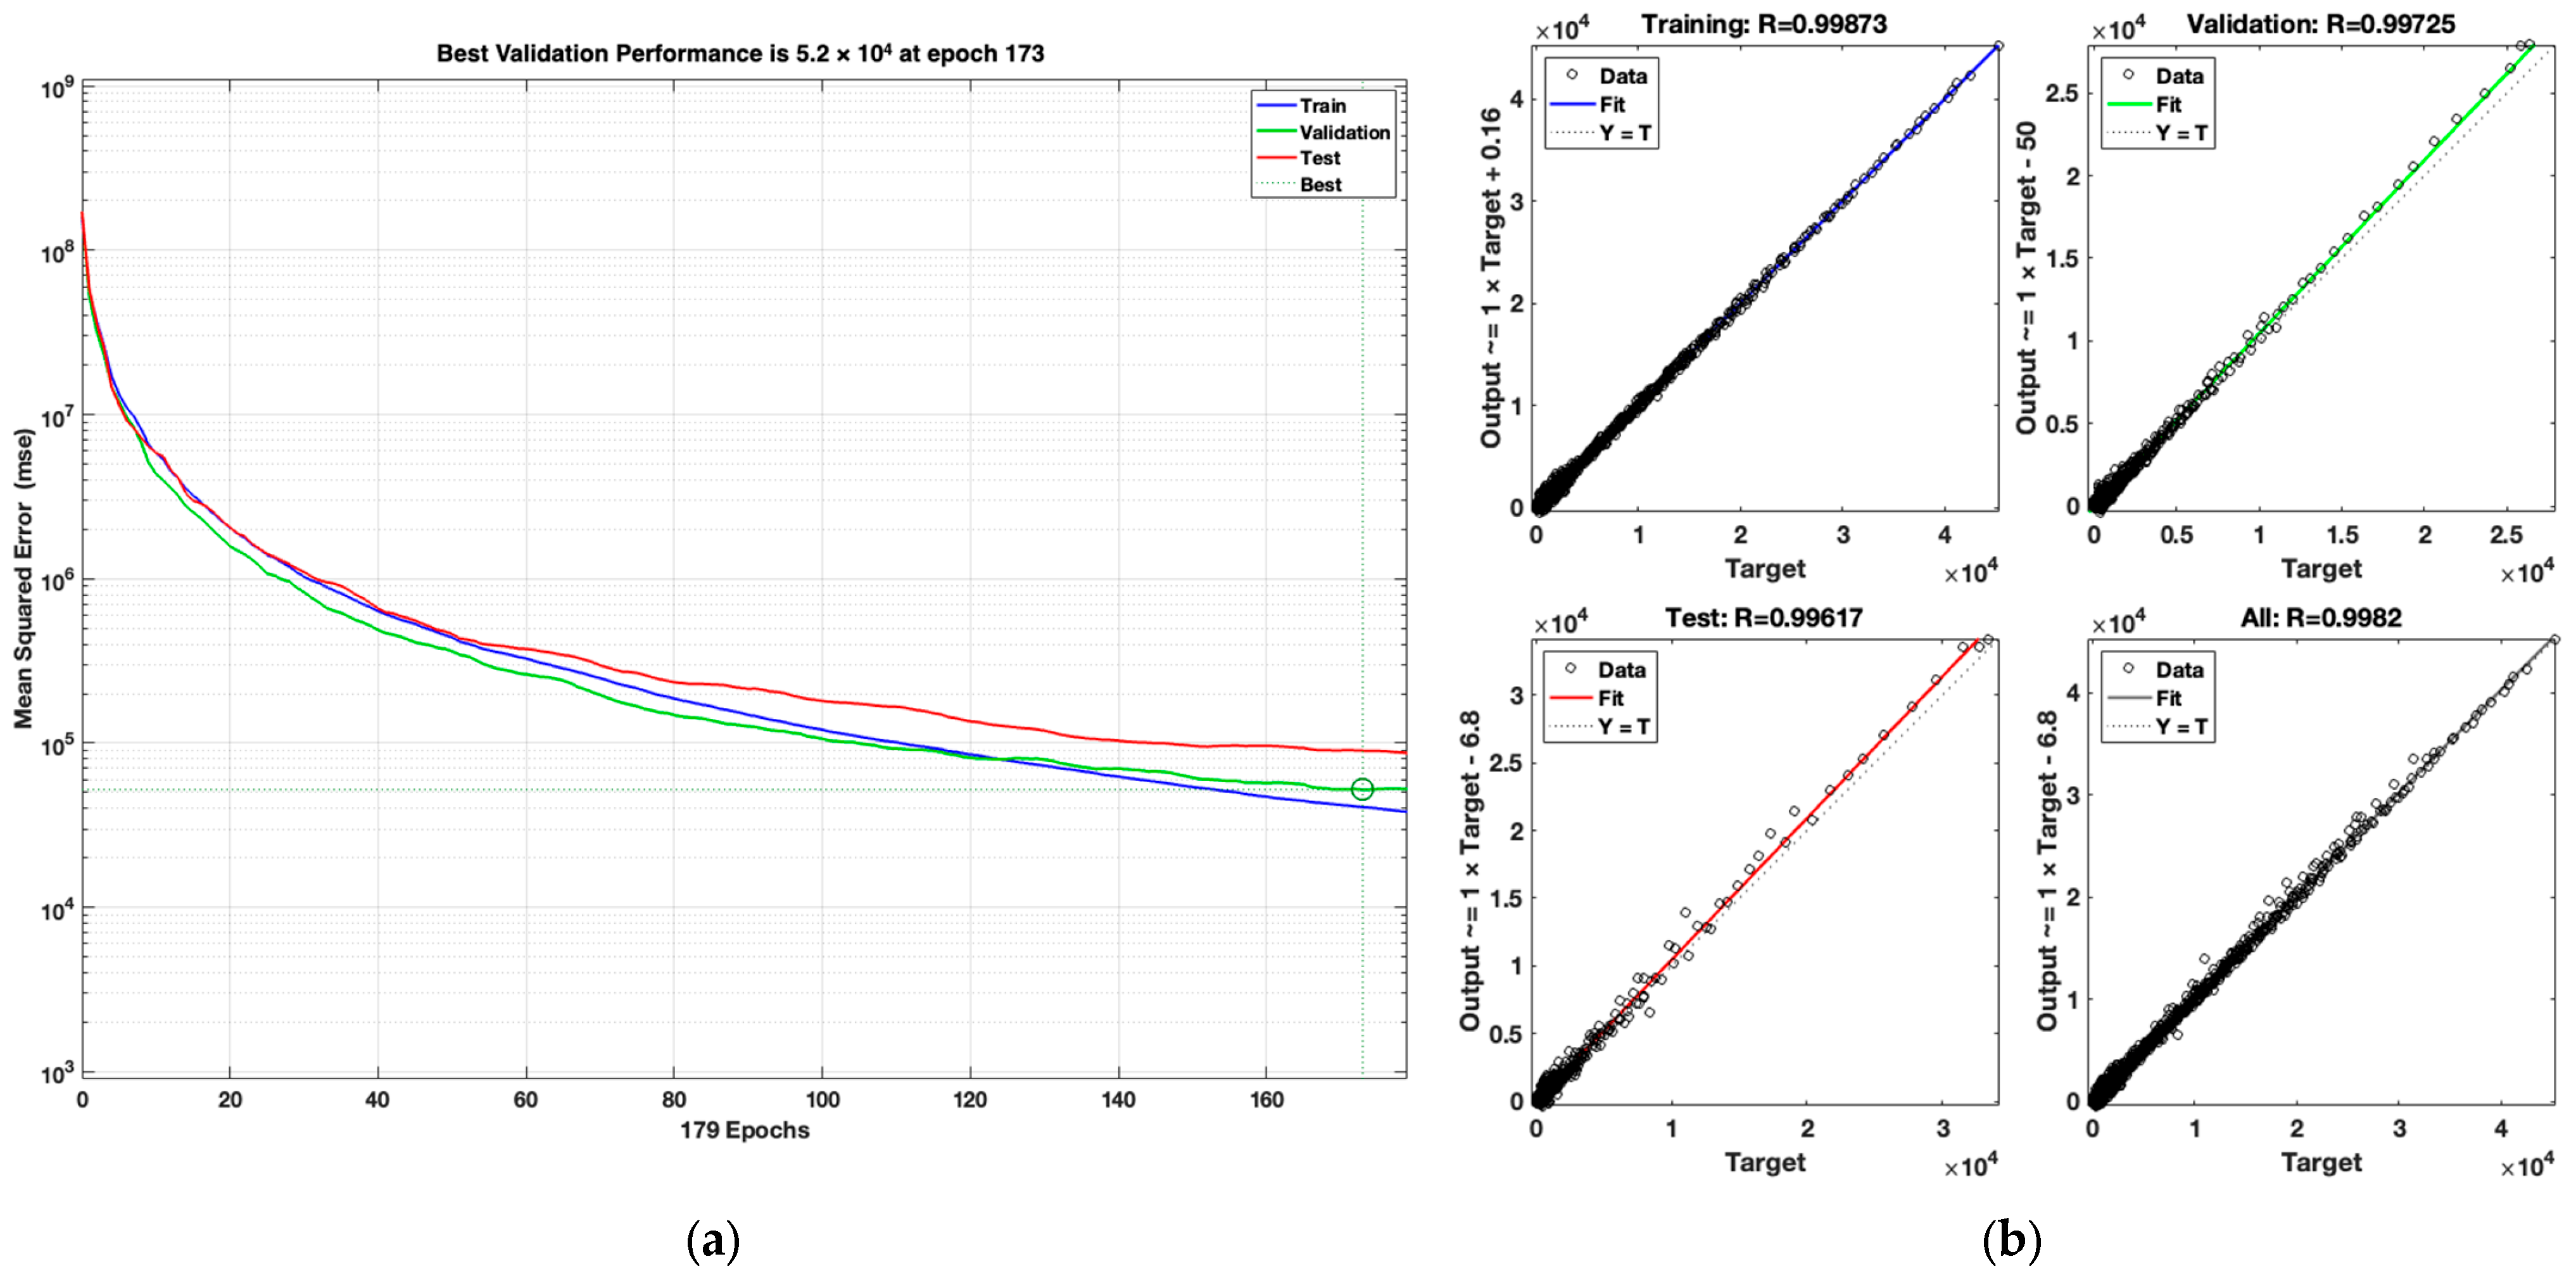
Figure 7 shows the performance of the SCG optimization algorithm’s simulation and the results of its regression.
The SCG performance plot reveals slower convergence than LM, with the best validation MSE of 51,979.40 obtained at epoch 173. The R values are slightly lower than those for LM and BR, with R = 0.99873 (training), R = 0.99725 (validation), R = 0.99617 (test), and R = 0.9982 (overall).
In this part of the study, comparisons are presented between the experimentally obtained OSL decay curves and those generated by the ANN model for three different radiation doses—low (1 Gy), medium (72.4 Gy), and high (465.7 Gy)—which were not used during the training of the LM, BR, and SCG algorithms.
Figure 8 presents a set of semi-logarithmic plots comparing the experimentally obtained OSL decay curves of quartz irradiated with 1, 72.4, and 465.7 Gy radiation doses and those generated by the ANN model optimized using the LM, BR, and SCG algorithms, with time plotted on a logarithmic x-axis and OSL intensity on a linear y-axis.
In the low-dose comparison (1 Gy), the LM algorithm’s predicted curve generally follows the experimental curve but exhibits slightly more deviation compared to BR, particularly in the late decay region. For the medium dose (72.4 Gy), LM achieves excellent alignment with the experimental decay curve, accurately capturing both the initial intensity and the tailing portion. However, in the high-dose range (465.7 Gy), the LM prediction shows minor mismatches at the initial high-intensity region, suggesting that local minima might limit its prediction accuracy for complex high-dose behavior. Overall, LM is most effective for low-to-moderate dose ranges due to its fast convergence and high accuracy.
For the low dose (1 Gy), the BR-predicted curve closely matches the experimental decay curve and shows better fit than LM and SCG, especially in the tailing region. In the medium dose (72.4 Gy), BR performs almost identically to LM, achieving near-perfect agreement with the experimental data. For the high dose (465.7 Gy), BR outperforms LM and SCG, providing smoother predictions and maintaining closer alignment with the initial high-intensity region. This confirms that the BR algorithm’s strong regularization capability enhances its reliability when modeling complex and noisy luminescence data.
For the low dose (1 Gy), the SCG predictions show greater scatter and higher noise, deviating from the experimental decay behavior, especially in the later part of the curve. In the medium dose (72.4 Gy), SCG produces reliable results, closely following the experimental curve and matching the performance of LM and BR. At the high dose (465.7 Gy), SCG provides acceptable predictions but slightly underperforms BR, especially in modeling the steep initial decay region. These results confirm that SCG offers balanced but relatively slower convergence and may be more sensitive to local variations at extreme dose levels.
The combined results indicate the following.
For low-dose conditions (1 Gy), the BR algorithm provides the most accurate fit to experimental data, benefiting from its inherent overfitting control and robust generalization. For the medium-dose range (72.4 Gy), all three algorithms deliver highly reliable predictions with minimal discrepancies, with LM and BR producing almost identical results. In the high-dose range (465.7 Gy), BR maintains superior prediction accuracy, LM shows acceptable performance with minor deviations, and SCG yields reasonable but slightly noisier outputs. Therefore, the BR algorithm is recommended for applications where dose levels span a wide and complex range and where noise minimization is critical. LM remains an effective option for rapid and accurate modeling at low-to-moderate doses due to its faster convergence. SCG provides balanced performance with relatively stable generalization but requires careful parameter tuning for extreme dose conditions.
These observations are consistent with findings in the literature: LM’s efficiency in moderate-sized feedforward networks has been widely reported [
16], BR’s strong generalization and regularization have been confirmed for noisy datasets [
31], and SCG has been noted for its computational efficiency and acceptable accuracy in large-scale problems [
18].


