Abstract
Three-dimensional cementitious material printing (3DCMP) enables structures with complex geometry to be fabricated. Printed filament quality is significantly affected by the mass distribution at its corners. Although fruitful results have been obtained, a significant gap exists in systematically investigating the impact of comprehensive parameters on this mass distribution. Therefore, the cross-section ratio Φ (Φ = So/Su) of the filament is proposed as a measurement to evaluate the mass distribution at corners. Then, the impacts of printing process parameters, including the tool path radius R, nozzle aspect ratio φ, and relative nozzle travel speed ζ, on the filament mass distribution are investigated using computational fluid dynamics (CFD). The flow mechanism is elaborated using CFD for cementitious material printing at corners. It was found that the material flow mechanism caused by the combined effects of the printing process parameters affects the filament mass distribution significantly. Some material spills out from the overfilled zone to the underfilled zone during the deposition process. Additionally, printing process windows were identified to ensure acceptable printing quality using a support vector machine (SVM). A new printing window is identified using transfer learning, which can save data resources compared to the SVM method. Finally, the experimental results show the feasibility and effectiveness of the proposed methods in printing process window determination.
1. Introduction
Three-dimensional cementitious material printing (3DCMP) has become an emerging manufacturing technology over the past few years due to its various advantages. The effective use of material, reducing construction waste, and being less reliant on the workforce are some of its benefits [1,2,3,4,5]. Earlier research works have focused mainly on the exploration of different printable construction materials, such as plain material [6,7,8,9] and fibre-reinforced material [10,11,12]. Clay was used by Panda to improve material printability [13,14]. Ting investigated the impact of a recycled glass gradation on material properties and buildability [15]. The material properties and printed sample mechanical properties have been investigated by integrating geopolymer into the printing material [16,17,18]. Alkali reactions on 3D-printable geopolymer concrete were studied by Muthukrishnan. However, the recent literature on 3DCMP has shifted toward printing process investigation, which is gaining more attention due to its significant effect on filament quality [19,20,21,22,23].
Numerical and experimental investigations have shown that process parameters and their combined effects affect the quality of the printed filament significantly [20,24,25,26,27,28,29]. A balance between the process parameters is needed to improve the mechanical properties and surface quality of printed filaments. Most of the existing literature investigates the effects of process parameters on straight path filament quality. However, the material flow mechanism is more complex, and some undesirable phenomena, such as corner rounding, corner swelling, and corner ringing may occur on the filament when performing corner printing [26,30]. These phenomena can affect the surface finish and mechanical properties of the filament significantly. The investigations on corner printing are still open for us.
Numerous motion control strategies and optimized tool path generation approaches have been proposed to fabricate filament with a better surface finish and mechanical properties [31,32,33,34]. However, these mechanical control strategies work well only under specific conditions and have limited applications. These strategies lack investigations in changing process parameters, such as the tool path radius R, nozzle geometry, and the relative nozzle travel speed ζ, which are closely interrelated in 3DCMP at corners [19]. In 3DCMP, most manufacturing operates with small nozzle aspect ratios to balance the printing efficiency and part surface finish at corners, and the printing speed is identified based on the user’s experience with a specific tool path radius. The filament mass distribution has not yet been sufficiently explored regarding the remaining conditions (printing speed and tool path radius). Hence, it is crucial to explore these domains to systematically ensure the desired filament mass distribution at corners.
A previous investigation showed that the impacts of material rheological properties on filament mass distribution are insignificant [35]. However, process parameters and their combined effects have considerable effects on filament mass distribution at corners. Authors have carried out extensive work to characterize many parameters and their effects on filament mass distribution at corners, indicating a processing range that would seem to work for many different parameter sets. With other considerations, such as productivity and the ability to create more aesthetic designs (higher printing resolutions), the printing process window should be identified. Its benefits include the manufacturers and end users being able to control the printing machine in order to fabricate parts as desired. An SVM could efficiently determine a decision boundary as an operating process window for filament mass distribution classification by the projection of a statistical optimal hyperplane back to the original space with small data sets. SVMs have been used successfully to perform this classification in other areas [36,37,38]. However, few investigations have been conducted on identifying the printing process windows in 3DCMP. Additionally, the aforementioned studies lack fundamental investigations of the physical phenomenon while performing SVM classification.
Therefore, an SVM was used to identify the two-dimensional optimal process windows by capturing the correlation between process parameters and mass distribution in 3DCMP under specific conditions in this study. Additionally, the flow behaviour was investigated under different process windows. To further explore the filament cross-section ratio Φ in the designed domain, transfer learning was applied to efficiently predict new two-dimensional printing process windows based on new working conditions and prior SVM results. The experimental results demonstrate the feasibility and effectiveness of the machine learning methods for printing process window determination. The obtained results are presented in the following sections.
2. Theory
2.1. Numerical Model
The computational fluid dynamics (CFD) method is used to study fluid flow behaviour under various conditions [39,40,41]. To track the interface between the cementitious material and air, the volume of fluid (VOF) method was adopted to study the cementitious material flow behaviour during the extrusion and deposition process. The governing equations of CFD and VOF formulations for multiphase flow are shown in Equations (1)–(4) [42,43,44]:
Continuity equation:
Equation of momentum:
Volume fraction equation:
where ρ = αc ρc + αa ρa, τe = keke = αc µ+ αa ka, µ = τ/ + τ0, is the volume fraction of m-th fluid in the system. (s−1) is the shear rate. τ0 (Pa) is the material dynamic yield stress. ρc (kg/m3) and ρa (kg/m3) are the densities of the cementitious material and air, respectively. ka (Pa·s) is the viscosity of air. The second term to the left of Equation (2) is τe = ke= (αc µ+ αa ka), in which ke (ke = αc µ+ αa ka = αc (τ/+ τ0) + αa ka) is dependent on the shear rate.
2.2. SVM and Transfer Learning
As a classical machine learning method, SVMs work well when there is a clear margin of separation between classes [45]. SVMs can identify a hyperplane that separates the data sets into different cases. If the training data is nonlinearly distributed, the training feature in the original feature space can be converted into a high-dimensional space by the kernel function ; then, the hyperplane classifies the training data linearly in the new space, as shown in Figure 1. Lastly, the hyperplane is projected back to the original space to form the decision boundaries, which corresponds to the printing process window.
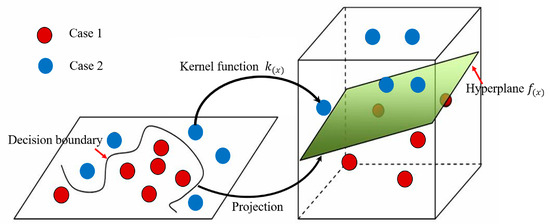
Figure 1.
SVMs use k(x) to map data into a higher-dimensional space where f(x)separates the classes linearly.
The reasons for selecting the SVM model in this study are threefold: Firstly, SVMs are suitable for small data set classification, which is very important for engineering applications. It is costly and time-consuming to collect a large amount of data in 3DCMP. Secondly, the hyperplane in the SVM is projected back to the original space as the decision boundaries, which corresponds to the printing process window. This is easy to understand from a geometry perspective. Thirdly, the complicated interaction between inputs can be captured by the SVM model. In this study, the process parameters, such as the nozzle aspect ratio, tool path radius, and relative nozzle travel speed were modelled as the input of the SVM model. The filament cross-section ratio was modelled as the output of the SVM model. Then, the decision boundary was identified to classify the acceptable and unacceptable filament cross-section ratio at corners. Thus, the printing process window was determined to ensure the surface finish of the printed part.
However, printing process windows vary significantly with the printing process parameters. Therefore, a wider range of printing process windows should be identified to ensure a reasonable filament cross-section ratio under new printing process parameters. While operating windows can be identified using an SVM, large amounts of data need to be collected before the results are useful. In order to reduce the amount of required data, transfer learning was used [46,47]. Transfer learning, as presented by Zhang et al., can apply previous results to improve prediction accuracy [36,48].
In this study, an SVM was used to identify the printing process windows at the tool path radius R, nozzle aspect ratio φ, and relative nozzle travel speed ζ of 30 mm, 1.5, and 1.1, respectively. Consequently, the printing process windows at the new tool path radius R, nozzle aspect ratio φ, and relative nozzle travel speed ζ of 35 mm, 2, and 1.05, respectively, were identified using transfer learning. Algorithm 1 presents the algorithm used for transfer learning [36].
| Algorithm 1. Algorithm of TrAdaBoost for transfer learning. |
| Input labelled source domain samples As and labelled target domain samples as training data. Determine a classical SVM learner and maximum iterations N. Initialise the weight vector of the training data as For t =1, 2, 3…, N. . : X→Y is determined. in target domain At Then, Update the weight vector based on the training data: t = t + 1 |
| Output decision function: |
In this procedure, X represents data cases obtained from the designed space (), Y is the label of the filament cross-section ratio Φ, and is the Boolean function depending on the relation between X and Y based on the labelled filament cross-section ratio Φ. In this study, the data sets from the source domain are defined as , where and new scarce data from the target domain is defined as , where . The training data set was a combination of source data and target data , where
are the inputs (the tool path radius R, nozzle aspect ratio φ, and relative nozzle travel speed ζ in this study) for transfer learning. Accordingly, the labelled filament cross-section ratio within the source domain and target domain was modelled as the output pattern in the transfer learning.
3. Numerical Model Validation
Previous studies have shown that rheological properties have little effect on filament mass distribution at corners when the material plastic viscosity ranges from 4 to 7.5 Pa·s and dynamic yield stress ranges from 400 to 520 Pa [35]. Hence, only the effects of printing process parameters were examined in this study. Six experiments were conducted to validate the accuracy of the numerical model. The equipment used in 3DCMP was a 4-axis gantry printer. During the printing process, the material was delivered through a hose (3 m in length, 25.4 mm in diameter) by a progressive cavity pump and extruded from a rectangular nozzle. The pumping flow rate was kept constant at 27 mL/s. The material used in the experiment had a density, yield stress τ0, and plastic viscosity k of 2200 kg/m3, 516 Pa, and 6.5 Pa∙s, respectively. The print path was composed of different circles with radii of 30 mm, 45 mm, and 60 mm. The print path was produced with two layers to eliminate the possibility of an uneven substrate, and only the second layer was used for analysis. After the printing process, a thin needle was used to retrace the print path, which scratched a fine line on the top surface of the second layer. This groove was later used to identify the centre of the filament for analysis. Fluent 16.0 was adopted to perform the numerical simulation.
Three specimens were cut after curing at room temperature for 48 h for each experiment. A Matlab code was used to analyze the mass distribution of the sample. The profiles of numerical results of filament cross-section at corners are shown in Figure 2. A cementitious material ratio of 1 indicates that this zone is filled with cementitious material, while a ratio of 0 indicates that this zone is filled with air. The interface between cementitious material and air was captured using the volume of fluid (VoF) model. Then, the material cross-section ratio, Φ (Φ = ) was used to characterize the accuracy of numerical results. and are defined as the inner and outer cross-section areas of the filament at the corners, respectively. The 3D numerical results are consistent with the physical experimental results, as shown in Figure 3.
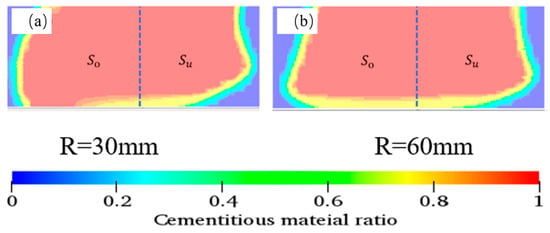
Figure 2.
Simulation results of the filament cross-section at corners (a) R = 30 mm and (b) R = 60 mm.
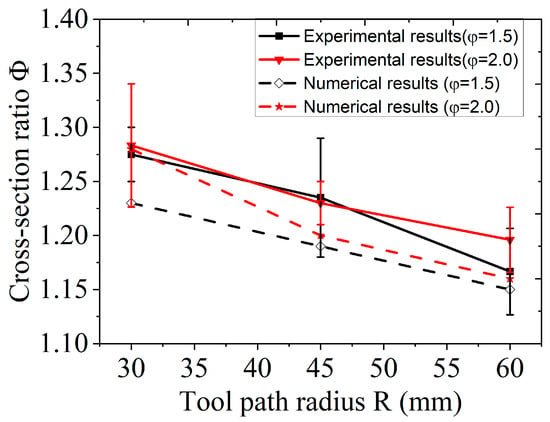
Figure 3.
Comparison of the mass distribution of the printed filament at corners between numerical simulation and experimental results.
To test the convergence stability of the 3D numerical model, five sets of time steps, iteration cycles, mesh number, and error tolerance [43,44] were tested and compared. The filament cross-section ratio was determined for comparison. The material used in this simulation had a dynamic yield stress and a plastic viscosity of 6.5 Pa·s, respectively. The material inlet velocity was set equal to the nozzle travel speed, which was 60 mm/s. The nozzle aspect ratio and the tool path radius were 1.8 and 30 mm, respectively. To achieve a balance between model accuracy and computation time, variables in No. 1 (see Table 1) were used. The numerical model was then deployed to collect data for printing process window identification.

Table 1.
Setup for convergence stability study with a comparison of filament cross-section ratios.
4. Results and Discussion
Excessive material is deposited in the overfilled zone near the corner, while the other zone is unfilled, which is known as underfilled zone (see Figure 4) [31,49]. The material deposited in the underfilled zone and overfilled zone must be appropriate to ensure a good surface finish and mechanical properties. The filament cross-section ratio at corners is sensitive to printing process parameters; hence, the printing process windows must be identified to ensure a good surface finish and mechanical properties under various conditions.
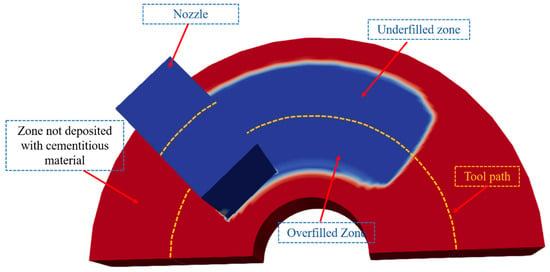
Figure 4.
Top view of the schematic of a single filament at corners.
The printing process windows were identified under various conditions using SVM and transfer learning. The TrAdaBoost algorithm was used to conduct transfer learning [36]. The source domain data (SDD), target domain data (TDD), training data, input, and output for SVM and transfer learning are summarized in Table 2. Explanations for the SDD, TDD, training data, and output data are provided in [36].

Table 2.
Variables used for SVM and transfer learning.
4.1. Identify Printing Process Windows at Tool Path Radii R of 30 mm and 35 mm
To identify the printing process window when the toolpath radius R = 30 mm, the nozzle aspect ratio φ and relative nozzle travel speed ζ were modelled as input variables of the SVM model to investigate their combined effects on filament cross-section ratio Φ, which was modelled as the output pattern. Two hundred data cases were collected in this designed domain. The data was labelled with respect to the cross-section ratio Φ of the printed specimens by setting a threshold Φ = 1.20. The label of −1 refers to the filament cross-section ratio Φ smaller than 1.20; on the other hand, the label of 1 corresponds to the filament cross-section ratio Φ larger than 1.20.
By setting a threshold of Φ = 1.20, the SVM was used to determine the boundary between an acceptable and unacceptable region when R = 30 mm, as shown in Figure 5. For the SVM model, K-folder cross-validation was performed to identify the optimal classifier. Then, extra data sets were used to test the accuracy of the SVM model [36]. The results show that the error rate of the model is 0.17. Subspace I (Φ < 1.20) is considered as the printing process window identified by SVM when R = 30 mm. Printing in subspace I means that the filament would achieve better surface finish and mechanical properties. On the other hand, the larger cross-section ratio Φ (Φ > 1.20) in subspaces II, III, and IV are considered unsatisfactory.
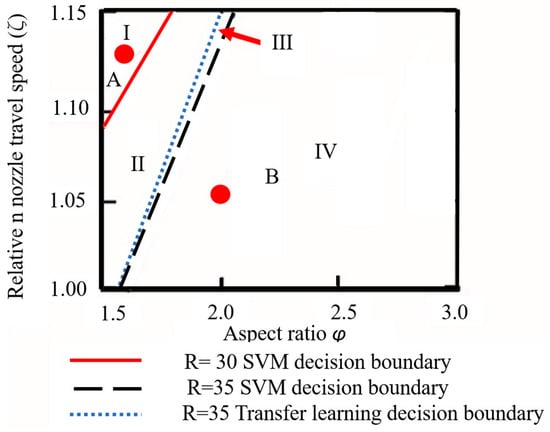
Figure 5.
Printing process windows at different tool path radius determined by SVM and transfer learning. I, II, III, IV represent subspaces classified by decision boundaries.
From the printing process window, it is observed that the combined effects of the nozzle aspect ratio φ and relative nozzle travel speed ζ affect the filament cross-section ratio significantly. As shown in Figure 6, some material spills from the overfilled zone during the deposition process, and the amount of material spilling from the overfilled zone affects the filament cross-section ratio significantly at corners. Hence, this study focuses on investigating the flow behaviour around the material spillover area (within the dotted line), as shown in Figure 6.
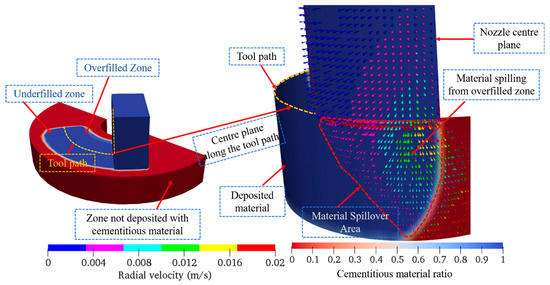
Figure 6.
Material spilling from the overfilled zone within the material spillover area (MSA).
Two cases (A and B) located in subspaces I and IV, respectively, were selected to study the material flow behaviour at different printing process parameters during the material deposition process. The cross-section ratio Φ decreased as the printing process parameters changed from Case B to Case A. More material spilled from the overfilled zone of the filament for Case A compared to Case B, as shown in Figure 7. The material radial velocity distribution within the material spillover area was similar in Figure 7a,b. However, the material crossing area, as shown in Figure 7a, was larger than that in Figure 7b, thus causing more material to be deposited to the underfilled zone for Case A as compared to Case B. The cementitious material ratio refers to the ratio of the mortar-to-fluid ratio in the simulation. When the cementitious material ratio is 1, it means that the material exhibits 100% of the cementitious material behaviour. On the other hand, when the ratio is 0, it represents an atmospheric environment. The mortar-to-fluid ratio is used to determine the interaction between the material and the environment. This allows for an examination of the inter-region of the material behaviour due to this interaction [27].
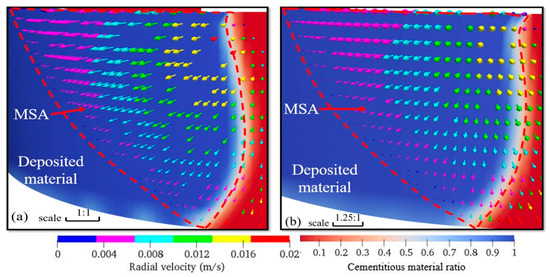
Figure 7.
Contours of cementitious material ratio and velocity of materials under different subspaces: (a) Φ < 1.20 in case A and (b) Φ > 1.20 at case B, with R = 30 mm.
To further identify the printing process window when the toolpath radius R = 35 mm, the nozzle aspect ratio φ and the nozzle travel speed ζ were modelled as input variables (120 data sets) of the SVM model to investigate their combined effects on filament cross-section ratio Φ, which was modelled as the output pattern. The blue dotted line plotted in Figure 5 for the new tool path radius R (R = 35 mm) using the SVM (threshold of Φ = 1.20) was used to identify the decision boundary. It indicates that printing process parameters in subspaces I, II, and III (Φ < 1.20) of Figure 5 are considered satisfactory, and these subspaces are considered as the proper printing process windows when R = 35 mm.
However, it should be noted that the previous data (collected under R = 30 mm) was not used, and the features obtained from the previous window (determined as R = 30 mm) were excluded. Hence, the feasibility of using source domain data (collected as R = 30 mm) and the target domain data (collected as R = 35 mm) to improve the prediction accuracy when R = 35 mm was examined with transfer learning. By combining the source domain data and target domain data as training data, the decision boundaries identified using transfer learning (input φ, ζ, output Φ) are shown in Figure 5, represented by the green dotted line. With the results obtained by transfer learning, only subspaces I and II (Φ < 1.20) are considered as the proper printing process windows for R = 35 mm.
Thirty sets of data were collected to test the accuracy of the SVM model and the transfer learning model. The results show that the error rate of the SVM and the transfer learning model are 0.20 and 0.13, respectively. Hence, subspaces I and II (Φ < 1.20) determined by transfer learning are improved predictions of the printing process windows for R = 35 mm.
4.2. Identify Printing Process Windows of Nozzle Aspect Ratio φ at 1.5 and 2.0
Nozzle aspect ratio φ determines the filament layer thickness, which affects product buildability and printing efficiency. When φ = 1.5, the tool path radius R and relative nozzle travel speed ζ were modelled as the input variables of the SVM model. The combined effects of the input variables were investigated on the filament cross-section ratio, which was modelled as the output pattern. Two hundred data sets were obtained from the validated numerical model. The data was labelled according to the cross-section ratio Φ of printed specimens by setting a threshold Φ = 1.20.
Consequently, the optimal boundary between the two regions for Φ = 1.20 was obtained using the SVM; the result is shown in Figure 8. As mentioned in Section 4.1, the error rate (0.1) of the SVM model was evaluated using the testing data. Then, the SVM model (threshold of Φ = 1.20) was used to identify the process window. Filament cross-section ratios Φ (Φ < 1.20) in subspaces II, III, and IV (see Figure 8) are considered satisfactory. In contrast, printing in subspace I when φ = 1.5 means that the filament will have a poor surface finishing. It was found that increasing the toolpath radius R or the relative nozzle travel speed ζ can effectively suppress filament uneven mass distribution at corners. The combined effects of tool path radius R and relative nozzle travel speed ζ significantly influence the cross-section ratio. This is confirmed by the numerical contour shown in Figure 9. Two cases (C and D) located in subspaces I and II, respectively, were selected to study material flow behaviour during the material deposition process. With increases in relative nozzle travel speed ζ and tool path radius R, more material spilled from the overfilled zone, as shown in Figure 9. For Case D, the results indicate that approximately 10% more material spilled from the overfilled zone than in Case C during the extrusion process, helping to reduce the filament cross-section ratio.
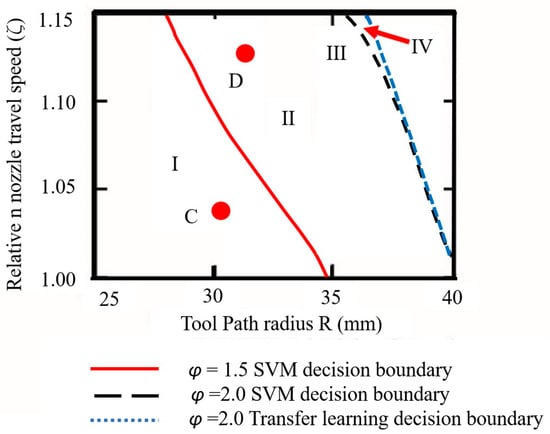
Figure 8.
Printing process windows at different nozzle aspect ratios φ identified by SVM and transfer learning. I, II, III, IV represent subspaces classified by decision boundaries.
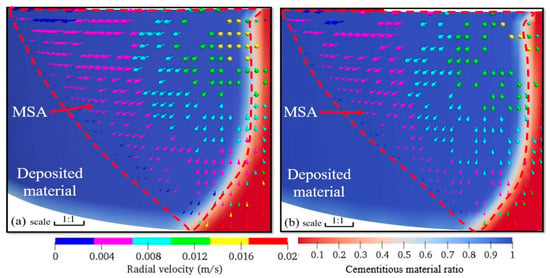
Figure 9.
Contours of cementitious material ratio and velocity in different subspaces: (a) Φ > 1.20 for case C and (b) Φ < 1.20 for case D when nozzle aspect ratio φ = 1.5.
The investigation was then extended to identify the printing process window when nozzle aspect ratio φ = 2. The tool path radius R and the nozzle travel speed ζ were modelled as the input variables (120 data sets) of the SVM model to investigate their combined effects on the filament cross-section ratio Φ, which was modelled as the output pattern. The blue dotted line plotted in Figure 8 represents the new nozzle aspect ratio φ (φ = 2) identified by the SVM (threshold of Φ = 1.20) as the decision boundary. Subspace IV (Φ < 1.20) obtained by the SVM in Figure 8 can be considered as the printing process window when φ = 2.
Thereafter, with the intention to reuse the previous data (collected for φ = 1.5) and improve the prediction accuracy of the SVM model, transfer learning was used to capture the knowledge from the previous window (φ = 1.5). By combining the source domain data (collected for φ = 1.50) and target domain data (collected for φ = 2.0) as training data, the decision boundaries identified by transfer learning (input R and ζ, output Φ) are shown in Figure 9, represented by the green dotted line. The subspaces III and IV (Φ < 1.20) identified by transfer learning can be considered as the printing process windows when φ = 2.
Subsequently, the error rates of the SVM model and the transfer learning model were tested using another 30 data sets. The results show that their error rates were 0.17 and 0.07, respectively. Compared to SVMs, transfer learning can predict the printing process windows with much better accuracy. Therefore, transfer learning was adopted to identify the printing process window for φ = 2. The subspaces III and IV (Φ < 1.20) in Figure 9 are identified as the printing process windows when φ = 2.
4.3. Identify Printing Process Windows at the Relative Nozzle Travel Speeds ζ of 1.10 and 1.05
The nozzle travel speed is set lower than the material inlet velocity to suppress the uneven filament cross-section ratio Φ at corners in practical applications. In this study, the relative nozzle travel speed ζ (ζ = Vi/Vn) is proposed to characterize the impacts of the velocity difference on Φ. Vi (mm/s) is the material inlet velocity, and Vn (mm/s) refers to the nozzle travel speed. The relative nozzle travel speed ζ was initially set to 1.10. The tool path radius R and nozzle aspect ratio φ were modelled as the input variables of the SVM model to investigate their combined effects on filament cross-section ratio, which was modelled as the output pattern.
Two hundred data sets were collected in the designed space to identify the printing process window when ζ = 1.1. The SVM (threshold Φ = 1.20) was adopted to determine the decision boundary between the acceptable and unacceptable regions. The testing results show that the error rate of the SVM model was 0.066 in this study. The identified boundary is shown in Figure 10, represented by the red dotted line. Subspaces II and III represent the acceptable cross-section ratio Φ (Φ < 1.20) region when ζ = 1.1, which means that the filaments printed in this printing process window achieve better mechanical quality and dimensional accuracy. On the other hand, subspace I has large cross-section ratios (Φ > 1.20) and is considered unacceptable, because the filaments produced in subspace I have poor printing accuracy and mechanical properties. It was found that increasing toolpath radius R or decreasing nozzle aspect ratio φ improved the homogeneity of the filament mass distribution at corners.
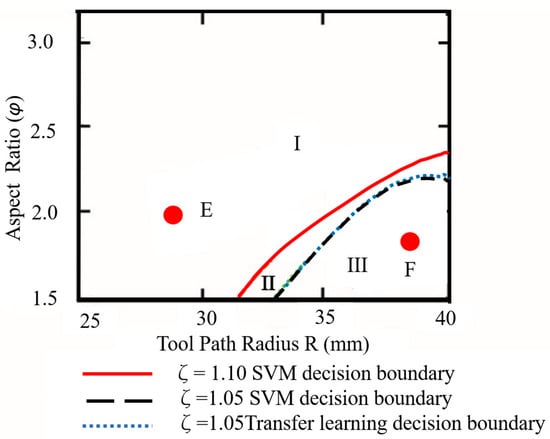
Figure 10.
Printing process windows at various relative nozzle travel speeds ζ identified by SVM and transfer learning. I, II, and III represent subspaces classified by decision boundaries.
Two cases (E and F) in subspaces I and III were chosen to study the material flow mechanism during the extrusion and deposition process. The results show that the material crossing area in Figure 11b is much larger than that in Figure 11a. This means that more material spills from the overfilled zone in case F than in case E during the material extrusion and deposition process. Thus, the mass distribution homogeneity of the filament in Case F is better than that in Case E.
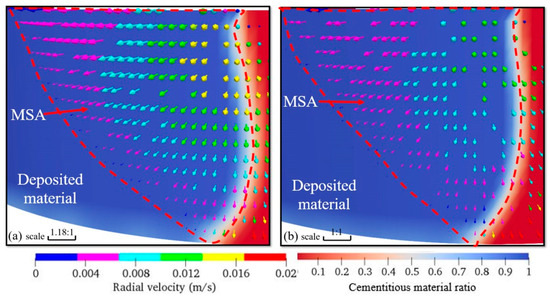
Figure 11.
Contours of cementitious material ratio and velocity in different subspaces (a) Φ > 1.20 for case E and (b) Φ < 1.20 for case F when relative nozzle travel speed ζ = 1.1.
Subsequently, the printing process window was identified for the relative nozzle travel speed ζ = 1.05. As aforementioned, the tool path radius R and the nozzle aspect ratio φ were modelled as the input variables (120 data sets) of the SVM model to investigate their combined effects on the filament cross-section ratio Φ, which was modelled as the output pattern. One hundred twenty data sets were collected within the designed space when the relative nozzle travel speed ζ = 1.05. A decision boundary identified using SVM (threshold of Φ = 1.20) is represented by the blue dotted line in Figure 10. Subspace III is considered as the printing process window based on the SVM model.
The feasibility of transfer learning in improving the prediction accuracy has been validated in Section 4.1 and Section 4.2. Therefore, it was employed to identify the printing process window for ζ = 1.05 in this section. The source domain data (data obtained for ζ = 1.10) and target domain data (data obtained for ζ = 1.05) were combined to train the transfer learning model. The tool path R and nozzle aspect ratio φ were modeled as the input variables, while the cross-section ratio Φ was modeled as the output pattern. The decision boundaries identified by transfer learning are shown in Figure 10. Subspace III shown in Figure 10 is considered the process window based on transfer learning when ζ is 1.05.
Finally, the accuracy of the SVM model and the transfer learning model was evaluated using another 30 data sets. The results show that the error rate of both models was 0.13. Hence, the optimized printing process window is presented in subspace III when ζ = 1.05.
The data sets used for the SVM and transfer learning, the model error rates, and the identified printing process windows under various conditions are summarized in Table 3 to facilitate the reading.

Table 3.
Printing process windows identified under various conditions using SVM and transfer learning.
5. Determination of Three-Dimensional Optimized Printing Process Window
The main printing process parameters, such as the tool path radius R, nozzle aspect ratio φ, relative nozzle travel speed ζ, and their combined effects, affect the filament cross-section ratio Φ significantly. The interactions between any two printing process parameters on the filament cross-section ratio Φ were investigated in Section 4. Identifying two-dimensional printing process windows for specific printing process parameters can help optimize homogeneous filament mass distribution at corners.
A three-dimensional printing process window was established to examine the correlation between all printing process parameters and the cross-section ratio Φ. The tool path radius R, nozzle aspect ratio φ, and relative nozzle travel speed ζ were modelled as the input variables, while the filament cross-section ratio Φ was modelled as the output pattern. One thousand data sets were used to train the SVM with a threshold Φ = 1.20.
6. Effectiveness Validation of the Machine Learning
As aforementioned, the SVM and transfer learning approaches have been adopted for optimizing 3D printing process windows. Several experiments were conducted under different printing process parameters to validate the feasibility and reliability of these machine learning approaches, and the results are listed in Table 4. The results indicate that machine learning approaches, such as SVM and transfer learning, are reliable and effective for optimizing printing process windows.

Table 4.
Comparison between predicted results and experimental results.
7. Conclusions
In this study, machine learning methods, namely support vector machine (SVM) and transfer learning, were used to examine the combined effect of printing process parameters on filament mass distribution under various printing process parameters. Based on the proposed approaches, the filament cross-section ratio Φ was investigated across multiple designed spaces, and the optimal printing process windows were identified based on CFD results. The main conclusions from the investigations are as follows:
- Two-dimensional printing process windows were identified using the support vector machine method with a threshold Φ = 1.20 for specific printing process parameters in the designed domains. The optimized two-dimensional printing process windows show the complex correlation between printing process parameters and filament cross-section ratio Φ at corners.
- The printing process parameters affect the material flow behaviour considerably, and hence the filament cross-section ratio at its corners. The contours of the cementitious material ratio and radial velocity of the material obtained from CFD results show that the material flows in three-dimensional domains during extrusion and deposition processes.
- Transfer learning was used to identify the printing process windows efficiently. Compared to the SVM model, the transfer learning predicts the filament cross-section ratio with better accuracy for most printing process parameters.
- A three-dimensional printing process window was identified to explore the correlation between all printing process parameters and cross-section ratio Φ. The experimental results show the reliability of the printing process window identification in 3DCMP at corners.
This investigation provides a road map for the printing process parameter optimization for uniform filament mass distribution in 3DCMP at corners. A real-time feedback control system is planned for future development based on the optimal printing process parameters.
Author Contributions
Conceptualization, Z.L., L.S., Y.L., M.L. and T.N.W.; Methodology, L.S., Y.L. and M.L.; Validation, Z.L.; Investigation, L.S.; Writing—original draft, Z.L., L.S. and Y.L.; Writing—review and editing, Z.L., M.L. and T.N.W. All authors have read and agreed to the published version of the manuscript.
Funding
This research was funded by the National Research Foundation, Prime Minister’s Office, Singapore under its Medium-Sized Centre funding scheme.
Data Availability Statement
The original contributions presented in this study are included in the article. Further inquiries can be directed to the corresponding authors.
Acknowledgments
This research was supported by the National Research Foundation, Prime Minister’s Office, Singapore under its Medium-Sized Centre funding scheme, Sembcorp Design & Construction Pte Ltd., and Sembcorp Architects & Engineers Pte Ltd.
Conflicts of Interest
Author Zhixin Liu, Liang Si, and Yebao Liu were employed by the company Aerospace Times Feihong Technology Company Limited. The remaining authors declare that the research was conducted in the absence of any commercial or financial relationships that could be construed as a potential conflict of interest.
References
- Liu, Z.; Li, M.; Weng, Y.; Wong, T.N.; Tan, M.J. Mixture Design Approach to optimize the rheological properties of the material used in 3D cementitious material printing. Constr. Build. Mater. 2019, 198, 245–255. [Google Scholar] [CrossRef]
- Panda, B.; Unluer, C.; Tan, M.J. Extrusion and rheology characterization of geopolymer nanocomposites used in 3D printing. Compos. Part B Eng. 2019, 176, 107290. [Google Scholar] [CrossRef]
- Zhu, B.; Nematollahi, B.; Pan, J.; Zhang, Y.; Zhou, Z.; Zhang, Y. 3D concrete printing of permanent formwork for concrete column construction. Cem. Concr. Compos. 2021, 121, 104039. [Google Scholar] [CrossRef]
- Mechtcherine, V.; Buswell, R.; Kloft, H.; Bos, F.P.; Hack, N.; Wolfs, R.; Saranjan, J.; Nematollahi, B.; Ivaniuk, E.; Neef, T. Integrating reinforcement in digital fabrication with concrete: A review and classification framework. Cem. Concr. Compos. 2021, 119, 103964. [Google Scholar] [CrossRef]
- Xiao, J.; Ji, G.; Zhang, Y.; Ma, G.; Mechtcherine, V.; Pan, J.; Wang, L.; Ding, T.; Duan, Z.; Du, S. Large-scale 3D printing concrete technology: Current status and future opportunities. Cem. Concr. Compos. 2021, 122, 104115. [Google Scholar] [CrossRef]
- Ma, G.; Li, Z.; Wang, L.; Wang, F.; Sanjayan, J. Mechanical anisotropy of aligned fiber reinforced composite for extrusion-based 3D printing. Constr. Build. Mater. 2019, 202, 770–783. [Google Scholar] [CrossRef]
- Le, T.T.; Austin, S.A.; Lim, S.; Buswell, R.A.; Gibb, A.G.; Thorpe, T. Mix design and fresh properties for high-performance printing concrete. Mater. Struct. 2012, 45, 1221–1232. [Google Scholar] [CrossRef]
- Ma, G.; Li, Z.; Wang, L. Printable properties of cementitious material containing copper tailings for extrusion based 3D printing. Constr. Build. Mater. 2018, 162, 613–627. [Google Scholar] [CrossRef]
- Liu, C.; Wang, X.; Chen, Y.; Zhang, C.; Ma, L.; Deng, Z.; Chen, C.; Zhang, Y.; Pan, J.; Banthia, N. Influence of hydroxypropyl methylcellulose and silica fume on stability, rheological properties, and printability of 3D printing foam concrete. Cem. Concr. Compos. 2021, 122, 104158. [Google Scholar] [CrossRef]
- Weng, Y.; Li, M.; Liu, Z.; Lao, W.; Lu, B.; Zhang, D.; Tan, M.J. Printability and fire performance of a developed 3D printable fibre reinforced cementitious composites under elevated temperatures. Virtual Phys. Prototyp. 2019, 14, 284–292. [Google Scholar] [CrossRef]
- Hambach, M.; Rutzen, M.; Volkmer, D. Properties of 3D-printed fiber-reinforced Portland cement paste. In 3D Concrete Printing Technology; Elsevier: Amsterdam, The Netherlands, 2019; pp. 73–113. [Google Scholar]
- Nguyen, K.T.; Navaratnam, S.; Mendis, P.; Zhang, K.; Barnett, J.; Wang, H. Fire safety of composites in prefabricated buildings: From fibre reinforced polymer to textile reinforced concrete. Compos. Part B Eng. 2020, 187, 107815. [Google Scholar] [CrossRef]
- Panda, B.; Ruan, S.; Unluer, C.; Tan, M.J. Improving the 3D printability of high volume fly ash mixtures via the use of nano attapulgite clay. Compos. Part B Eng. 2019, 165, 75–83. [Google Scholar] [CrossRef]
- Tay, Y.; Panda, B.; Ting, G.; Ahamed, N.; Tan, M.; Chua, C. 3D printing for sustainable construction. In Industry 4.0–Shaping The Future of The Digital World, Proceedings of the 2nd International Conference on Sustainable Smart Manufacturing (S2M 2019), Manchester, UK, 9–11 April 2019; CRC Press: Boca Raton, FL, USA, 2020; p. 119. [Google Scholar]
- Ting, A.G.H.; Tay, D.Y.W.; Annapareddy, A.; Li, M.; Tan, M.J. Effect of Recycled Glass Gradation in 3D Cementitious Material Printing; Nanyang Technological University: Singapore, 2018. [Google Scholar]
- Li, Z.; Wang, L.; Ma, G. Mechanical improvement of continuous steel microcable reinforced geopolymer composites for 3D printing subjected to different loading conditions. Compos. Part B Eng. 2020, 187, 107796. [Google Scholar] [CrossRef]
- Xia, M.; Sanjayan, J. Method of formulating geopolymer for 3D printing for construction applications. Mater. Des. 2016, 110, 382–390. [Google Scholar] [CrossRef]
- Muthukrishnan, S.; Ramakrishnan, S.; Sanjayan, J. Effect of alkali reactions on the rheology of one-part 3D printable geopolymer concrete. Cem. Concr. Compos. 2021, 116, 103899. [Google Scholar] [CrossRef]
- Bos, F.; Wolfs, R.; Ahmed, Z.; Salet, T. Additive manufacturing of concrete in construction: Potentials and challenges of 3D concrete printing. Virtual Phys. Prototyp. 2016, 11, 209–225. [Google Scholar] [CrossRef]
- Tay, Y.W.D.; Li, M.Y.; Tan, M.J. Effect of printing parameters in 3D concrete printing: Printing region and support structures. J. Mater. Process. Technol. 2019, 271, 261–270. [Google Scholar] [CrossRef]
- Tay, Y.W.D.; Qian, Y.; Tan, M.J. Printability region for 3D concrete printing using slump and slump flow test. Compos. Part B Eng. 2019, 174, 106968. [Google Scholar] [CrossRef]
- Serdeczny, M.P.; Comminal, R.; Pedersen, D.B.; Spangenberg, J. Experimental validation of a numerical model for the strand shape in material extrusion additive manufacturing. Addit. Manuf. 2018, 24, 145–153. [Google Scholar] [CrossRef]
- Sanjayan, J.G.; Nematollahi, B.; Xia, M.; Marchment, T. Effect of surface moisture on inter-layer strength of 3D printed concrete. Constr. Build. Mater. 2018, 172, 468–475. [Google Scholar] [CrossRef]
- Kwon, H. Experimentation and Analysis of Contour Crafting (CC) Process Using Uncured Ceramic Materials. Ph.D Thesis, University of Southern California, Los Angeles, CA, USA, 2002. [Google Scholar]
- Comminal, R.; Serdeczny, M.P.; Pedersen, D.B.; Spangenberg, J. Numerical modeling of the strand deposition flow in extrusion-based additive manufacturing. Addit. Manuf. 2018, 20, 68–76. [Google Scholar] [CrossRef]
- Comminal, R.; Serdeczny, M.; Pedersen, D.; Spangenberg, J. Numerical Modeling of the Material Deposition and Contouring Precision in Fused Deposition Modeling. In Proceedings of the 29th Annual International Solid Freeform Fabrication Symposium (SFF Symp 2018), Austin, TX, USA, 13–15 August 2018; pp. 1855–1864. [Google Scholar]
- Liu, Z.; Li, M.; Weng, Y.; Qian, Y.; Wong, T.N.; Tan, M.J. Modelling and parameter optimization for filament deformation in 3D cementitious material printing using support vector machine. Compos. Part B Eng. 2020, 193, 108018. [Google Scholar] [CrossRef]
- Lao, W.; Li, M.; Tjahjowidodo, T. Variable-Geometry Nozzle for Surface Quality Enhancement in 3D Concrete Printing. Addit. Manuf. 2020, 37, 101638. [Google Scholar] [CrossRef]
- Carneau, P.; Mesnil, R.; Roussel, N.; Baverel, O. Additive manufacturing of cantilever-from masonry to concrete 3D printing. Autom. Constr. 2020, 116, 103184. [Google Scholar] [CrossRef]
- Duty, C.; Ajinjeru, C.; Kishore, V.; Compton, B.; Hmeidat, N.; Chen, X.; Liu, P.; Hassen, A.A.; Lindahl, J.; Kunc, V. What makes a material printable? A viscoelastic model for extrusion-based 3D printing of polymers. J. Manuf. Process. 2018, 35, 526–537. [Google Scholar] [CrossRef]
- Jin, Y.-A.; He, Y.; Fu, J.-Z.; Gan, W.-F.; Lin, Z.-W. Optimization of tool-path generation for material extrusion-based additive manufacturing technology. Addit. Manuf. 2014, 1, 32–47. [Google Scholar] [CrossRef]
- Jin, Y.-A.; Li, H.; He, Y.; Fu, J.-Z. Quantitative analysis of surface profile in fused deposition modelling. Addit. Manuf. 2015, 8, 142–148. [Google Scholar] [CrossRef]
- Ertay, D.S.; Yuen, A.; Altintas, Y. Synchronized material deposition rate control with path velocity on fused filament fabrication machines. Addit. Manuf. 2018, 19, 205–213. [Google Scholar] [CrossRef]
- Comminal, R.; Serdeczny, M.P.; Pedersen, D.B.; Spangenberg, J. Motion planning and numerical simulation of material deposition at corners in extrusion additive manufacturing. Addit. Manuf. 2019, 29, 100753. [Google Scholar] [CrossRef]
- Liu, Z.; Li, M.; Tay, Y.W.D.; Weng, Y.; Wong, T.N.; Tan, M. Rotation nozzle and numerical simulation of mass distribution at corners in 3D cementitious material printing. Addit. Manuf. 2020, 34, 101190. [Google Scholar] [CrossRef]
- Zhang, H.; Moon, S.K.; Ngo, T.H. Hybrid machine learning method to determine the optimal operating process window in aerosol jet 3D printing. ACS Appl. Mater. Interfaces 2019, 11, 17994–18003. [Google Scholar] [CrossRef]
- Aoyagi, K.; Wang, H.; Sudo, H.; Chiba, A. Simple method to construct process maps for additive manufacturing using a support vector machine. Addit. Manuf. 2019, 27, 353–362. [Google Scholar] [CrossRef]
- Zhang, H.; Moon, S.K. Reviews on Machine Learning Approaches for Process Optimization in Noncontact Direct Ink Writing. ACS Appl. Mater. Interfaces 2021, 13, 53323–53345. [Google Scholar] [CrossRef]
- Wang, G.; Huang, P.; Zhang, Y. Numerical analysis of metal transfer in gas metal arc welding. Metall. Mater. Trans. B 2003, 34, 345–353. [Google Scholar] [CrossRef]
- Hosseinpoor, M.; Yahia, A.; Khayat, K.H. Modeling of flow performance of self-consolidating concrete using Dam Break Theory and computational fluid dynamics. Cem. Concr. Compos. 2019, 102, 14–27. [Google Scholar] [CrossRef]
- He, L.; Chow, W.T.; Li, H. Effects of interlayer notch and shear stress on interlayer strength of 3D printed cement paste. Addit. Manuf. 2020, 36, 101390. [Google Scholar] [CrossRef]
- Fuster, D.; Bagué, A.; Boeck, T.; Le Moyne, L.; Leboissetier, A.; Popinet, S.; Ray, P.; Scardovelli, R.; Zaleski, S. Simulation of primary atomization with an octree adaptive mesh refinement and VOF method. Int. J. Multiph. Flow 2009, 35, 550–565. [Google Scholar] [CrossRef]
- Wang, G.; Huang, P.; Zhang, Y. Numerical analysis of metal transfer in gas metal arc welding under modified pulsed current conditions. Metall. Mater. Trans. B 2004, 35, 857–866. [Google Scholar] [CrossRef]
- He, L.; Tan, J.Z.M.; Chow, W.T.; Li, H.; Pan, J. Design of novel nozzles for higher interlayer strength of 3D printed cement paste. Addit. Manuf. 2021, 48, 102452. [Google Scholar] [CrossRef]
- Wu, D.; Hu, M.; Huang, Y.; Zhang, P.; Yu, Z. In situ monitoring and penetration prediction of plasma arc welding based on welder intelligence-enhanced deep random forest fusion. J. Manuf. Process. 2021, 66, 153–165. [Google Scholar] [CrossRef]
- Weiss, K.; Khoshgoftaar, T.M.; Wang, D. A survey of transfer learning. J. Big Data 2016, 3, 9. [Google Scholar] [CrossRef]
- Pan, S.J.; Yang, Q. A survey on transfer learning. IEEE Trans. Knowl. Data Eng. 2009, 22, 1345–1359. [Google Scholar] [CrossRef]
- Zhang, H.; Choi, J.P.; Moon, S.K.; Ngo, T.H. A knowledge transfer framework to support rapid process modeling in aerosol jet printing. Adv. Eng. Inform. 2021, 48, 101264. [Google Scholar] [CrossRef]
- Han, W.; Jafari, M.A.; Danforth, S.C.; Safari, A. Tool path-based deposition planning in fused deposition processes. J. Manuf. Sci. Eng. 2002, 124, 462–472. [Google Scholar] [CrossRef]
Disclaimer/Publisher’s Note: The statements, opinions and data contained in all publications are solely those of the individual author(s) and contributor(s) and not of MDPI and/or the editor(s). MDPI and/or the editor(s) disclaim responsibility for any injury to people or property resulting from any ideas, methods, instructions or products referred to in the content. |
© 2025 by the authors. Licensee MDPI, Basel, Switzerland. This article is an open access article distributed under the terms and conditions of the Creative Commons Attribution (CC BY) license (https://creativecommons.org/licenses/by/4.0/).