1. Introduction
Radiotherapy aims to safely, accurately, and efficiently deliver radiation to treat various types of cancer. To ensure these goals are met, comprehensive quality assurance (QA) programs have been implemented. These programs are designed to verify that all components of the radiotherapy process, including the treatment planning system (TPS) and treatment delivery system, function correctly and within the established tolerances. In addition to QA for individual components, additional pre-treatment verification checks are often conducted for each patient. These checks may include independent dose or monitor unit calculations and the use of QA devices such as ionization chambers and diode arrays [
1].
In vivo dosimetry is an indirect method commonly used in radiotherapy to detect so-called gross errors occurring during the radiotherapy planning process. In the case of radiotherapy using external-beam LINAC accelerators (teleradiotherapy), this could, for example, involve the use of a beam with the wrong radiation energy. Generally, in vivo dosimetry refers to the measurement of the dose at a specific point, which may be located within the tumor or in adjacent tissue.
Brachytherapy is a form of internal radiation therapy in which radioactive sources are placed directly inside or very close to a tumor. Unlike external beam radiation, which targets tumors from outside the body, brachytherapy delivers concentrated radiation directly to the cancerous tissue, minimizing exposure to the surrounding healthy tissue. It is commonly used in the treatment of various cancers, including prostate, cervical, and breast cancers, as well as in certain head and neck cancers. The key advantage of brachytherapy is its precision, offering high doses of radiation to the tumor while sparing healthy organs and tissues.
In brachytherapy, an incorrect radiation dose may result from the physiological mobility of organs relative to the radiation source. It is advisable to detect any abnormalities early in the irradiation process, e.g., after 10 percent of the planned therapy time (approximately 10% of the prescribed radiation dose). In the absence of gross errors, routine in vivo measurements provide unique documentation that the treatment was delivered correctly within a user-specified tolerance. Unlike other QA methods, in vivo dosimetry checks the dose delivered to the patient, rather than the individual components prior to treatment. There is growing interest in performing such in vivo measurements, partly due to increased awareness of the potential risks associated with incorrect delivery or planning of radiation treatments.
The so-called
fiber-optic detector (FOD) with compact luminescent sensors, based on optically stimulated luminescence (OSL) measurements [
2] or the detection of radioluminescence (RL) response [
3,
4,
5,
6,
7], is particularly beneficial for radiotherapy applications, especially in
brachytherapy. Their small size allows for easy integration into current brachytherapy equipment, such as urinary catheters, to monitor radiation dose. The delivered dose measured by these sensors can be used to verify the calculated dose distribution, ensuring that the patient receives the intended treatment. Additionally, real-time radiation dose measurements during the brachytherapy procedure enable the optimization of seed placement, leading to higher-quality treatments.
Since the early 1990s, RL-based FODs have gained significant interest for radiotherapy dosimetric applications [
3,
4,
5,
6,
7]. Due to the small size of the scintillator crystals (typically ranging from 1 × 1 × 0.5 mm to 2 × 2 × 1 mm), they can be integrated into the sensing system in various ways, such as by coating the fiber, coupling it with the detector, or embedding it within the fiber itself. The distinct advantages of such systems include real-time dosimetry, compact size, and excellent spatial resolution.
The use of FODs in various medical applications has primarily been related to
small-field dosimetry and in vivo dosimetry. Their use has encompassed both external and internal radiotherapy beams, including
teletherapy and
brachytherapy [
3,
4,
7]. The state of the art regarding the development and characterization of FODs for monitoring ultra-high-dose rate radiation beams, typical of FLASH therapy and microbeam radiotherapy, is also presented in the literature [
3,
4,
5,
6]. Finally, special attention is currently being given to the peculiarities of MRI LINAC dosimetry and the use of FODs in this context [
3].
Over the next two decades, many scintillating materials, both organic and inorganic, have been developed and tested by multiple research groups around the world [
3,
4,
5,
6,
7]. Specifically, plastic scintillators (such as polyvinyltoluene Bicron BC400I) coupled with a polymethyl methacrylate (PMMA) optical fiber have been used as FODs for dose measurements in clinical settings [
3]. It was found that all dose measurements in 10 patients were within 9% of the planned doses [
2]. These results, along with those of other groups [
1,
4,
5,
6,
7] dedicated to the development and use of FODs based on different scintillation materials, support positive predictions for the future use of such systems in various medical applications, as is also demonstrated in our work. In parallel, reliable techniques for removing or subtracting the stem effect, one of the main drawbacks of FODs, have been explored [
4,
6].
Generally, the choice of scintillator material for FODs determines the conditions under which patients are irradiated. In the case of light scintillators, including plastics or inorganic materials, they can be placed in the “
in front of the tumor” geometry. However, if the scintillator head needs to be placed in the “
behind the tumor” geometry, scintillators with high densities and high Z
eff are strongly preferred [
7].
The literature identifies several factors that may cause differences between predicted and measured doses, including:
- (i)
stem effects, caused by the intrinsic luminescence and Cherenkov radiation from the fiber-optic cable [
4,
6];
- (ii)
uncertainty regarding the location of the dosimeter in relation to the patient’s computed tomography (CT) plan [
7];
- (iii)
a shift in the relative position of the source catheters since the CT plan was made [
7]. Initial studies in this work were conducted using a dedicated phantom to eliminate the last two potential errors (related to the displacement of the detector relative to the CT image and the position of the radiation source) and assess the correct operation of the developed FODs.
This article presents an introduction to the development of effective fiber-optic detector (FOD) systems based on the combination of well-known scintillation crystals, long optical fibers, and sensitive luminescent spectrometers for the detection of γ-ray doses used in brachytherapy. Our solution, which utilizes optical fibers coupled with small, commercially available Ce3+-doped crystals of Y3Al5O12 (YAG:Ce), Lu3Al5O12 (LuAG:Ce), and Gd3Al2.5Ga2.5O12 (GAGG:Ce) garnets as FOD scintillation heads, offers several advantages over the existing systems. The selection of these specific crystals is based on their high scintillation efficiency, excellent energy resolution, and their proven applicability in radiation detection, making them suitable candidates for real-time dosimetry in brachytherapy applications. The spectral range of Ce3+ emission in the mentioned garnets in the visible range is well-matched with the sensitivity range of compact commercial spectrometers, eliminating the need for specialized optics for the UV range (such as with d–f emission of Pr3+-doped materials).
Another rationale for using garnet-based scintillators is their excellent radiation and optical stability, particularly when compared to plastic scintillators. This is especially critical for high-dose radiotherapy. Garnet crystals such as YAG, LuAG, and GAGG are known for their exceptional radiation hardness. Specifically, radiation-induced instability in these host crystals is typically observed at ion fluences exceeding 10
10 ions/cm
2 [
8,
9]. For γ-ray excitation, visible changes in LuAG:Ce single-crystalline films are observed only after doses surpassing 10
5 Gy [
10]. This remarkable resistance to radiation makes these materials highly promising for use in dosimetric systems designed to operate over extended periods under high-energy ionizing radiation conditions.
2. Materials and Experimental Equipment
The scintillation materials chosen for producing FOD heads were commercially available crystals of well-known YAG:Ce, LuAG:Ce, and GAGG:Ce garnets (
Table 1). These crystals were grown using the Czochralski method at high temperatures (1970 °C, 2030 °C, and 1850 °C, respectively) in an Ar + (1–1.5%) O
2 atmosphere. The Ce
3+ concentration in these crystals was approximately 0.1 at.%, 0.05 at.%, and 0.03 at.%, respectively. The light yield (LY) of these crystals was 12,800, 24,500, and 42,200 photons per MeV under excitation by γ-rays from a
137Cs source (
Table 1).
To characterize the optical properties of the mentioned materials, cathodoluminescence (CL) spectral measurements of these crystals at room temperature (RT) were conducted using a JEOL JSM-820 scanning electron microscope (JEOL Ltd., Tokyo, Minato-ku, Japan) with an electron beam energy of 20 kV. A StellarNet grating spectrometer (StellarNet, Inc., Tampa, FL, USA), equipped with a CCD camera, working in the 200–1200 nm range, was used to collect the spectra.
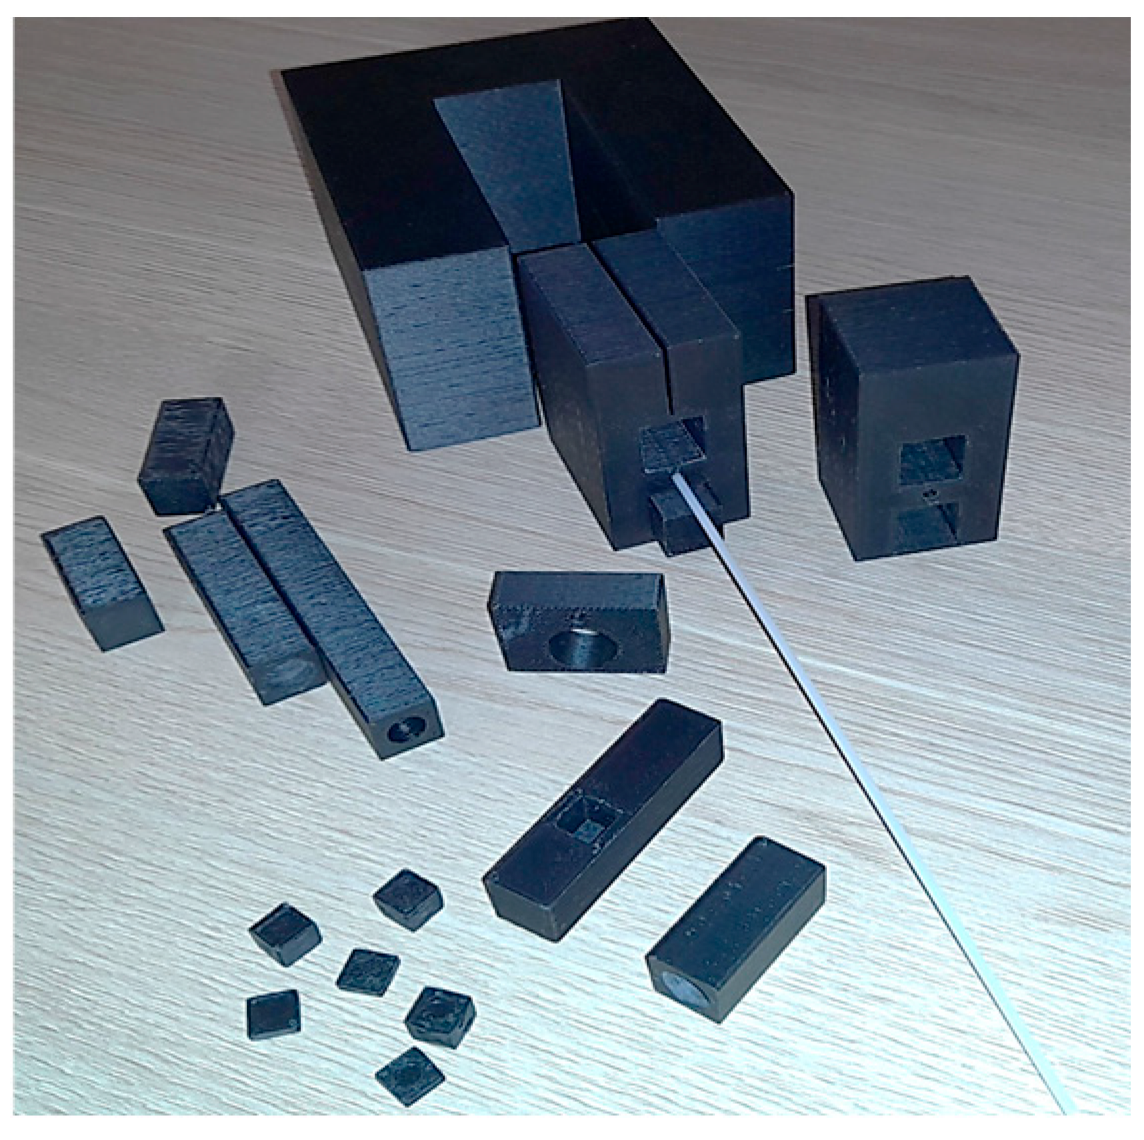
All measurements of the dependence of the intensity of RL spectra from crystal detectors on the irradiation dose in the 0.5–8 Gy range, using a
192Ir γ-ray source, were performed using a specially prepared HIP calibration phantom. The phantom was fabricated with a Zortrax M200 Plus 3D printer (Olsztyn, Warmia-Masuria Province, Poland) (
Figure 1) to place the FOD head, based on the garnet crystal scintillators under study, with dimensions of 2 × 2 × 0.5 mm, coupled with a long PMMA optical fiber and the γ-ray source. Plastic brachytherapy needles, typically used at the Oncology Center for γ-ray treatments, were inserted into the phantom (
Figure 1).
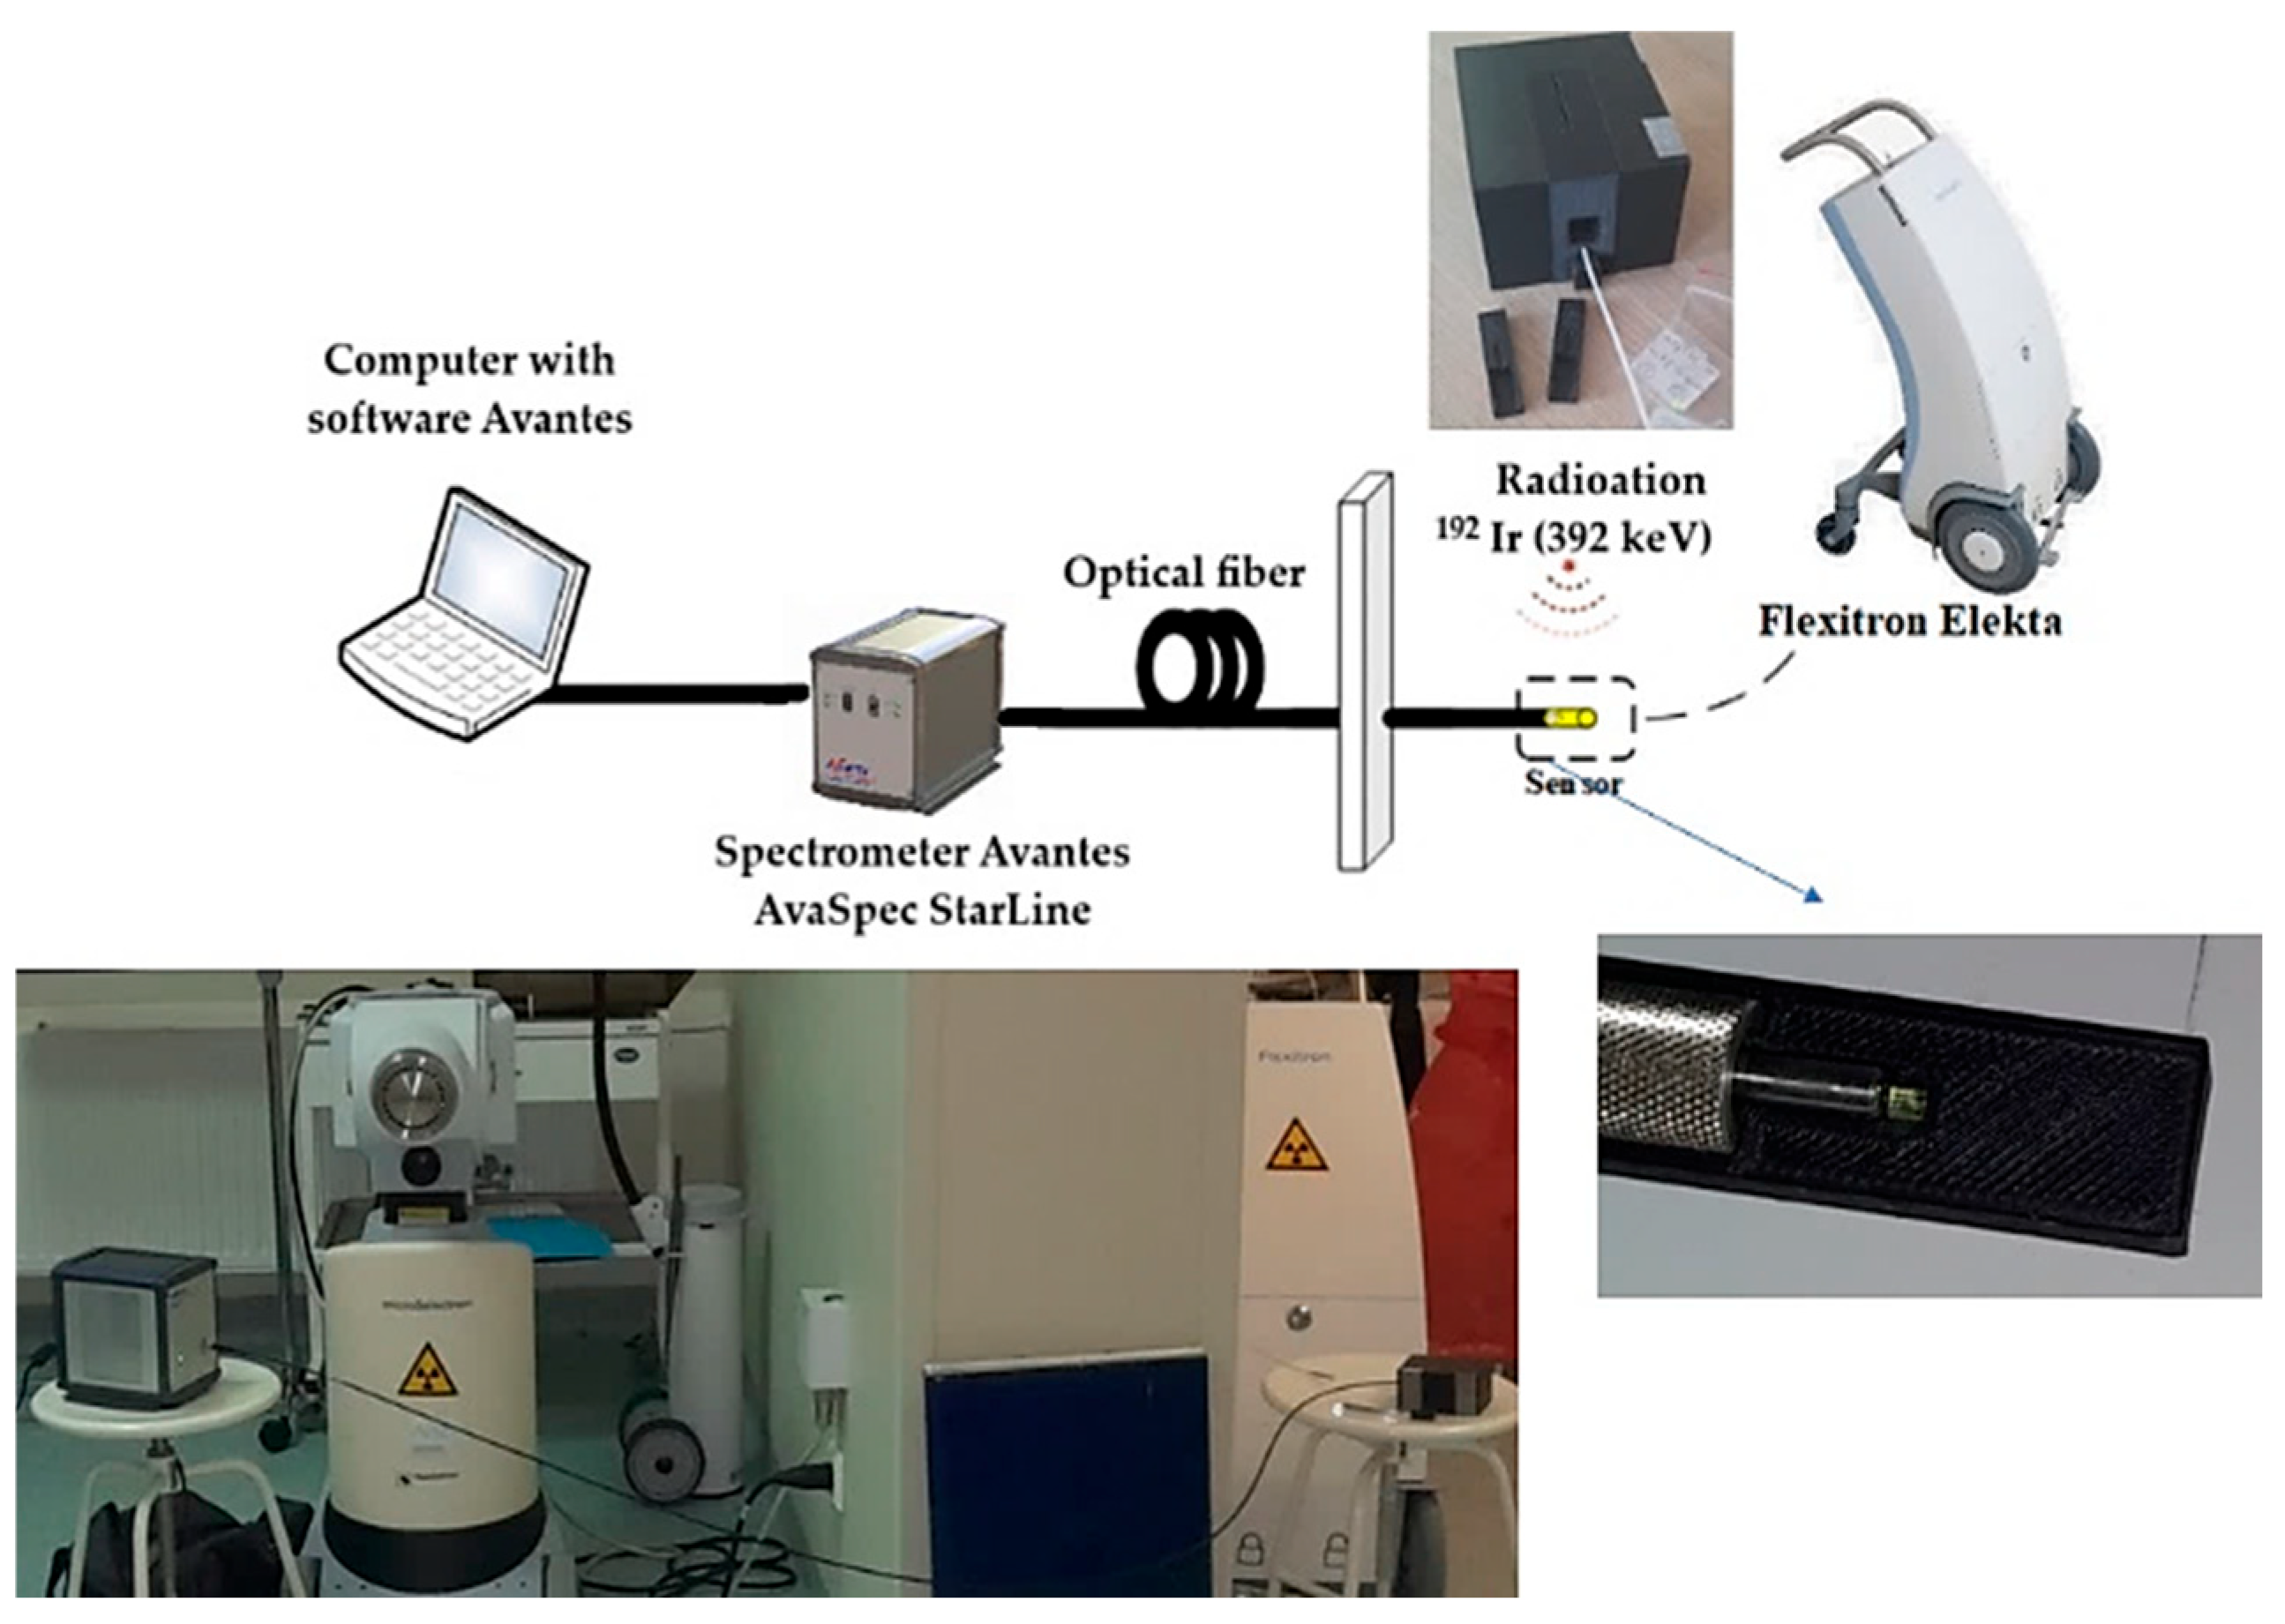
A measurement setup for in situ dose measurement (
Figure 2) was developed at the Oncology Center in Bydgoszcz, utilizing the Flexitron HDR system [
11] equipped with 40 working channels, offering a source positioning accuracy of 0.5 mm and a
192Ir (392 keV) isotope (Nucletron, Veenendaal, The Netherlands, an Elekta company) as the γ-ray source, with a current activity of 5.85 Ci when using YAG:Ce and LuAG:Ce scintillators, and a current activity of 7.2 Ci when using the GAGG:Ce scintillator.
The RL spectra from the crystal detector were recorded in the 320–1200 nm range using an AvaSpec-HERO luminescence spectrometer from Avantes (Nynomic AG, The Nederland) [
12], with a 700 ms readout time interval throughout the entire delivery of the respective dose in the 0.5–8 Gy range. The cutoff of UV light (<320 nm) was caused by the glass optics of the spectrometer. The measurement setup was located in a room separated from the operator, who managed the system using dedicated control and data acquisition software of the AvaSpec-HERO spectrometer. This software was specifically designed for the precise and accurate collection and analysis of luminescence signals during measurements. The spectrometer was connected to the phantom via a 3.5 m long optical fiber, which ended with a chosen scintillator crystal (
Figure 2). The distance between the scintillator head and the γ-ray source was 1 cm. The dose delivery times for the YAG:Ce and LuAG:Ce scintillators were 12, 23, 47, 96, 144, and 192 s for the doses of 0.5, 1, 2, 4, 6, and 8 Gy, respectively. For the GAGG:Ce scintillator, the corresponding delivery times were 9, 21, 39, 78, 117, and 156 s.
3. Treatment Plan and Dose Distribution Measurement
Oncentra software version 4.5.3 (Elekta AB, Stockholm, Sweden) was used for dose distribution planning in brachytherapy treatment [
13]. This is a key element in generating a feasible brachytherapy procedure. Creating a highly consistent plan is an extremely important task for both treatment and planned measurements. An example plan for a phantom is shown in
Figure 3, which displays the dose distribution in various tomographic sections of the phantom.
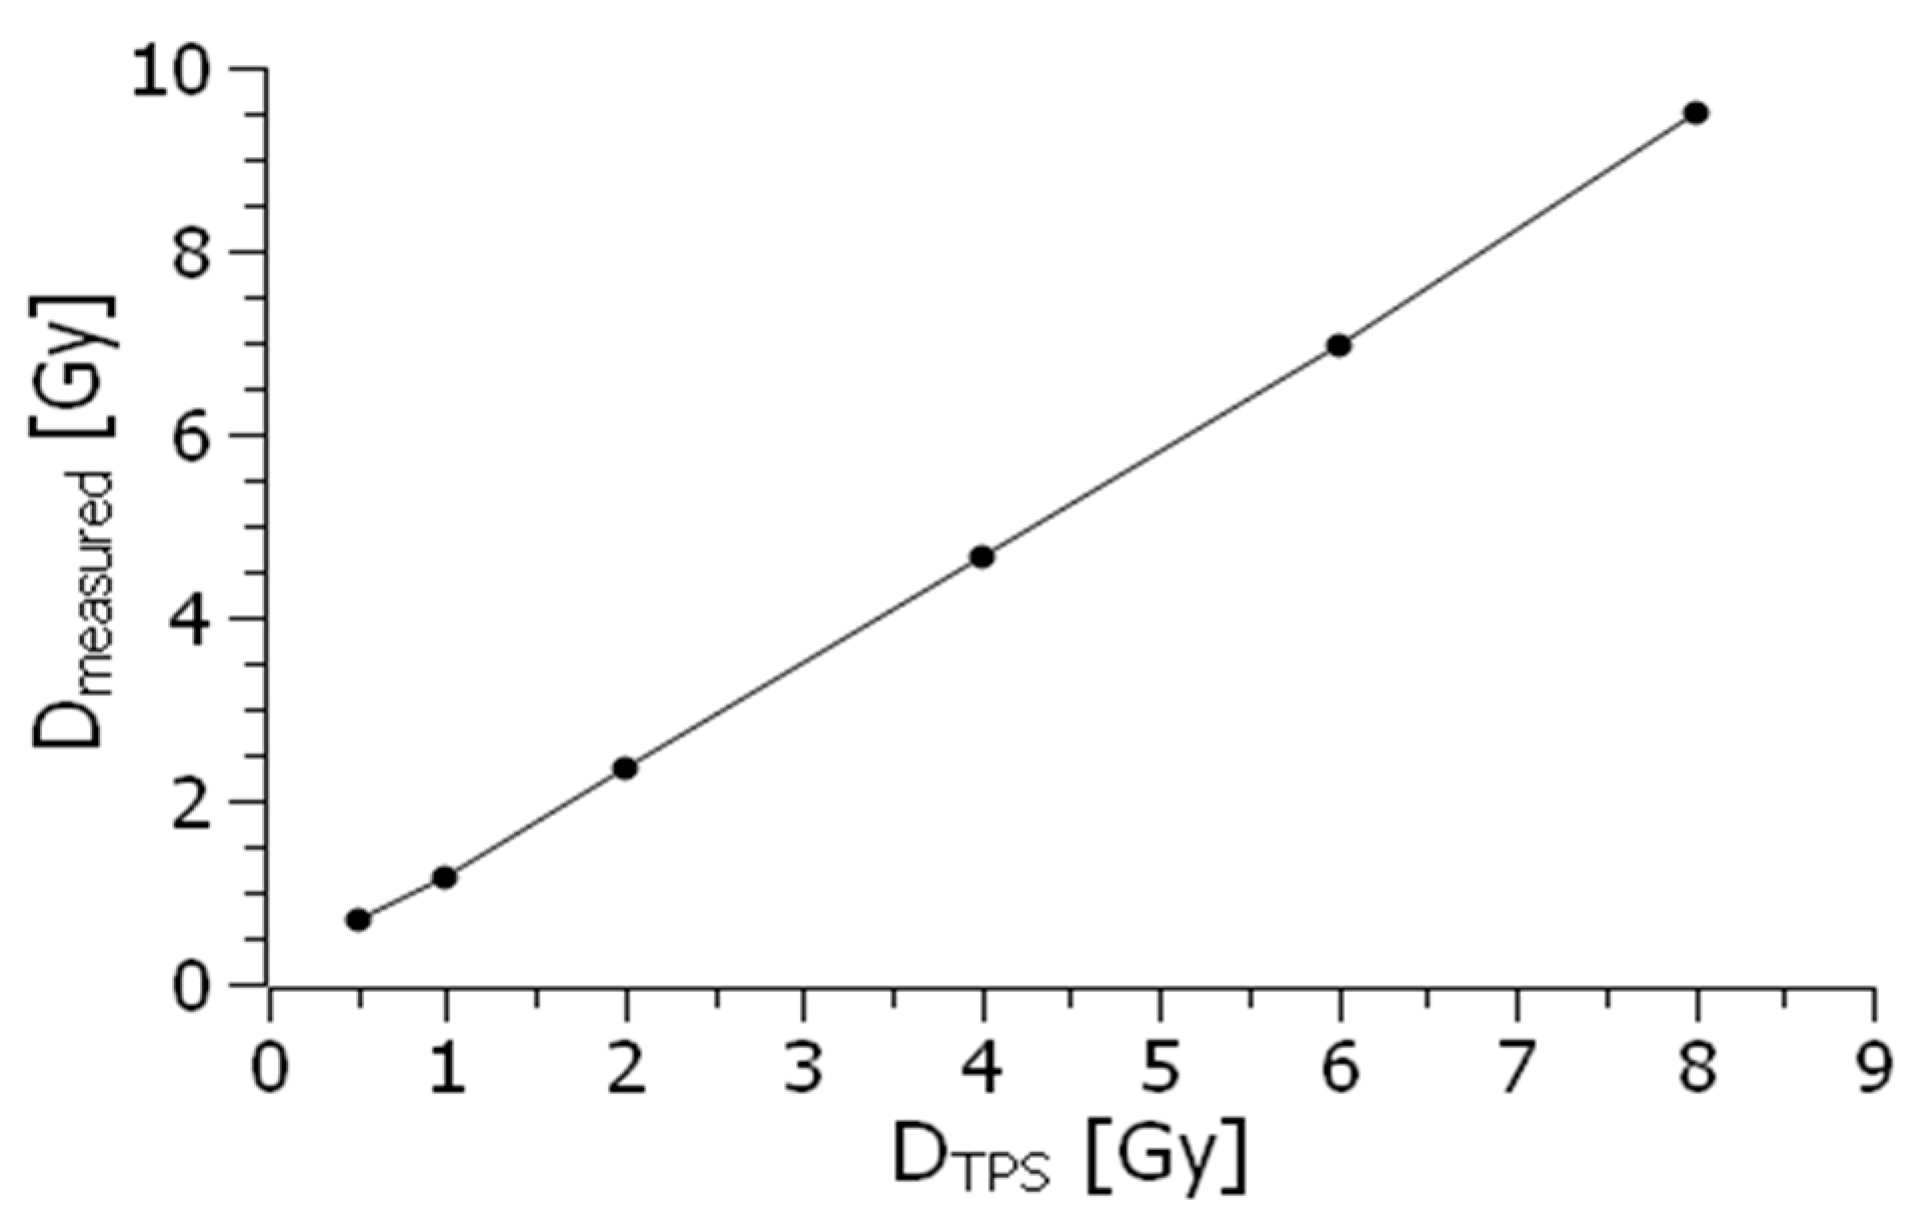
The accuracy of dosimeter measurements is defined as the ratio between the expected or theoretical radiation dose and the actual dose recorded by the device. This metric reflects how close the measured value is to the true value, providing an indication of how reliable the dosimeter is in reflecting the real level of radiation exposure. On the other hand, the precision of dosimetry measurements refers to the consistency or reproducibility of the readings when measurements are repeated under identical conditions. Precision is an important aspect, as it demonstrates the reliability of the dosimeter in producing consistent results over multiple trials.
Precision can be quantitatively assessed by analyzing the variation in data obtained from repeated measurements, thereby indicating the stability and repeatability of the dosimeter’s performance. Together, both accuracy and precision are critical in evaluating the overall performance of dosimeters in various settings, ensuring that they provide reliable data for radiation safety and monitoring. To ensure that our HIP phantom provides repeatability and precision of measurements, it was also tested using a typical PTW Farmer ionization chamber [
14]. The graph showing the relationship between the dose measured using this conventional ionization chamber and the dose in the 0.5–8 Gy range generated by the TPS is presented in
Figure 4.
Ideally, the dosimeter reading should have a linear relationship with the dosimetric quantity. However, at lower dose levels, nonlinearity often occurs. The extent of this linearity and the nature of the nonlinearity depend on the type of dosimeter and its physical properties. In general, any nonlinear behavior should be corrected. Both the dosimeter and its reader may individually exhibit nonlinear characteristics. When combined, maintaining linearity over a broader range would require careful calibration and compensation of each component, and cannot be assumed as a general feature without proper adjustment.
4. Results
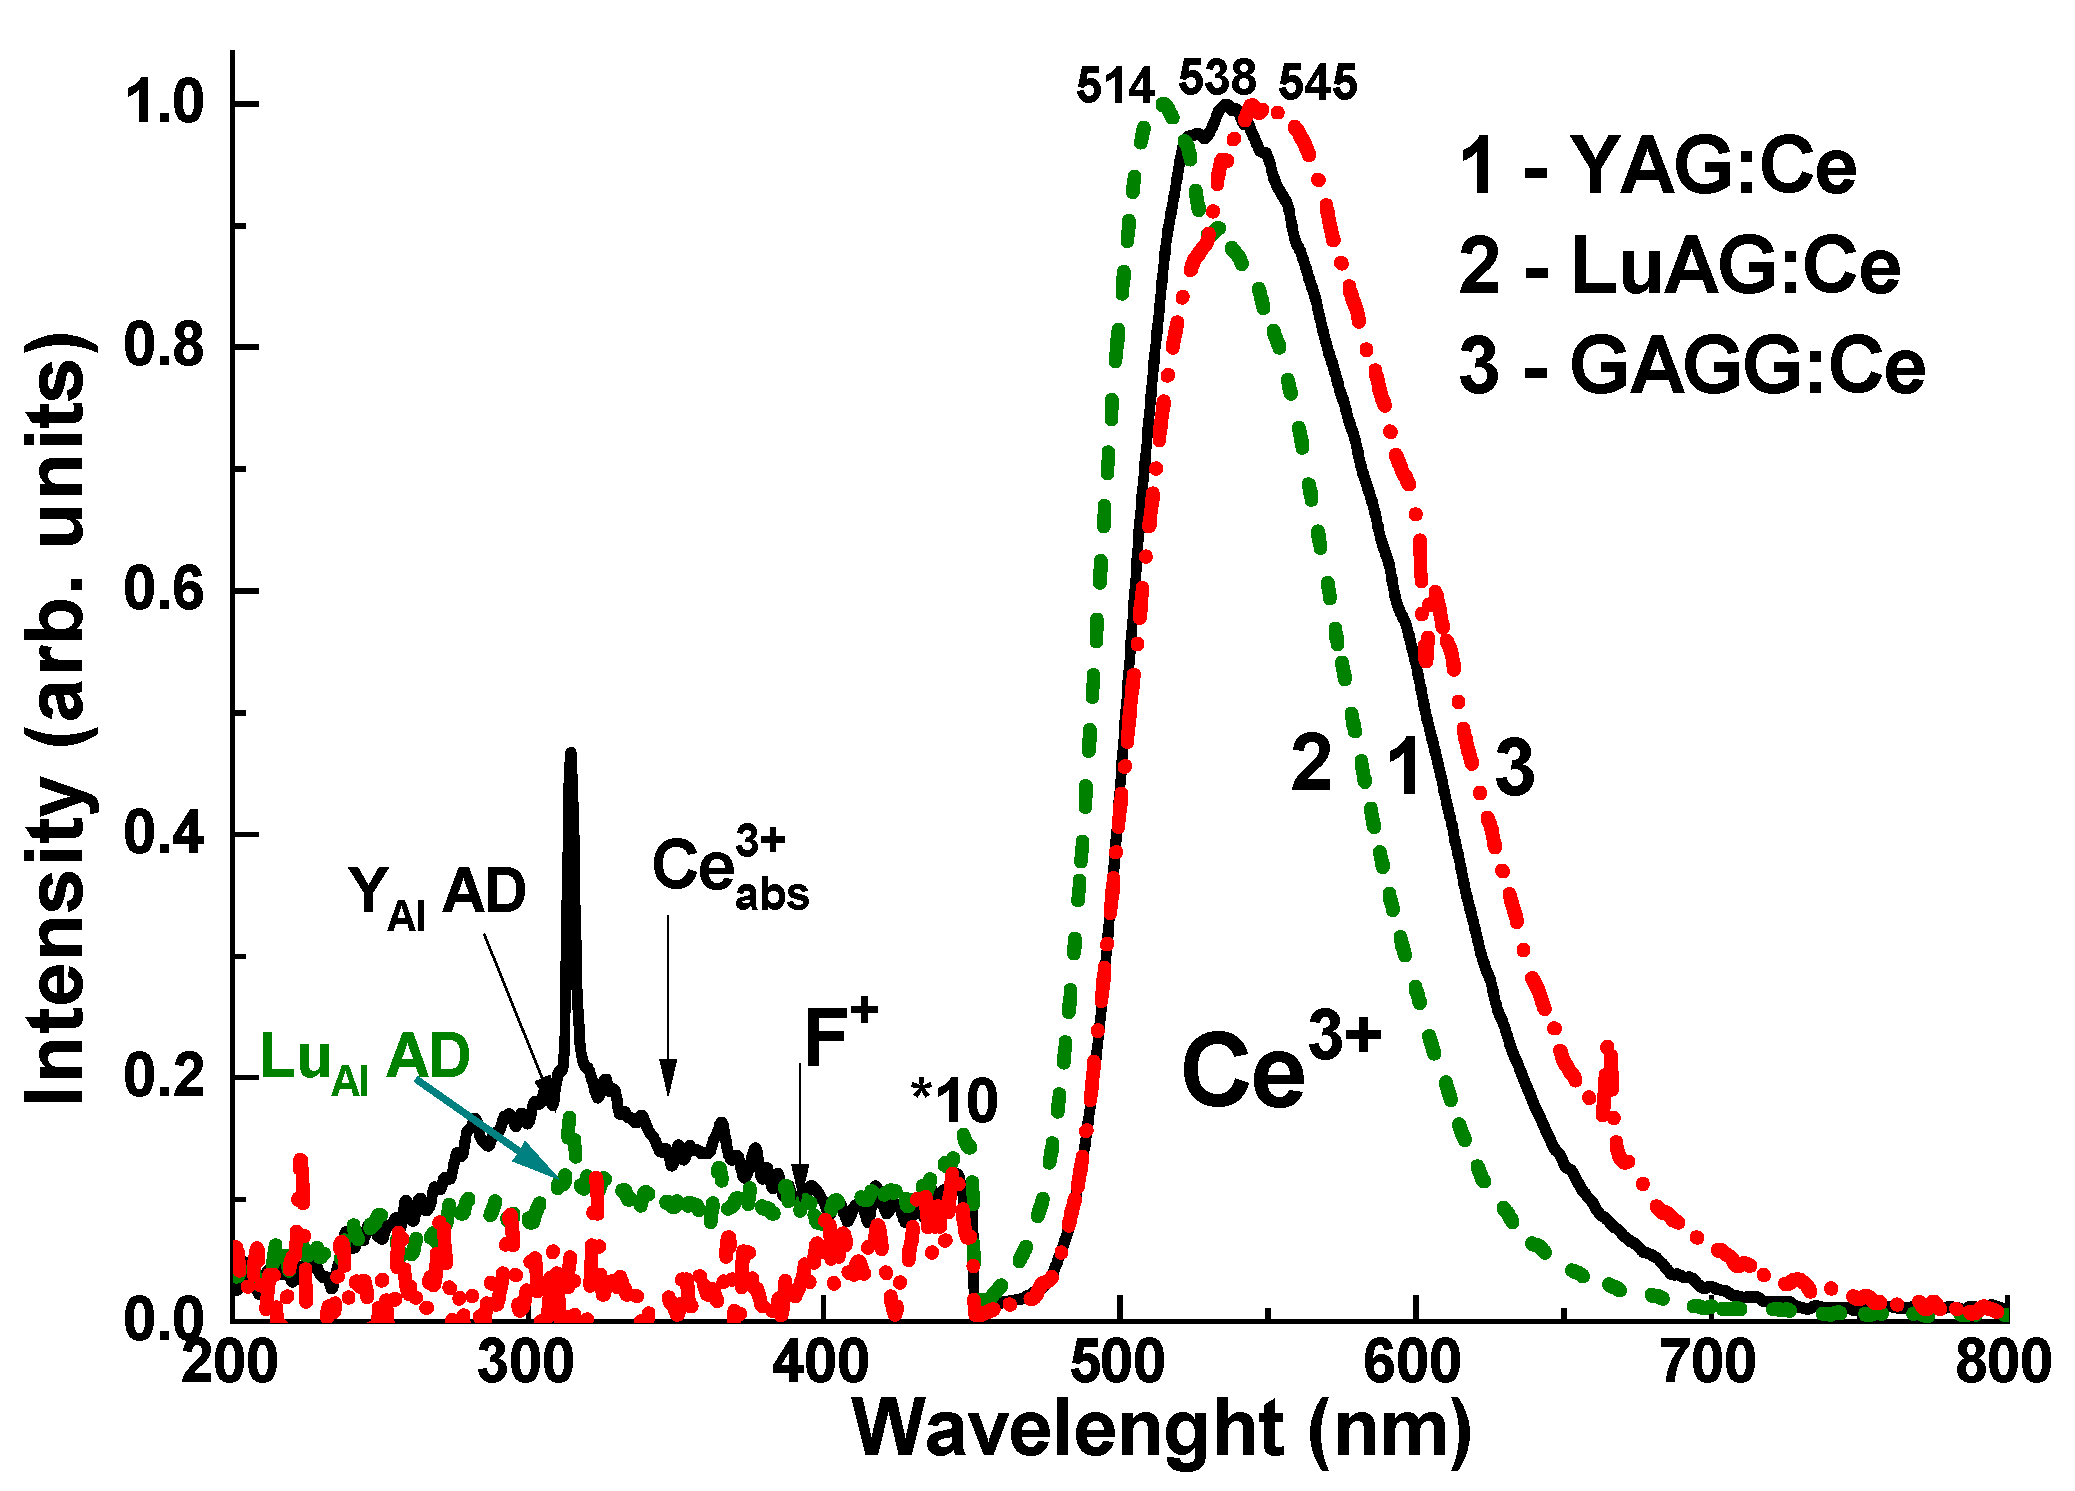
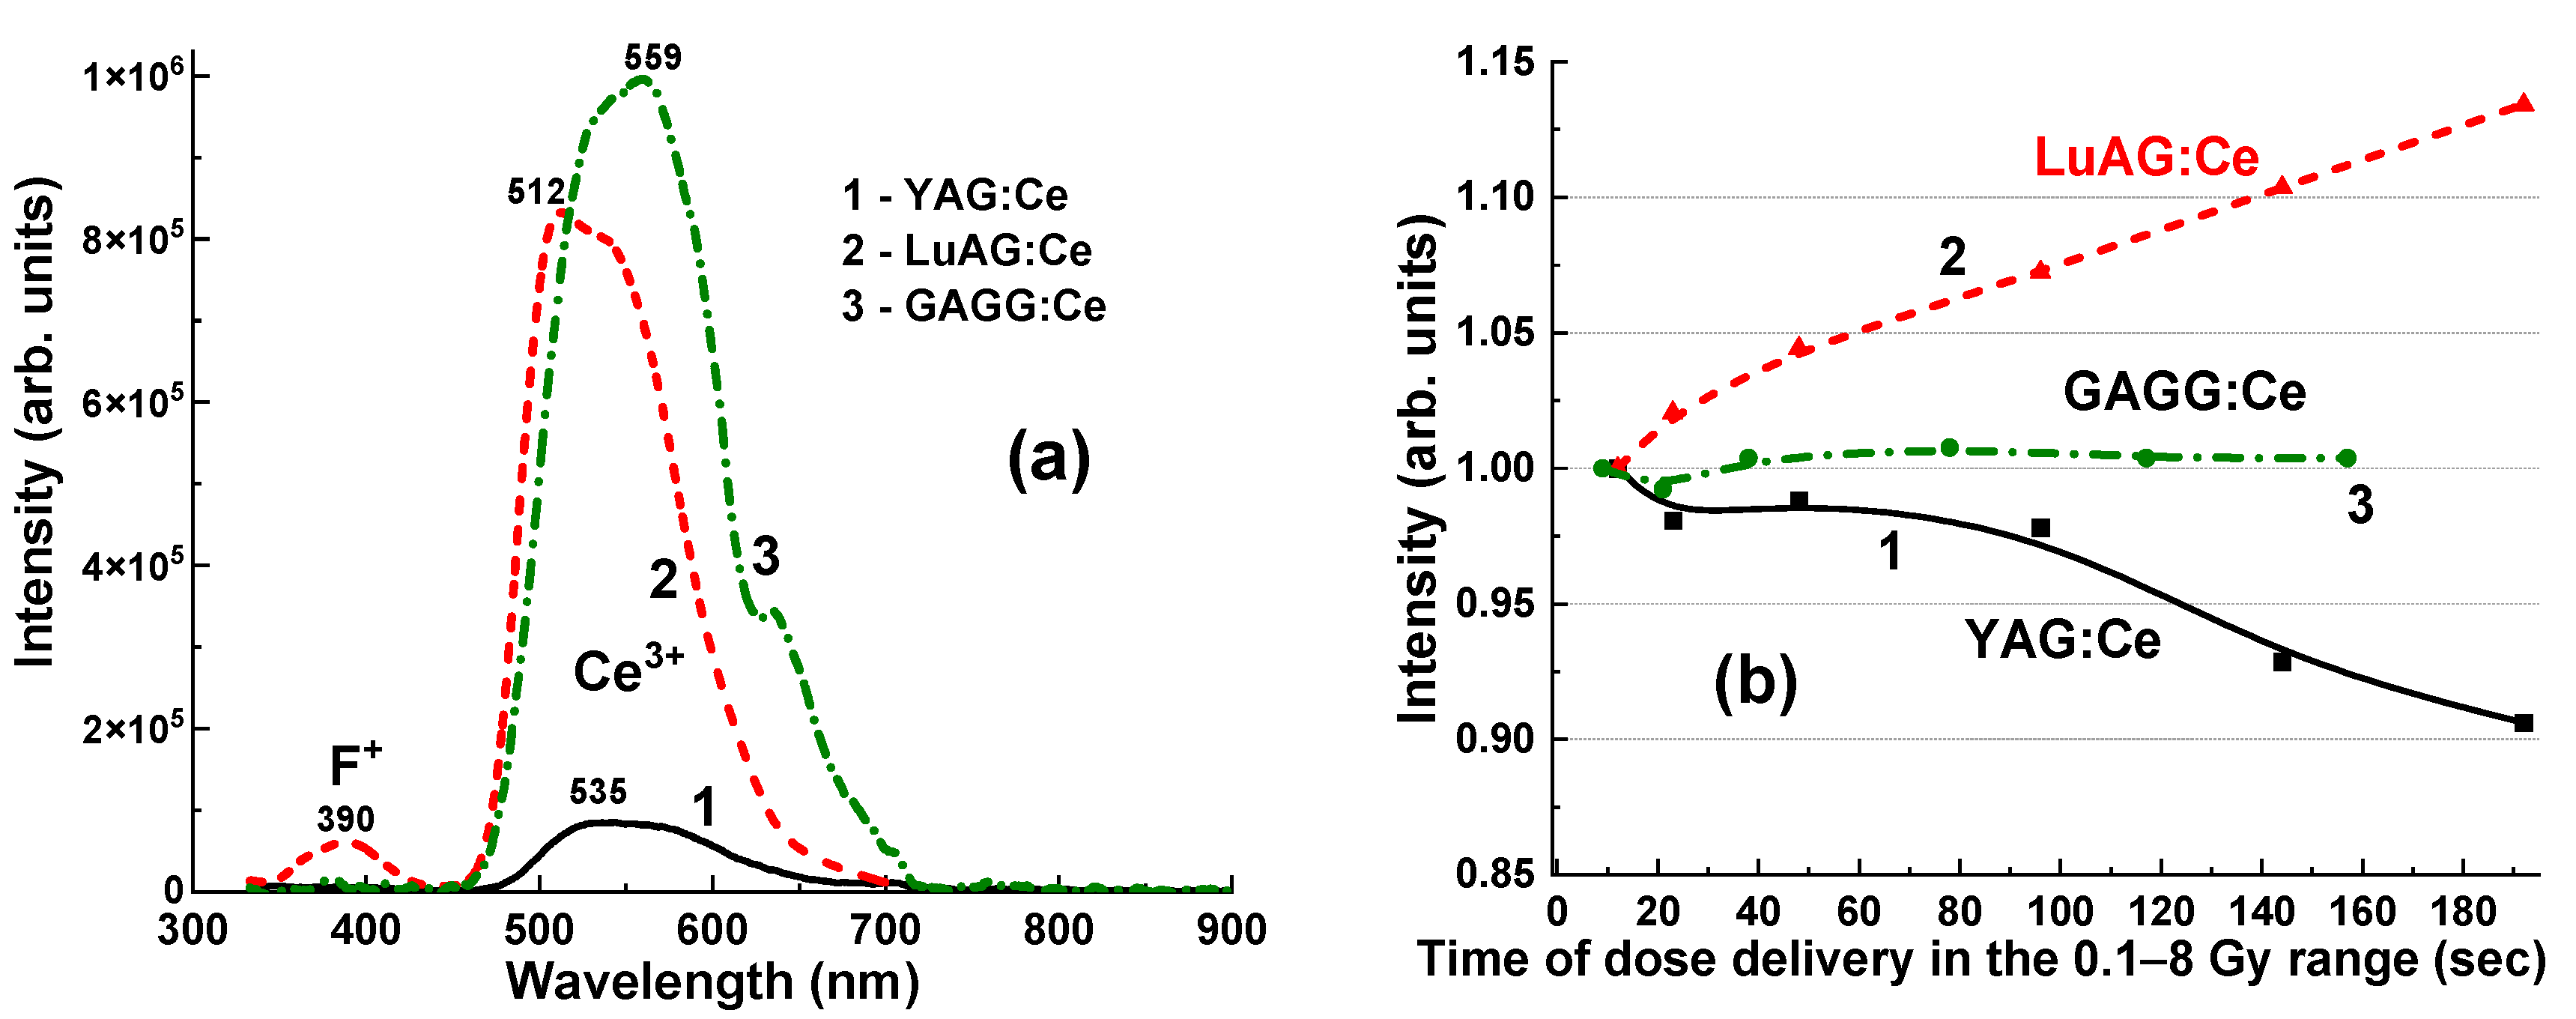
The normalized CL spectra of the YAG:Ce, LuAG:Ce, and GAGG:Ce crystals are presented in
Figure 5. Adding the Ce
3+ dopant to these garnet hosts causes intense yellow-green luminescence under excitation by high-energy quanta or particles. The emission bands, which peak between 514–545 nm in the visible range, are associated with 5d
1–4f transitions of Ce
3+ ions. The observed red shift of the Ce
3+ emission spectra across the series of LuAG:Ce, YAG:Ce, and GAGG:Ce crystals is caused by an increase in the crystal field strength in the dodecahedral positions of the garnet host, where the Ce
3+ ions are localized. This shift occurs as the radius of the cations increases from 0.977 Å for Lu
3+ to 1.053 Å for Gd
3+ [
15].
In the UV range, the CL (
Figure 5) and RL (
Figure 6a) spectra of YAG:Ce and LuAG:Ce crystals show low-intensity luminescence bands corresponding to Y
Al and Lu
Al antisite defects (ADs), peaking at 320–330 nm [
16], and F
+ centers, peaking at 385–400 nm [
17]. The spectral positions of these bands are well-overlapped with Ce
3+ absorption bands in these garnet hosts, which peak at 340–345 nm (
Figure 5). For this reason, AD emissions also excite Ce
3+ luminescence in YAG:Ce and LuAG:Ce crystals [
18]. In addition to the emission centers in the UV range, Y
Al and Lu
Al ADs can act as trapping centers [
19], causing a delay in the transfer of energy from the garnet host to the Ce
3+ emission centers. We can assume that this effect is more likely related to trap filling in the scintillation materials. This may also explain some changes in the intensity and LY of the Ce
3+ emission bands in these crystals, depending on the recording time (
Figure 6b). Specifically, YAG:Ce crystal detectors showed a small decrease (from 100% to 92%) in the Ce
3+ emission band intensity when the irradiation time increased from 12 s to 192 s, and the irradiation dose increased from 0.5 to 8 Gy.
On the contrary, the intensity of the Ce
3+ emission band in the LuAG:Ce crystal detector increased from 100% to 112% as the irradiation time and the delivered dose increased. Moreover, these phenomena can play an important role in the registration of the total emission intensity of YAG:Ce and LuAG:Ce crystal detectors, which is proportional to the exposure time for the delivery of the respective dose (
Figure 7 and
Figure 8).
Meanwhile, the GAGG:Ce crystal exhibits negligible emission from AD-related centers in the UV range as a result of the so-called band gap engineering [
20]. This occurs due to the populating of the energetic levels of the Gd
Ga and Gd
Al AD centers through the lower levels of the conduction band, primarily formed by the 3d levels of Ga
3+ cations [
21] (
Figure 5, curve 3). This may present a significant advantage of the GAGG:Ce crystal compared to its YAG:Ce and LuAG:Ce counterparts in terms of the stability of the Ce
3+ luminescence intensity as a function of irradiation time (dose) (
Figure 6b).
It is worth noting that, even with a relatively medium density and effective atomic number, the YAG:Ce crystal exhibits a very high RL level across all γ-ray radiation doses in the 0.5–8 Gy range, with values ranging from 0.5 × 10
4 to 8.5 × 10
4 units (
Figure 7a). The dependence of the RL intensity of the Ce
3+ band for the YAG:Ce crystal detector on the radiation dose within this range is shown in
Figure 7b. This relationship demonstrates good linearity from 0.5 to 5 Gy, with some sub-linearity above 5 Gy (
Figure 7b), most likely due to the respective changes in the intensity and light yield (LY) of the Ce
3+ emission bands in these crystals depending on the recording time (
Figure 6b). The obtained data were approximated by the dashed lines, and the R
2 value (coefficient of determination) in
Figure 7b describes how well the approximated model fits the experimental data. The R
2 value means the following: (i) R
2 = 0: this means the model does not explain any of the variance in the data; (ii) R
2 = 1: this means the model perfectly explains all the variance in the data; (iii) 0 < R
2 < 1: this range indicates the degree to which the model explains the variability in the data.
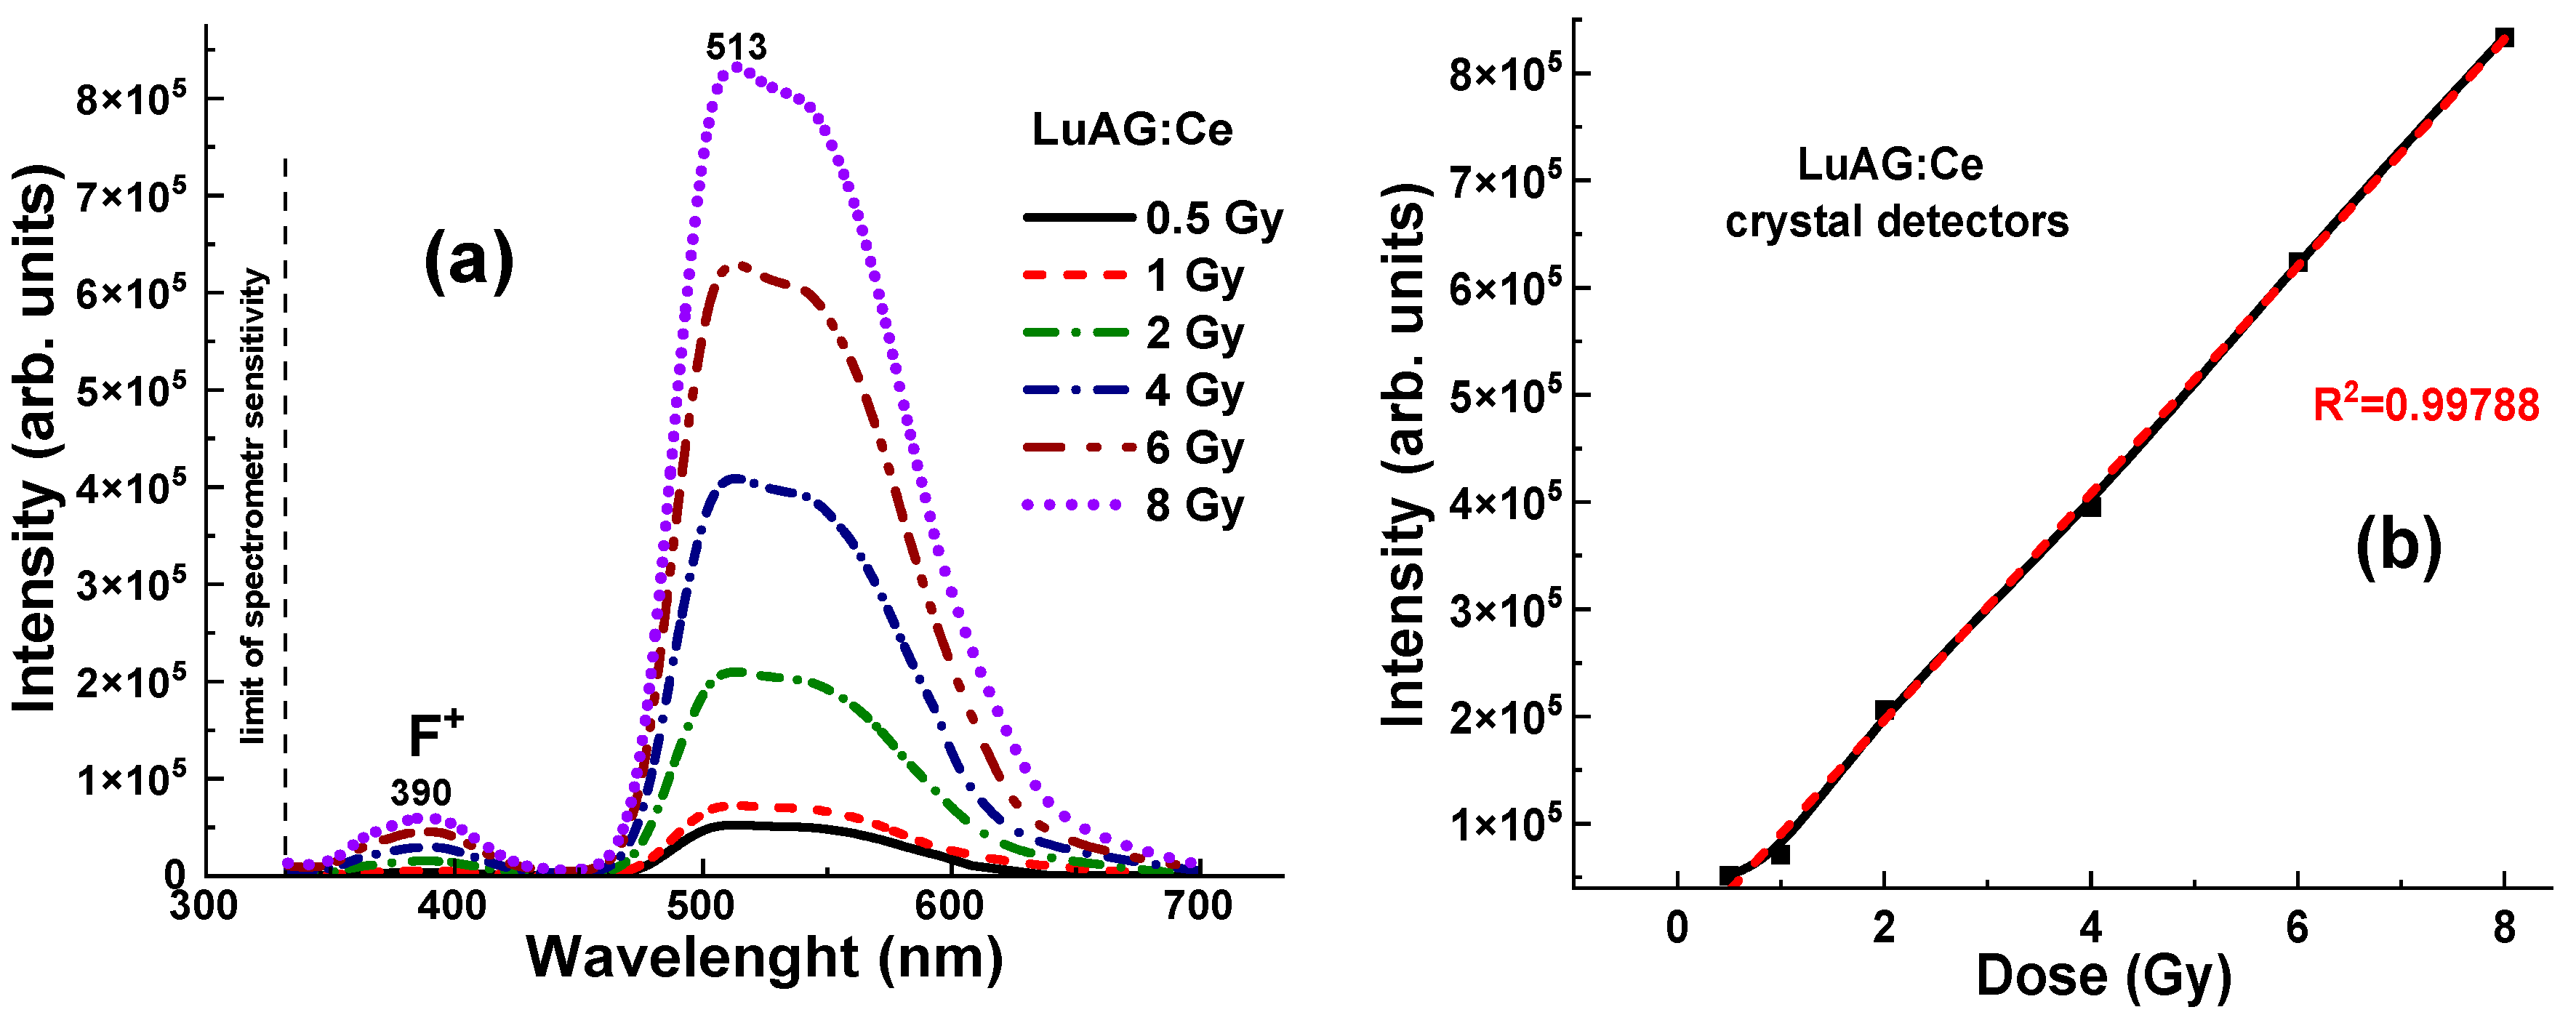
On the contrary, the LuAG:Ce crystal, with its higher light yield (LY), density, and effective atomic number compared to YAG:Ce, showed a significantly higher level of radioluminescence (RL) at all γ-ray radiation doses in the 0.5–8 Gy range, which is in the range of 0.55–8.3 × 10
5 units (
Figure 8a). The dashed lines and the R
2 values describe how well the approximated model fits the data.
The GAGG:Ce crystal, with its moderate density and effective atomic number between YAG:Ce and LuAG:Ce, showed the highest level of radioluminescence (RL) at γ-ray radiation doses in the 0.5–8 Gy range, which is in the range of 0.6–1.03 × 10
6 units (
Figure 9a). The dependence of the RL intensity of the Ce
3+ band for GAGG:Ce crystal detectors on the radiation dose in the mentioned range is shown in
Figure 9b. However, unlike YAG:Ce and LuAG:Ce crystals, this relationship for GAGG:Ce crystal detectors shows excellent linearity throughout the entire 0.5–8 Gy range (
Figure 9b).
5. Discussion
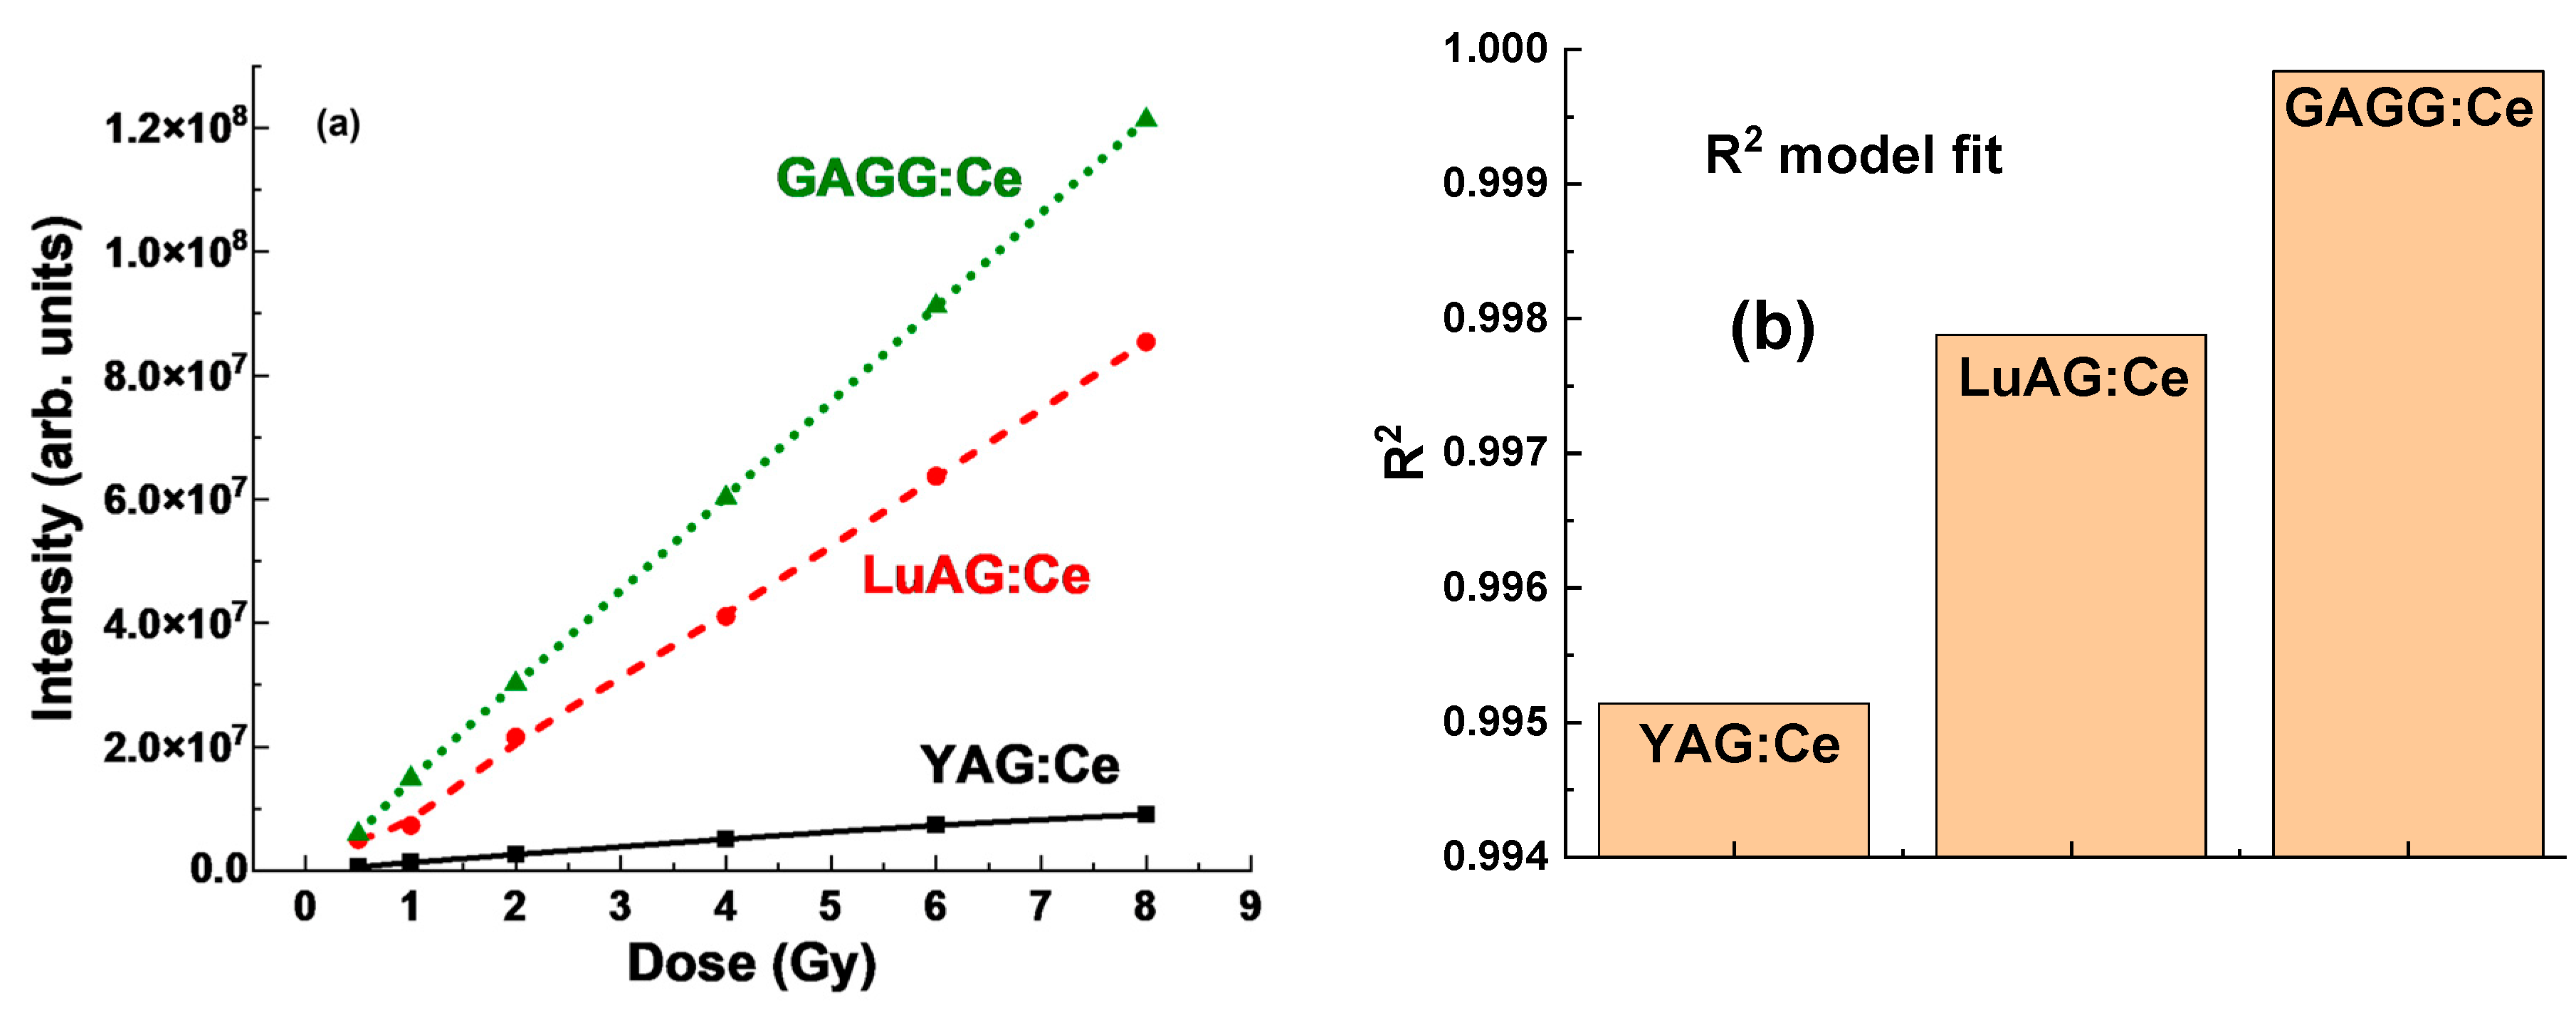
Generally, the term “dose–intensity relationship” refers to the observed patterns in
Figure 7b,
Figure 8b,
Figure 9b and
Figure 10, where increasing doses (
x-axis) correspond to a significant rise in the RL intensity of the response (
y-axis). This relationship highlights the proportional effect of the delivered dose on the intensity of the RL response. Furthermore, the RL intensity units in
Figure 10 are arbitrary but consistent across all three crystals under study, ensuring that the relative intensities can be reliably compared.
Significant differences in RL intensity between YAG:Ce and LuAG:Ce crystals suggest that the YAG:Ce detector is much less efficient in its RL response to γ-ray radiation (see
Figure 6 and
Figure 10). In contrast, the higher Z
eff in LuAG:Ce crystals appears to enhance the RL efficiency (
Figure 8), likely due to better photon interaction and energy absorption. The LuAG:Ce crystal detector shows a much more linear dose–intensity relationship compared to YAG:Ce (
Figure 7b and
Figure 10). This characteristic makes LuAG:Ce crystals potentially more reliable materials for dose measurement of γ-ray radiation than YAG:Ce crystals.
However, there was also an observed nonlinearity in the dose–response relationship for the LuAG:Ce crystal up to 1 Gy (see
Figure 8b). This nonlinearity could indicate that at lower doses, the mechanisms of energy absorption and transfer within the crystal are not directly proportional to the dose. This may be due to defect-related trapping and detrapping processes of charge carriers, which strongly affect the energy transfer process in the LuAG:Ce crystal. Understanding and accounting for this nonlinearity is crucial when using the LuAG:Ce detector in applications that require the quantification of radiation doses in the low-dose range.
In comparison to YAG:Ce and LuAG:Ce, the GAGG:Ce crystal (
Figure 10) offers a promising compromise for dosimetric applications due to its excellent physical and luminescent properties. The GAGG:Ce crystal exhibits a more linear dose–response relationship, particularly in the low-dose range where nonlinearity is often problematic. Its density and effective atomic number Z
eff lie between those of YAG:Ce and LuAG:Ce, resulting in moderate photon interaction and energy absorption characteristics. This makes GAGG:Ce a suitable material for applications requiring a balance between the high sensitivity of LuAG:Ce crystals and the lower efficiency of YAG:Ce crystals.
The excellent linear behavior of the GAGG:Ce crystal detector with respect to the dose of irradiation (
Figure 9b and
Figure 10b) allows for more predictable dosimetric readings without the pronounced nonlinearity observed in LuAG:Ce at lower doses, thus reducing the need for corrections in the low-dose region. Consequently, the GAGG:Ce crystal is a reliable material for situations that demand consistent performance across a wider dose range, combining high luminescent efficiency with enhanced linearity, making it an attractive option for practical dosimetry.
6. Conclusions
Our study demonstrates that single YAG:Ce, LuAG:Ce, and GAGG:Ce crystals exhibit favorable luminescent and scintillation properties, making them promising candidates for fiber-optic dosimeter (FOD) heads for in situ dose measurements during brachytherapy treatments. Experimental evaluations revealed distinct differences in the intensity and integrated areas of the Ce3+ luminescence bands across the tested garnet crystals, corresponding to varying radiation doses in the 0.5–8 Gy range. These variations in peak intensity and peak area are critical for determining the sensitivity and linearity of dose measurements.
The specific “peak intensity/area vs. dose” responses observed for each material highlight their unique luminescent behavior under radiation exposure. This suggests that the selection of YAG:Ce, LuAG:Ce, or GAGG:Ce as a crystal detector can be optimized based on the specific requirements of a brachytherapy application. In other words, each crystal offers distinct advantages depending on the desired sensitivity, accuracy, and dose range, allowing for tailored solutions in clinical dosimetry.
Among the materials tested, the LuAG:Ce crystal detector demonstrated a greater potential for dosimetric applications in the 1–8 Gy dose range compared to the YAG:Ce crystal. This enhanced performance can be attributed to LuAG:Ce’s higher density and effective atomic number (Zeff), which contribute to greater γ-ray absorption and, consequently, a more intense Ce3+ luminescence response. Under γ-ray excitation from a 192Ir source (394 keV), the LuAG:Ce crystal detector exhibited higher peak intensities and larger emission areas in the Ce3+ band relative to YAG:Ce. Moreover, LuAG:Ce exhibited a more linear dose–intensity relationship, an important characteristic for accurate and reliable dose quantification, especially at higher radiation levels. This improved linearity and efficiency suggest that LuAG:Ce is particularly well-suited for in situ dosimetry in brachytherapy environments, where higher radiation doses are employed, offering more accurate and responsive measurements than its YAG:Ce counterpart.
Finally, the GAGG:Ce crystal detector demonstrated superior scintillation performance among all studied crystals for dosimetric applications. While LuAG:Ce excelled at higher radiation doses due to its greater density, Zeff, and more intense luminescent output, GAGG:Ce offered a well-balanced performance, particularly suited for low-dose applications. Notably, GAGG:Ce exhibited an excellent linear dose–response relationship in the lower dose range (0.5–1 Gy), where the LuAG:Ce detector tended to show nonlinearity. This makes GAGG:Ce a reliable choice for scenarios requiring accurate and consistent measurements across a broader dose spectrum. Its effective atomic number (Zeff), lying between YAG and LuAG, enables moderate photon interaction and energy absorption, allowing for reasonable sensitivity without the need for corrections at lower doses.
In summary, all the garnet crystals studied, YAG:Ce, LuAG:Ce, and GAGG:Ce, demonstrate strong potential as scintillating materials for in situ dose measurement in brachytherapy. The distinct differences in their luminescence responses and dose–intensity behaviors offer valuable insights for selecting the most suitable crystal type based on specific clinical requirements and targeted radiation dose ranges.


