
Using Second-Harmonic Generation Microscopy Images of Bee Honey Crystals to Detect Fructose Adulteration

 , , and
Abstract
1. Introduction
2. Materials and Methods
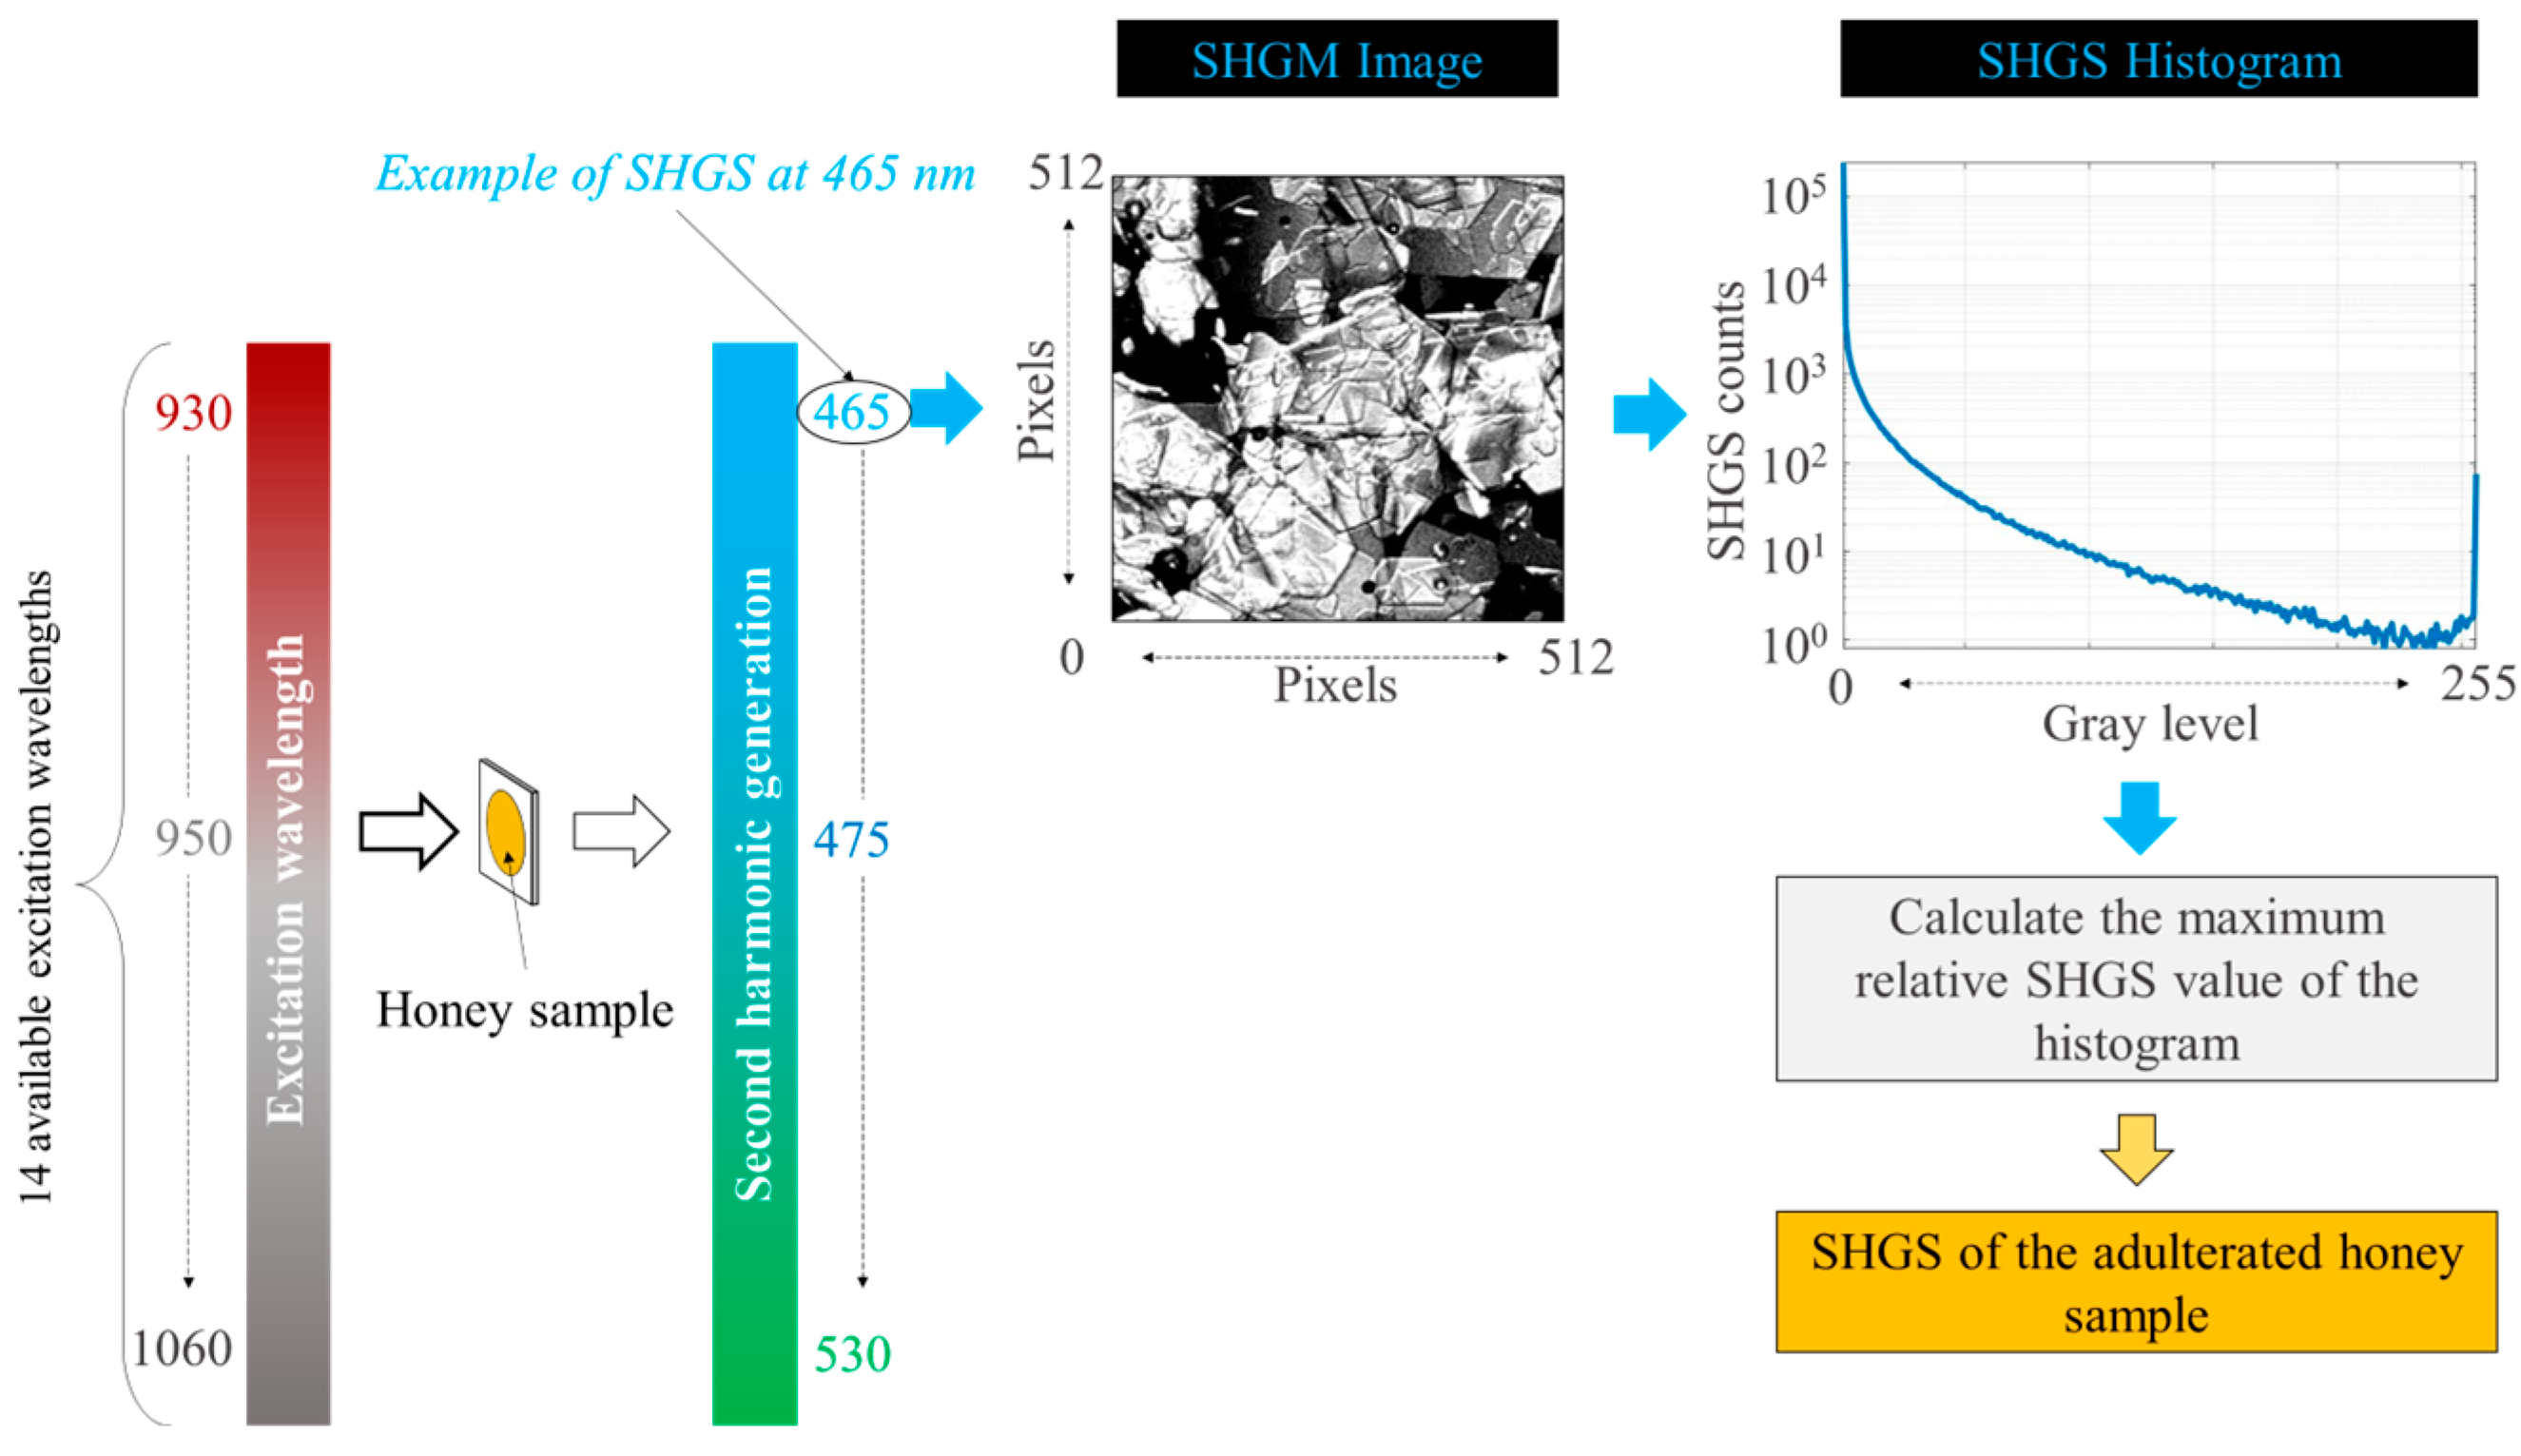
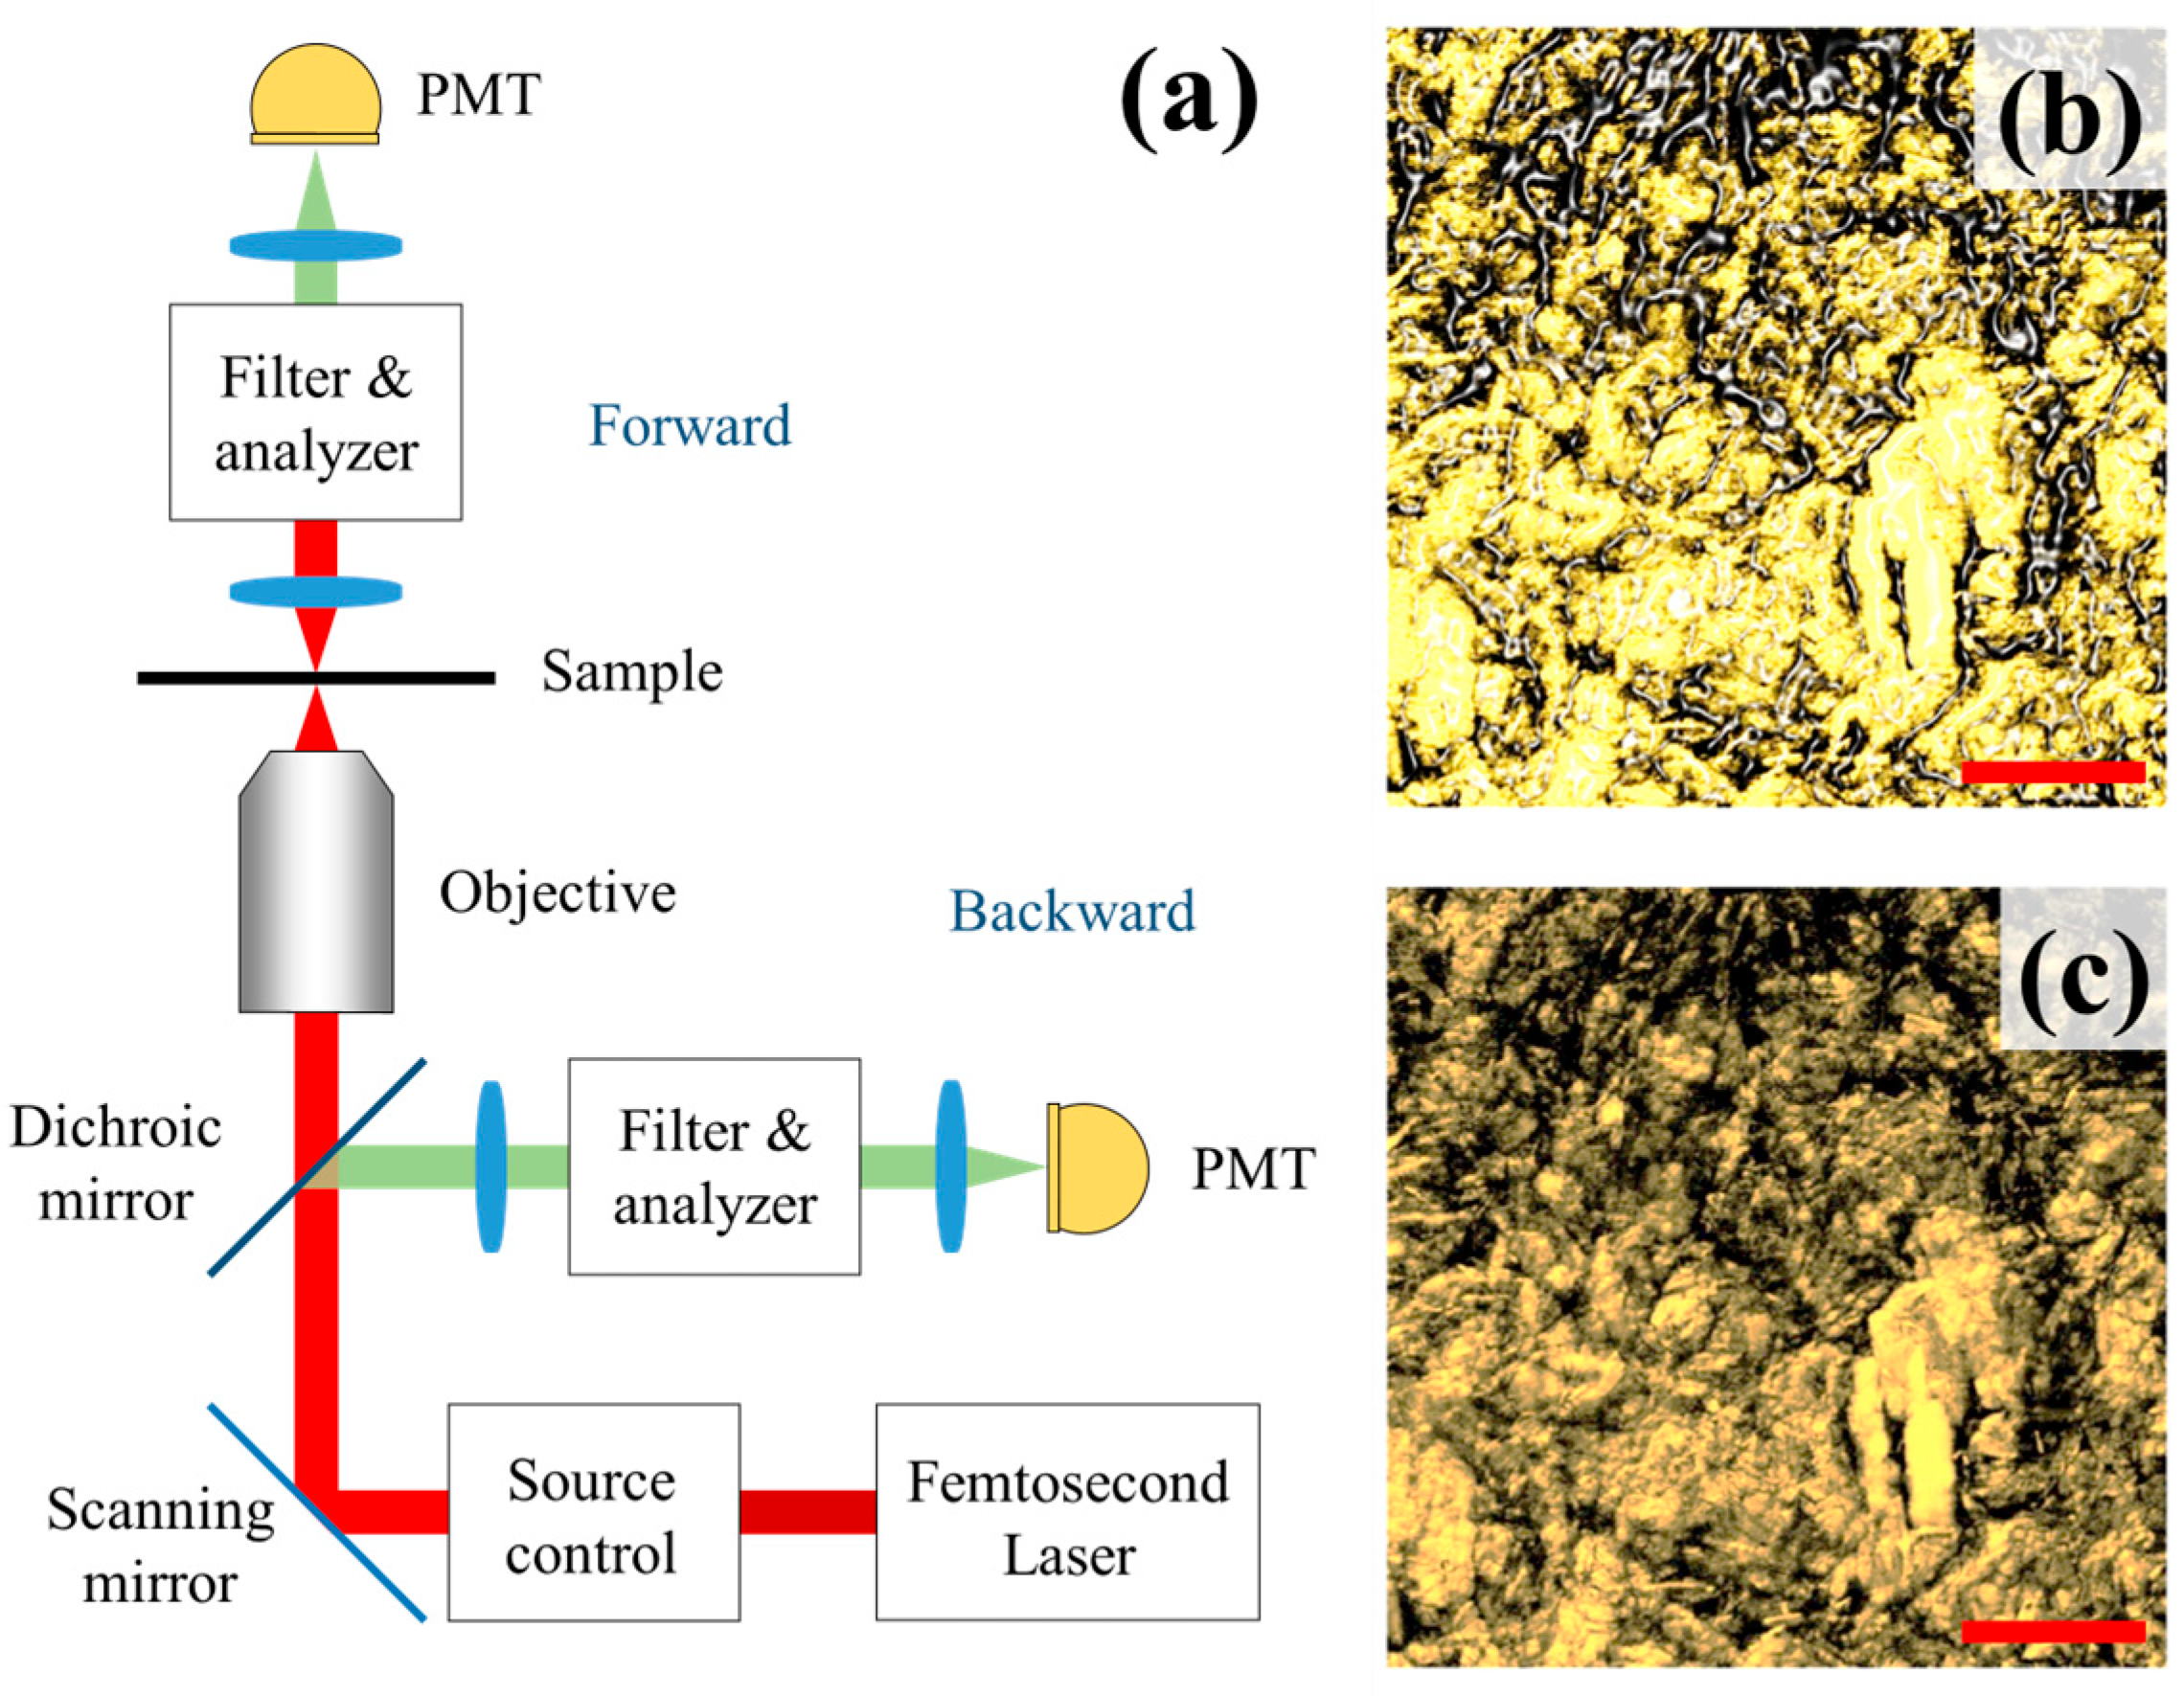
2.1. Second-Harmonic Generation
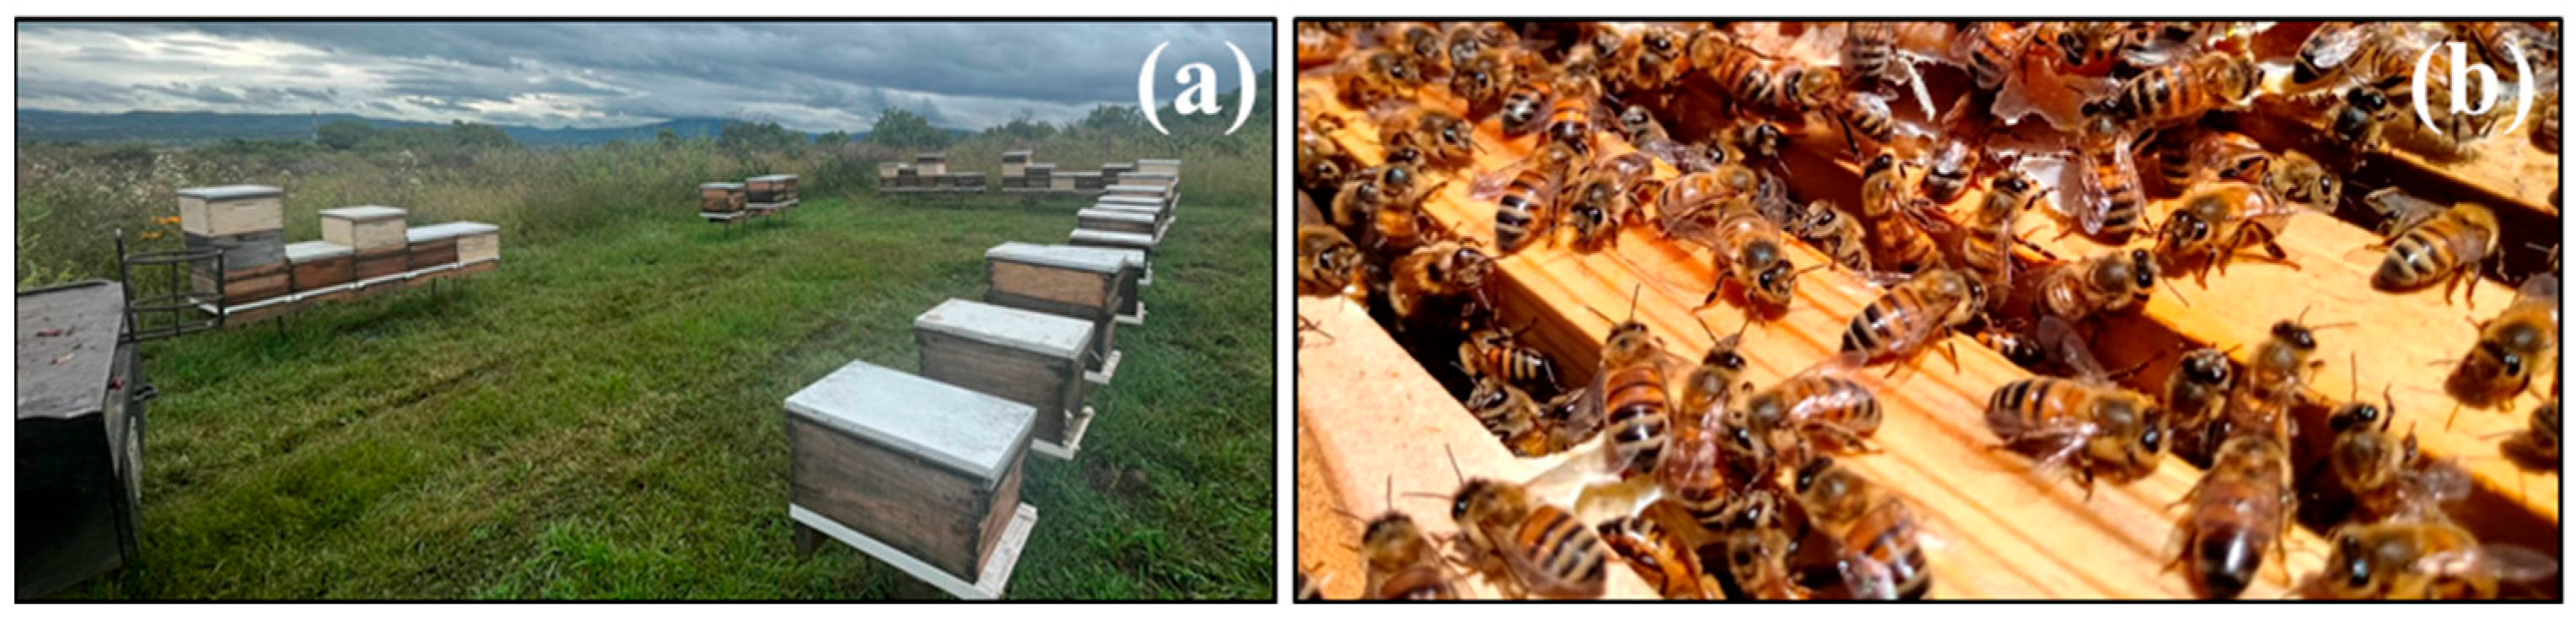
2.2. Honey Samples
3. Results and Discussion
4. Conclusions
Author Contributions
Funding
Institutional Review Board Statement
Data Availability Statement
Conflicts of Interest
Abbreviations
| SHGM | Second-harmonic generation microscopy |
| SHGS | Second-harmonic generation signal |
| LF NMR | Low-field nuclear magnetic resonance spectroscopy |
| UV HPLC | Ultraviolet high-performance liquid chromatography |
| HFCS | High-fructose corn syrup |
References
- Kasianchuk, V.; Berhilevych, O.; Negai, I.V.; Dimitrijevich, L.; Marenkova, T. Determination of honey geographic origin according to its elemental composition by the method of x-ray fluorescence. Eureka Life Sci. 2019, 2, 12–19. [Google Scholar] [CrossRef]
- Meo, S.A.; Al-Asiri, S.S.; Mahesar, A.W.; Ansari, M. Role of honey in modern medicine. Saudi J. Biol. Sci. 2017, 24, 975–978. [Google Scholar] [CrossRef] [PubMed]
- Rodriguez, I.; Tananaki, C.; Galán-Soldevilla, H.; Pérez-Cacho, P.R.; Serrano, S. Sensory Profile of Greek Islands Thyme Honey. Appl. Sci. 2021, 11, 9548. [Google Scholar] [CrossRef]
- Al-Habsi, N.; Davis, F.D.; Niranjan, K. Development of Novel Methods to Determine Crystalline Glucose Content of Honey Based on DSC, HPLC, and Viscosity Measurements, and Their Use to Examine the Setting Propensity of Honey. J. Food Sci. 2013, 78, E845–E852. [Google Scholar] [CrossRef]
- Suriwong, V.; Jaturonglumlert, S.; Varith, J.; Narkprasom, K.; Nitatwichit, C. Crystallization behaviour of sunflower and longan honey with glucose addition by absorbance measurement. Development of creamed honey production by control of Crystallization process View project. Int. Food Res. J. 2020, 27, 727–734. [Google Scholar]
- Tappi, S.; Glicerina, V.; Ragni, L.; Dettori, A.; Romani, S.; Rocculi, P. Physical and structural properties of honey crystallized by static and dynamic processes. J. Food Eng. 2021, 292, 110316. [Google Scholar] [CrossRef]
- Pascual-Maté, A.; Osés, S.M.; Marcazzan, G.L.; Gardini, S.; Muiño, M.Á.F.; Sancho, M.T. Sugar composition and sugar-related parameters of honeys from the northern Iberian Plateau. J. Food Compos. Anal. 2018, 74, 34–43. [Google Scholar] [CrossRef]
- Bakier, S.; Miastkowski, K.; Bakoniuk, J.R. Rheological Properties of Some Honeys in Liquefied and Crystallised States. J. Apic. Sci. 2016, 60, 153–166. [Google Scholar] [CrossRef]
- Mora-Escobedo, R.; Moguel-Ordoñez, Y.; Jaramillo-Flores, M.E.; Gutiérrez-López, G.F. The Composition, Rheological and Thermal Properties of Tajonal (Viguiera dentata) Mexican Honey. Int. J. Food Prop. 2006, 9, 299–316. [Google Scholar] [CrossRef]
- Escriche, I.; Juan-Borrás, M.; Visquert, M.; Valiente, J.D.B. An overview of the challenges when analysing pollen for monofloral honey classification. Food Control. 2022, 143, 109305. [Google Scholar] [CrossRef]
- Machado, A.M.; Tomás, A.; Russo-Almeida, P.; Duarte, A.; Antunes, M.; Vilas-Boas, M.; Miguel, M.G.; Figueiredo, A. Quality assessment of Portuguese monofloral honeys. Physicochemical parameters as tools in botanical source differentiation. Food Res. Int. 2022, 157, 111362. [Google Scholar] [CrossRef] [PubMed]
- Muresan, C.; Cornea-Cipcigan, M.; Suharoschi, R.; Erler, S.; Mărgăoan, R. Honey botanical origin and honey-specific protein pattern: Characterization of some European honeys. Lebensm.-Wiss. Technol. 2022, 154, 112883. [Google Scholar] [CrossRef]
- Erban, T.; Shcherbachenko, E.; Talacko, P.; Harant, K. A single honey proteome dataset for identifying adulteration by foreign amylases and mining various protein markers natural to honey. J. Proteom. 2021, 239, 104157. [Google Scholar] [CrossRef] [PubMed]
- Tedesco, R.; Scalabrin, E.; Malagnini, V.; Strojnik, L.; Ogrinc, N.; Capodaglio, G. Characterization of Botanical Origin of Italian Honey by Carbohydrate Composition and Volatile Organic Compounds (VOCs). Foods 2022, 11, 2441. [Google Scholar] [CrossRef]
- Rodríguez, I.; Cámara-Martos, F.; Flores, J.; Serrano, S. Spanish avocado (Persea americana Mill.) honey: Authentication based on its composition criteria, mineral content and sensory attributes. Lebensm. Wiss. Technol. 2019, 111, 561–572. [Google Scholar] [CrossRef]
- Kasiotis, K.M.; Baira, E.; Iosifidou, S.; Bergele, K.; Manea-Karga, E.; Theologidis, I.; Barmpouni, T.; Tsipi, D.; Machera, K. Characterization of Ikaria Heather Honey by Untargeted Ultrahigh-Performance Liquid Chromatography-High Resolution Mass Spectrometry Metabolomics and Melissopalynological Analysis. Front. Chem. 2022, 10, 924881. [Google Scholar] [CrossRef]
- Vazquez, L.; Armada, D.; Celeiro, M.; Dagnac, T.; Llompart, M. Evaluating the Presence and Contents of Phytochemicals in Honey Samples: Phenolic Compounds as Indicators to Identify Their Botanical Origin. Foods 2021, 10, 2616. [Google Scholar] [CrossRef]
- Truong, H.T.T.; Reddy, P.; Reis, M.G.; Archer, R. Quality assessment of mānuka honeys using non-invasive Near Infrared systems. J. Food Compos. Anal. 2022, 114, 104780. [Google Scholar] [CrossRef]
- Bodor, Z.; Benedek, C.; Kaszab, T.; Zaukuu, J.Z.; Kertész, I.; Kovacs, Z. Classical and correlative analytical methods for origin identification of Hungarian honeys. Acta Aliment. 2019, 48, 477–487. [Google Scholar] [CrossRef]
- Bisutti, V.; Merlanti, R.; Serva, L.; Lucatello, L.; Mirisola, M.; Balzan, S.; Tenti, S.; Fontana, F.; Trevisan, G.; Montanucci, L.; et al. Multivariate and machine learning approaches for honey botanical origin authentication using near infrared spectroscopy. J. Near Infrared Spectrosc. 2019, 27, 65–74. [Google Scholar] [CrossRef]
- Shao, Y.; Shi, Y.; Xuan, G.; Li, Q.; Wang, F.; Shi, C.; Hu, Z. Hyperspectral imaging for non-destructive detection of honey adulteration. Vib. Spectrosc. 2022, 118, 103340. [Google Scholar] [CrossRef]
- Adamchuk, L.; Sukhenko, Y.; Akulonok, O.I.; Bilotserkivets, T.; Vyshniak, V.; Lisohurska, D.; Lisohurska, O.; Mushtruk, M.; Shanina, O.; Galyasnyj, I. Methods for determining the botanical origin of honey. Potravinarstvo 2020, 14, 483–493. [Google Scholar] [CrossRef] [PubMed]
- Flores-Moreno, J.M.; De La Torre, M.; Frausto-Reyes, C.; Casillas, R.A. Imaging of bee’s honey sugar crystals by second-harmonic generation microscopy. Appl. Opt. 2021, 60, 7706. [Google Scholar] [CrossRef] [PubMed]
- Weber, M.; Meixner, M.; Dasbach, R.; Rozhon, W.; Dasbach, M. Analysis of sugar crystal size in honey. MethodsX 2022, 9, 101823. [Google Scholar] [CrossRef]
- Calderon-Hermosillo, C.Y.; De la Torre Ibarra, M.H.; Frausto-Reyes, C.; Flores-Moreno, J.M.; Casillas-Peñuelas, R. Mexican Bee Honey Identification Using Sugar Crystals’ Image Histograms. Appl. Sci. 2024, 14, 11186. [Google Scholar] [CrossRef]
- Bueno, J.M.; Ávila, F.J.M.; Artal, P. Second Harmonic Generation Microscopy: A Tool for Quantitative Analysis of Tissues; InTech Ebooks: London, UK, 2016. [Google Scholar] [CrossRef]
- Fine, S.L.; Hansen, W. Optical Second Harmonic Generation in Biological Systems. Appl. Opt. 1971, 10, 2350. [Google Scholar] [CrossRef]
- Freund, I.; Deutsch, M.; Sprecher, A. Connective tissue polarity. Optical second-harmonic microscopy, crossed-beam summation, and small-angle scattering in rat-tail tendon. Biophys. J. 1986, 50, 693–712. [Google Scholar] [CrossRef]
- Guo, Y.; Ho, P.M.; Savage, H.E.; Harris, D.A.; Sacks, P.G.; Schantz, S.P.; Liu, F.; Zhadin, N.; Alfano, R.R. Second-harmonic tomography of tissues. Opt. Lett. 1997, 22, 1323. [Google Scholar] [CrossRef]
- Graham, J.M. The Hive and the Honey Bee: A New Book on Beekeeping, Which Continues the Tradition of “Langstroth on the Hive and the Honeybee”; Dadant & Sons: Dallas, IL, USA, 1992. [Google Scholar]
- Alberini, R.; Spagnoli, A.; Sadeghinia, M.J.; Skallerud, B.; Terzano, M.; Holzapfel, G.A. Second harmonic generation microscopy, biaxial mechanical tests and fiber dispersion models in human skin biomechanics. Acta Biomater. 2024, 185, 266–280. [Google Scholar] [CrossRef]
- Lin, C.; Mondal, S.; Lee, S.; Kang, J.; So, P.T.C.; Dong, C.Y. Multiphoton imaging of the monosachharide induced formation of fluorescent advanced glycation end products in tissues. J. Biophotonics 2023, 17, e202300261. [Google Scholar] [CrossRef]
- López-Téllez, J.M.; Frausto-Reyes, C.; Ortiz-Morales, M.; De La Torre-I., M.H.; Valenzuela-Gonzalez, R.; Casillas, R. Fluorescence-signal imaging polarimetry for characterization of Mexican honeys. Appl. Opt. 2024, 63, 9289–9297. [Google Scholar] [CrossRef]
- Ribeiro, R.D.O.R.; Mársico, E.T.; da Silva Carneiro, C.; Monteiro, M.L.G.; Júnior, C.C.; de Jesus, E.F.O. Detection of honey adulteration of high fructose corn syrup by Low Field Nuclear Magnetic Resonance (LF 1H NMR). J. Food Eng. 2014, 135, 39–43. [Google Scholar] [CrossRef]
- CEgido, C.; Saurina, J.; Sentellas, S.; Núñez, O. Honey fraud detection based on sugar syrup adulterations by HPLC-UV fingerprinting and chemometrics. Food Chem. 2024, 436, 137758. [Google Scholar] [CrossRef]

| Excitation Wavelength | SHGS Wavelength |
|---|---|
| 930 nm | 465 nm |
| 940 nm | 470 nm |
| 950 nm | 475 nm |
| 960 nm | 480 nm |
| 970 nm | 485 nm |
| 980 nm | 490 nm |
| 990 nm | 495 nm |
| 1000 nm | 500 nm |
| 1010 nm | 505 nm |
| 1020 nm | 510 nm |
| 1030 nm | 515 nm |
| 1040 nm | 520 nm |
| 1050 nm | 525 nm |
| 1060 nm | 530 nm |
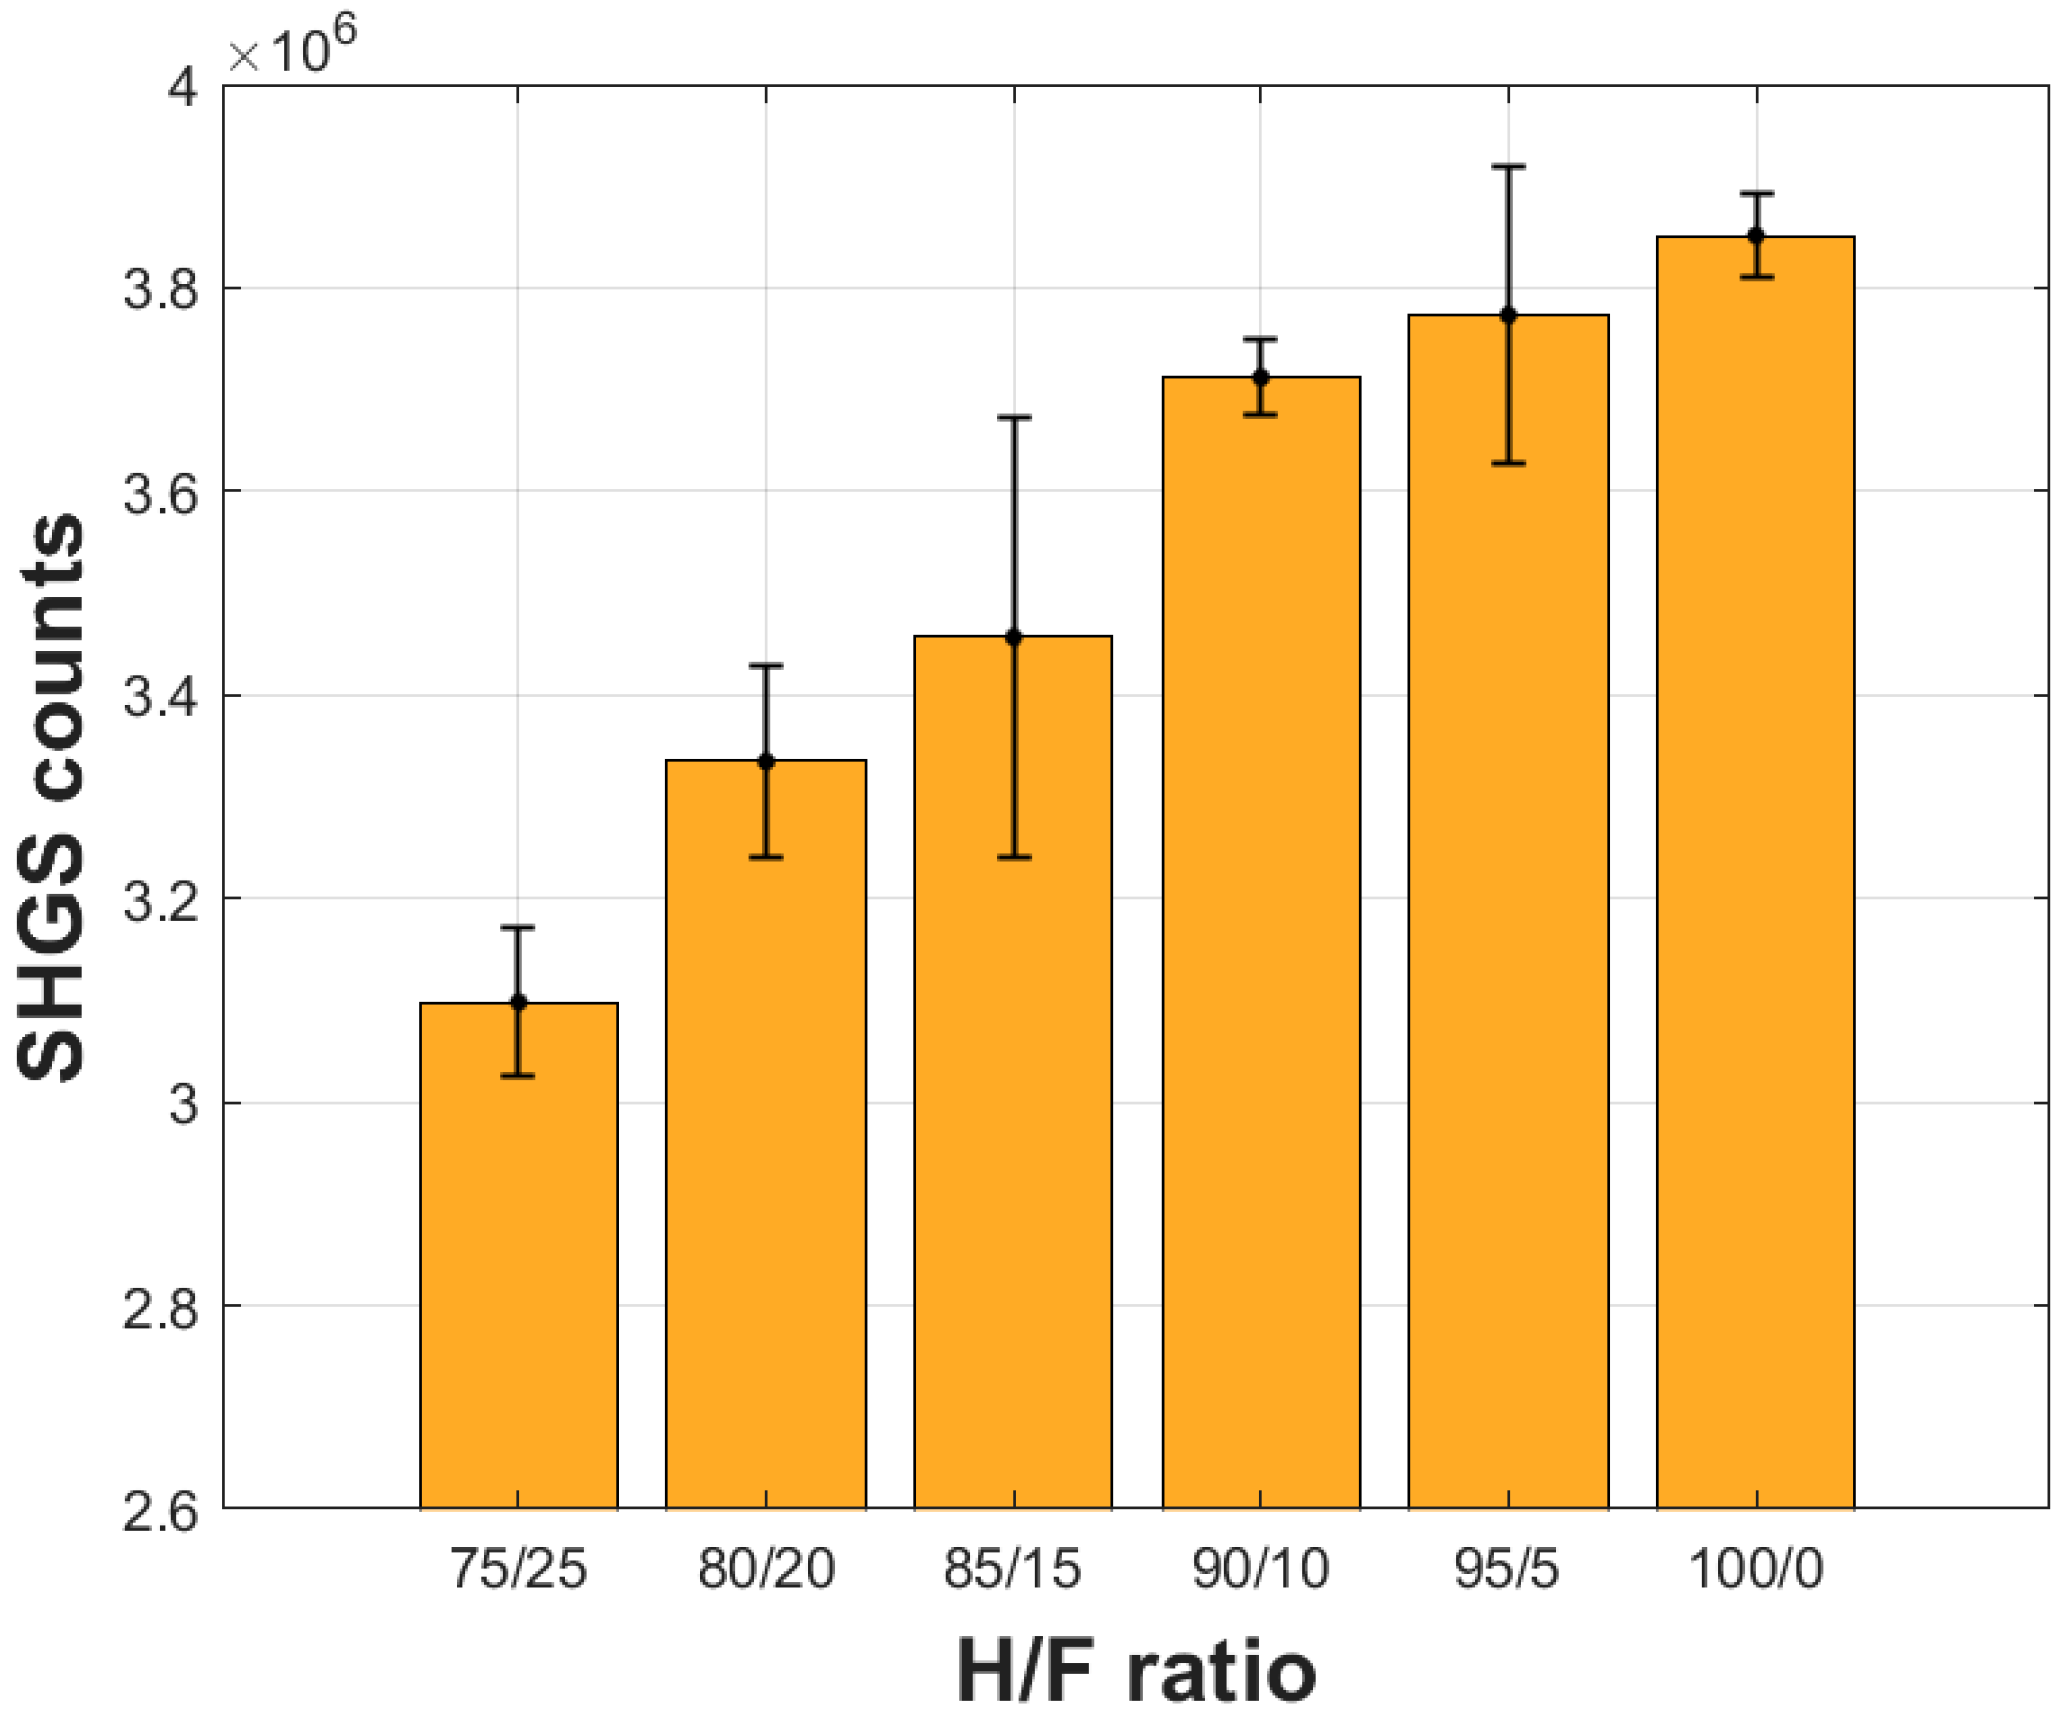
| Sample Honey/Fructose | Honey (%) | Fructose (%) |
|---|---|---|
| 75/25 | 75 | 25 |
| 80/20 | 80 | 20 |
| 85/15 | 85 | 15 |
| 90/10 | 90 | 10 |
| 95/5 | 95 | 5 |
| 100/0 | 100 | 0 |
Disclaimer/Publisher’s Note: The statements, opinions and data contained in all publications are solely those of the individual author(s) and contributor(s) and not of MDPI and/or the editor(s). MDPI and/or the editor(s) disclaim responsibility for any injury to people or property resulting from any ideas, methods, instructions or products referred to in the content. |
© 2025 by the authors. Licensee MDPI, Basel, Switzerland. This article is an open access article distributed under the terms and conditions of the Creative Commons Attribution (CC BY) license (https://creativecommons.org/licenses/by/4.0/).
Share and Cite
De la Torre-I, M.H.; Flores-Moreno, J.M.; Frausto-Reyes, C.; Casillas-Peñuelas, R. Using Second-Harmonic Generation Microscopy Images of Bee Honey Crystals to Detect Fructose Adulteration. Crystals 2025, 15, 634. https://doi.org/10.3390/cryst15070634
De la Torre-I MH, Flores-Moreno JM, Frausto-Reyes C, Casillas-Peñuelas R. Using Second-Harmonic Generation Microscopy Images of Bee Honey Crystals to Detect Fructose Adulteration. Crystals. 2025; 15(7):634. https://doi.org/10.3390/cryst15070634
Chicago/Turabian StyleDe la Torre-I, Manuel H., J. M. Flores-Moreno, C. Frausto-Reyes, and Rafael Casillas-Peñuelas. 2025. "Using Second-Harmonic Generation Microscopy Images of Bee Honey Crystals to Detect Fructose Adulteration" Crystals 15, no. 7: 634. https://doi.org/10.3390/cryst15070634
APA StyleDe la Torre-I, M. H., Flores-Moreno, J. M., Frausto-Reyes, C., & Casillas-Peñuelas, R. (2025). Using Second-Harmonic Generation Microscopy Images of Bee Honey Crystals to Detect Fructose Adulteration. Crystals, 15(7), 634. https://doi.org/10.3390/cryst15070634