Article

A Novel Approach to Quantitatively Account on Deposition Efficiency by Direct Energy Deposition: Case of Hardfacing-Coated AISI 304 SS

Department of Industrial Engineering and Mathematical Sciences, Università Politecnica Delle Marche, Via Brecce Bianche 12, 60131 Ancona, Italy
*
Authors to whom correspondence should be addressed.
Crystals 2025, 15(7), 626; https://doi.org/10.3390/cryst15070626
Submission received: 11 June 2025 / Revised: 30 June 2025 / Accepted: 2 July 2025 / Published: 5 July 2025
(This article belongs to the Special Issue Recent Advances in Microstructure and Properties of Metals and Alloys)

Abstract

Nickel-based coatings have been demonstrated to effectively enhance the surface performance of stainless-steel components. The present study investigates the deposition efficiency and quality of Colmonoy 227-F nickel alloy coatings on AISI 304 stainless steel using direct energy deposition (DED). The work focuses on the relationships between process parameters, microstructural features, and mechanical properties. A total of sixteen process parameter combinations were studied, varying laser power and scanning speed to establish optimal deposition conditions and to evaluate coating morphology, surface topology, dilution behavior, and mechanical performance. The surface geometry was analyzed using three-dimensional digital confocal microscopy. New material distribution (MD) indices were developed to quantify spatial uniformity and integrity of single coating scan tracks (CSTs) across the XY, XZ, and YZ planes. The optimal process was identified around 900 W laser power, balancing deposition efficiency and structural integrity. Scanning electron microscopy (SEM) and energy dispersive spectroscopy (EDS) reveal a gradual compositional transition between coating and substrate. The results of the microhardness test demonstrate a consistent gradient in mechanical properties, extending from the coating to the substrate. Coatings were found to achieve a hardness level of up to 600 HK. These findings establish a new benchmark for evaluating DED high-performance coatings and offer a scalable methodology for optimizing additive manufacturing processes in surface engineering applications.

1. Introduction

The fields of engineering and industry are perpetually seeking optimal performance in the domain of metallic coatings. This technology is characterized by the deposition of a noble metal alloy on a substrate alloy, with the objective of combining structural [1,2], electrochemical [3], and thermal properties [4] to achieve the best possible performance in a certain field [5]. It is evident that the industrial tools, aeronautical, naval, defense, and energy industries are the primary stakeholders in the metallic coating landscape. These industries are perpetually seeking opportunities to amalgamate diverse materials, thereby attaining specific attributes. This pursuit facilitates the implementation of strategies involving the deposition of disparate metal alloys, which, in turn, combine distinct attributes stemming from the utilization of varied materials [6].
A variety of technologies can be employed to achieve this objective, covering a range of deposited layers that go from nanostructured films [7] up to millimeters [8]. In recent years, considerable interest has been observed in the directed energy deposition (DED) process, with regard to its potential to transform coating technology. This process involves the selective melting of a specific metal alloy on a base material, either similar or different, in order to produce a final component consisting of the substrate and a deposited coating layer with a thickness ranging from micrometers to millimeters. Therefore, the process can be utilized in a variety of applications, ranging from the coating of two-dimensional shapes to the fabrication of complex three-dimensional structures [8,9,10]. DED is a metal 3D printing process based on locally fusing a wire or pre-mixed/pre-alloyed micro-powder by means of an electron beam or a laser heat source [11,12]. The integration of hardware with a software-based computer-aided manufacturing (CAM) system facilitates the generation of complex three-dimensional structures through the implementation of specific slicing strategies. These strategies employ iso-surfaces to progressively refine the three-dimensional geometry required for manufacturing. It is evident that the DED process can be utilized as a reliable, accurate, and automated procedure capable of generating or coating complex shapes. Alternatively, it should be specified that to obtain a conformal part by DED, the substrate–coating interaction must be optimized at its finest in order to avoid the formation of defects that would influence the mechanical, physical, and electrochemical properties of the final part. It is imperative to acknowledge the significance of the initial layers of deposition, as they possess the capacity to give rise to a multitude of detrimental outcomes, including the formation of microcracks [13,14,15], the development of high residual stresses [16,17,18], the occurrence of diffused porosity [19,20,21], and the poor dilution of deposited substrate material [9,13,21,22].
A significant number of studies in the field of literature have focused on the development of methodologies for the resolution of these issues. Pereira et al. [23] conducted a study on the impact of powder properties on porosity. The findings indicated that powder recycling can influence the final density of a DED component, contingent on the number of cycles and the composition of the powder materials. However, it was observed that the use of virgin powder consistently yielded the highest density. This phenomenon can be attributed to two possible mechanisms: firstly, oxidation and coarsening of reused powder particles [24], and secondly, alteration of flow rate induced by a different powder morphology [25]. Furthermore, the melt pool dynamics and their interaction with shielding gases can be responsible for extended porosity generation in the final deposited material [21]. Moreover, the DED process, similarly to welding, is characterized by an intensive cooling rate [26,27], which results in the development of substantial residual stresses within the base material. This, in turn, results in the onset of cracking, primarily in the brittle interdendritic regions [28,29]. The resolution of these issues can be achieved through the implementation of thermal tensioning, a process that involves the application of heat to the substrate until it reaches a specific temperature [30,31].
Coating stainless steel with nickel-based alloys has been a subject of particular interest in the academic literature [32,33,34]. The following reasons substantiate the particular suitability of these materials for combination with each other. Austenitic stainless steels, particularly AISI 304, find extensive use in industrial applications, including chemical processing, the automotive industry, and the energy sector, due to their excellent corrosion resistance, good mechanical strength, thermal stability, and superior impact toughness [35,36]. However, 304 stainless steel is characterized by relatively low surface hardness and poor wear resistance, which can significantly limit its service life in abrasive or high-friction environments [37,38]. To mitigate these limitations, various surface engineering and coating technologies have been developed to enhance the wear performance of 304 stainless steel without compromising its bulk characteristics.
Nickel alloys have been identified as a potentially valuable solution for the surface reinforcement of stainless steels, with considerable promise in this regard [39,40]. The Colmonoy alloys, which are primarily composed of nickel, chromium, boron, silicon, and carbon, are classified depending on the precipitated hard phases (i.e., carbides and borides) within a nickel matrix. This combination of properties offers significant advantages in terms of hardness, corrosion resistance, and thermal stability [41,42]. The composition of these alloys can be modified to suit particular wear environments, thereby allowing for customization to specific requirements. The strength characteristics of the Colmonoy material can be altered by increasing the amount of chromium-rich phases, including chromium borides and carbides [43]. Furthermore, it is worth noting that the properties of Colmonoy coating layer depend on the deposition technique and parameters used, including thermal cycling during the coating process and the substrate’s chemical composition [44].
Natarajan et al. [42] conducted a study on the microstructure, nano-hardness, and corrosion resistance resulting from laser cladding of Colmonoy-6 particles on a 316L steel substrate. Their work concentrated on a single clad layer, and the results demonstrated an increase in nano-hardness of the Colmonoy 6 clad layer due to its distinctive microstructure. This also enhanced the corrosion resistance of the system [42].
Rukhande et al. [32] and Bhoskar et al. [45] focused on the deposition of Ni-based coatings with the objective of enhancing the high-temperature resistance of steels. In particular, Bhoskar et al. [45] examined the P91 substrate, while Rukhande et al. [32] focused their attention on the 316L substrate. The former used plasma transfer arc welding (PTAW) to fabricate large and thick (up to 5 mm approximately) deposits of Colmonoy 6 on P91 steel using a SS-309L buffer layer. The investigation yielded results demonstrating enhanced wear resistance in comparison with the other Cobalt-based solutions that were examined, in addition to elevated hardness values within the hard-facing zone [45].
In the study by Rukhande et al. [32], the focus was on the NiCrBSiFeC coating, which was sprayed using two different technologies: high velocity oxygen fuel (HVOF) and atmospheric plasma spray (APS). Thin coatings (with a thickness ranging from 250 to 290 µm) were obtained, with the HVOF coating demonstrating higher hardness compared to the APS coating [46]. This resulted in a dry sliding wear performance that was 40% superior to that of the APS coating.
In the study conducted by Angelastro et al. [47], direct metal laser deposition (DMLD) was utilized for the deposition of Colmonoy 227-F on an AISI 304 stainless steel plate. The work demonstrated the successful fabrication of Colmonoy 227-F square samples, which were obtained by varying deposition parameters such as hatch spacing and step height (layer height). The analysis of the samples revealed a variable thickness ranging approximately between 5 and 11 mm. Additionally, the Vickers microhardness values attained a maximum of 400 HV, which is notably higher than the hardness of the initial powder [47].
Despite the considerable focus of the scientific literature on the characterization of large hardfacing clads, there remains a significant research gap that must be addressed by the efficiency and precision offered by directed energy deposition in combination with hardfacing alloys. The objective of the present work is to examine the quality and efficiency of material deposition coating scan tracks (CSTs) of Colmonoy 227-F on a substrate of AISI 304 austenitic stainless steel using DED. For this purpose, based on digital microscopy analysis, a new index to assess the track quality is proposed.

2. Materials and Methods

2.1. Samples Manufacturing

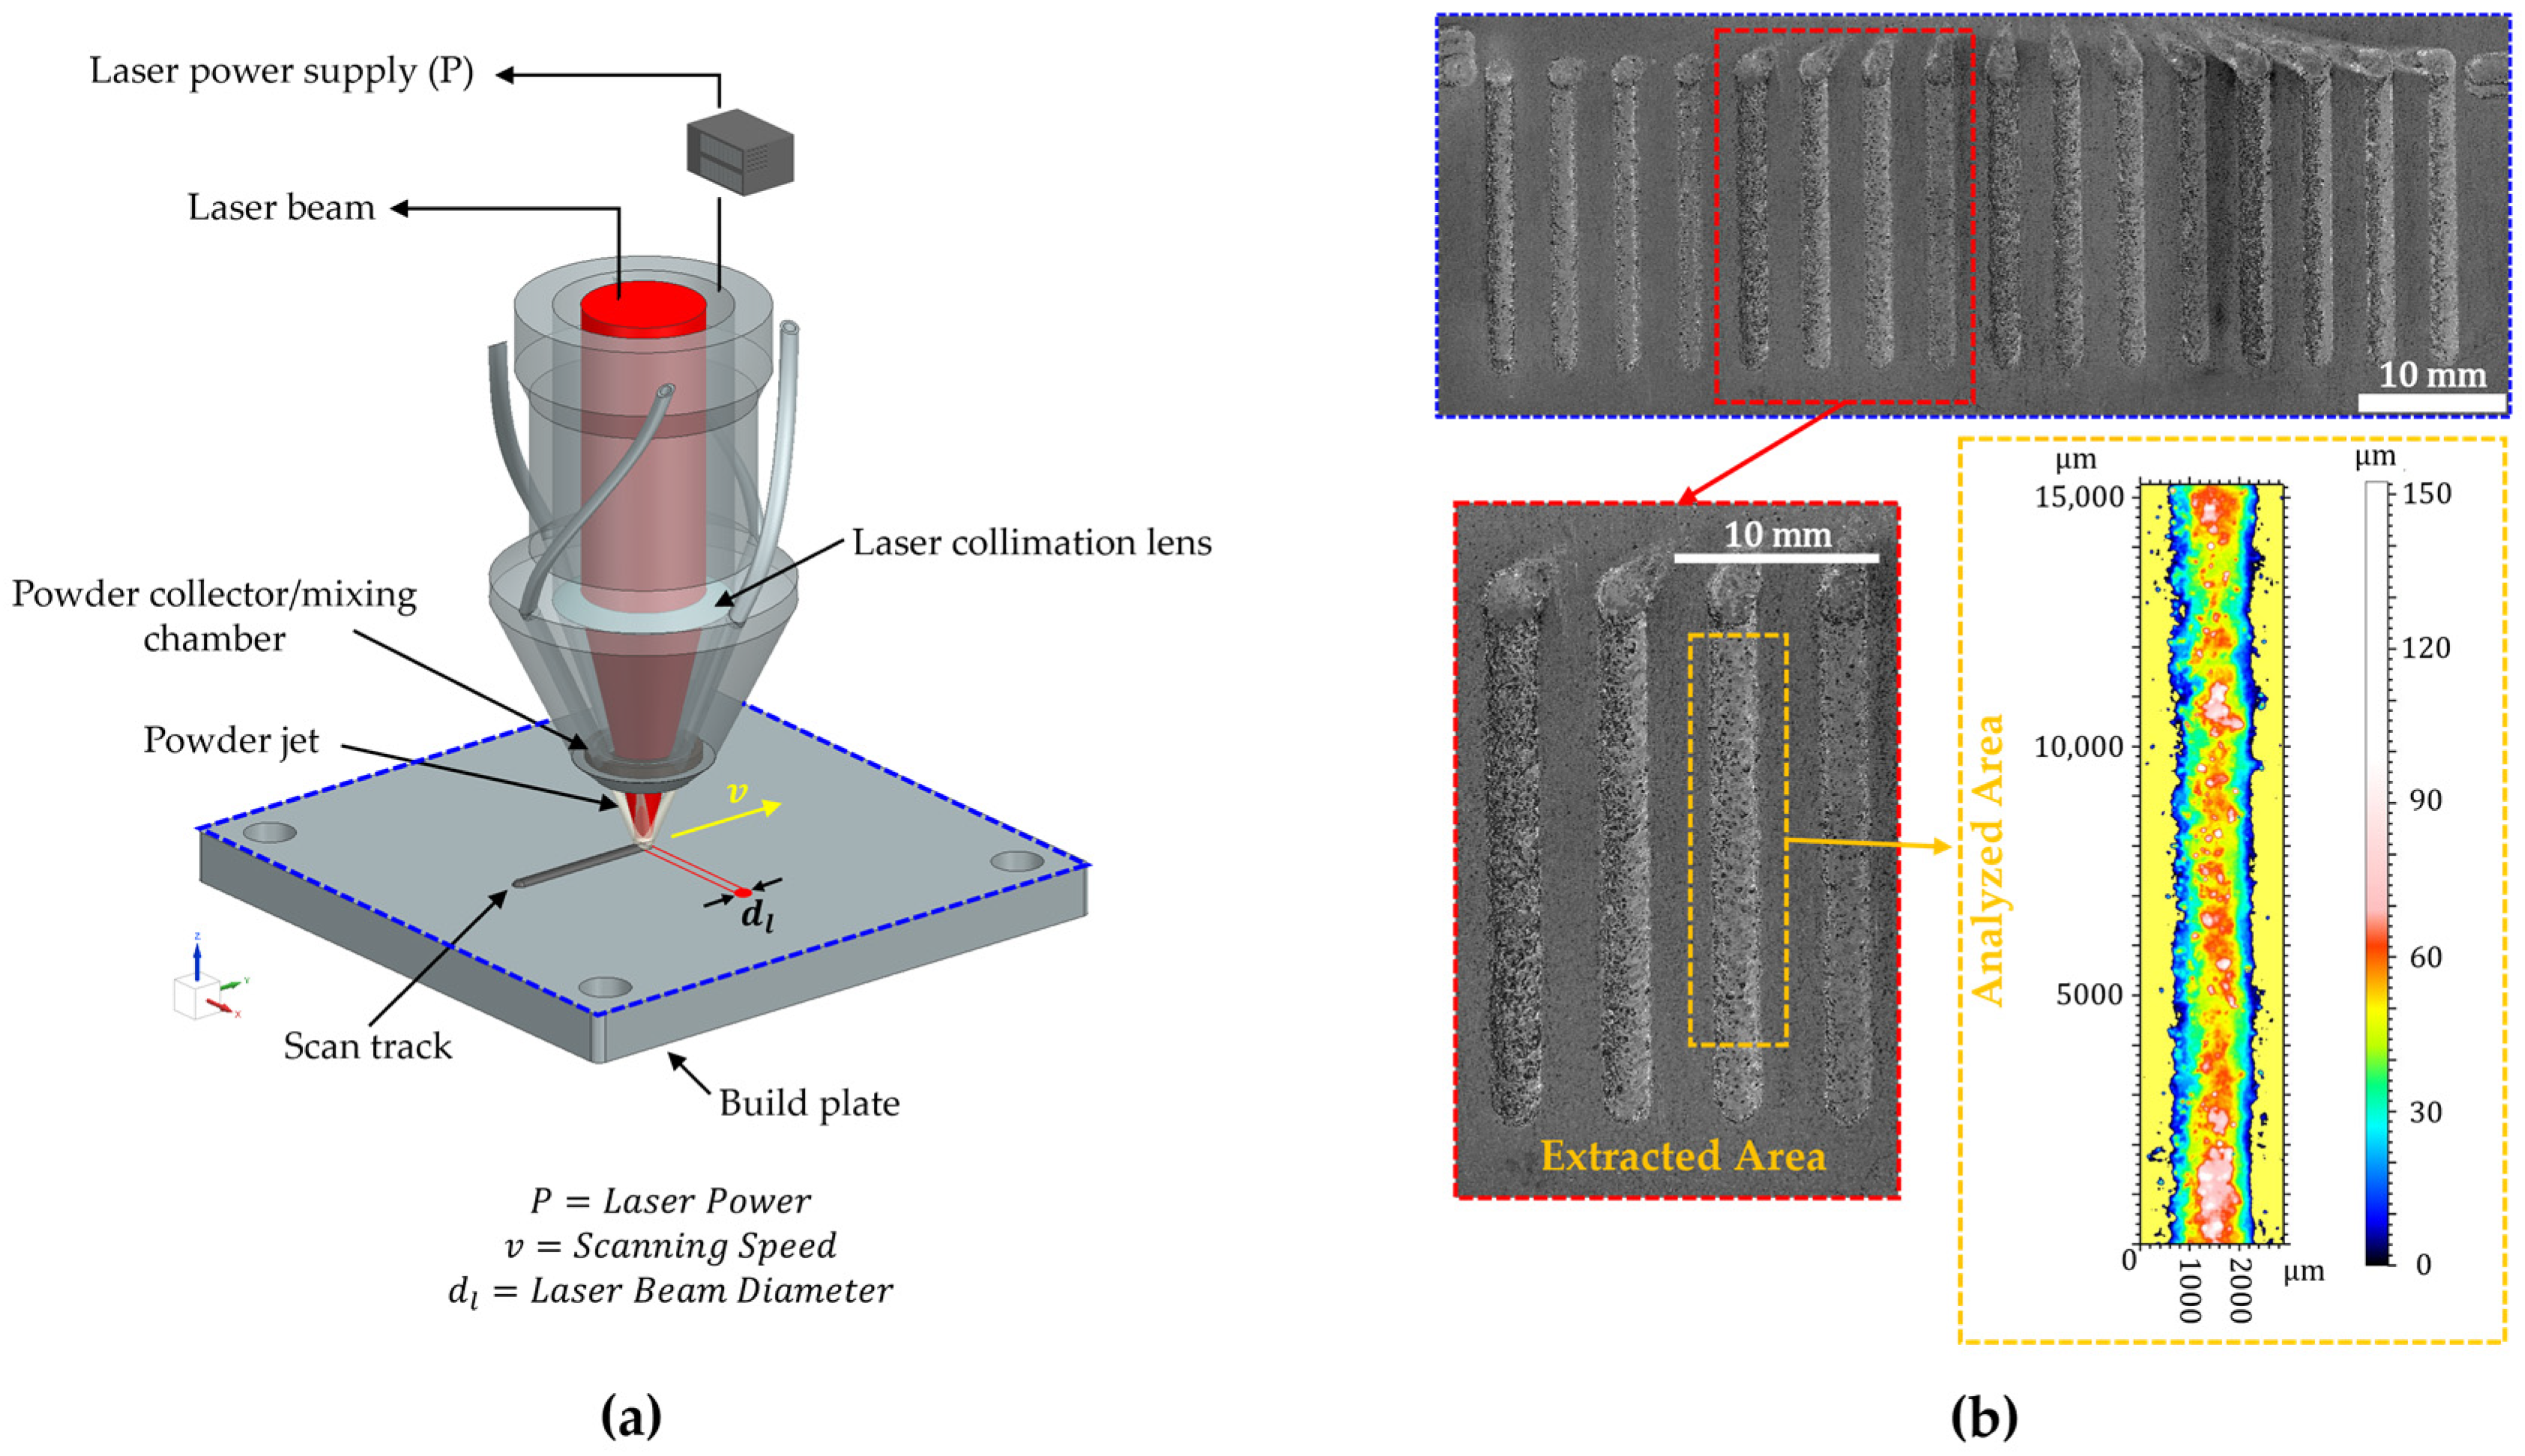
Colmonoy 227-F (referred to as “Colmonoy”) virgin powder supplied by Wall-Colmonoy (Wall Colmonoy Corporation, Madison Heights, USA), with a particle size distribution in the range of 53–150 μm has been used as a coating material. The nominal chemical composition of the powder is expressed in Table 1. The blown-powder DED fabrication process was performed with a Prima Additive Laserdyne 430 BD machine (Prima Additive by Sodik, Torino, Italy), equipped with a 1 kW high-energy laser characterized by a fixed Gaussian beam shape emission. The machine schematic representation of the DED architecture is illustrated in Figure 1a. Nitrogen with 99.99% purity served both as a shielding gas for the melting process and as a carrier gas to move the powder particles from the feeder to two of the four nozzles on the deposition head. An AISI 304 SS built plate (120 × 120 × 10 mm), nominal chemical composition in Table 1, was chosen as the substrate material, and it has been coated in its wrought condition (no further preparation involved). The design of experiment (DOE) has been designed considering the analysis of adding single coating scan tracks (CSTs). The single coating scan tracks are used to identify the main interaction between the process parameters, substrate, and coating material. Starting from a room temperature build plate, a constant feed rate (7.875 g/min), and laser spot size (2 mm), 16 combinations of laser power and scanning speed, reported in Table 2, have been investigated to assess the optimal processability conditions. A dwell time of 10 s was applied between the printing of different conditions.

2.2. Surface Characterization

A comprehensive evaluation of the mechanical performance and potential failure mechanisms of coatings can be accomplished by investigating the surface geometry. In the context of coating applications, surface texture exerts a pivotal influence on fatigue behavior, corrosion resistance, and wear properties [48]. The surface topological features of the coating tracks were analyzed through the implementation of a multifaceted filtration process. The selective filtering consists of Form (F) and roughness (R) filtration. In accordance with the ISO ISO 25178 standards [49], the long wavelength of form filtering is confined to the range of 8 to 25 mm. The resulting shorter wavelength is considered the roughness profile geometrical topology [50,51]. The roughness evaluation was conducted using the areal surface parameter, including (Sa), which is defined as the arithmetic mean of the absolute height deviations from the mean plane over the measurement area, (Sq) the root mean square of the surface height deviations measured from the mean plane; it is sensitive to high peaks and deep valleys.
In order to achieve a certain resolution for the purpose of analyzing surface oscillation within long–medium wavelengths, an L-filter with a wavelength of 800 μ m has been applied to CSTs, referred to as the waviness (W) profile. The advantage of analyzing tracks using waviness is related to its accuracy in filtering surface oscillation from the tracks along multiple directions. As will be discussed in Section 2.3, waviness parameters have been used to assess the material distribution index.
The material coating/substrate was characterized by means of a digital microscope LEICA™ DVM6®(Leica Microsystems GmbH, Wetzlar, Germany) equipped with LASX software (Version 5.2.2.28326). The confocal system of this machine facilitates the reconstruction of 3D point maps of the structure. Geometrical analysis was subsequently performed using LeicaMapStart® software (Version 10.1.10606). The microscope is equipped with a mid-magnification objective of 12.55 mm maximum field of view (FOV), which was used to analyze material distribution, material coating volume in reference to the build plate, and surface topology. The high magnification objective with a 3.60 mm maximum field of view (FOV) was utilized to analyze the microdefect generated on the surface during solidification. It should be noted that all the analyses were conducted in the middle part of each CST, as shown in Figure 1b. This approach was adopted in order to bypass the border effect, which occurs at the points where the laser shutter is activated and deactivated.

2.3. Material Distribution Index

Furthermore, since it is necessary to delineate a specific region within each CST for this operation, the calculation of deposited volume has been normalized. Specifically, the pure volume value calculated in LeicaMapStart® using the Slices method was normalized to the length of the track. This procedure was performed to obtain a volume index unaffected by the region dimension selected for measurement. The deposited normalized volume ( V P m F n N ) was then extracted from this analysis. In particular, the absolute volume (V) value calculated in LeicaMapStart® has been normalized on the track length (L) of the extracted region (Equation (1)).
V P m F n N = V L
While this parameter can provide valuable information about the relationship between the process parameters and the deposited volume, it is not possible to understand the overall quality of the generated coating just by analyzing the V P m F n N parameter. Hence, to quantify how material is arranged in space and understand its discontinuity and defects, a novel material distribution ratio ( M D P m F n N ) index has been developed. Particularly, the material distribution index has been expressed in terms of the mean value of its contribution to the XY ( M D P m F n X Y ), XZ ( M D P m F n X Z ), and YZ ( M D P m F n Y Z ) planes, as shown in Equation (2).
M D P m F n = 1 3 M D P m F n X Y + M D P m F n X Z + M D P m F n Y Z
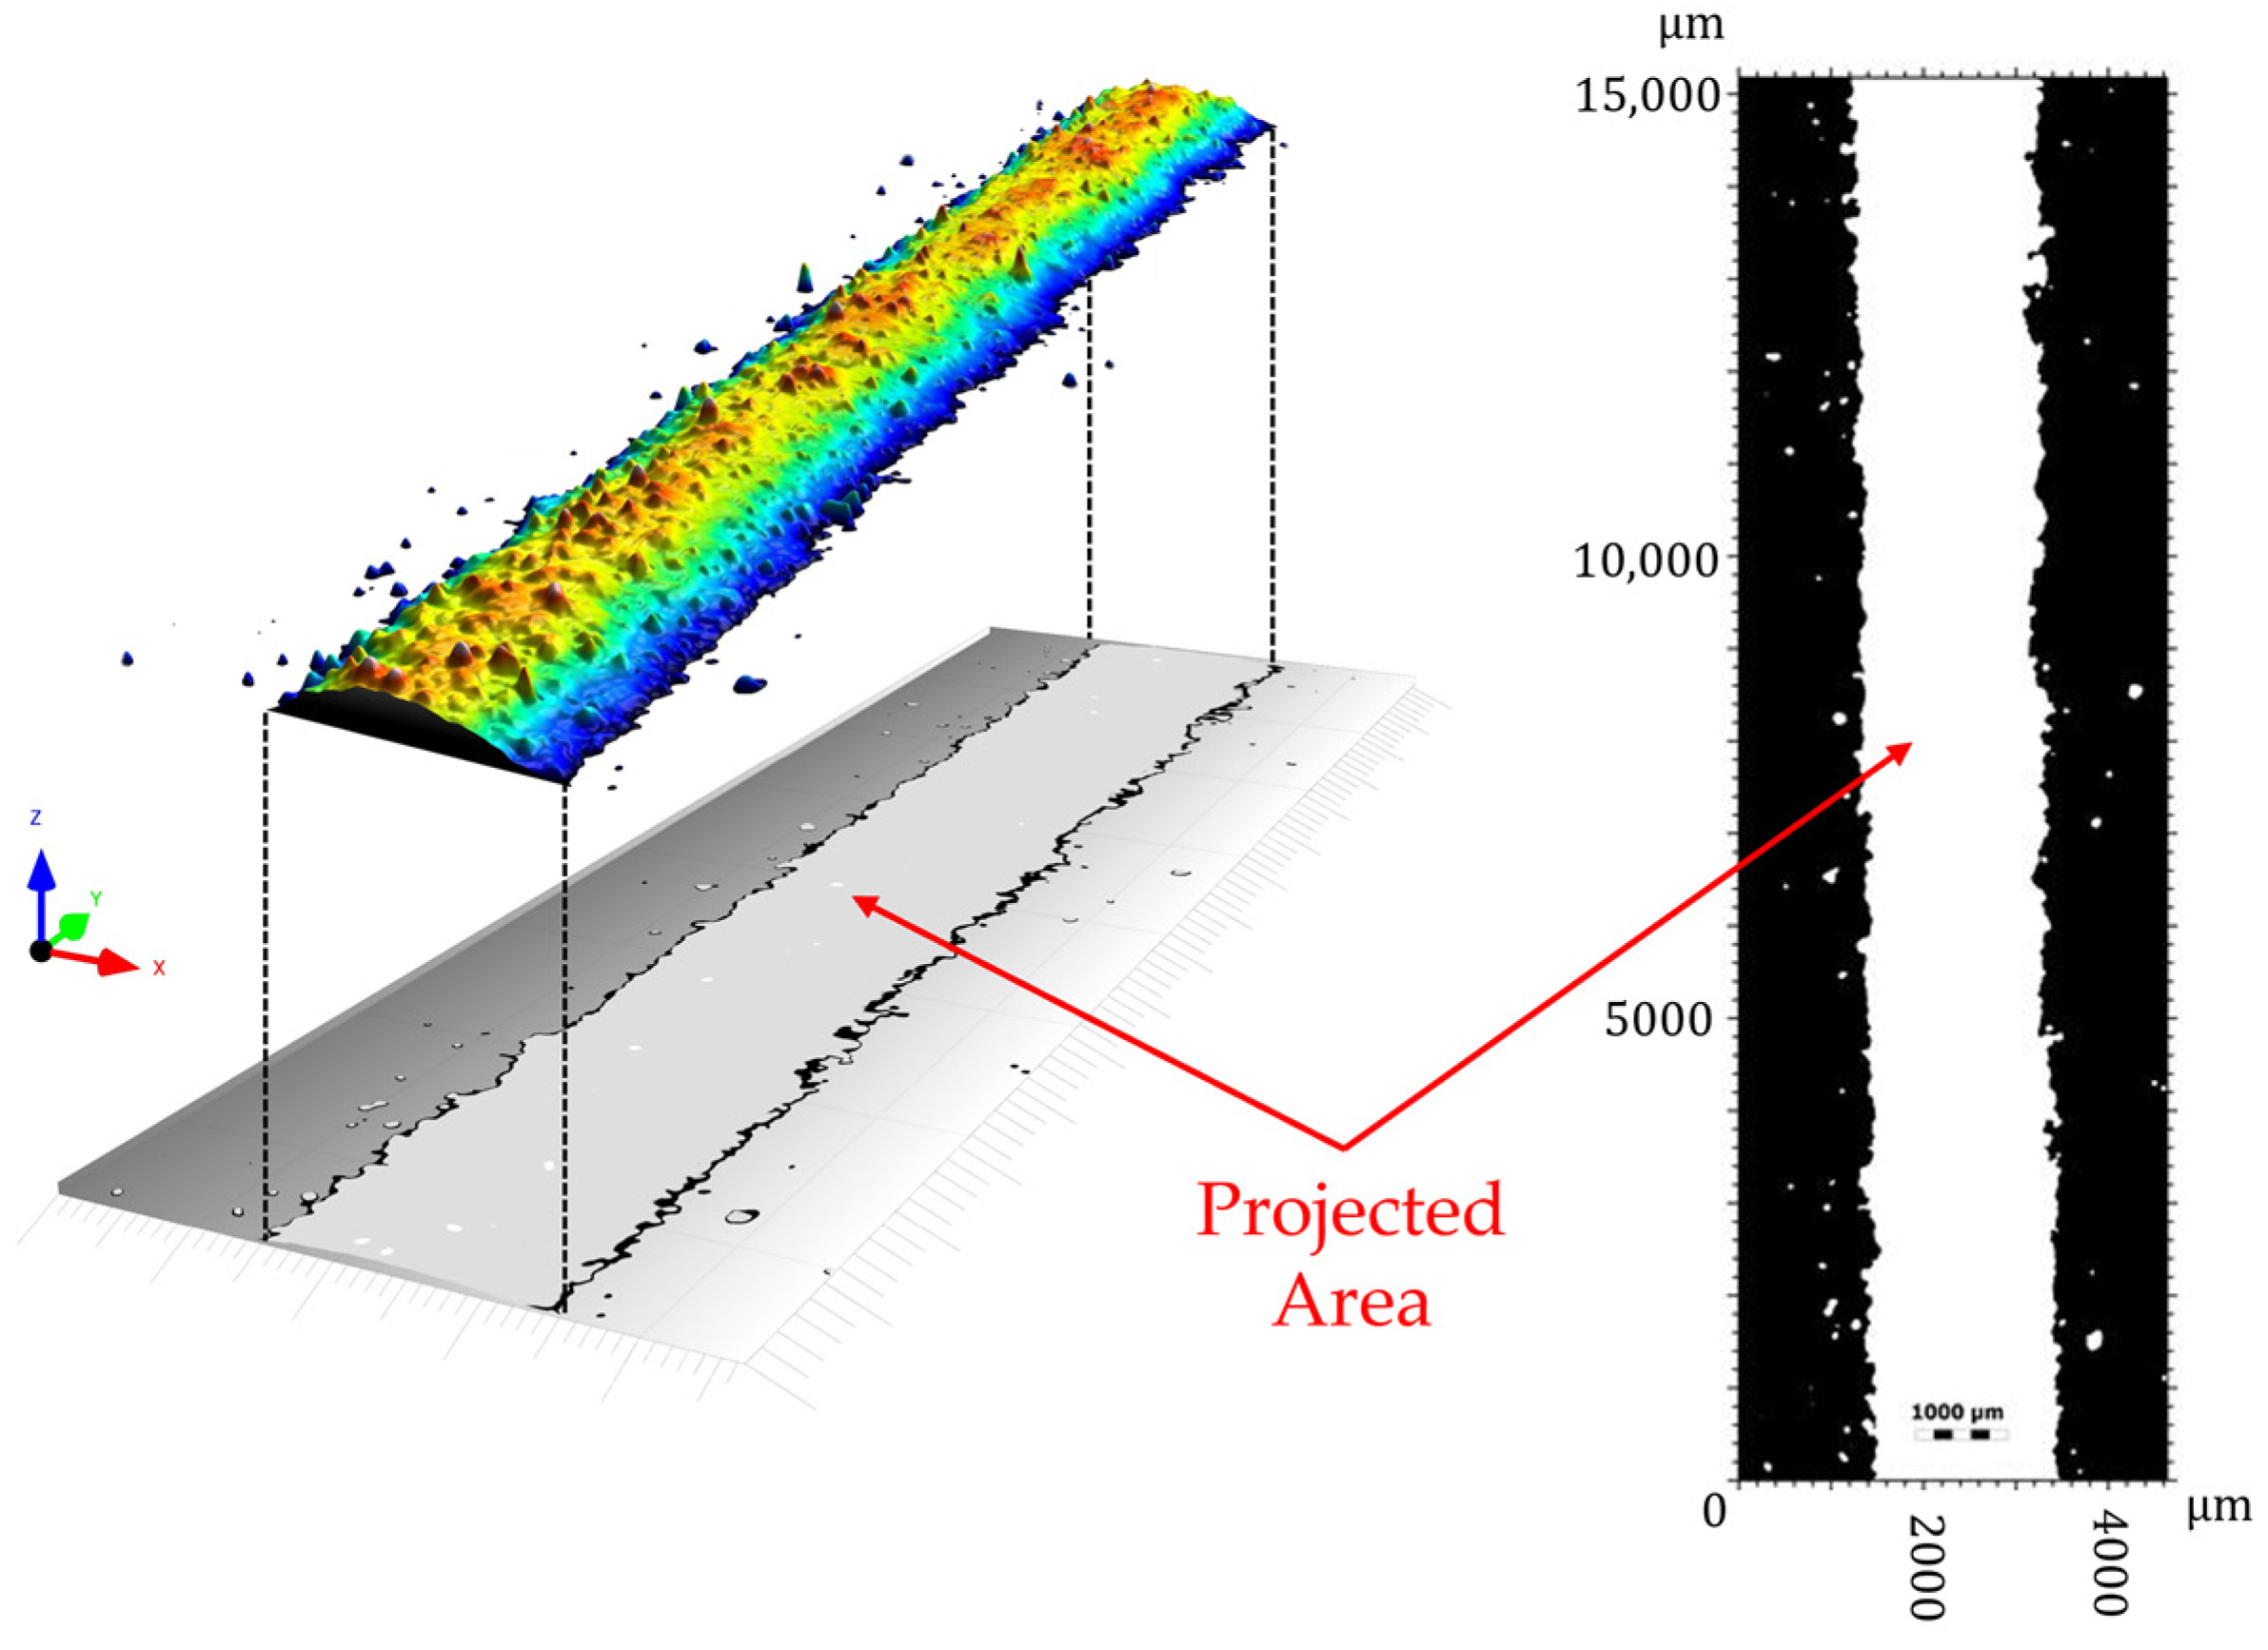
The M D P m F n X Y sub-index was calculated taking into consideration the projected area of each CST, as shown in Figure 2. This contribution considers track stability in the XY plane by analyzing the ratio between the mean projected perimeter and the real projected perimeter of the CST ( φ ), as shown in Equation (3). The mean projected perimeter is calculated from the mean width (w) and the length of CST (L), while the real projected perimeter has been extracted and calculated in ImageJ (version 1.54g).
M D P x x F y y X Y = 2 ( w + L ) φ
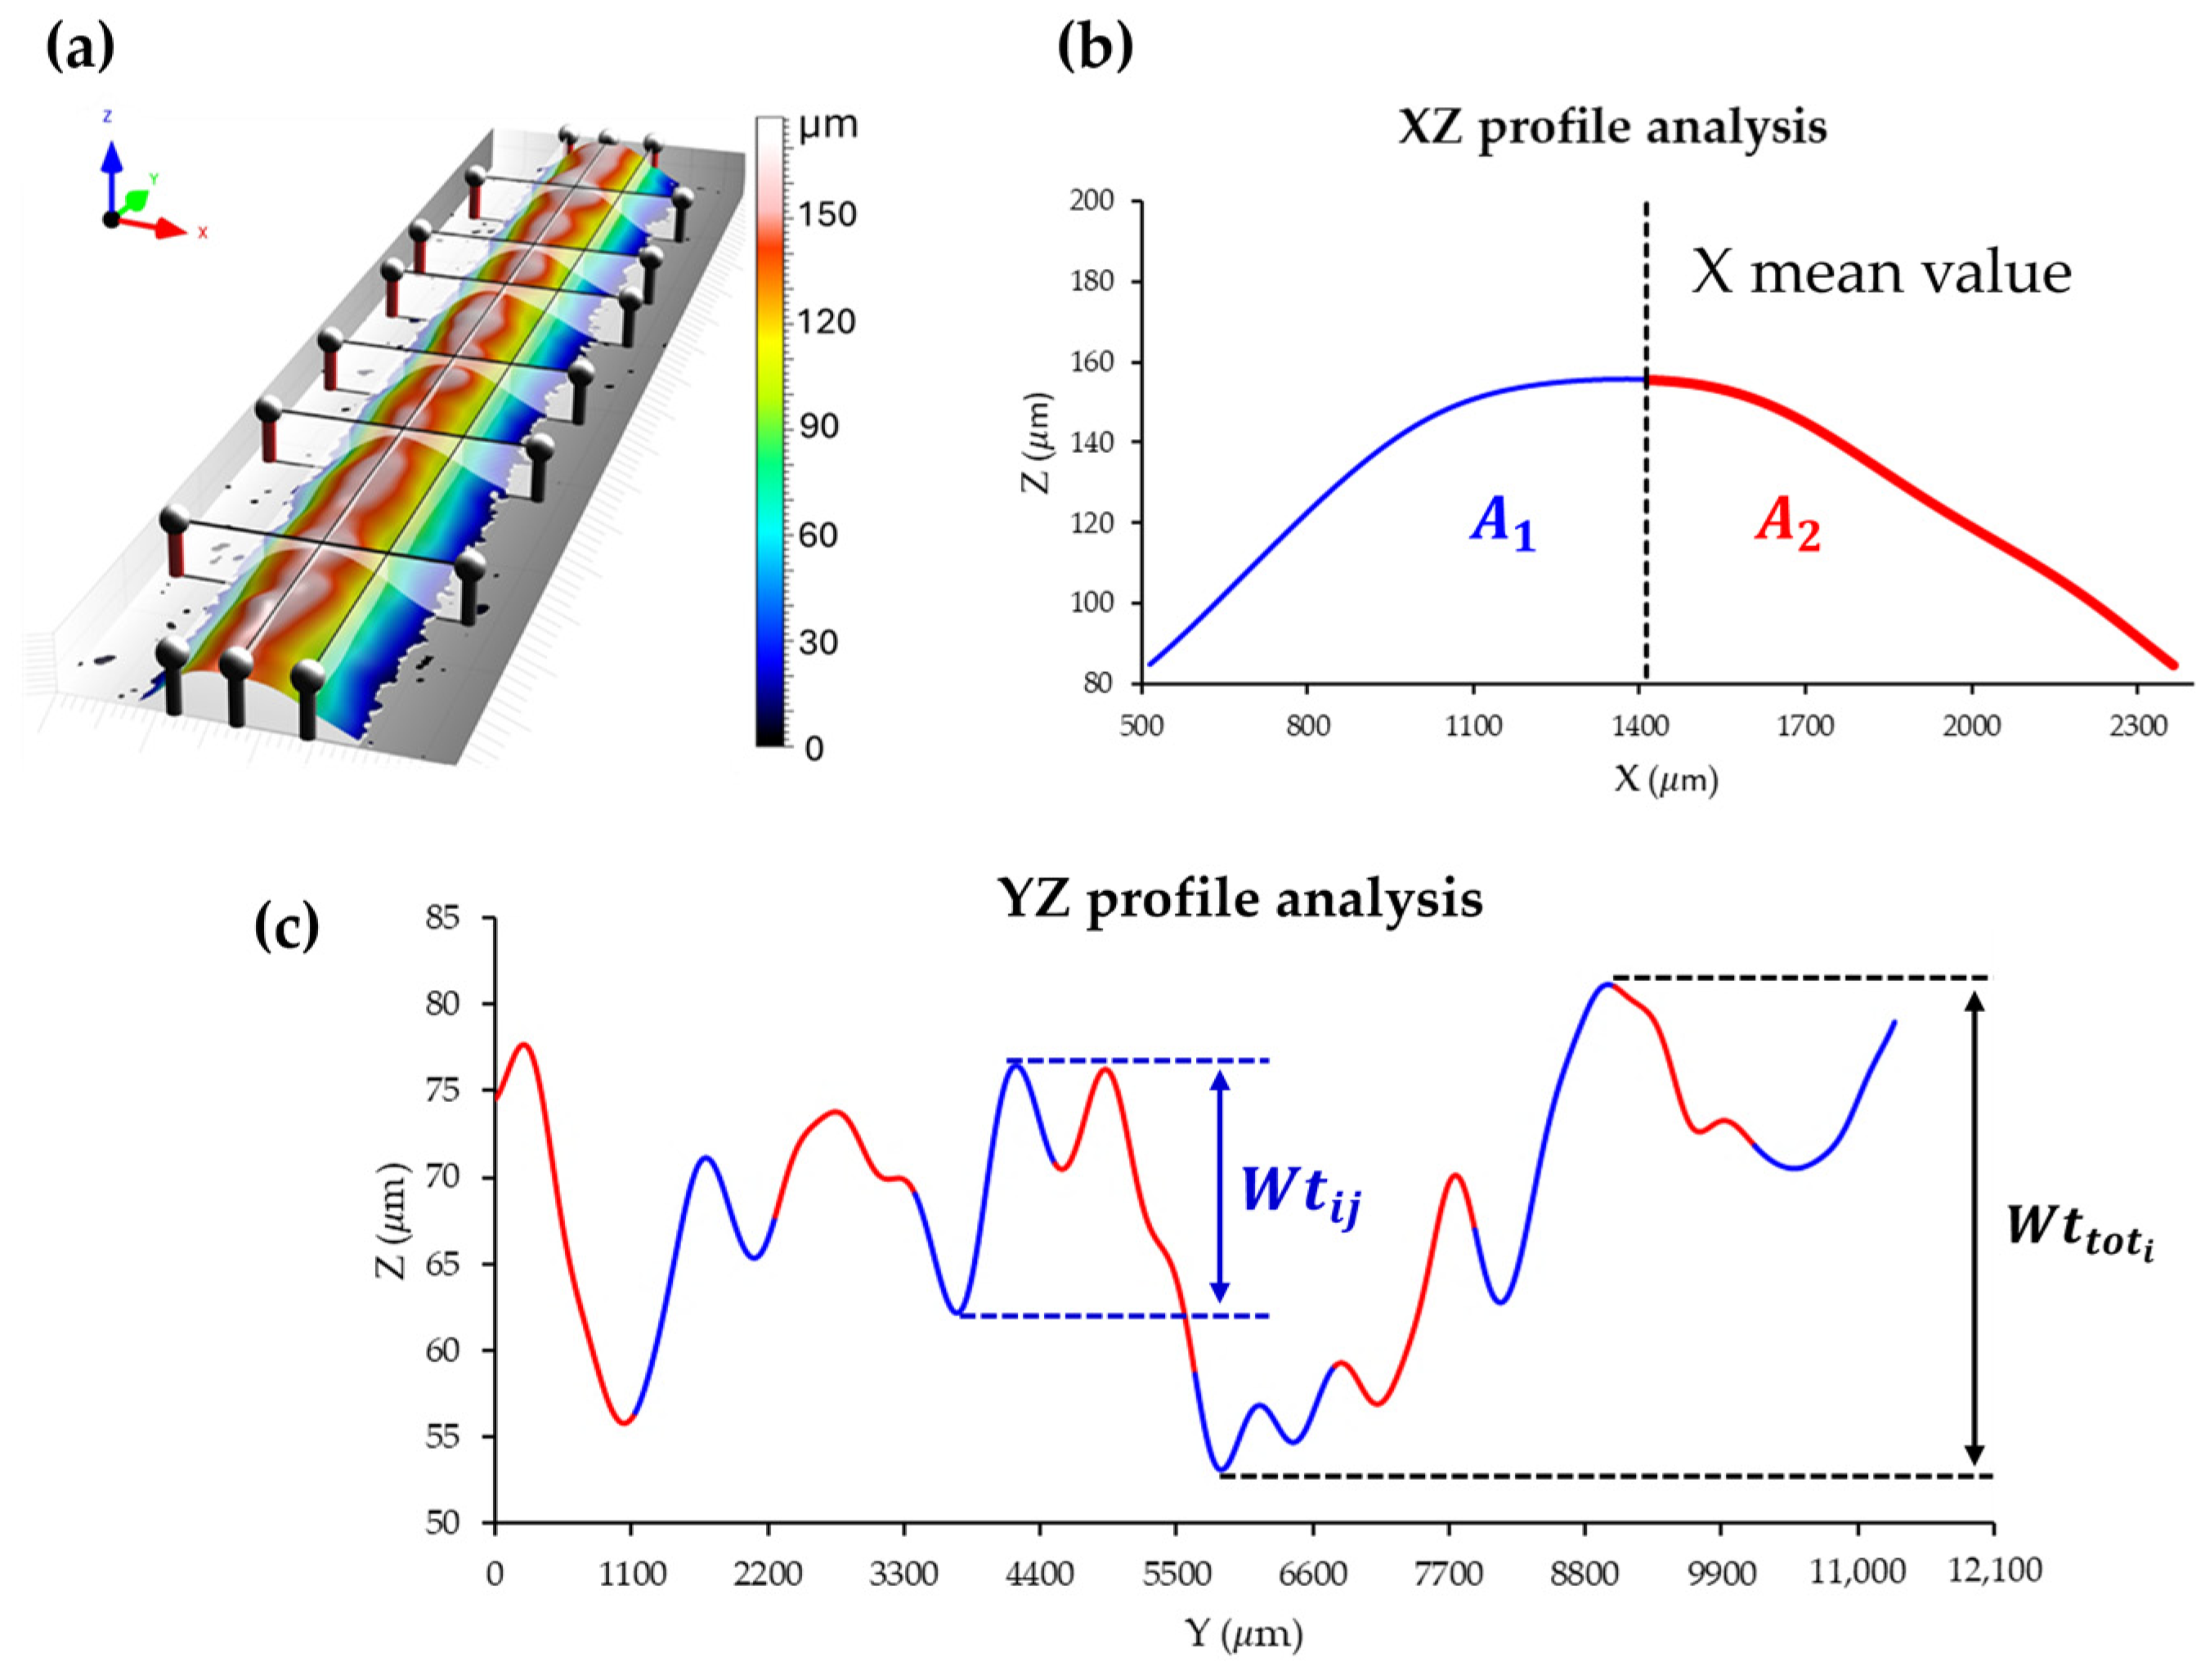
In order to avoid the effect of roughness on the final result, the calculation was performed on the waviness profiles when evaluating the XZ and YZ material distribution. Specifically, the waviness was extracted by applying an L-filter. Concerning M D P m F n X Z , the calculation is based on an analysis of the asymmetry related to the M-profile extracted in subsequent planes perpendicular to the length of the CSTs, as shown in Figure 3a and in Equation (4). In particular, this value is calculated as the error relating to a perfectly symmetrical profile, where the section area on both sides of the mean X value is equal. This approach is similar to the calculation method applied by Alya et al. [52]. The higher the difference between the two section areas, the lower will be the final percentage representing material distribution over XZ plane.
M D P m F n X Z = 1 M   i = 1 M 1 A 1 A 2 A 1 + A 2 i
Finally, the M D P m F n Y Z was evaluated. Similarly to the XY section’s evaluation, YZ evaluation was carried out by extracting profiles parallel to the length of the CSTs and then computing the data contained on them, as shown in Equation (5). For each N-profile the developed length ( L d e v e l o p e d i )—equal to the length obtained by following the profile curve—and the CST length L were extracted. Additionally, Figure 3b illustrates the local waviness maximum difference in height ( W t i j ), the total waviness maximum difference in height ( W t t o t ), and the mean waviness ( W t m e a n ), which is the arithmetic mean of ( W t t o t ). These are computed in accordance with Equation (5).
M D P m F n Y Z = 1 N i = 1 N O j = 1 O W t t o t i W t i j · L L d e v e l o p e d i   = 1 N i = 1 N W t t o t W t m e a n i · L L d e v e l o p e d i
To obtain a coherent material distribution index along the YZ planes ( M D P m F n Y Z ), the sampling frequency with which segments are extracted from the profile (O value in Equation (5)) has been selected wisely. It is important to note that if the sampling value is too high or too low, there is a significant risk of losing all the information. This is due to the generation of a Gaussian equiprobability distribution or a low-resolution analysis. In order to have a coherent analysis, all the segments have been extracted using a sampling value equal to 10. This value has been found to be adequate because it creates sampling regions ranging from 1.0 to 1.5 mm, meaning that the sampling lengths are smaller than the laser spot diameter and are therefore sensitive to changes in morphology generated by the melt pool.

2.4. Cross-Section Evaluation

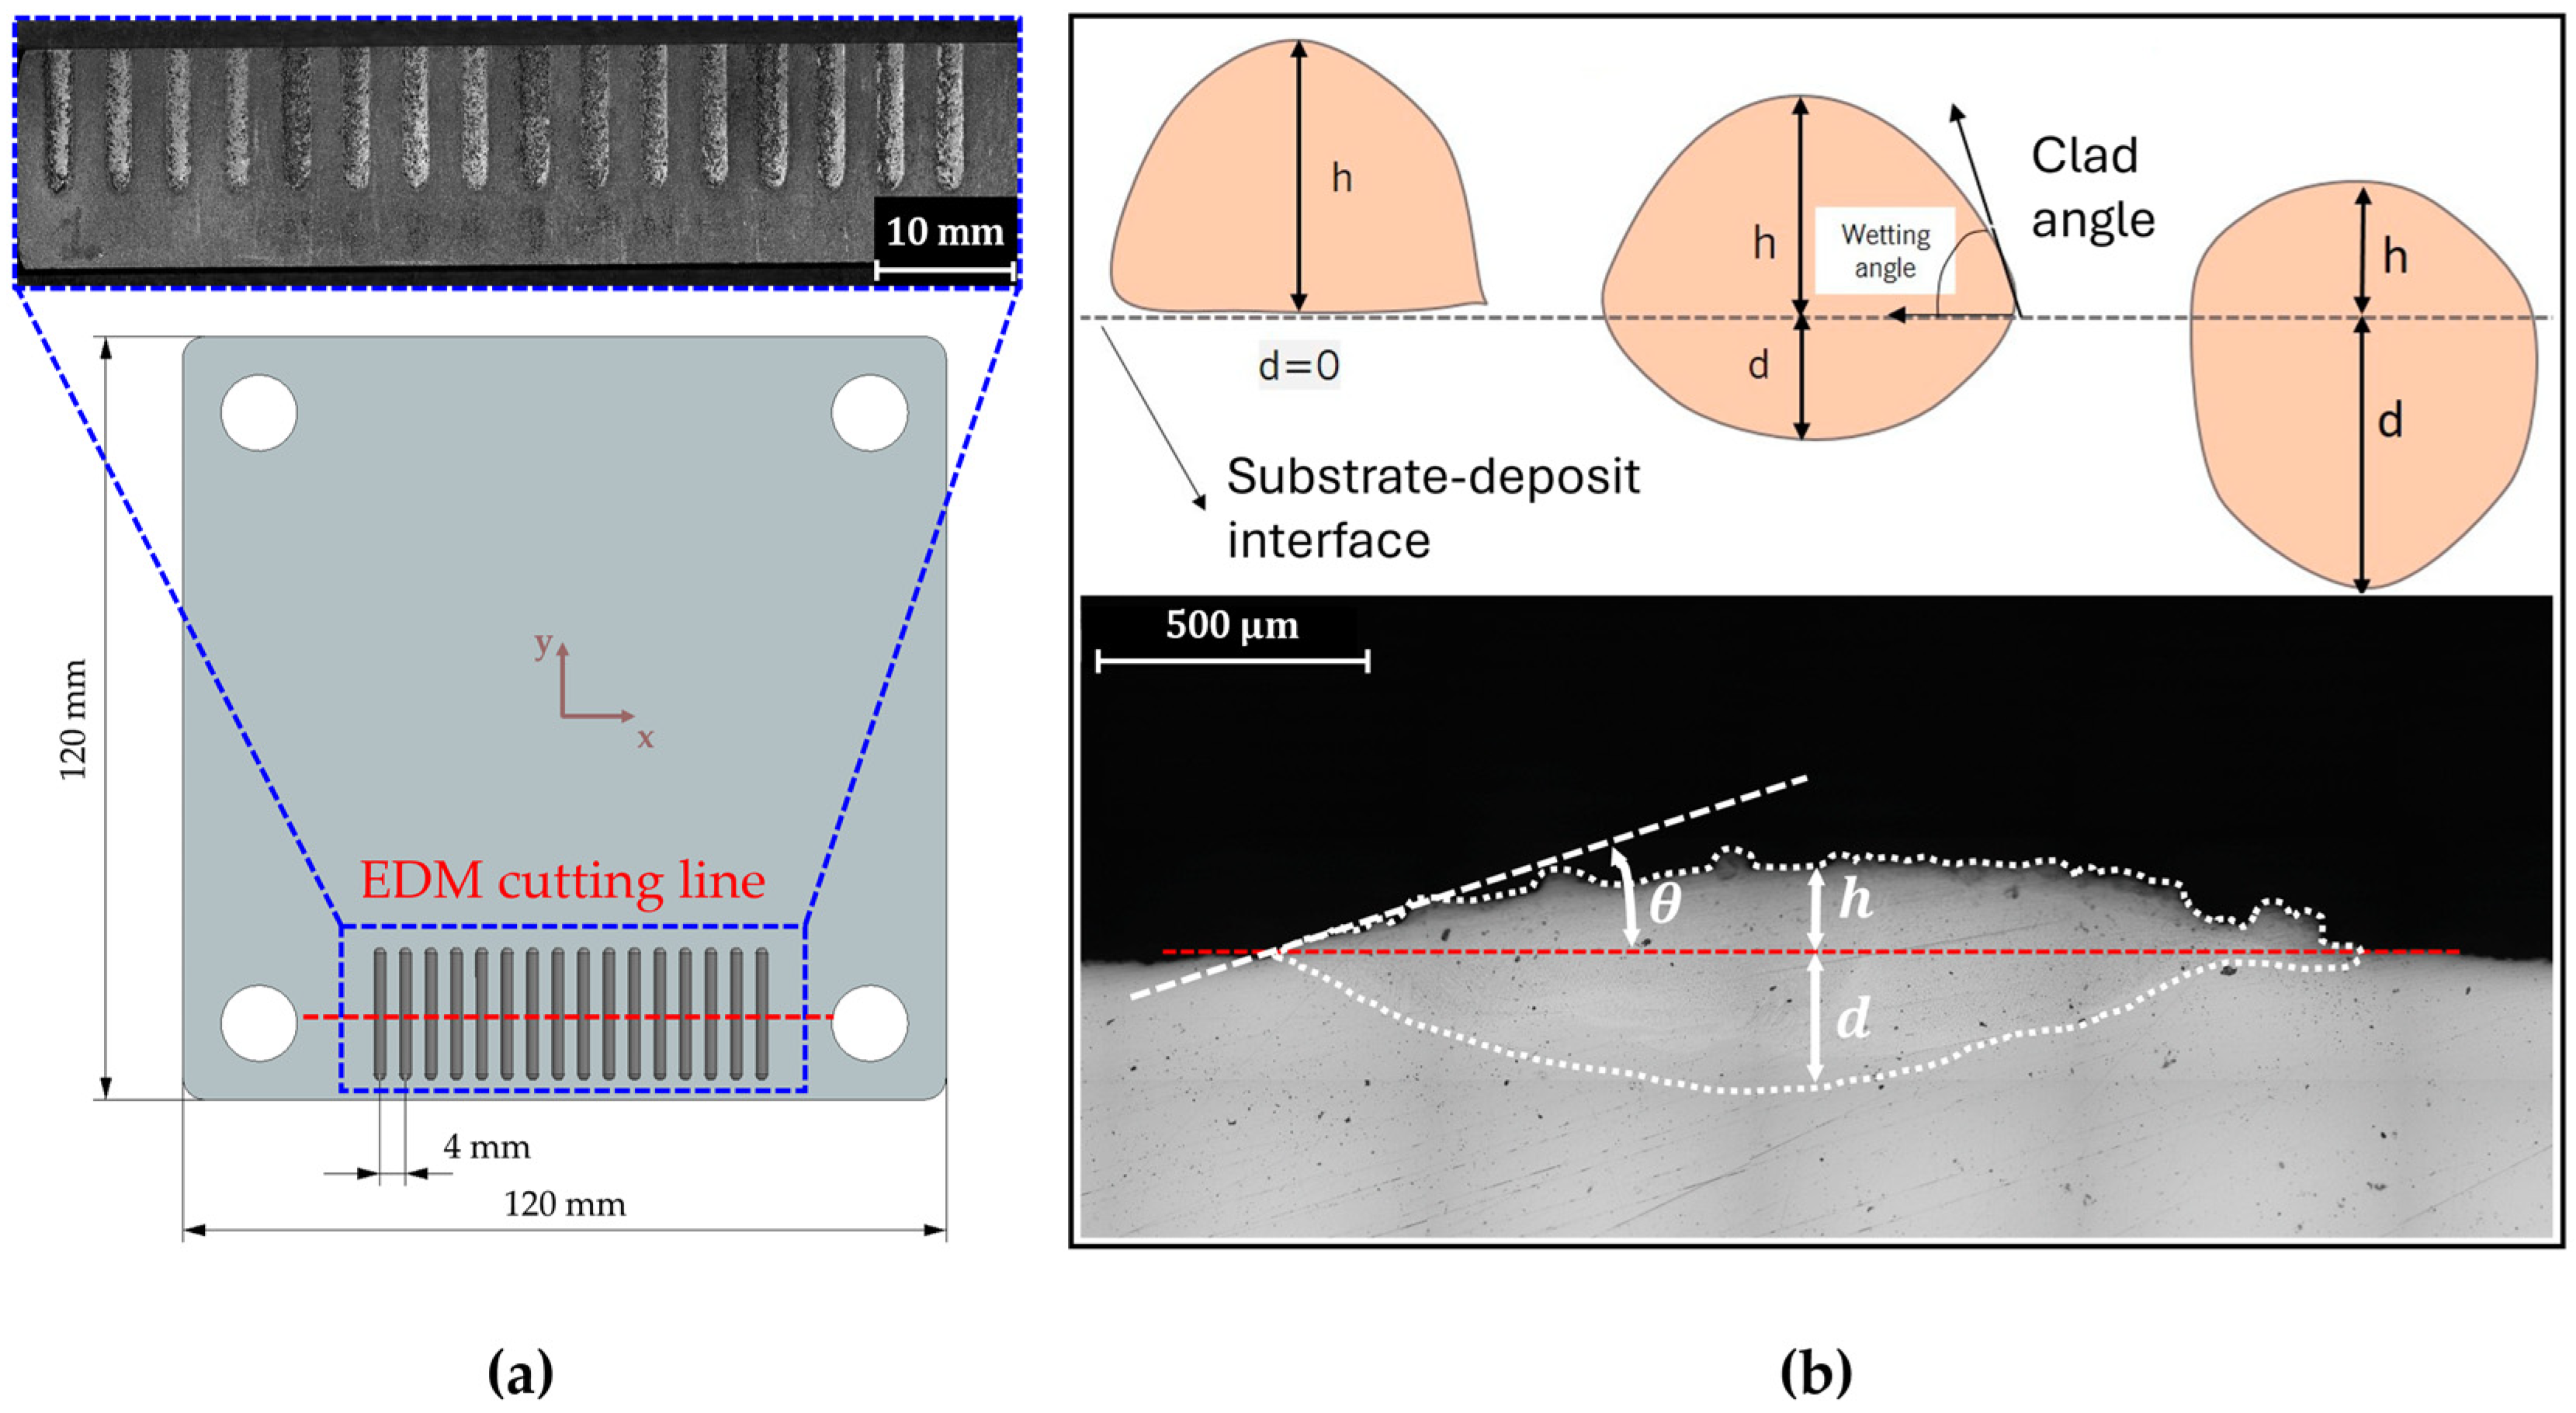
Following the surface analysis, the coated build plate was cut using the wire electrical discharge machining (EDM) across the single scan tracks, as illustrated in Figure 4a. The extracted samples were ground with 1000/4000 grit SiC paper and mirror polished with an oily suspension of synthetic diamond paste (1 μm diameter). Scanning electron microscopy (SEM) was performed on a Tescan VEGA3 (TESCAN GROUP, Brno, Czech Republic) equipped with an EDAX Element energy-dispersive spectroscopy (EDS) (EDAX, Inc., Mahwah, New Jersey, United States) microanalysis. The employment of these techniques in combination has proven to be a pivotal factor in attaining a remarkably intricate classification of the microstructure. The cross-section analysis of CSTs generated through the DED process utilizes a set of specific indices to attribute numerical and experimental meaning to the generated data. Between them, the literature [21] highlighted as fundamental the dilution ratio ( α ). This parameter can be expressed as the aspect ratio of the deposited melt pool related to the build plate reference. Particularly, as defined in Equation (6) and shown in Figure 4b, it can be expressed using a parametrization generated on the height of material below the substrate level (d) and the height of material over the substrate level (h).
α = d h + d 100
To fully characterize the melt pool, the clad angle [53], shown in Figure 4b, has been identified and characterized starting from the SEM micrograph.
All these parameters are then finally compared to the linear energy density (El) derived from the ratio of laser power (P) and scanning speed (v) as shown in Equation (7). This parameter is employed to estimate the energy input into the melt pool.
E l = P v = J m m

2.5. Mechanical Perfomance

The directed energy deposition process resulted in the formation of several distinct regions along the deposited CST bead. To evaluate the mechanical properties of the substrate-coating systems, microhardness testing was conducted at various locations within the melt pool. This approach allowed microhardness variations to be assessed across the coated material, the material mixing zone, the heat-affected zone (HAZ) of the substrate, and the base material. Microhardness tests were conducted on the polished cross-sections of the CSTs using a Qness 60A EVO machine (QATM GmbH, Mammelzen, Germany) with a load of 25 gF and a dwell time of 10 s (according to ISO 4545 [54]). A Knoop indenter was chosen because it is ideal for analyzing thin layers and hard materials.

3. Results and Discussion

3.1. Powder Characterization

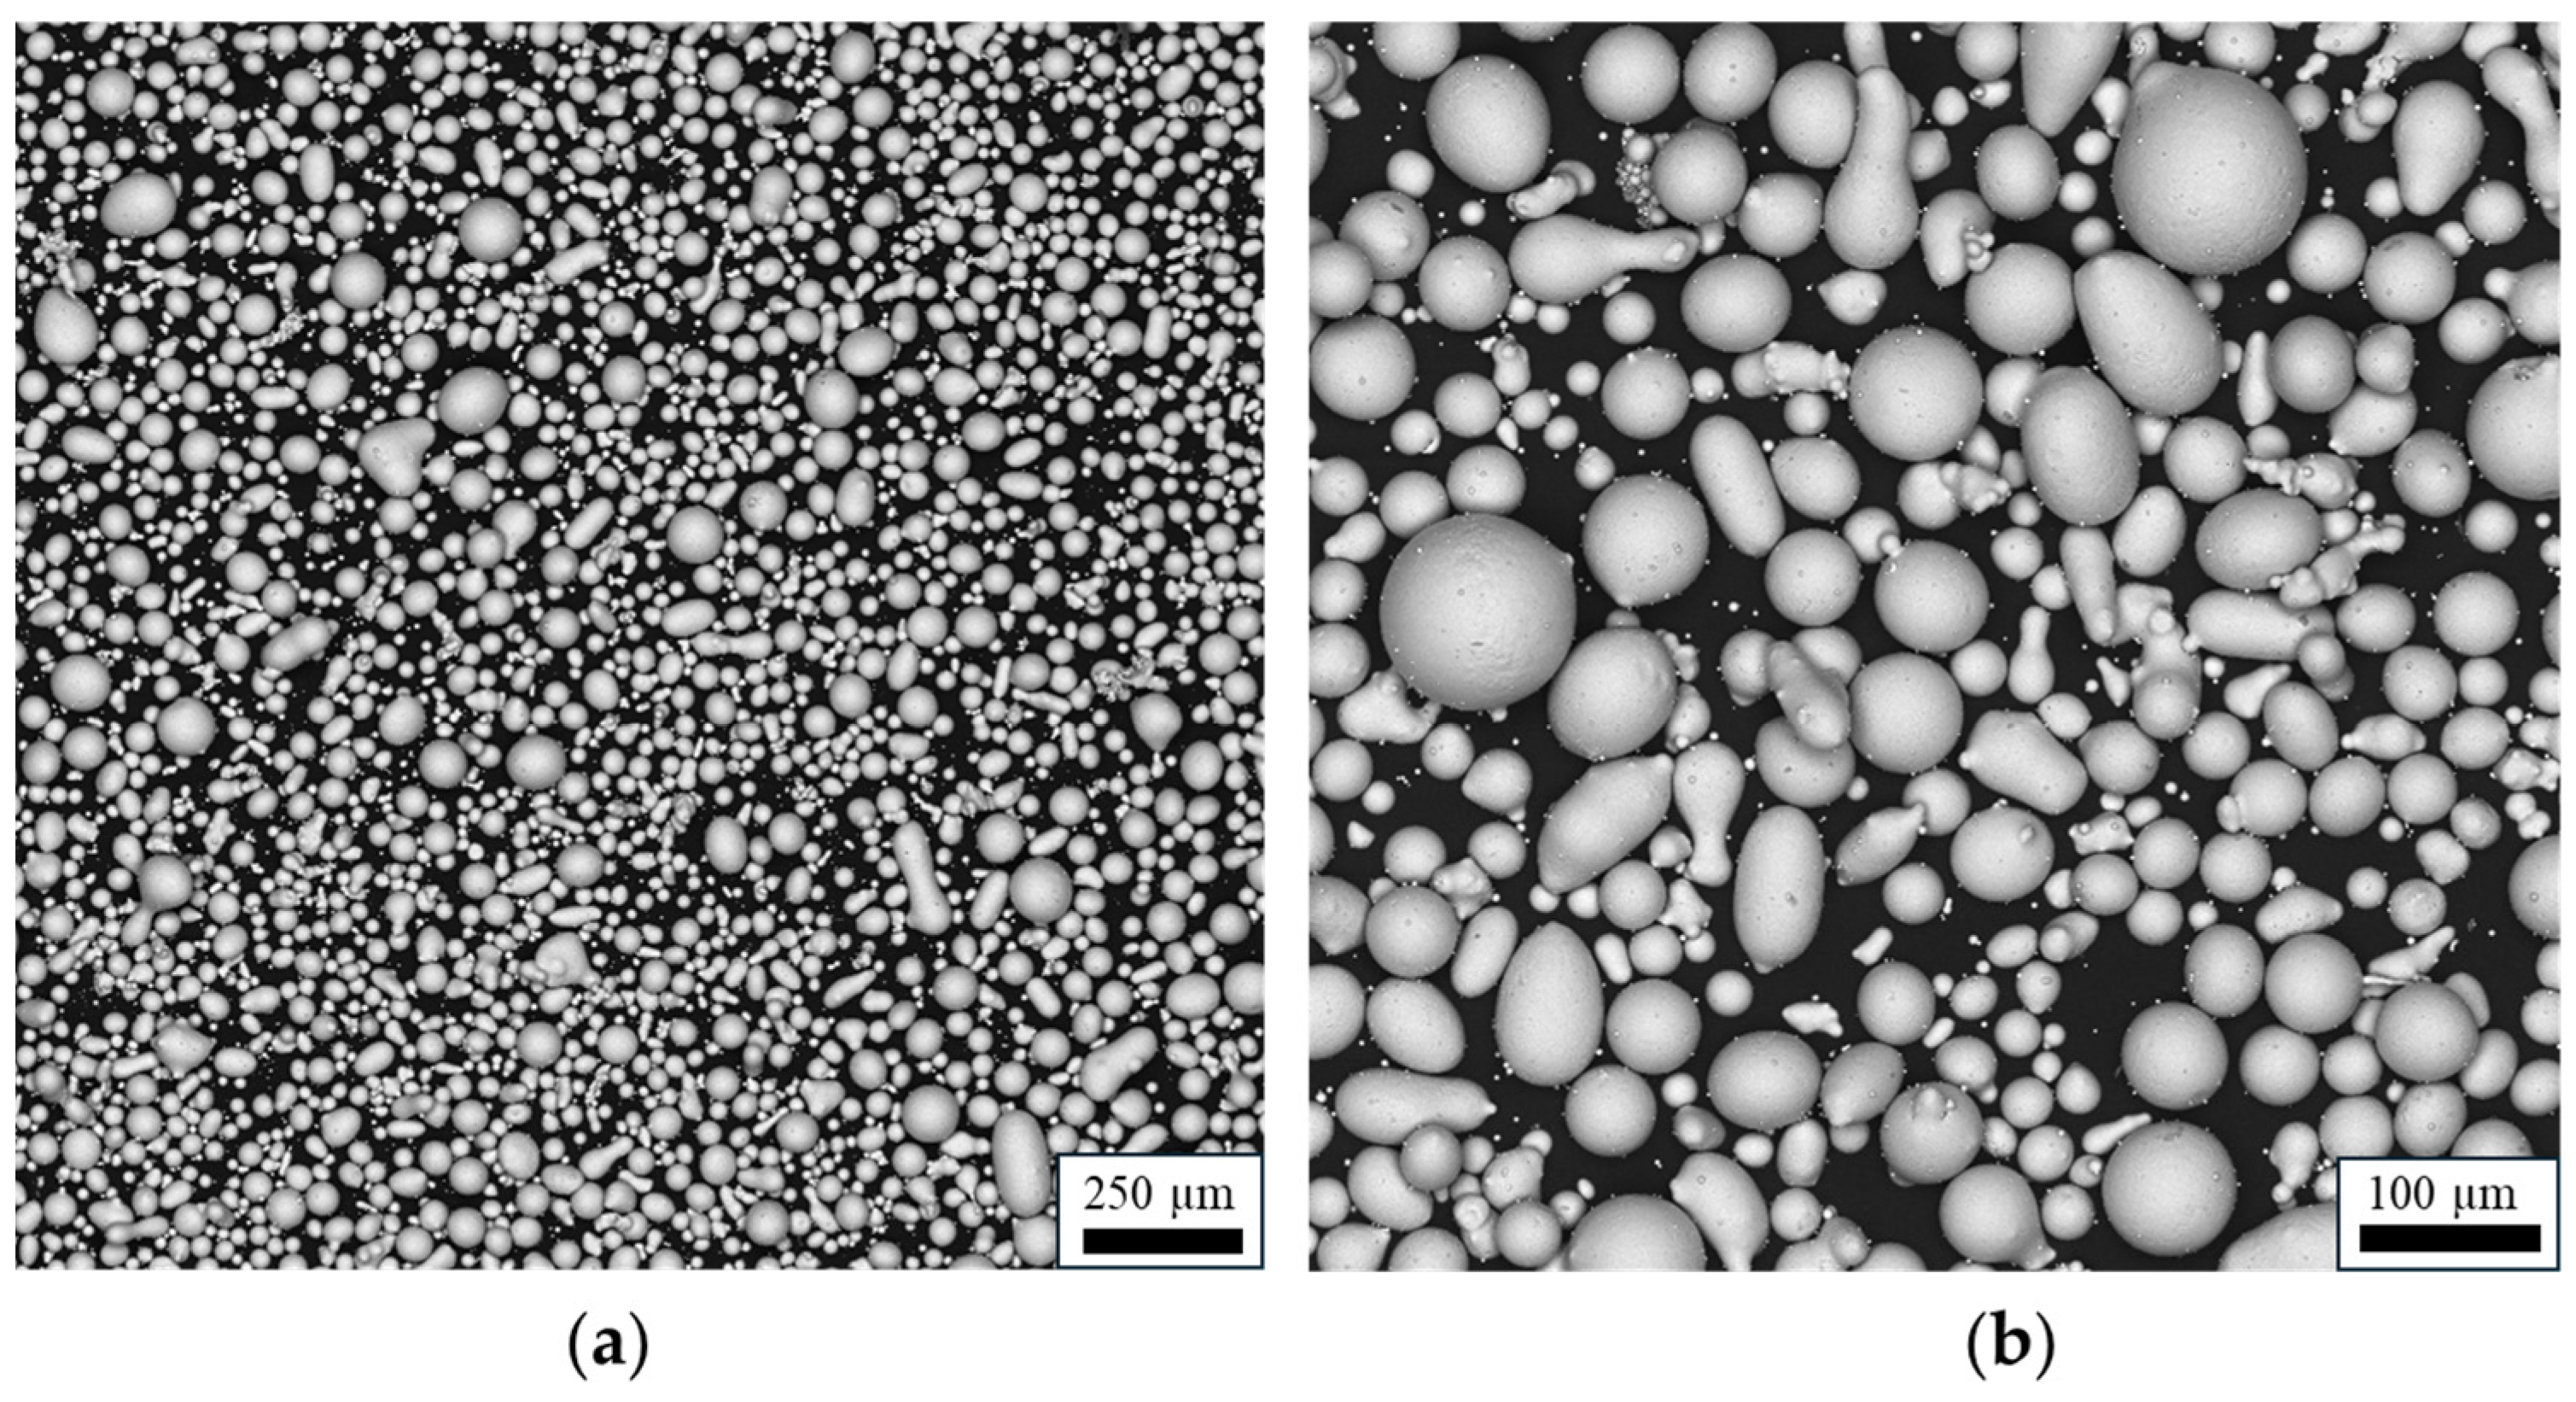
SEM micrographs of the Colmonoy 227-F powder are reported in Figure 5.
Figure 5 clearly shows that although the Colmonoy 227-F has morphological features typical of a gas-atomized DED powder, such as spherical particles, a large quantity of satellite powder particles welded to the surface of the larger particles is notable. The relevant granulometric values of the virgin powder were calculated using low-magnification micrographs. The main distribution values are as follows: D10 of 3.55 µm, D50 (median) of 19.95 µm, and D90 of 36.61 µm. The results of the energy dispersive spectroscopy performed on virgin Colmonoy 227-F powder are reported in Table 3 and are compared with the nominal values.
Regarding the weight percentage values reported in Table 3, it is worth mentioning that the percentage of iron detected is much higher than that reported in the datasheet. This can be attributed to the high percentage of nickel in the alloy, which causes ‘fluorescence’ effects in some elements that have energy emission lines close to those of nickel, such as iron. Consequently, higher-than-actual iron percentages are visualized and detected at the expense of the silicon (Si) and phosphorus (P) percentages, which are lower than expected according to the Wall-Colmonoy datasheet values in Table 3.
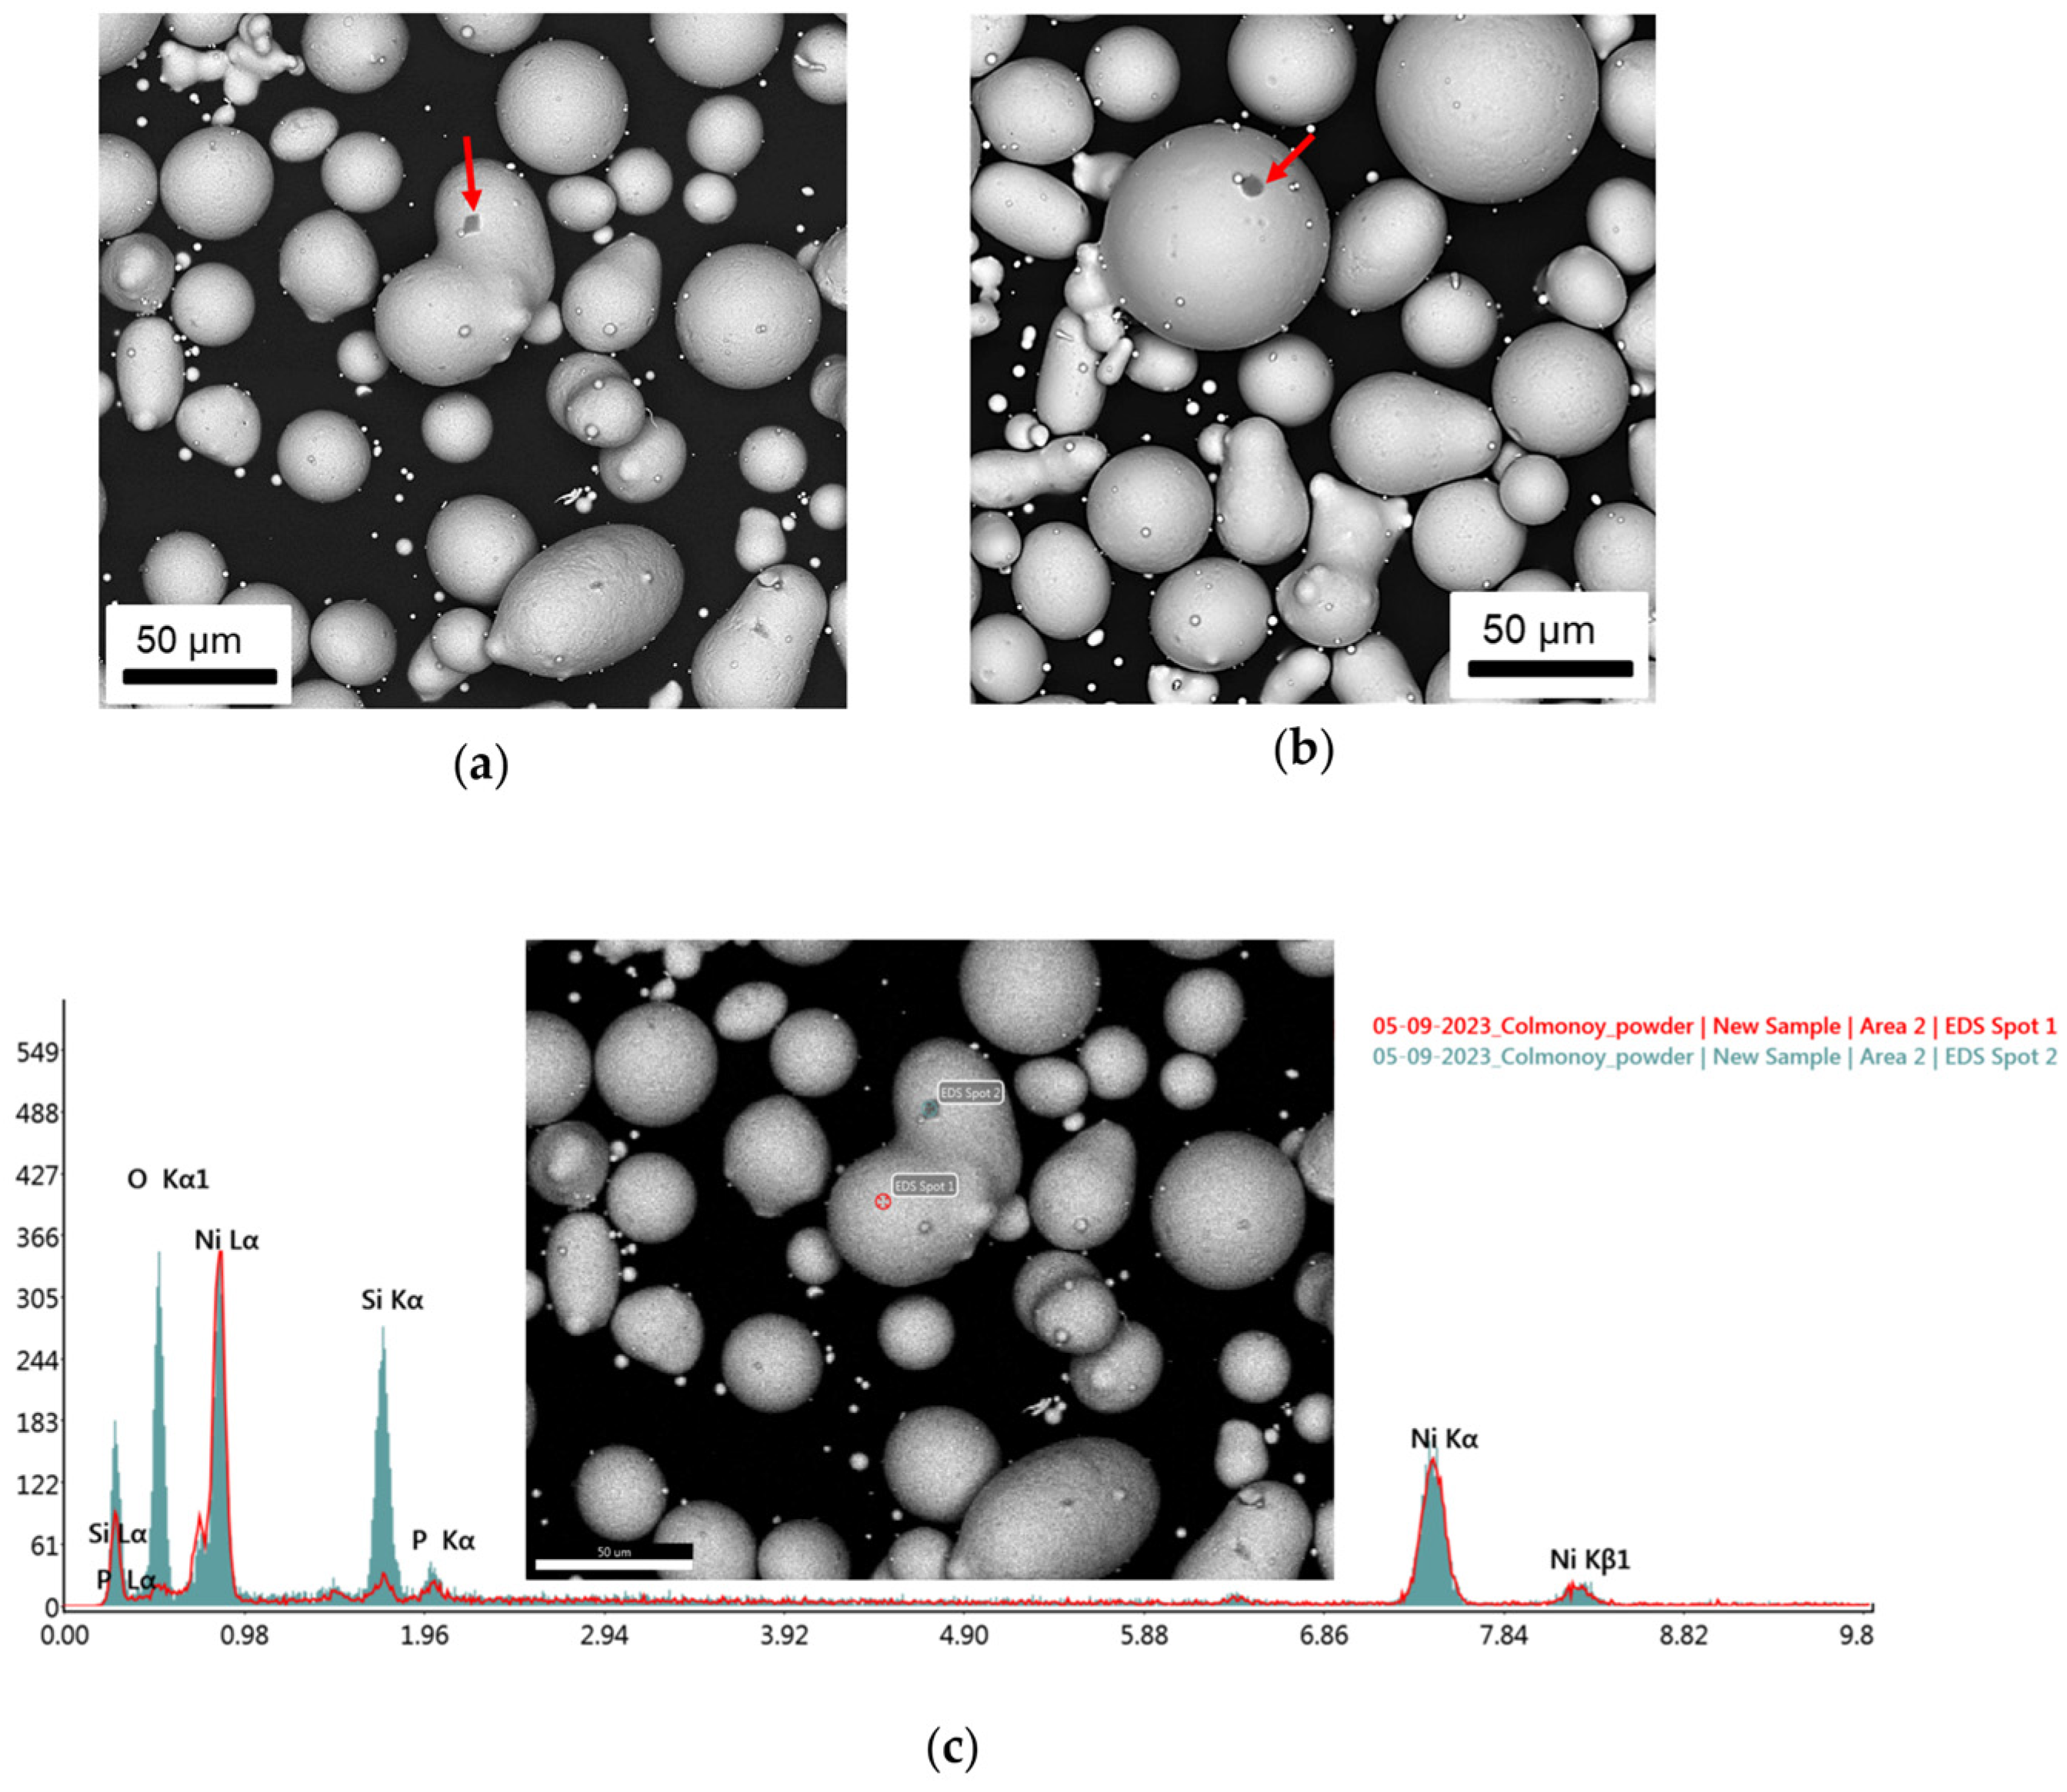
Using the backscattered electron (BSE) signal to characterize the morphology of the powder particles also allowed us to highlight areas of different contrast on some of their surfaces, as indicated by the arrows in Figure 6. Chemical analysis of the dark-contrast areas indicated by the arrows in Figure 6 revealed high levels of silicon and oxygen, confirming that these are silicon oxides (SiO2) formed on the surface of Colmonoy 227 particles during the manufacturing process.
The presence of these oxides has not been reported elsewhere in the literature [42]. The ability to melt these oxides during LP-DED was evaluated by examining the cross sections of the deposited tracks. Additionally, elemental redistribution was controlled during scanning electron microscope (SEM) inspections.

3.2. Coating Tracks Structural Characterization

3.2.1. Surface Geometrical Characterization

Digital microscopy analysis of the CSTs enables evaluation of track geometry and surface topology. These factors contribute to coating integrity and play a significant part in ensuring the Colmonoy material is distributed uniformly across the 304 SS surface. As illustrated in Figure 7, the normalized deposited volume over the build plate ( V P m F n N ) shows the classical dependency related to laser power and scanning speed. Particularly for each laser power condition, the V P m F n N values decrease with decreasing scanning speed.
On the other hand, when the same scanning speed is considered, the normalized deposited volume V P m F n N increases by increasing laser power until a peak is reached at the P09-Fn conditions; that is, further increases in laser power do not result in any further increase in the deposited volume. This demonstrates the maximum potential of the DED process for achieving an optimized CST. The coating process can be optimized without wasting powder up to a laser power of 900 W; any further increase results in power loss and inefficient processing.

3.2.2. Material Distribution Index Analysis

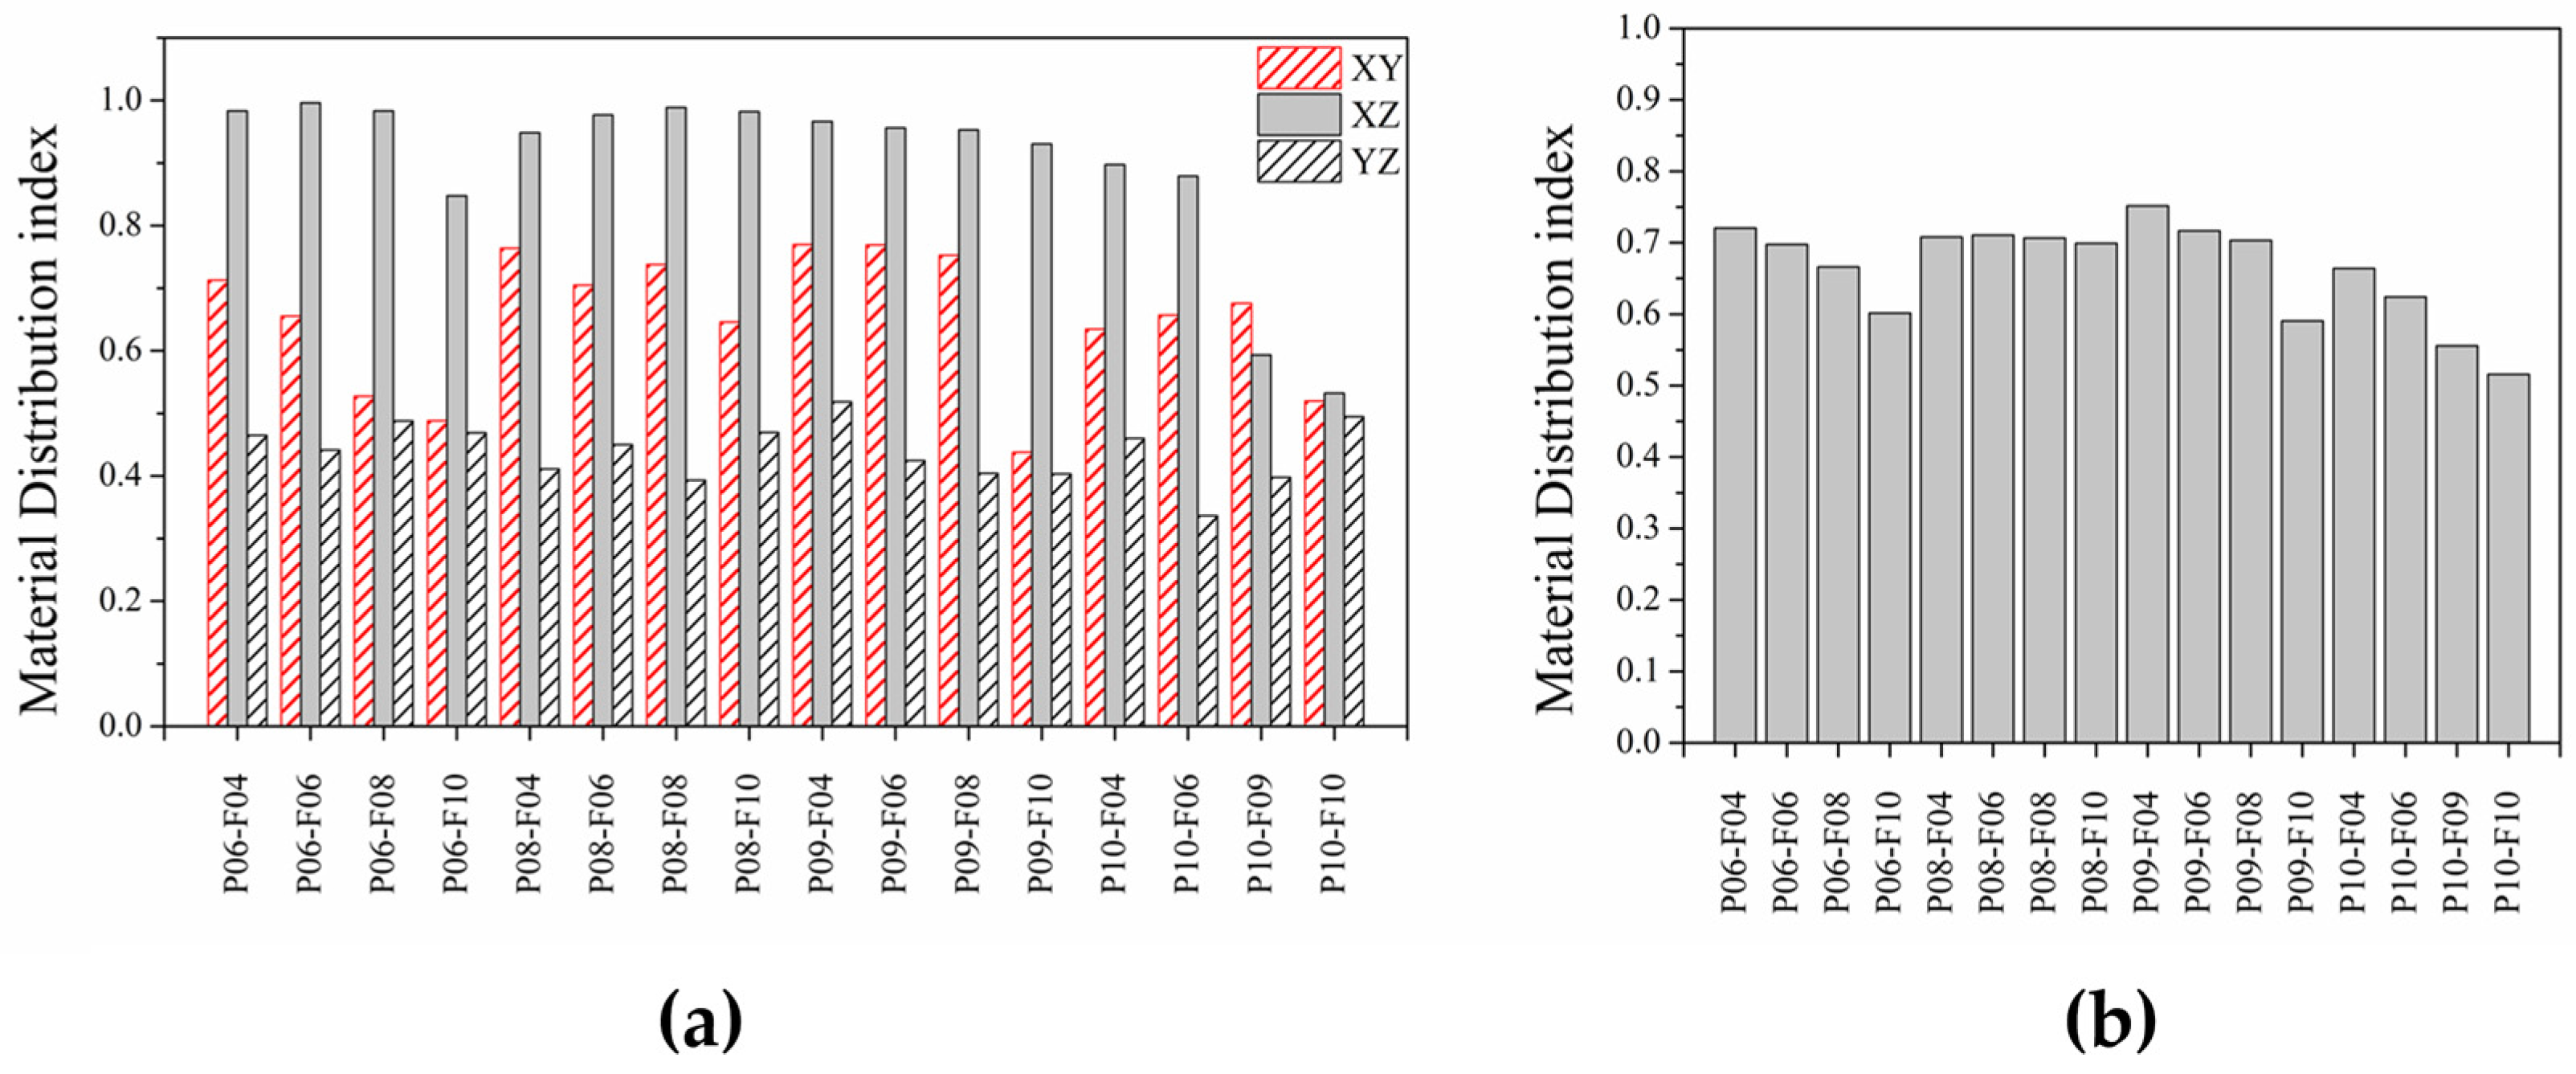
As mentioned above, analysis of the deposited material is insufficient for a full understanding of the quality and process capabilities of this DED process when depositing CSTs. For this reason, a new index has been developed specifically for this purpose and labelled ‘Material distribution index’ ( M D P m F n ) (see Section 2.3). Table S1 in Supplementary Materials and Figure 8 show the calculated total indexes and their components.
The characterization of material distribution on different planes provides valuable insights into process stability and the impact of DOE parameters on achieving high-quality CSTs. The following key findings emerge from this analysis:
  • XY plane analysis ( M D P m F n X Y ): the analysis of CSTs reveals that laser power (P) is the primary parameter influencing mean width. Specifically, increasing the power results in a larger melt pool, and vice versa. With regard to track stability and the ratio of material distribution on the XY plane, the analysis reveals a strong dependency of CST stability on scanning speed (V). Indeed, a higher scanning speed is always associated with a higher track perimeter and lower process stability. This phenomenon is visible in tracks characterized by lower laser power input; particularly, M D P 06 F n X Y shows a clear decreasing trend in the material distribution index related to the XY plane as scanning speed is increased (see Table S1 and Figure 8). The same trend can also be observed for M D P 08 F n X Y and M D P 09 F n X Y conditions. However, this trend is less evident, since the increase in laser power ensures meltpool stability during the printing process by means of an increase in linear energy density input. M D P 10 F n X Y conditions are characterized by a reverse trend that can be attributed to the interaction between laser and powder, as will be discussed in XZ plane analysis ( M D P m F n X Z ).
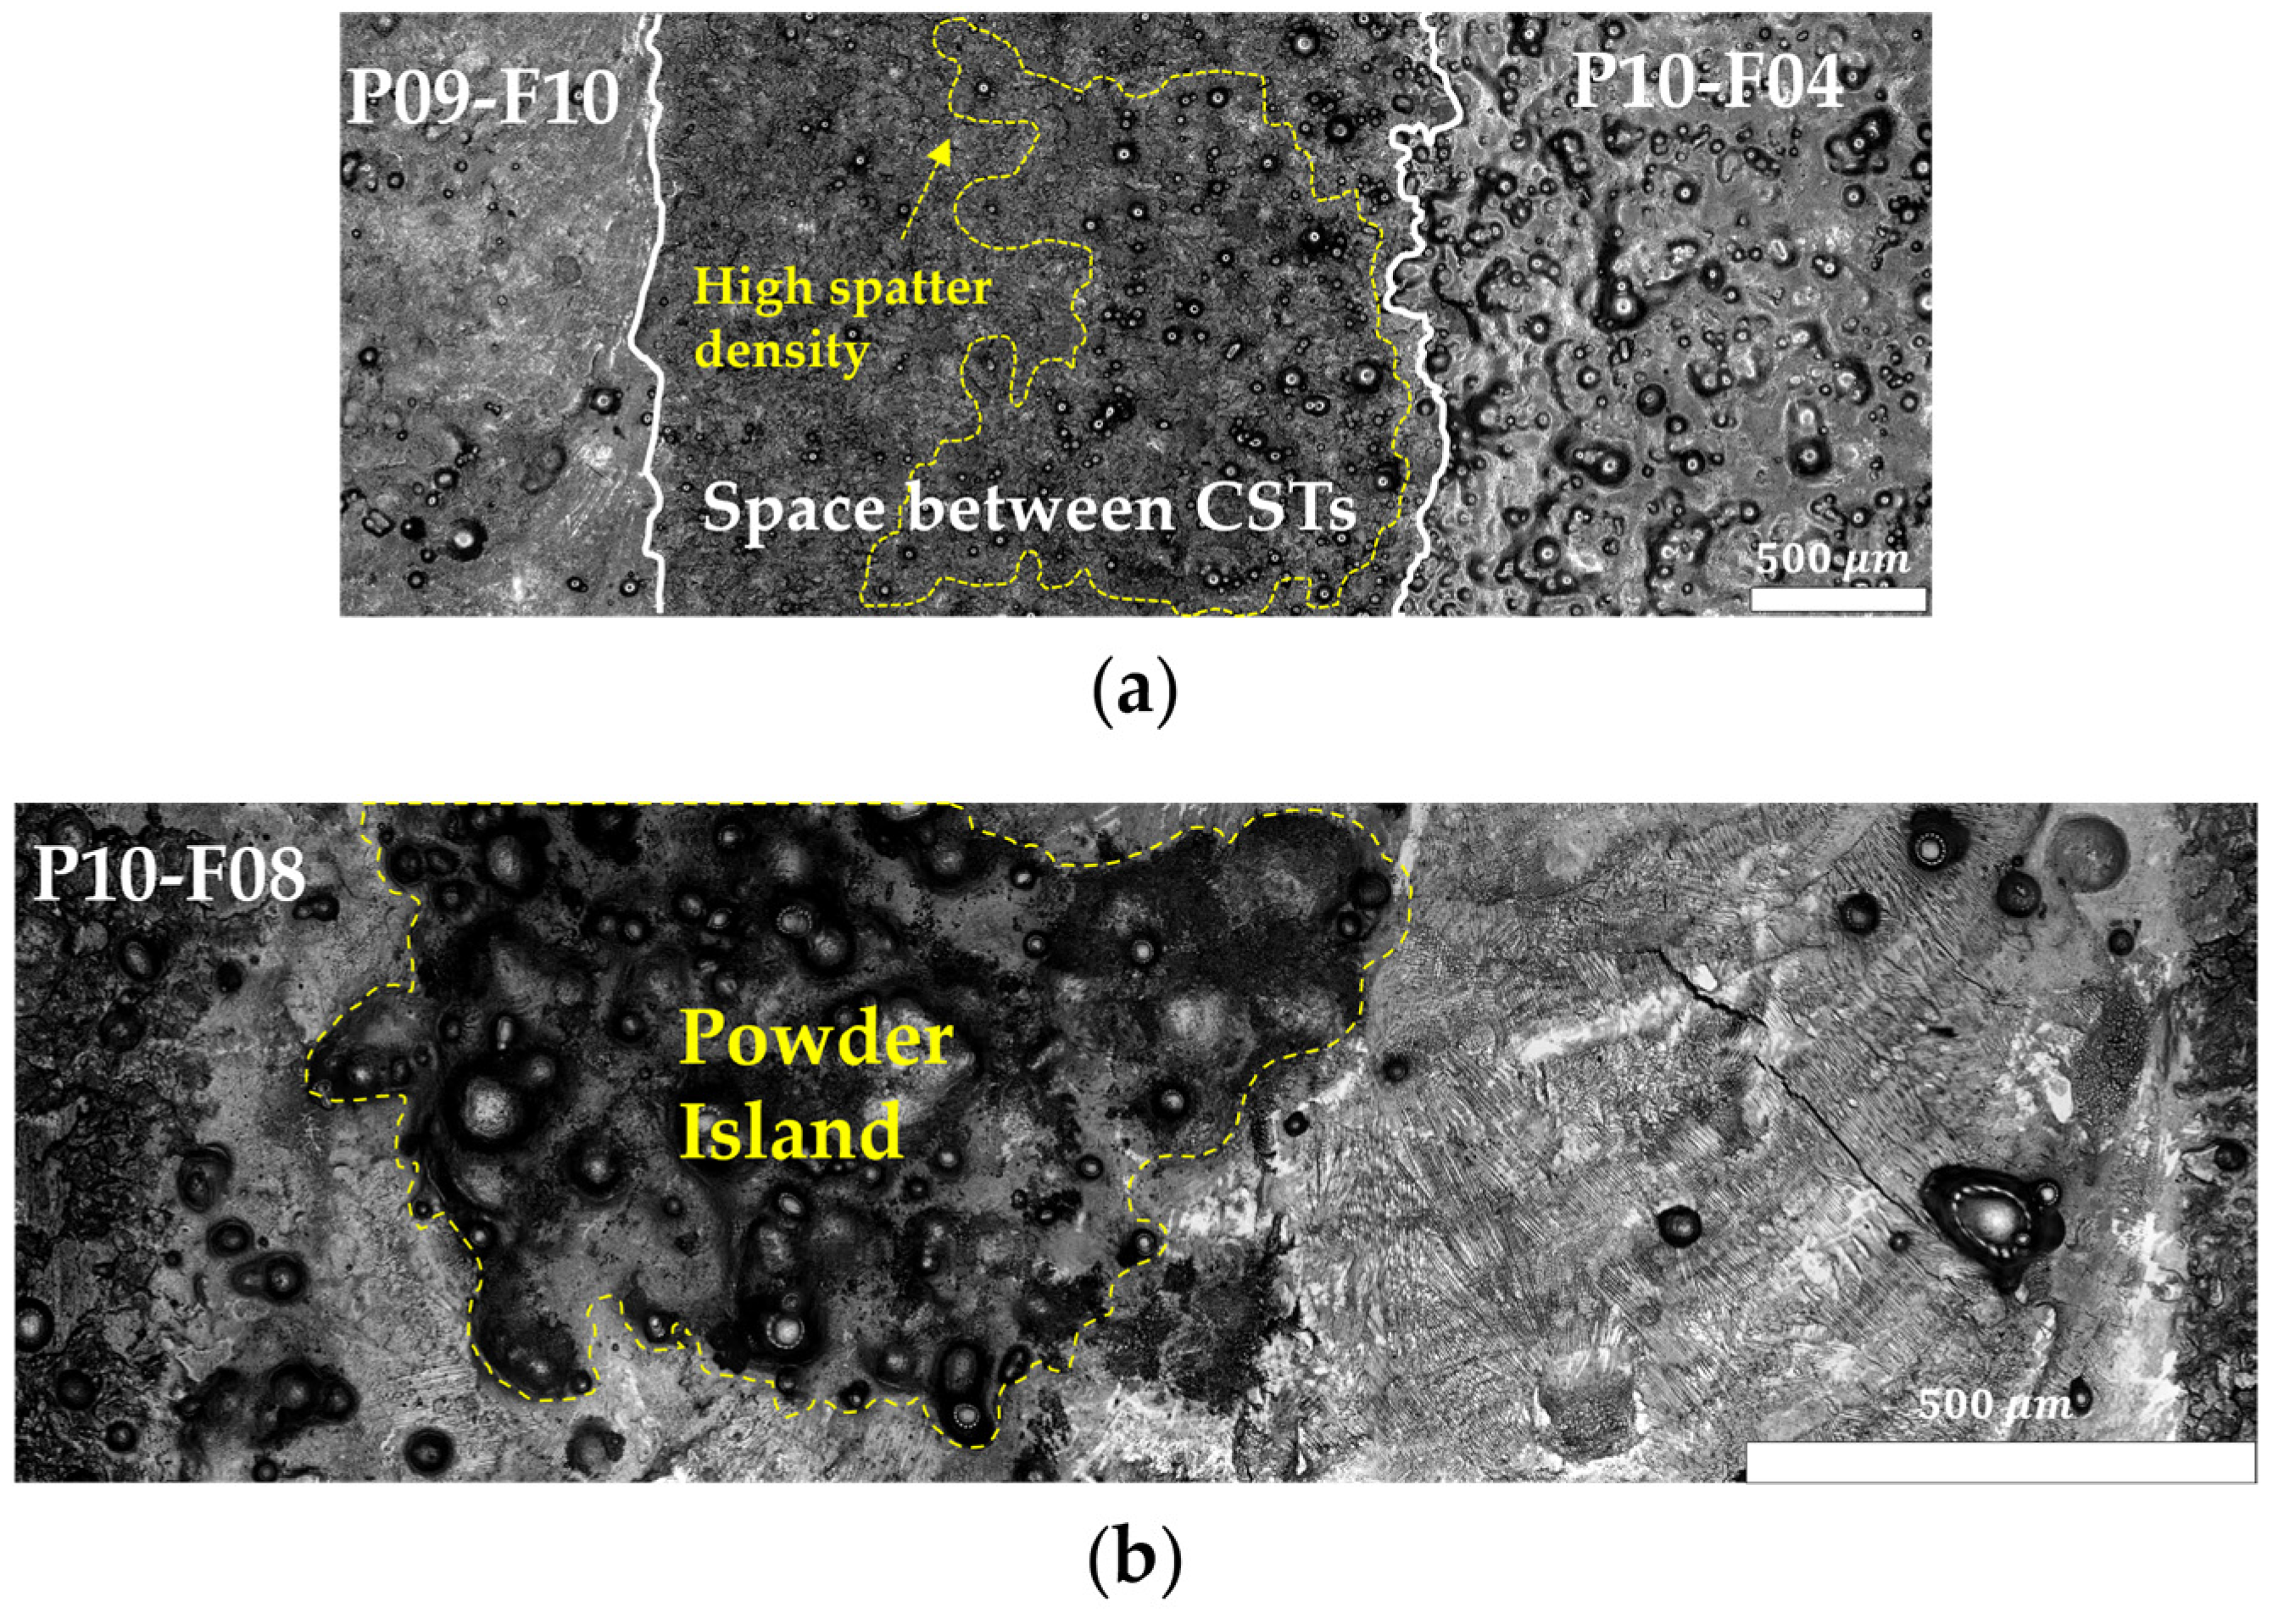
  • XZ plane analysis ( M D P m F n X Z ): the analysis of profile asymmetry highlighted good stability in process parameters for most CSTs. A certain deviation has been observed for P06-F10 compared to the other conditions with the same laser power ( M D P 06 F n X Z ). This behavior can be attributed to the insufficient linear energy density related to the F06-P10 condition. In particular, the laser power is not high enough to prevent the instability of molten metal fluid generated by the high scanning speed, which leads to Rayleigh-Plateau instability phenomena [55,56]. Various explanations can be attributed to the conditions of P10-Fn CSTs; as these conditions are characterized by higher laser power, phenomena such as recoil pressure [57,58] and particle disintegration [57] take precedence over process stability, resulting in extreme asymmetry of the CSTs. In particular, the combined effects of recoil pressure and powder evaporation, which are generated by an intense laser source, result in a smaller amount of material being added to the melt pool. Furthermore, the recoil pressure accelerates partially melted particles to such an extent that they are shredded into multiple spatters and deviated from their nominal trajectory by shearing forces, as can be seen in Figure 9a. Additionally, particles that reach the melt pool without being overheated, deviated, or shredded form an island of powder that starts rotating towards the left edge of the CST, pushed by the Marangoni effect [59], as shown in Figure 9b. This phenomenon was also highlighted by Prasad et al. [60]. These two behaviors, when combined, explain the total asymmetry of the CSTs generated with a laser power of 1000 W.
  • YZ plane analysis ( M D P m F n Y Z ): the literature shows a certain dependency between the fluid depth and the Marangoni effect. In particular, it has been found that increasing the fluid film depth increases CST stability, since a greater depth is correlated with a more gradual gradient between different levels of viscosity and surface tension [61,62,63]. Consequently, CSTs with a higher deposited material value will exhibit a less pronounced Marangoni effect and fewer ripples on their surface [64]. Otherwise, it should be specified that this phenomenon is clearly visible only for M D P 09 F n Y Z conditions. Particularly, this behavior can be attributed to the increasing scanning speed at which a low amount of material is generated, and subsequently, more pronounced and recurring ripples appear. In the context of M D P 06 F n Y Z and M D P 08 F n Y Z conditions, the minimal material input at each evaluated scanning speed precluded the identification of discernible trend, since the bead thickness of the CST is insufficient to generate a noticeable change in viscosity and surface tension levels. Similarly, M D P 10 F n Y Z conditions are not characterized by a visible trend; it should be pointed out that for this set of process parameters, the main phenomena affecting scan track stability have already been discussed in the analysis of M D P m F n X Z .
The characterization of material distribution among different planes has been finalized and unified as shown in Equation (2). The final values have been compared and contrasted within the CSTs, as well as with the material distribution ratio of an extruded, perfect parabolic profile. This shape was selected for comparison since, in most cases, it ensures a perfect fit with the deposited profile shape [65,66]. The data indicate that with the exception of the M D P 08 F n Y Z parameter settings, the remaining conditions invariably demonstrate a decline in the material distribution ratio while maintaining constant laser power. This behavior can be attributed to the instability phenomena of the meltpool, which originate as the scanning speed increases. The effect of laser power is less evident with the process parameters analyzed, even if a certain perturbation can be observed as soon as the laser power exceeds a certain limit (P1000). In terms of comparing the comparison of CSTs with the extruded parabola shape, the threshold value of 0.667 was identified as the cut-off point for determining which profile satisfies the coating requirements. Consequently, this parameter has been adopted as the minimum value that must be attained by M D P m F n . Alternatively, it should be specified that a higher value represents better conditions. This is strictly related to the fact that optimal ideal outcomes are achieved when 100% is attained in every single index in each direction of analysis. The combination of these two concepts results in the following acceptable CSTs: P06-F04, P06-F06, P08-F04, P08-F06, P08-F08, P08-F10, P09-F04, P09-F06, and P09-F08. P09-F04 represents the optimal material distribution.

3.2.3. Surface Roughness Analysis

The roughness parameters Sa and Sq were extracted from the surface profile of the coated tracks after selective filtering. As illustrated in Figure 10, the resulting values exhibited trend consistency between the two parameters, as well as with the mean and maximum height. This indicates adequate material distribution over the surface with no significant outliers or evidence of highly non-Gaussian distribution. The CSTs designated P06-F06, P06-F08, P06-F10, and P08-F10 exhibited lower roughness profiles, with Sa values of 5.39, 5.55, 5.03, and 5.46 μm, respectively, and Sq values of 7.65, 7.62, 6.87, and 7.70 μm, respectively. The roughness values obtained are comparable with those obtained in DED deposition of other nickel alloys [64,65]. Furthermore, the typical decrease in roughness generated by decreasing energy input through increased scanning velocity is clearly evident [66,67].

3.2.4. Cross Sections

Cross sections of the coating scan tracks were obtained by EDM cutting and then inspected by SEM and EDS after typical metallographic grinding and polishing, as described in the Materials and Methods section. Scanning electron microscopy investigations were conducted using the backscattered electron signal (BSE) in order to further highlight the compositional changes across the melt pool. For this purpose, an accelerating voltage of 28 keV was selected. The complete overview of the fabricated CSTs is reported in Figure 11.
The objective of this research is to develop a coating that adheres optimally and is uniformly distributed across the deposited area. As can be seen in Figure 11, the least favorable conditions are highlighted in red. It is also worth noting that none of the process parameters selected for the DOE in Table 2 resulted in keyhole mode. The highest porosity levels were observed in conditions P06-04 and P06-06. The presence of other black areas in the CSTs can be attributed to dirt adhering to the cross sections. This was verified using secondary electron (SE) imaging.
It has been demonstrated that the conditions of low powder and higher scanning speed (P06-F08, P06-F10) result in enhanced intermixing between stainless steel and alloy components within the melt pool. Conversely, increasing laser power, irrespective of scanning speed, has been observed to result in a discernible partitioning between stainless and non-stainless materials. This phenomenon is accompanied by the persistent presence of a substantial, mushy zone, which is indicative of a blend of steel and nickel alloys. Figure 12 shows the transition between the build plate material and the Colmonoy coating.
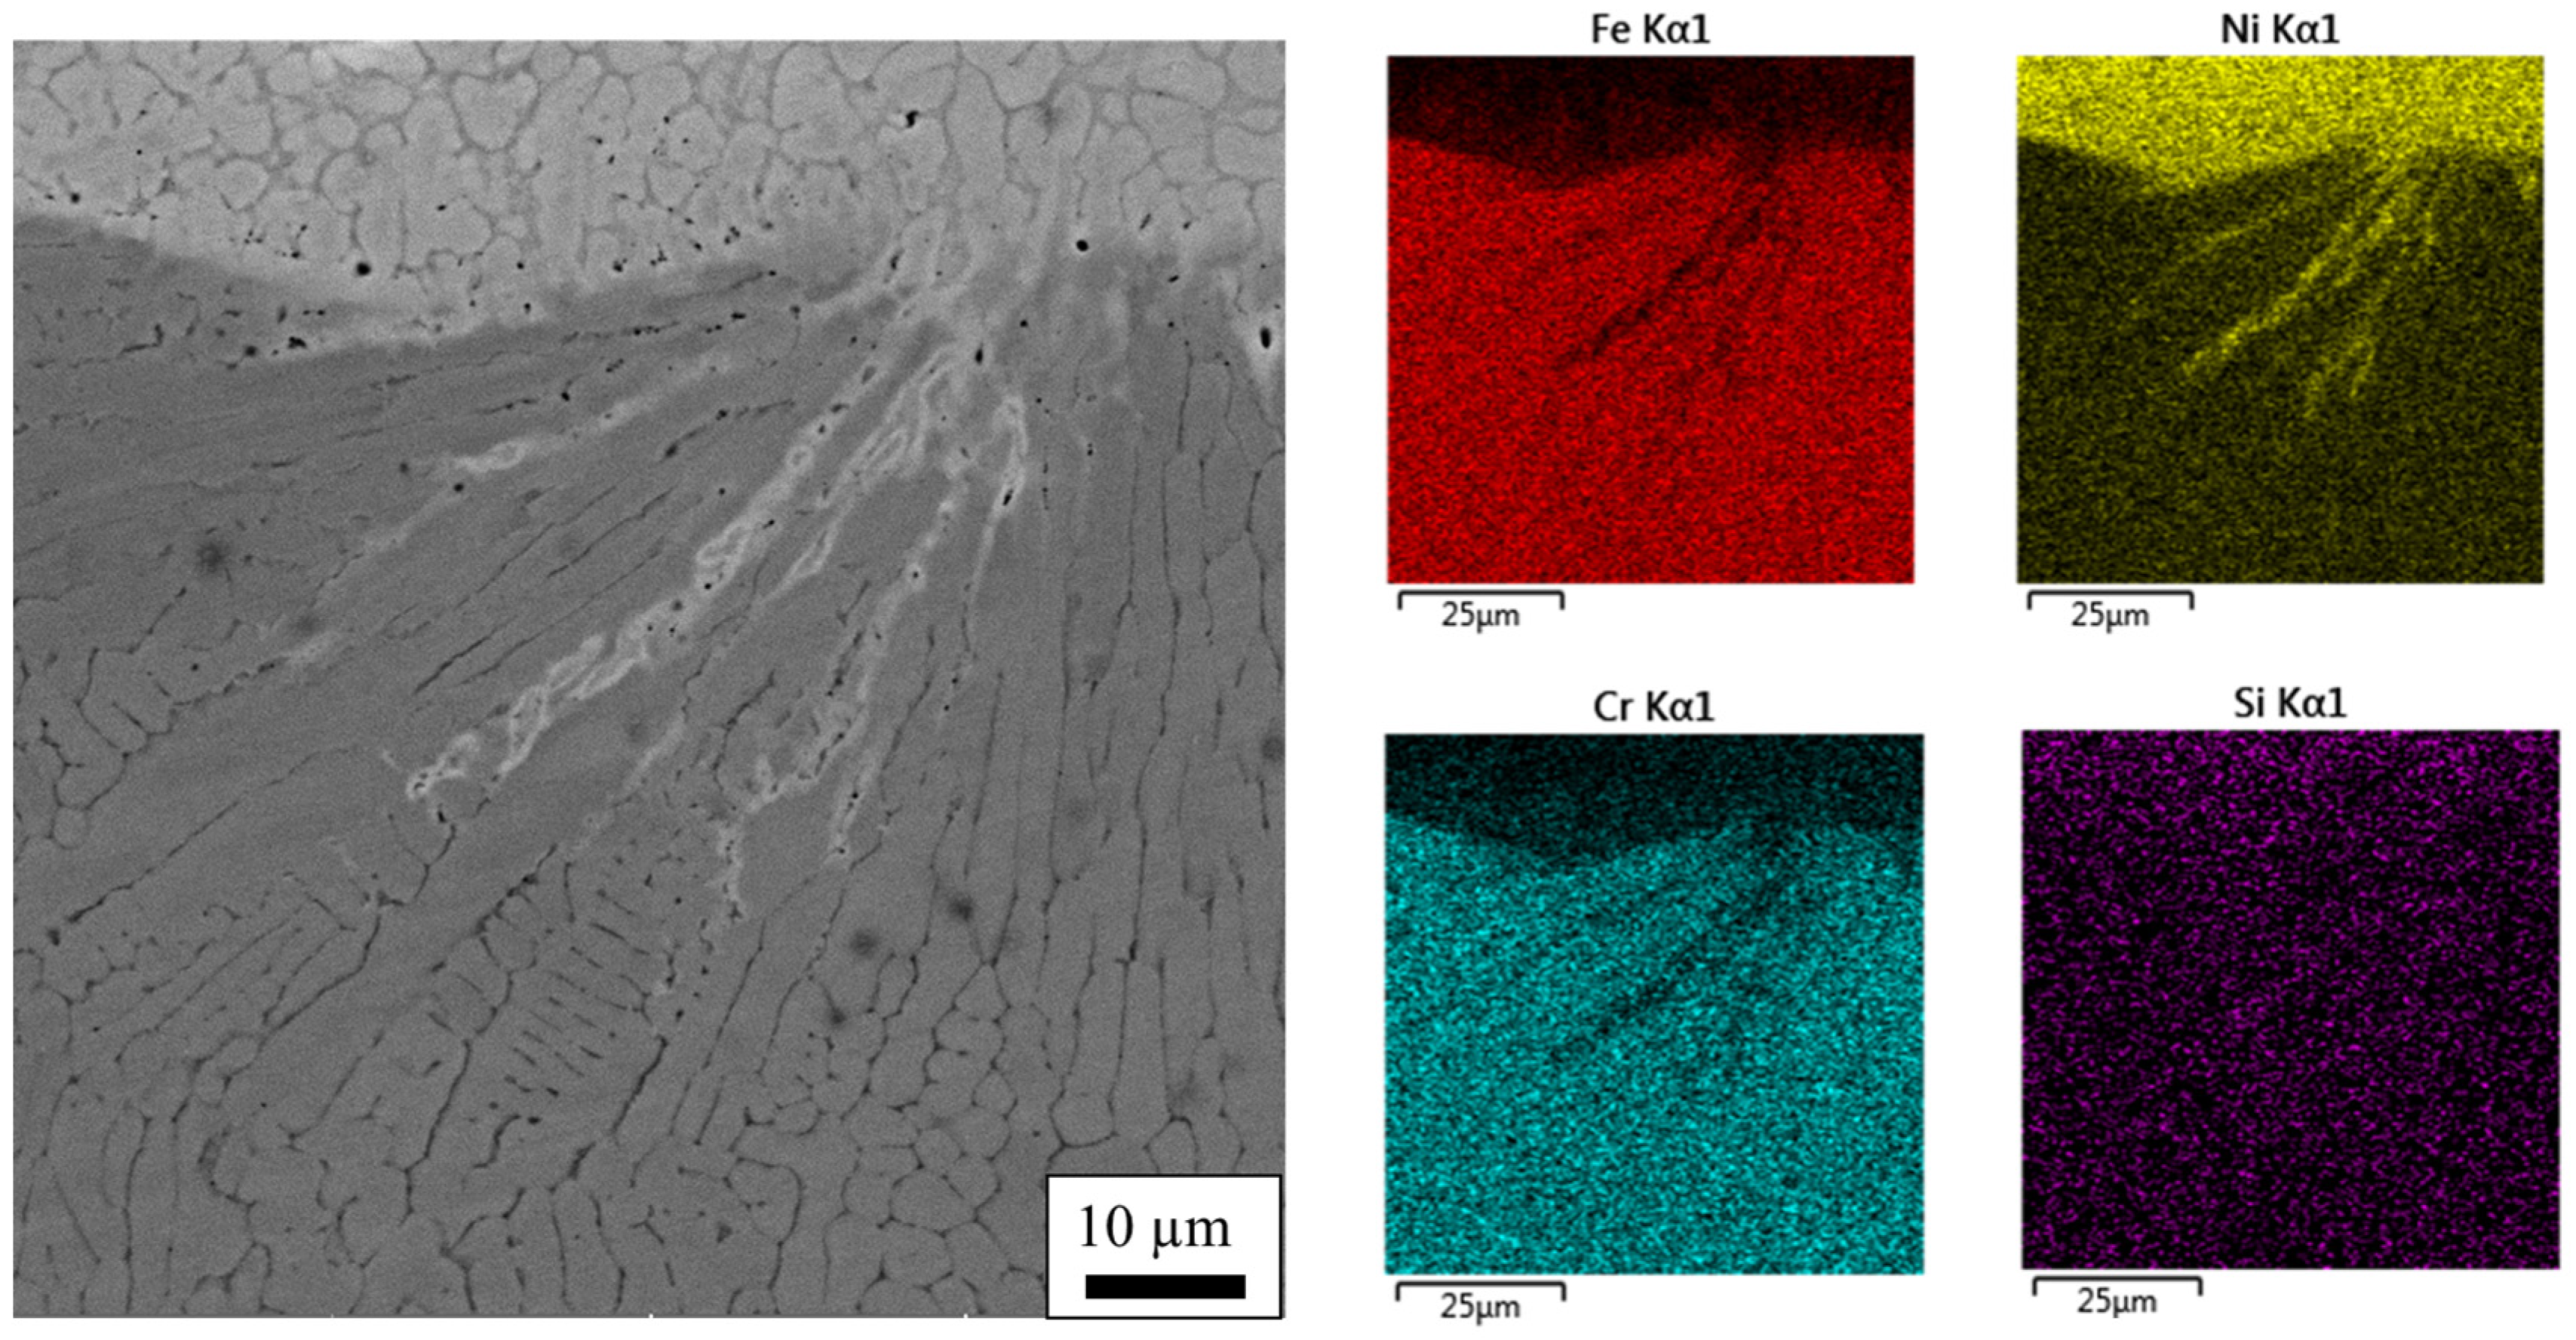
EDS point analysis was performed at the four red dots in Figure 12a; the results are shown in Table 4. The lack of a clear border of the melt pool in the BSE signal in Figure 12c,d highlights the mixing in the mushy zone between the different elements of the two alloys. Conversely, this border is highlighted by the growth of dendrites in several directions, which are compatible with the cooling rate direction. The blue arrow indicates interdendritic areas rich in nickel, which were found to be consistent across the investigated cross-sections of the CSTs.
As can be seen from Table 4, a nickel-depleted zone forms in the area near the melt pool, with an increasing trend across it, reaching a maximum in the bright area corresponding to the Colmonoy coating zone.
Figure 13 highlights one of the peculiar areas characterizing the Colmonoy coating mushy zone border.
The distribution of elements inside the melt pool suggests the formation of a recirculating flow (Marangoni flow) due to thermal-driven surface tension gradients. This effect is further enhanced by the gradient in elemental distribution within the melt pool itself. Figure 13 illustrates how the melt pool behaves, resulting in interdendritic zones forming at its edge, where the nickel concentration is very low. This leads to a zone in the 304 substrate that is completely depleted of nickel.
The inset in Figure 12d shows cracks appearing in different locations of the CSTs. The majority of these cracks arise in the P10 CSTs (lines 13–16 of Table 2). Micrometric pores between dendrites were spotted on all the deposited CSTs. These cracks can be identified as shrinkage porosity, a well-known defect in metal castings which arises from volumetric contraction of solid metal during the final stages of solidification [67]. Due to the fast cooling rates typical of metal additive manufacturing, dendritic growth is commonly observed, and the critical dimension of the dendrites, as well as the primary and secondary arm spacing values, can vary significantly according to the fabrication technology and the materials used. As the metal cools, the dendrites or cells solidify and undergo volumetric contraction. This decrease in volume results in a reduction in the pressure of the liquid between the dendrites or cells (i.e., interdendritic or intercellular liquid). The resulting low-pressure pockets then promote the formation of voids. Directional solidification (see Figure 12 and Figure 13) is promoted by the steep thermal gradient due to the localized thermal energy delivered by the laser source and coupled with the cold 304 SS substrate interaction. Upon solidification, the volumetric contraction is counterbalanced by the flow of liquid metal between dendrite arms and enhanced by the capillary forces [68,69,70]. Nickel depletion in the interdendritic areas, coupled with volumetric contraction and limited liquid metal supply due to the small amount of Colmonoy fed into the single scan tracks, causes shrinkage porosity. The results reported by Angelastro et al. [47] on bulk Colmonoy 227-F samples fabricated by laser cladding did not demonstrate this microstructural evolution in Ni-Fe-rich systems, nor was there any clear evidence of shrinkage porosity.

3.2.5. Dilution and Clad Angle Analysis

With regard to material distribution across the cross section, numerous studies in the existing literature have highlighted the typical correlation between process parameters and section morphology [71,72,73,74]. As emphasized by Momeni et al. [75], scanning speed is the main factor affecting clad angle. Specifically, a decrease in cladding angle is commonly associated with an increase in scanning speed. Although less effective, the impact of laser power on cladding angle remains significant. It has been generally observed that an increase in laser power is associated with a decrease in cladding angle [76]. These behaviors can be visualized in the trends exhibited by CSTs when process parameters are altered, as shown in Figure 14.
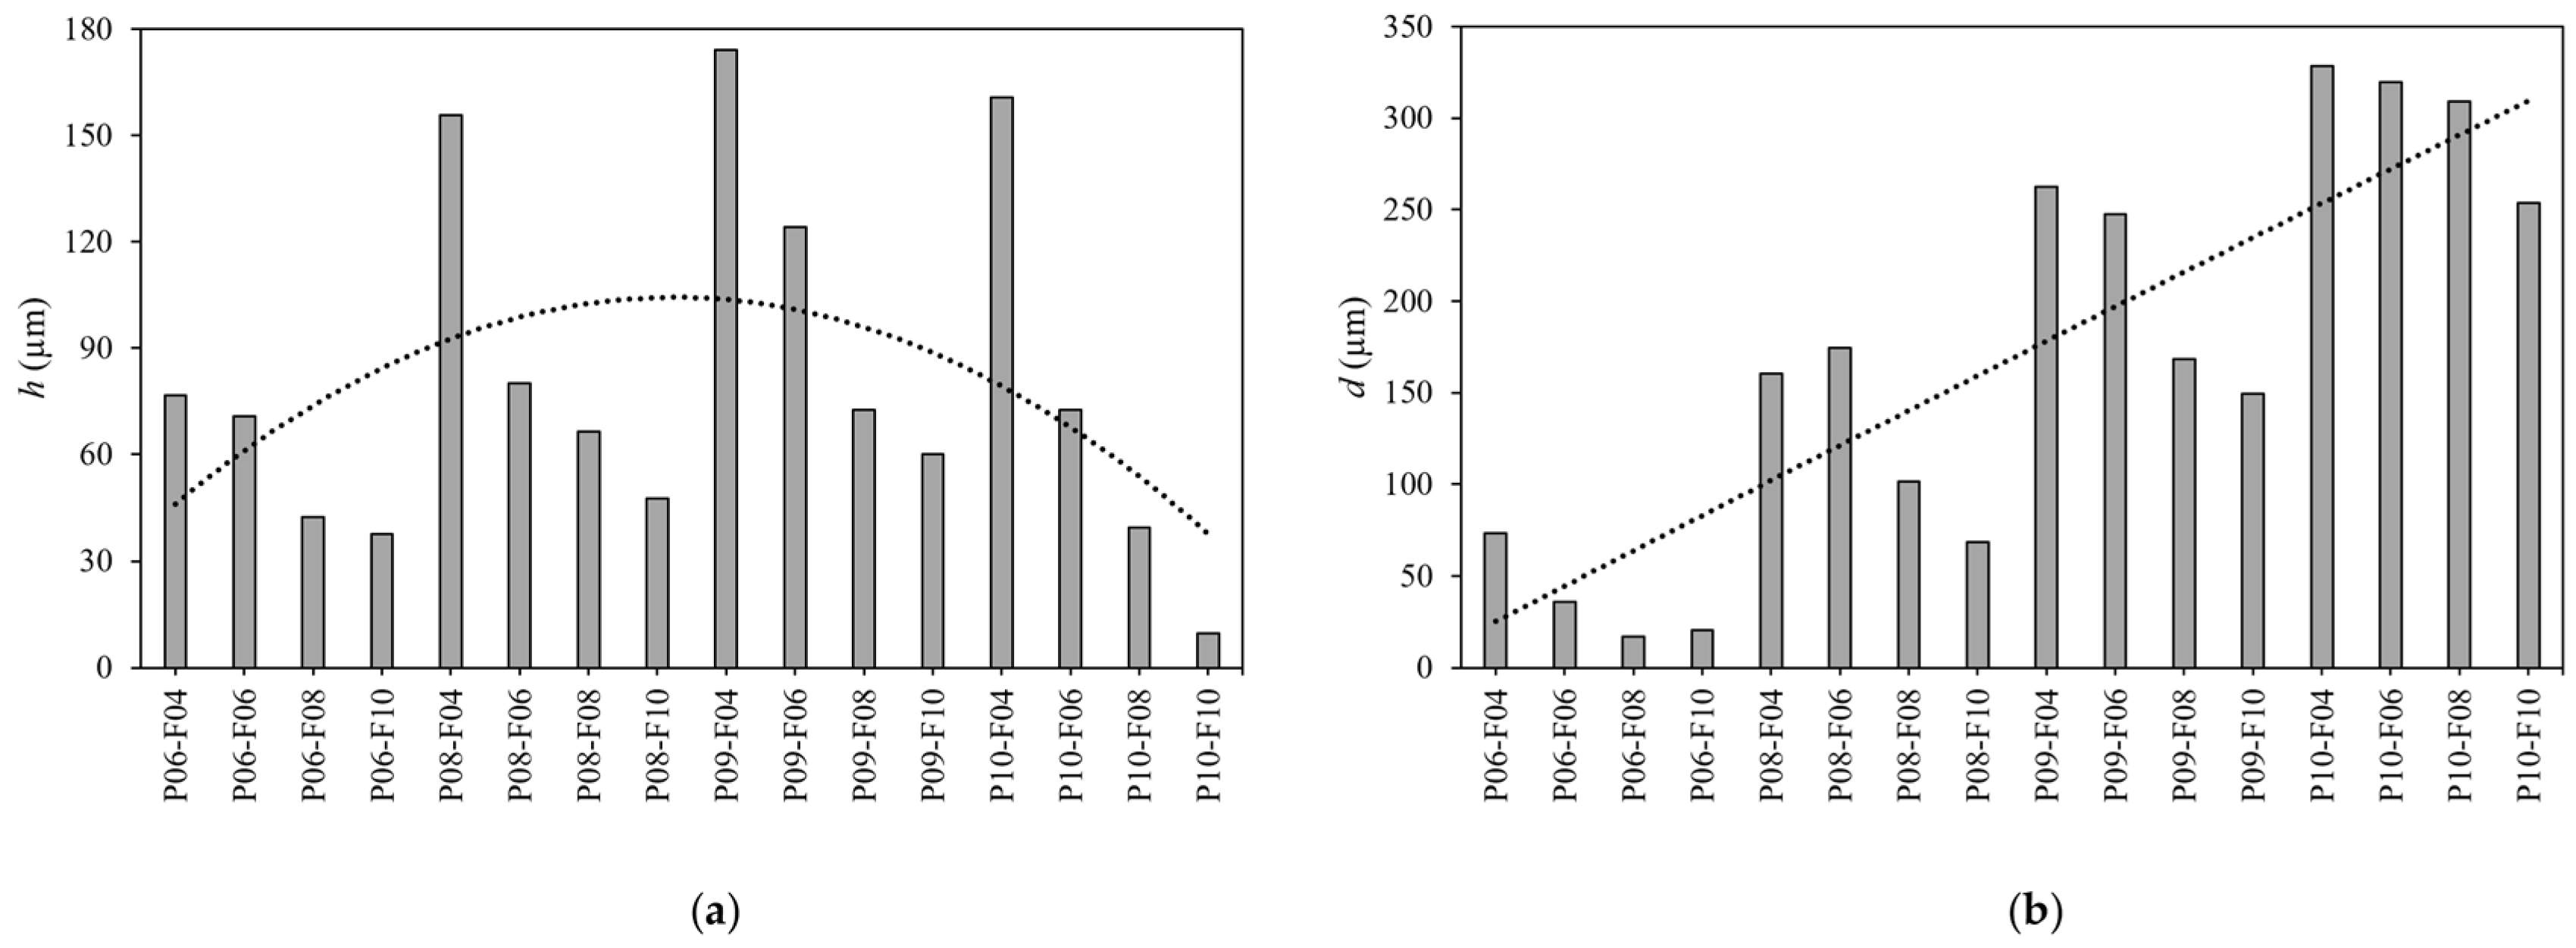
Concerning the dilution ratio, Mahamood et al. [77] highlighted that an increase in laser power is associated with an increase in dilution ratio. Similar results have been achieved by Gao et al. [74] and by Zhu et al. [78]. The correlation between scanning speed and dilution ratio is more difficult to establish. It should be noted that an increase in scanning speed is associated with a decrease in both the height of material below the substrate level (d) and the height of material above the substrate level (h), as illustrated in Figure 15. A similar trend has been highlighted by Carrozza et al. [79]. This means that the final effect of d and h on the dilution ratio is strictly associated with the slope by which these values decrease. As can be seen in Figure 15, the ratio by which h decreases is much higher than the ratio by which d decreases for P10-Fn conditions. By contrast, the ratios are similar for P08-Fn and P09-Fn conditions. The opposite trend is associated with the P06-Fn conditions and is related to the poor substrate remelting caused by the low laser power. Apart from the P06-Fn conditions, the dilution ratio is characterized by an overall increasing trend as the laser power and scanning speed increase.
The literature highlighted the optimal dilution ratio for a DED process as a range of values between 10 and 30% [21,80]. Although CSTs that demonstrate sufficient material distribution do not reach this value, it can be considered acceptable provided the generated tracks are symmetrical and optimized for a specific application, as emphasized by Belsvik and Hansen [81]. This study focuses on coating applications; therefore, the amount of material deposited and the observed dilution ratio are considered to be sufficiently satisfactory. It is important to note that the beneficial clad angle value (<80°) is achieved in all the tracks [82]. Furthermore, it is essential to ensure that the coating quality of all CSTs satisfies the materials distribution threshold. It should also be noted that reducing the clad angle decreases the overlap between two consecutive tracks when depositing multiple coating tracks [83,84]. Consequently, using scan tracks with a lower clad angle requires less material and shorter processing times, but further studies are needed.

3.3. Evaluation of Mechanical Properties Through Microhardness

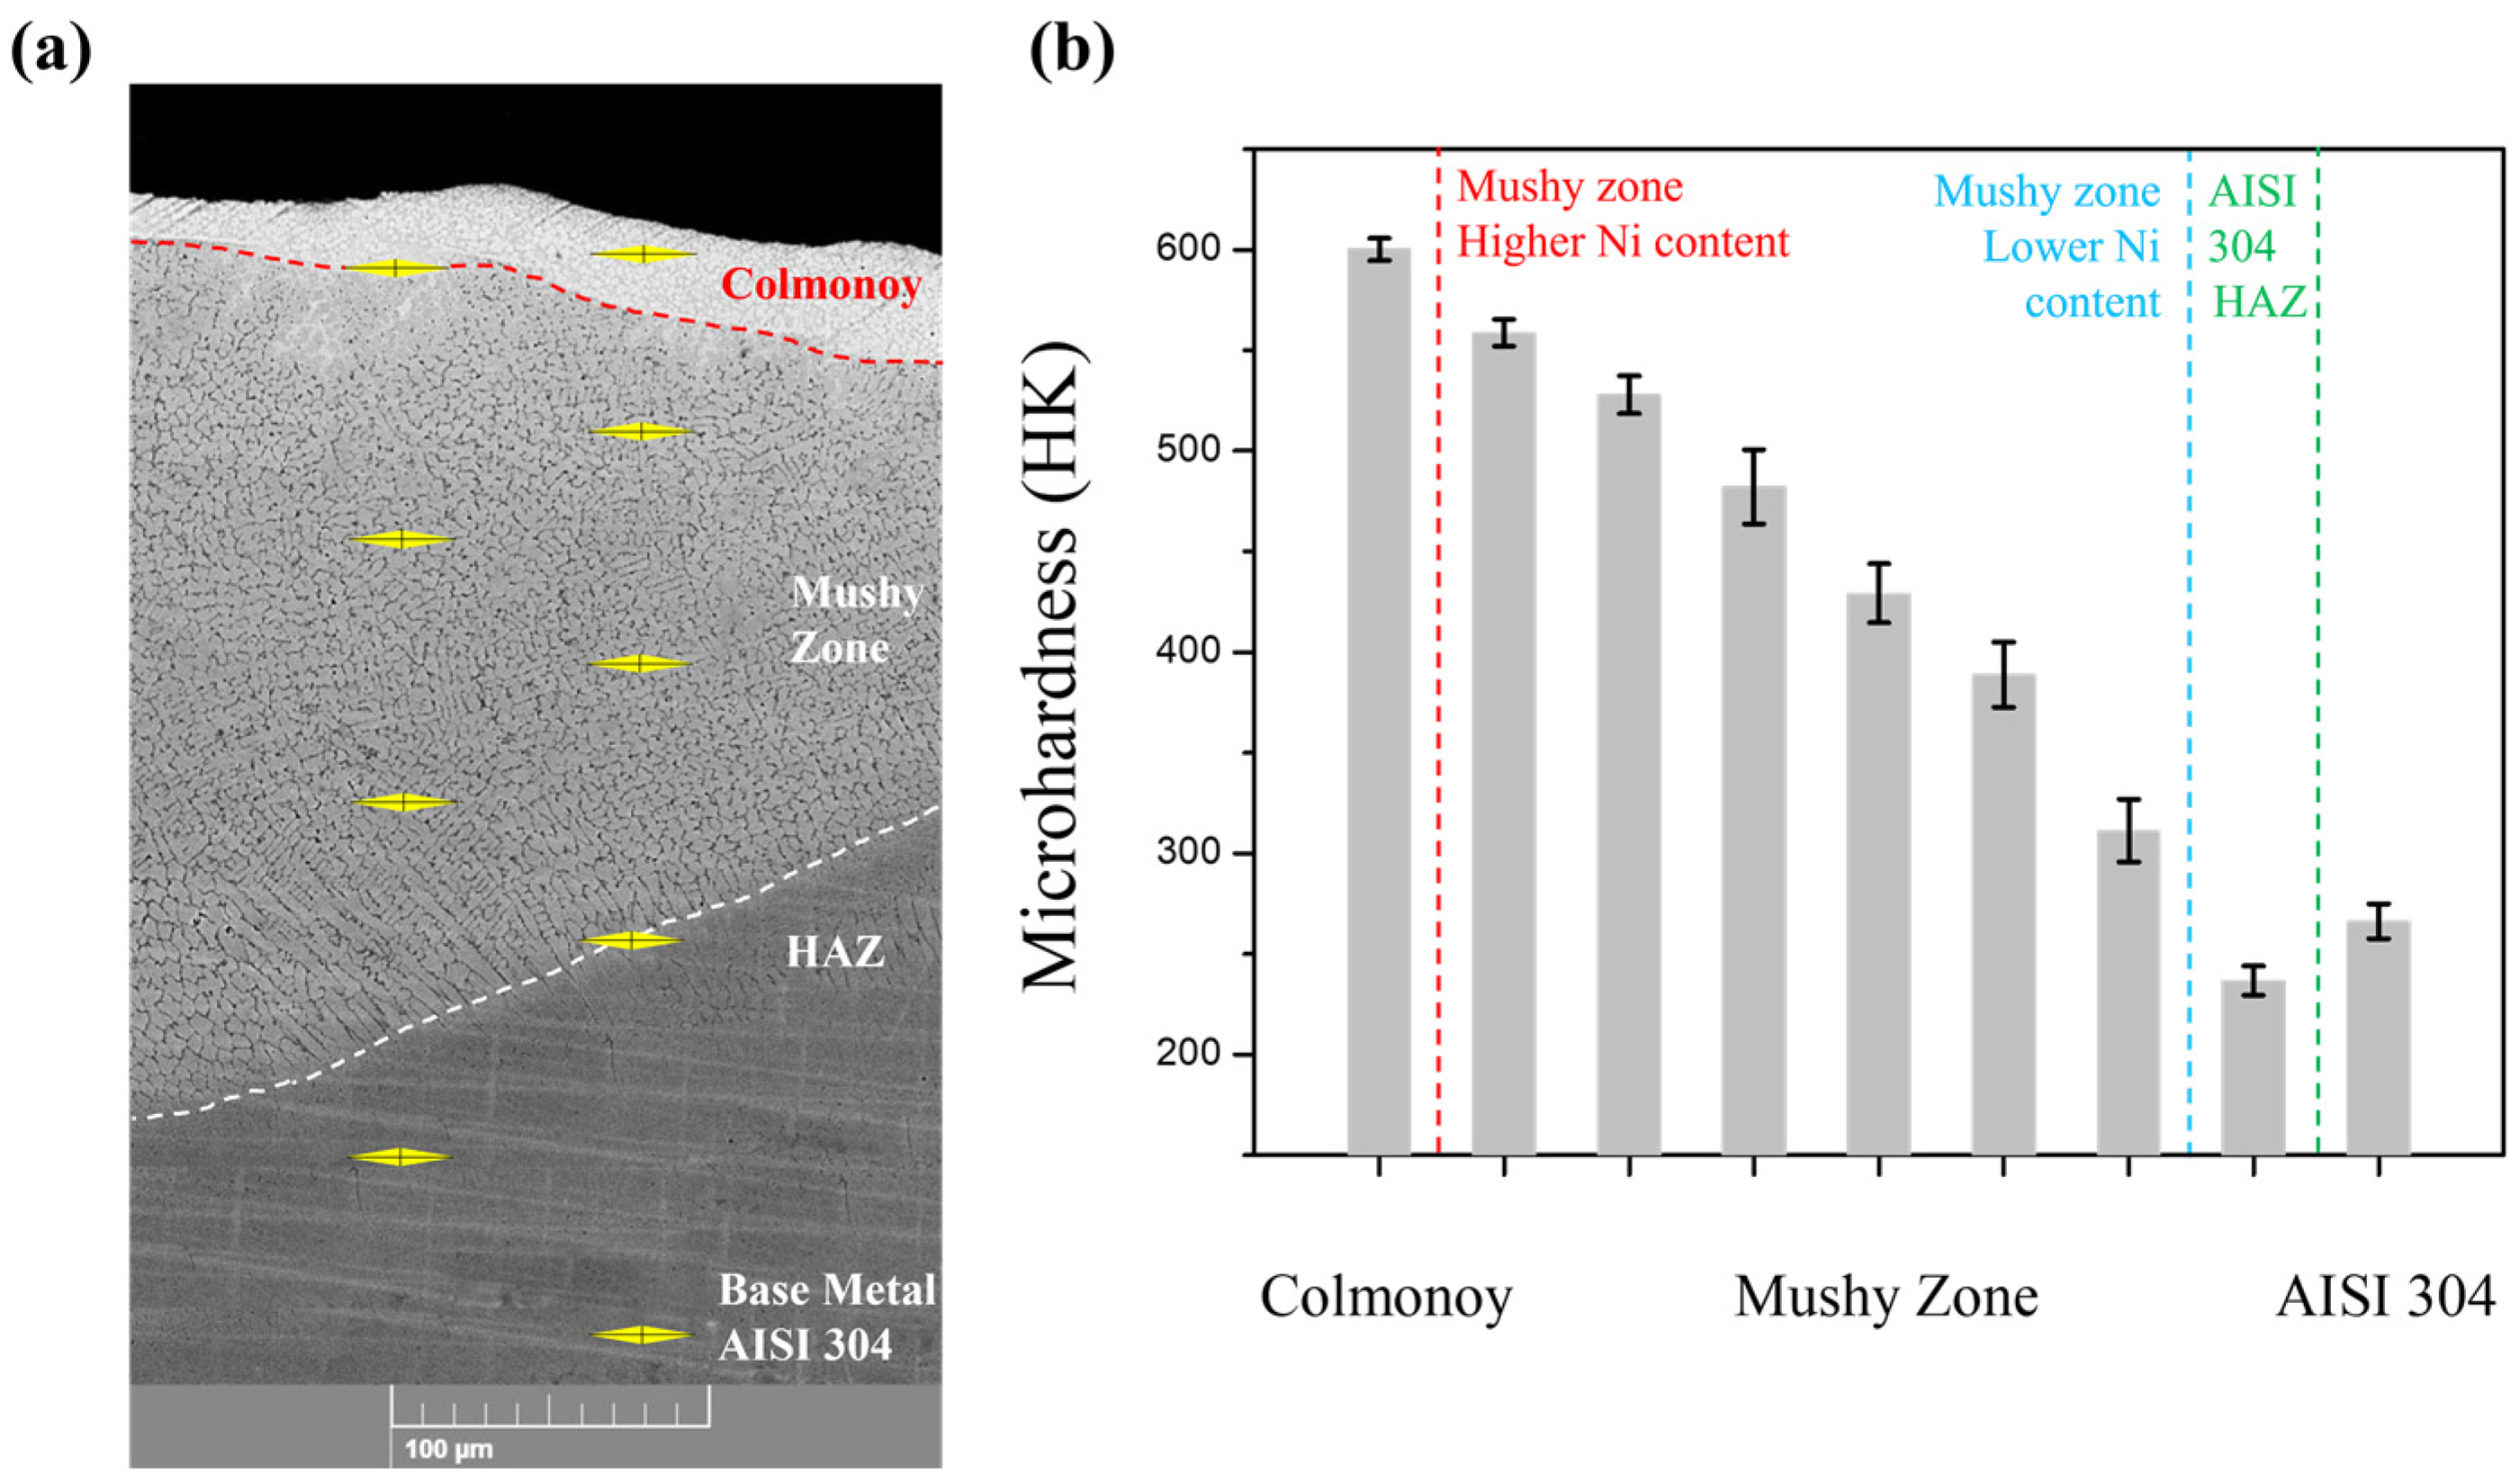
The resistance of the CSTs to deformation and their mechanical properties were investigated using the Knoop microhardness test. As demonstrated in Figure 16a, the indentations were distributed among the cross sections of the CSTs, covering each of the three presented zones: Colmonoy, the mushy zone, and the AISI 304 substrate. It is important to note that the number of indentations applied varied depending on the thickness, melt pool depth, and morphology of each CST. To ensure clarity and consistency in the graphical representation, Figure 16a illustrates a schematic distribution of indentations rather than the exact number used in each case. The values reported in Figure 16b are representative of nine characteristic regions across all CSTs, and the associated error bars account for the variability observed within each region. All the tracks exhibited a consistent microhardness profile, and the resulting values decreased from the Colmonoy layer to the stainless-steel substrate. The Colmonoy layer exhibits a microhardness of 600 ± 5 HK, while that of the substrate base metal AISI 304 is 266 ± 8 HK.
Microhardness decreases gradually from the coating layer to the base metal throughout the mushy zone. This can be attributed to the gradual Ni content of the mushy zone, as indicated by the EDS analysis. Furthermore, the hardness values presented in the mushy zone exhibit a marginally elevated standard deviation, attributable to the intricate dendritic microstructure inherent in the zone. The minimum hardness value was determined within the heat-affected zone (HAZ) of the base metal with a microhardness of 236 ± 8 HK.
The gradual microhardness transition from the Colmonoy layer to the AISI 304 substrate, combined with strong metallurgical bonding and minimal porosity, according to the SEM analysis, suggests good potential for long-term durability. This gradual transition prevents the formation of abrupt interfaces, which are typically susceptible to cracking, delamination, and early fatigue failure during long-term use [85,86].

4. Conclusions

The purpose of this experimental study is to investigate the interaction between various process parameters characteristic of the DED technology on the fabrication of Colmonoy 227-F coatings on an AISI 304 substrate. A new material distribution index has been developed to fully characterize the quality of the deposited coatings and coating single scan tracks (CSTs). The primary conclusions are listed as follows:
  • The maximum melting capacity of the laser with regard to Colmonoy 227-F powder is achieved under conditions that involve a laser power of 900 W. An increase in power is not beneficial in terms of material incorporated, evaluated as deposited normalized volume ( V P m F n N );
  • The use of the volume index as a standalone metric has proven inadequate in elucidating the comparative standing of DOE conditions. To address this issue, a new material distribution ratio has been developed and successfully employed along the XY, XZ, and YZ planes. The tracks exhibiting this ratio are P06-F04, P06-F06, P08-F04, P08-F06, P08-F08, P08-F10, P09-F04, P09-F06, and P09-F08. Of these, P09-F04 has been identified as the most suitable option for material distribution.
  • The cross-section analysis reveals the fundamental metallurgical and morphological properties of the CSTs. SEM micrographs revealed that P06-F04 and P06-F06 are characterized by their high porosity, which is linked to a lower linear energy density, as defined by the DOE conditions. Conversely, no keyhole modes have been observed in DOE conditions involving high linear energy density. P10-F08 and P10-F10 cannot otherwise be considered compliant, as insufficient material is deposited on the build plate to define the generated CSTs as a coating. Regarding the analysis of favorable conditions relating to cross-section analysis (from P06-F08 to P10-F06), SEM revealed that increasing the laser power improves metallurgical bonding quality and substrate penetration.
  • Microhardness and EDS maps revealed a gradual transition from pure Colmonoy 227-F (on the top part of the CSTs) to the pure AISI 304 substrate. This process enables gradual mechanical property attainment, from which superior static and fatigue mechanical performance can be derived compared to less homogeneous transitions.
The ultimate conclusion of the present research paper as a whole is that condition P09-F04 is best suited to generating a Colmonoy 227-F coating on an AISI 304 substrate. In this instance, the configuration of the process parameters allows for the achievement of an appropriate roughness level and the optimal material distribution index associated with an enhanced metallurgical bond. Where the surface area to be coated is extensive and high speeds are required to meet delivery times, P09-F06 and P09-F08 are recommended as a satisfactory compromise. The aforementioned conditions have been shown to reduce surface roughness, thereby reducing the likelihood of fatigue cracking occurring and spreading throughout the product’s operational lifespan. However, the volume of deposited material is considerably lower, which can result in a hardfacing coating that is less load bearing and wear resistant. It is also worth noting that the P08-F04, P08-F06, and P08-F08 conditions enable the production of conformal coatings in terms of material distribution and metallurgical bonding. However, the presence of lower material deposition despite P09-Fn conditions indicates inefficiency in melting the powder insufflated from the nozzle. It has been established that all other conditions do not comply with the established criteria and should thus be avoided.
This study provides valuable insights into optimizing DED process parameters for fabricating single-scan tracks for coatings. The developed MD index will undergo further validation in additional case studies. Its structural meaning could play a significant role in redefining the quality assessment of DED single tracks and in selecting optimal process parameters for various applications.

Supplementary Materials

The following supporting information can be downloaded at: https://www.mdpi.com/article/10.3390/cryst15070626/s1, Table S1: Material distribution indexes values are divided according to the analysis planes taken into consideration and the final material distribution index.

Author Contributions

Conceptualization, G.G., K.S., V.F., and E.S.; methodology, G.G. and K.S.; software, G.G., K.S., G.V., V.F., and A.S.; validation, G.V., V.F., and A.S.; formal analysis, G.G., K.S., E.S., G.V., and A.S.; investigation, G.G., K.S., and E.S.; resources, E.S. and M.C.; writing—original draft preparation, G.G., K.S., and E.S.; writing—review and editing, E.S. and M.C.; visualization, E.S., G.V., and A.S.; supervision, E.S. and M.C.; project administration, E.S. and M.C. All authors have read and agreed to the published version of the manuscript.

Funding

The authors acknowledge the financial support of the Fondazione Cariverona (Bando Ricerca e Sviluppo 2023—CIRCULAR SPACE project). In addition, this research was partially funded by the Grant of Excellence Departments, MIUR-Italy (ARTICOLO 1, COMMI 314–337 LEGGE 232/2016).

Data Availability Statement

The original contributions presented in this study are included in the article/supplementary material. Further inquiries can be directed to the corresponding author(s).

Acknowledgments

The Authors wish to acknowledge the support of the company Proxicad S.r.l. (Via Vicenza 10, 65129, Pescara) and, in particular, the contribution of Letizia Pilotti and Ettore Bonora. Moreover, authors acknowledge the technical support of Riccardo Luigi Di Mattia.

Conflicts of Interest

The authors declare no conflicts of interest.

Abbreviations

The following abbreviations are used in this manuscript:
AMAdditive manufacturing
CAMComputer-aided manufacturing
DEDDirected energy deposition
DOEDesign of experiment
CSTCoating scan track

References

  1. Zhang, X.; Fu, W.; Lei, Z.; Wu, S.; Liang, J.; Li, B. Microstructure Evolution of the W-C Hard Coatings Using Directed Energy Deposition on Tungsten Alloy Surface. Surf. Coat. Technol. 2023, 470, 129827. [Google Scholar] [CrossRef]
  2. Raghavendra, S.; Amirabdollahian, S.; Perini, M.; Chemello, M.; Benedetti, M. Development of DED Process Parameters for Deposition of Bronze and Evaluation of Its Wear Properties under Dry Sliding Conditions. Procedia Struct. Integr. 2024, 53, 119–128. [Google Scholar] [CrossRef]
  3. Barragan, G.A.; Mariani, F.; Coelho, R.T. Application of 316L Stainless Steel Coating by Directed Energy Deposition Process. IOP Conf. Ser. Mater. Sci. Eng. 2021, 1154, 012014. [Google Scholar] [CrossRef]
  4. Ferguson, J.I.; MacDonald, E.; Thomas, B.J.; Sangid, M.D. The Role of Additively Manufactured Niobium Alloy C103 Substrate’s Surface Finish and Corner Geometry on the Silicide Diffusion Coating’s Performance. Surf. Coat. Technol. 2024, 479, 130510. [Google Scholar] [CrossRef]
  5. Yahalom, J. Corrosion Protection Methods. In Encyclopedia of Materials: Science and Technology; Elsevier: Oxford, UK, 2001. [Google Scholar]
  6. Duquette, D. Corrosion Control. In Encyclopedia of Materials: Science and Technology; Elsevier: Oxford, UK, 2006; pp. 1–7. [Google Scholar]
  7. Ielo, I.; Giacobello, F.; Sfameni, S.; Rando, G.; Galletta, M.; Trovato, V.; Rosace, G.; Plutino, M.R. Nanostructured Surface Finishing and Coatings: Functional Properties and Applications. Materials 2021, 14, 2733. [Google Scholar] [CrossRef]
  8. Svetlizky, A.; Das, M.; Zheng, B.; Vyatskikh, A.L.; Bose, S.; Bandyopadhyay, A.; Schoenung, J.M.; Lavernia, E.J.; Eliaz, N. Directed Energy Deposition (DED) Additive Manufacturing: Physical Characteristics, Defects, Challenges and Applications. Mater. Today 2021, 49, 271–295. [Google Scholar] [CrossRef]
  9. Zhu, I.; Xue, P.; Lan, Q.; Meng, G.; Ren, Y.; Yang, Z.; Xu, P.; Liu, Z. Recent Research and Development Status of Laser Cladding: A Review. Opt. Laser Technol. 2021, 138, 106915. [Google Scholar] [CrossRef]
  10. Errico, V.; Fusco, M.; Campanelli, S. Effect of DED Coating and DED + Laser Scanning on Surface Performance of L-PBF Stainless Steel Parts. Surf. Coat. Technol. 2022, 429, 127965. [Google Scholar] [CrossRef]
  11. Ji, C.; Zhou, R.; Vivegananthan, P.; Wu, M.S.; Gao, H.; Zhou, K. Recent Progress in Gradient-Structured Metals and Alloys. Prog. Mater. Sci. 2023, 140, 101194. [Google Scholar] [CrossRef]
  12. Ahn, D.-G. Directed Energy Deposition (DED) Process: State of the Art. Int. J. Precis. Eng. Manuf.-Green Technol. 2021, 8, 703–742. [Google Scholar] [CrossRef]
  13. Meng, L.; Sheng, P.; Zeng, X. Comparative Studies on the Ni60 Coatings Deposited by Conventional and Induction Heating Assisted Extreme-High-Speed Laser Cladding Technology: Formability, Microstructure and Hardness. J. Mater. Res. Technol. 2022, 16, 1732–1746. [Google Scholar] [CrossRef]
  14. Park, G.-W.; Shin, S.; Kim, J.-Y.; Koo, Y.-M.; Lee, W.; Lee, K.-A.; Park, S.S.; Jeon, J.B. Analysis of Solidification Microstructure and Cracking Mechanism of a Matrix High-Speed Steel Deposited Using Directed-Energy Deposition. J. Alloys Compd. 2022, 907, 164523. [Google Scholar] [CrossRef]
  15. Alimardani, M.; Toyserkani, E.; Huissoon, J.P.; Paul, C.P. On the Delamination and Crack Formation in a Thin Wall Fabricated Using Laser Solid Freeform Fabrication Process: An Experimental–Numerical Investigation. Opt. Lasers Eng. 2009, 47, 1160–1168. [Google Scholar] [CrossRef]
  16. Corbin, D.J.; Nassar, A.R.; Reutzel, E.W.; Beese, A.M.; Michaleris, P. Effect of Substrate Thickness and Preheating on the Distortion of Laser Deposited Ti–6Al–4V. J. Manuf. Sci. Eng. 2018, 140, 061009. [Google Scholar] [CrossRef]
  17. Li, C.; Liu, Z.Y.; Fang, X.; Guo, Y.B. Residual Stress in Metal Additive Manufacturing. Procedia CIRP 2018, 71, 348–353. [Google Scholar] [CrossRef]
  18. Denlinger, E.R.; Heigel, J.C.; Michaleris, P.; Palmer, T.A. Effect of Inter-Layer Dwell Time on Distortion and Residual Stress in Additive Manufacturing of Titanium and Nickel Alloys. J. Mater. Process. Technol. 2015, 215, 123–131. [Google Scholar] [CrossRef]
  19. Liu, Z.; Kim, H.; Liu, W.; Cong, W.; Jiang, Q.; Zhang, H. Influence of Energy Density on Macro/Micro Structures and Mechanical Properties of As-Deposited Inconel 718 Parts Fabricated by Laser Engineered Net Shaping. J. Manuf. Process. 2019, 42, 96–105. [Google Scholar] [CrossRef]
  20. Leung, C.L.A.; Marussi, S.; Towrie, M.; Atwood, R.C.; Withers, P.J.; Lee, P.D. The Effect of Powder Oxidation on Defect Formation in Laser Additive Manufacturing. Acta Mater. 2019, 166, 294–305. [Google Scholar] [CrossRef]
  21. Dass, A.; Moridi, A. State of the Art in Directed Energy Deposition: From Additive Manufacturing to Materials Design. Coatings 2019, 9, 418. [Google Scholar] [CrossRef]
  22. Mariani, F.E.; Konno, C.Y.N.; Cruz, C.B.; Lombardi, A.N.; Garcia, A.; Cheung, N.; Coelho, R.T.; Casteletti, L.C. Inconel 625 Coating Produced by Directed Energy Deposition–Laser Beam (DED-LB) for Corrosion-Resistant Applications. J. Mater. Eng. Perform. 2024; in press. [Google Scholar] [CrossRef]
  23. Pereira, J.C.; Irastorza, U.; Solana, A.; Soriano, C.; García, D.; Ruiz, J.E.; Lamikiz, A. Effect of Powder Reuse on Powder Characteristics and Properties of DED Laser Beam Metal Additive Manufacturing Process with Stellite® 21 and UNS S32750. Metals 2024, 14, 1031. [Google Scholar] [CrossRef]
  24. Li, S.; Chen, B.; Tan, C.; Song, X. Study on Recyclability of 316L Stainless Steel Powder by Using Laser Directed Energy Deposition. J. Mater. Eng. Perform. 2022, 31, 400–409. [Google Scholar] [CrossRef]
  25. Kiani, P.; Dupuy, A.D.; Ma, K.; Schoenung, J.M. The Reusability of AlSi10Mg Powder in Directed Energy Deposition. Powders 2024, 3, 28–43. [Google Scholar] [CrossRef]
  26. Patil, M.A.; Ghara, T.; Das, B.; Kulkarni, D.M. Influence of Cooling Rate on Microstructure, Dislocation Density, and Associated Hardness of Laser Direct Energy Deposited Inconel 718. Surf. Coat. Technol. 2025, 495, 131575. [Google Scholar] [CrossRef]
  27. Jeong, J.; Webster, S.; Liao, S.; Mogonye, J.-E.; Ehmann, K.; Cao, J. Cooling Rate Measurement in Directed Energy Deposition Using Photodiode-Based Planck Thermometry (PDPT). Addit. Manuf. Lett. 2022, 3, 100101. [Google Scholar] [CrossRef]
  28. Hemmati, I.; Ocelík, V.; De Hosson, J.T.M. Toughening Mechanism for Ni–Cr–B–Si–C Laser Deposited Coatings. Mater. Sci. Eng. A 2013, 582, 305–315. [Google Scholar] [CrossRef]
  29. Liu, L.; Wang, W.; Zhang, X.; Li, X.; Tian, Y.; Zhao, X. Microstructures and Mechanical Properties of Nb Nanoparticles Modified Ni60 Hard-Facing Alloy Fabricated by Laser Metal Deposition. Mater. Sci. Eng. A 2021, 814, 141238. [Google Scholar] [CrossRef]
  30. Yi, B.; Wang, J. Mechanism Clarification of Mitigating Welding Induced Buckling by Transient Thermal Tensioning Based on Inherent Strain Theory. J. Manuf. Process. 2021, 68, 1280–1294. [Google Scholar] [CrossRef]
  31. Pellizzari, M.; Zhao, Z.; Bosetti, P.; Perini, M. Optimizing Direct Laser Metal Deposition of H13 Cladding on CuBe Alloy Substrate. Surf. Coat. Technol. 2022, 432, 128084. [Google Scholar] [CrossRef]
  32. Rukhande, S.; Suryawanshi, S.; Bhosale, D.G.; Vasudev, H.; Khimasiya, R.; Das Gupta, R.; Deshmukh, I.; Wilson, F. High-Temperature Tribological Performance of Ni-Based Coating on 316L Stainless Steel. Results Surf. Interfaces 2025, 18, 100388. [Google Scholar] [CrossRef]
  33. Chakraborty, G.; Kumar, N.; Das, C.R.; Albert, S.K.; Bhaduri, A.K.; Dash, S.; Tyagi, A.K. Study on Microstructure and Wear Properties of Different Nickel Base Hardfacing Alloys Deposited on Austenitic Stainless Steel. Surf. Coat. Technol. 2014, 244, 180–188. [Google Scholar] [CrossRef]
  34. Kumar, K.P.; Mohanty, A.; Lingappa, M.S.; Srinath, M.S.; Panigrahi, S.K. Enhancement of Surface Properties of Austenitic Stainless Steel by Nickel Based Alloy Cladding Developed Using Microwave Energy Technique. Mater. Chem. Phys. 2020, 256, 123657. [Google Scholar] [CrossRef]
  35. Zhang, X.; Li, Z.; Yang, B.; Sun, X.; Sun, G.; Wang, S.; Chen, C. Microstructure and Mechanical Properties of 304 Stainless Steel Produced by Interpass Milling Hybrid Direct Energy Deposition-Arc. J. Mater. Res. Technol. 2023, 27, 3744–3756. [Google Scholar] [CrossRef]
  36. Singh, R.; Goel, S.; Verma, R.; Jayaganthan, R.; Kumar, A. Mechanical Behaviour of 304 Austenitic Stainless Steel Processed by Room Temperature Rolling. Mater. Today Proc. 2018, 330, 012017. [Google Scholar] [CrossRef]
  37. Pérez, H.; Vargas, G.; Magdaleno, C.; Silva, R. Oxy-Nitriding AISI 304 Stainless Steel by Plasma Electrolytic Surface Saturation to Increase Wear Resistance. Metals 2023, 13, 309. [Google Scholar] [CrossRef]
  38. Xiao, J.; Liu, Y.; Wang, J.; Tan, P.; Zhou, F. Enhanced Wear Resistance of 304 Stainless Steel by an Improved Method Based on Ultrasonic Strengthening Grinding Process and PTFE Coating. Constr. Build. Mater. 2024, 431, 136598. [Google Scholar] [CrossRef]
  39. Kaul, R.; Ganesh, P.; Albert, S.K.; Jaiswal, A.; Lalla, N.P.; Gupta, A.; Paul, C.P.; Nath, A.K. Laser Cladding of Austenitic Stainless Steel with Hardfacing Alloy Nickel Base. Surf. Eng. 2003, 19, 269–273. [Google Scholar] [CrossRef]
  40. Yan, J.; Yang, Z.; Zhang, L.; Wang, J. Research on the Microstructure and Properties of Arc-Sprayed Austenitic Stainless Steel and Nickel-Based Alloy Composite Coatings with Different Spraying Distances. Crystals 2025, 15, 142. [Google Scholar] [CrossRef]
  41. Silva, E.B.; Azevedo, M.G.; Matlakhova, L.A.; Oliveira, B.F.; Monteiro, S.N.; Oliveira, L.J. Influence of Pressure and Powder Characteristics on the Properties and Microstructure of Colmonoy-5 Alloy Sintered by Spark Plasma Sintering. J. Mater. Res. Technol. 2024, 31, 363–371. [Google Scholar] [CrossRef]
  42. Natarajan, J.; Yang, C.-H.; Karuppasamy, S.S. Investigation on Microstructure, Nanohardness and Corrosion Response of Laser Cladded Colmonoy-6 Particles on 316L Steel Substrate. Materials 2021, 14, 6183. [Google Scholar] [CrossRef]
  43. Hemmati, I.; Ocelík, V.; De Hosson, J.T.M. Effects of the Alloy Composition on Phase Constitution and Properties of Laser Deposited Ni-Cr-B-Si Coatings. Phys. Procedia 2013, 41, 302–311. [Google Scholar] [CrossRef]
  44. da Silva, L.J.; D’Oliveira, A.S.C.M. NiCrSiBC Alloy: Microstructure and Hardness of Coatings Processed by Arc and Laser. Weld. Int. 2017, 31, 1–8. [Google Scholar] [CrossRef]
  45. Bhoskar, A.; Naik, H.; Kalyankar, V.; Deshmukh, D. Nickel-Based Metallurgical Coating Architectures for Superior Wear Resistance in High-Temperature P91 Steel Applications. J. Alloys Met. Syst. 2025, 9, 100151. [Google Scholar] [CrossRef]
  46. Rukhande, S.W.; Rathod, W.S.; Bhosale, D.G. Ni-Based Coating Protection of 316L Stainless Steel at Dry, Elevated Temperature and Wet Sliding Condition. Mater. Today Proc. 2022, 62, 7415–7420. [Google Scholar] [CrossRef]
  47. Angelastro, A.; Campanelli, S.L.; Casalino, G. Statistical Analysis and Optimization of Direct Metal Laser Deposition of 227-F Colmonoy Nickel Alloy. Opt. Laser Technol. 2017, 94, 138–145. [Google Scholar] [CrossRef]
  48. Whip, B.; Sheridan, L.; Gockel, J. The Effect of Primary Processing Parameters on Surface Roughness in Laser Powder Bed Additive Manufacturing. Int. J. Adv. Manuf. Technol. 2019, 103, 4411–4422. [Google Scholar] [CrossRef]
  49. ISO 25178-1:2016; Geometrical Product Specifications (GPS)—Surface Texture: Areal—Part 1: Indication of Surface Texture. International Organization for Standardization: Geneva, Switzerland, 2016.
  50. Terek, P.; Kovačević, L.; Terek, V.; Bobić, Z.; Miletić, A.; Škorić, B.; Čekada, M.; Drnovšek, A. Surface Roughness and Its Effect on Adhesion and Tribological Performance of Magnetron Sputtered Nitride Coatings. Coatings 2024, 14, 1010. [Google Scholar] [CrossRef]
  51. Narasimharaju, S.R.; Liu, W.; Zeng, W.; See, T.L.; Scott, P.; Jiang, X.; Lou, S. Surface Texture Characterisation of Longitudinal and Latitudinal External and Internal Surfaces of Laser Powder Bed Fusion Processed Bespoke Ball Artefact. J. Manuf. Process. 2024, 116, 120–148. [Google Scholar] [CrossRef]
  52. Alya, S.; Vundru, C.; Ankamreddy, B.; Singh, R. Characterization and Modeling of Deposition Geometry in Directed Energy Deposition over Inclined Surfaces. Procedia Manuf. 2019, 34, 695–703. [Google Scholar] [CrossRef]
  53. Gandhi, D.; Mukherjee, M.; Rajak, B.; Arora, K.S. Directed Energy Deposition (DED) of Fe-6.5wt%Si Electrical Steel. Prog. Addit. Manuf. 2025; in press. [Google Scholar] [CrossRef]
  54. ISO 4545-1:2017; Metallic Materials—Knoop Hardness Test—Part 1: Test Method. International Organization for Standardization: Geneva, Switzerland, 2017.
  55. Miranda-Lugo, P.J.; Rodriguez, O.M.H. Plateau–Rayleigh Instability in Low-Viscosity Ratio Stratified Liquid–Liquid Flow. Int. J. Multiph. Flow 2025, 189, 105253. [Google Scholar] [CrossRef]
  56. Zang, W.; Hou, W.; Deike, L.; Arnold, C. Understanding the Rayleigh Instability in Humping Phenomenon during Laser Powder Bed Fusion Process. Int. J. Extrem. Manuf. 2022, 4, 015201. [Google Scholar] [CrossRef]
  57. Da Silva, A.; Volpp, J.; Kaplan, A.F.H. The Effects of Laser Irradiation on an Aluminium Powder Stream in Directed Energy Deposition. Addit. Manuf. 2021, 41, 101968. [Google Scholar] [CrossRef]
  58. Lv, C.; Wang, J.; Li, H.; Yin, Q.; Liu, W.; Shen, S. Dynamics of the Laser–Powder Interaction in the Ti6Al4V Powder Feeding Process of Laser-Directed Energy Deposition Additive Manufacturing. J. Mater. Res. Technol. 2023, 27, 6376–6385. [Google Scholar] [CrossRef]
  59. Lei, C.; Ren, S.; Yin, C.; Liu, X.; Chen, M.; Wu, J.; Han, C. Manipulating Melt Pool Thermofluidic Transport in Directed Energy Deposition Driven by a Laser Intensity Spatial Shaping Strategy. Virt. Phys. Prototyp. 2024, 19, e2308513. [Google Scholar] [CrossRef]
  60. Prasad, H.S.; Brueckner, F.; Kaplan, A.F.H. Powder Incorporation and Spatter Formation in High Deposition Rate Blown Powder Directed Energy Deposition. Addit. Manuf. 2020, 35, 101413. [Google Scholar] [CrossRef]
  61. Iasella, S.V.; Sun, N.; Zhang, X.; Corcoran, T.E.; Garoff, S.; Przybycien, T.M.; Tilton, R.D. Flow Regime Transitions and Effects on Solute Transport in Surfactant-Driven Marangoni Flows. J. Colloid Interface Sci. 2019, 553, 136–147. [Google Scholar] [CrossRef]
  62. Zhang, K.; Chen, Y.; Marussi, S.; Fan, X.; Fitzpatrick, M.; Bhagavath, S.; Majkut, M.; Lukic, B.; Jakata, K.; Rack, A.; et al. Pore Evolution Mechanisms during Directed Energy Deposition Additive Manufacturing. Nat. Commun. 2024, 15, 1715. [Google Scholar] [CrossRef] [PubMed]
  63. Zhang, S.; Yao, C.; Zhang, D.; Liu, W.; He, L.; Du, D.; Sun, B.; Dong, A.; Zhang, B.; Xiong, L. Dynamics of Pore Formation and Evolution during Multi-Layer Directed Energy Deposition Additive Manufacturing via In-Situ Synchrotron X-ray Imaging: A Case Study on High-Entropy Cantor Alloy. Int. J. Mach. Tools Manuf. 2024, 200, 104181. [Google Scholar] [CrossRef]
  64. Wang, J.; Zhu, R.; Liu, Y.; Zhang, L. Understanding Melt Pool Characteristics in Laser Powder Bed Fusion: An Overview of Single- and Multi-Track Melt Pools for Process Optimization. Adv. Powder Mater. 2023, 2, 100137. [Google Scholar] [CrossRef]
  65. Ertay, D.S.; Naiel, M.A.; Vlasea, M.; Fieguth, P. Process Performance Evaluation and Classification via In-Situ Melt Pool Monitoring in Directed Energy Deposition. CIRP J. Manuf. Sci. Technol. 2021, 35, 298–314. [Google Scholar] [CrossRef]
  66. An, Z.; Sun, H.; Zhang, X. Bead Geometry Prediction for Gas Metal Arc Directed Energy Deposited Layer Using Interpretable Machine Learning. Mater. Today Commun. 2025, 42, 111138. [Google Scholar] [CrossRef]
  67. Templeton, W.F.; Hinnebusch, S.; Strayer, S.T.; To, A.C.; Pistorius, P.C.; Narra, S.P. A Mechanistic Explanation of Shrinkage Porosity in Laser Powder Bed Fusion Additive Manufacturing. Acta Mater. 2024, 266, 119632. [Google Scholar] [CrossRef]
  68. Kurz, F.D.; Mahamood, R.M. Fundamentals of Solidification; Trans Tech Publications Ltd: Bäch, Switzerland, 2023. [Google Scholar]
  69. Chandra, S.; Radhakrishnan, J.; Huang, S.; Wei, S.; Ramamurty, U. Solidification in metal additive manufacturing: Challenges, solutions, and opportunities. Prog. Mater. Sci. 2025, 148, 101361. [Google Scholar] [CrossRef]
  70. Khalajzadeh, V.; Beckermann, C. Simulation of Shrinkage Porosity Formation During Alloy Solidification. Metall. Mater. Trans. A 2020, 51, 2239–2254. [Google Scholar] [CrossRef]
  71. Alimohammadi, A.; Khorram, A.; Araee, A. Statistical Modeling and Optimization of Clad Geometry in Laser Cladding of Amdry 365 on Hastelloy X Superalloy with Response Surface Methodology. Vacuum 2024, 230, 113665. [Google Scholar] [CrossRef]
  72. Xiang, D.; Wang, D.; Wang, S.; Yan, L.; Chen, Y. Analysis and Optimization of Laser Cladding Ti-B4C Composite Coatings Based on the Interaction and GABP-NSGAII Algorithm. Surf. Coat. Technol. 2024, 493, 131186. [Google Scholar] [CrossRef]
  73. Shu, L.; Shi, J.; Huang, T.; Li, P.; Wu, H.; Zhou, J. Optimization of Laser Cladding Powder Ratio and Process Parameters Based on MOGWO Algorithm. Mater. Today Commun. 2024, 41, 110605. [Google Scholar] [CrossRef]
  74. Gao, S.; Fu, Q.; Li, M.; Huang, L.; Liu, N.; Cui, C.; Yang, B.; Zhang, G. Optimization of Laser Cladding Parameters for High-Entropy Alloy-Reinforced 316L Stainless-Steel via Grey Relational Analysis. Coatings 2024, 14, 1103. [Google Scholar] [CrossRef]
  75. Momeni, S.; Coelho, R.T.; Nuñez, J.G.; Jasinevicius, R.G. Effect of Process Parameters on the Geometry of Single-Track Deposits of Inconel 718 onto AISI4140 Using Laser Cladding. Int. J. Adv. Manuf. Technol. 2024, 134, 5337–5353. [Google Scholar] [CrossRef]
  76. Pekkarinen, J.; Kujanpää, V.; Salminen, A. Laser Cladding with Scanning Optics: Effect of Power Adjustment. J. Laser Appl. 2012, 24, 032003. [Google Scholar] [CrossRef]
  77. Mahamood, R.M.; Akinlabi, E.T.; Owolabi, M.G. Effect of Laser Power and Powder Flow Rate on Dilution Rate and Surface Finish Produced During Laser Metal Deposition of Titanium Alloy. In Proceedings of the 8th International Conference on Mechanical and Intelligent Manufacturing Technologies (ICMIMT), Cape Town, South Africa, 3–6 February 2017; pp. 6–10. [Google Scholar] [CrossRef]
  78. Zhu, S.; Chen, W.; Zhan, X.; Ding, L.; Wang, E. Optimization of Dilution Rate of Laser Cladding Repair Based on Deep Learning. Int. J. Adv. Manuf. Technol. 2020, 110, 1471–1484. [Google Scholar] [CrossRef]
  79. Carrozza, A.; Mazzucato, F.; Aversa, A.; Lombardi, M.; Bondioli, F.; Biamino, S.; Valente, A.; Fino, P. Single Scans of Ti-6Al-4V by Directed Energy Deposition: A Cost and Time Effective Methodology to Assess the Proper Process Window. Metals Mater. Int. 2021, 27, 3590–3602. [Google Scholar] [CrossRef]
  80. Wang, Y.; Yu, T.; Zhang, Y.; Sun, J.; Sun, Z. Process Parameter Optimization of Fe-Based Coating on Ductile Iron Using Laser Cladding with Grey Related Analysis. Opt. Laser Technol. 2025, 181, 111906. [Google Scholar] [CrossRef]
  81. Belsvik, M.A.; Hansen, V. Process Parameter Optimization for Directed Laser Deposition of Hot Work Tool Steel Dievar. Int. J. Adv. Manuf. Technol. 2025, 138, 1129–1142. [Google Scholar] [CrossRef]
  82. Abioye, T.E.; McCartney, D.G.; Clare, A.T. Laser Cladding of Inconel 625 Wire for Corrosion Protection. J. Mater. Process. Technol. 2015, 217, 232–240. [Google Scholar] [CrossRef]
  83. Kim, J.-D.; Lee, E.-J.; Wang, J.-G. Comparison of Clad Layer Characteristics with Overlapping Criterion in Multi Pass Laser Cladding. J. Korean Soc. Mar. Eng. 2016, 40, 768–773. [Google Scholar] [CrossRef]
  84. Xiong, J.; Zhang, G.; Gao, H.; Wu, L. Modeling of Bead Section Profile and Overlapping Beads with Experimental Validation for Robotic GMAW-Based Rapid Manufacturing. Robot. Comput.-Integr. Manuf. 2013, 29, 417–423. [Google Scholar] [CrossRef]
  85. Zhong, C.; Liu, P.; Ren, X.; Luan, B.; Volinsky, A.A. Effect of Inconel 625 Coating via High-Speed Laser Direct Energy Deposition on the Fatigue Characteristics of Q235 Steel. Int. J. Fatigue 2025, 193, 108746. [Google Scholar] [CrossRef]
  86. La Barbera-Sosa, J.G.; Santana, Y.Y.; Villalobos-Gutiérrez, C.; Chicot, D.; Lesage, J.; Decoopman, X.; Iost, A.; Staia, M.H.; Puchi-Cabrera, E.S. Fatigue Behavior of a Structural Steel Coated with a WC–10Co–4Cr/Colmonoy 88 Deposit by HVOF Thermal Spraying. Surf. Coat. Technol. 2013, 220, 248–256. [Google Scholar] [CrossRef]
Figure 1. (a) DED process schematic diagram and (b) the coating Colmonoy tracks on AISI 304 substrate scanned and analyzed by digital optical microscope.
Crystals 15 00626 g001
Figure 2. Schematic representation of profile extraction on XY plane. On the left a 3D visualization of the in-plane shape extraction. On the right the binarized image analyzed for perimeter calculation.
Crystals 15 00626 g002
Figure 3. (a) Schematic representation of profile extraction on XZ and YZ planes. (b) Schematic illustration of an XZ profile. (c) Schematic representation of a YZ profile presenting W t i j and W t t o t i and highlighting in red and blue the sampling frequencies.
Crystals 15 00626 g003
Figure 4. (a) EDM cutting line and extracted samples: first CST on the left is P06-F04 while last track on the right is P10-F10. (b) Parameters used for dilution ratio calculation and clad angle schematic representations [21].
Crystals 15 00626 g004
Figure 5. Low (a) and high magnification (b) SEM micrographs of the Colmonoy 227-F virgin powder.
Crystals 15 00626 g005
Figure 6. High magnification SEM micrographs (a,b) of Colmonoy 227-F particles with peculiar features on the surface and comparison of the EDS spectra acquired in the darker area and in the bright area of the same particle (c).
Crystals 15 00626 g006
Figure 7. Variation in volume deposited over the build plate (a) compared with variation in the DOE parameters (b).
Crystals 15 00626 g007
Figure 8. (a) MD indexes divided by sectioning planes. (b) Global material distribution indexes related to the various CST conditions.
Crystals 15 00626 g008
Figure 9. (a) high spatter density correlated to high laser power from which recoil pressure and particle disintegration phenomena are generated. (b) Particle island formation. The white bars indicate the scale, which is equivalent to 500 μm for both (a) and (b).
Crystals 15 00626 g009
Figure 10. The arithmetic mean (Sa) and the root mean square (Sq) surface roughness of each DOE condition-coated track.
Crystals 15 00626 g010
Figure 11. SEM-BSE cross sections of the fabricated coating scan tracks; laser power is constant on each raw, and the process parameter combination is compliant with Table 2.
Crystals 15 00626 g011
Figure 12. SEM-BSE details of the melt pool complex conditions of (a) P09-F04 and (b) P09-F06 and highlight of conditions P09-F08 (c) and P10-F10 (d).
Crystals 15 00626 g012
Figure 13. SEM-BSE and EDS elemental map of the Colmonoy mushy zone border.
Crystals 15 00626 g013
Figure 14. (a) Dilution ratio and (b) clad angle related to the various process parameters conditions.
Crystals 15 00626 g014
Figure 15. CST height (a) and depth (b) calculated values and trends.
Crystals 15 00626 g015
Figure 16. (a) Schematic representation of the microhardness indentations distributed across the transverse cross-section of the CSTs, the number of indents shown corresponds to the 9 representative values reported in (b), selected to represent the typical microhardness variation across coating, mushy zone, and substrate regions. (b) Microhardness profile showing mean values and standard deviations across the three zones of the CSTs.
Crystals 15 00626 g016
Table 1. Colmonoy 227-F virgin powder and AISI 304 substrate chemical compositions.
ElementBCCoCrFeMnNNiPSSiOther
Colmonoy 227-F (wt.%)0.930.02≤0.010.110.05--Bal.2- 0.07
AISI 304 (wt.%)-0.07-17.5–19.5Bal.≤2≤0.118.0–10.5≤0.045≤0.03≤1-
Table 2. DOE process parameters and condition identification codes.
DOESample ID
Pn-Fm
Laser Power (W)Scanning Speed (mm/min)
1P06-F04 600400
2P06-F06 600600
3P06-F08 600800
4P06-F10 6001000
5P08-F04 800400
6P08-F06 800600
7P08-F08 800800
8P08-F10 8001000
9P09-F04 900400
10P09-F06 900600
11P09-F08 900800
12P09-F10 9001000
13P10-F04 1000400
14P10-F06 1000600
15P10-F08 1000800
16P10-F10 10001000
Table 3. Experimental chemical composition of the Colmonoy 227-F powder (average values) compared with the nominal values given in the Wall-Colmonoy datasheet.
Si (wt%)P (wt%)Fe (wt%)Ni (wt%)
Experimental1.4 ± 0.11.02 ± 0.081.9 ± 0.1Balance
Nominal (Wall-Colmonoy)2.7420.05Balance
Table 4. EDS point analysis acquired form the red dots in Figure 12a.
#Fe (wt%) Ni (wt%) Cr (wt%) Si (wt%) P (wt%)
178.62 ± 0.17 NA20.93 ± 0.15 0.45 ± 0.08 NA
257.21 ± 0.37 25.21 ± 0.25 16.48 ± 0.16 0.94 ± 0.09 0.52 ± 0.08
346.03 ± 0.30 39.54 ± 0.27 17.10 ± 0.13 1.55 ± 0.10 1.11 ± 0.09
413.23 ± 0.14 79.69 ± 0.30 3.57 ± 0.09 1.95 ± 0.11 1.51 ± 0.10
NA stands for Not Available
Disclaimer/Publisher’s Note: The statements, opinions and data contained in all publications are solely those of the individual author(s) and contributor(s) and not of MDPI and/or the editor(s). MDPI and/or the editor(s) disclaim responsibility for any injury to people or property resulting from any ideas, methods, instructions or products referred to in the content.