Article

Properties of Cast Iron Produced with a Limited Share of Pig Iron in the Charge

Department of Foundry Engineering, Faculty of Mechanical Engineering, Silesian University of Technology, Towarowa 7, 44-100 Gliwice, Poland
*
Authors to whom correspondence should be addressed.
Crystals 2025, 15(7), 614; https://doi.org/10.3390/cryst15070614
Submission received: 15 May 2025 / Revised: 16 June 2025 / Accepted: 29 June 2025 / Published: 30 June 2025

Abstract

The article presents issues related to the melting of cast iron with a limited or zero share of pig iron in the charge. The results of melts conducted in electric induction furnaces are presented. The elimination of pig iron and its replacement with steel or return scrap is highly significant in the context of sustainable production and product life cycle assessment (LCA). The paper presents the results of research carried out during melts conducted under both laboratory and industrial conditions. The chemical composition of the cast iron, its physicochemical properties obtained from the analysis of the cooling curve and its derivative, as well as the structure, were analyzed. It was found that cast iron produced using high-quality steel scrap contains fewer sulfur and phosphorus impurities. However, it was also observed that such cast iron exhibits reduced nucleation ability, which can be improved by applying an inoculation process.

1. Introduction

Cast iron is the most commonly used foundry alloy. It accounts for approximately 75% of the global casting production (including grey, ductile, and malleable iron). In the cast iron melting process, pig iron can be used, which in many cases is the primary charge component—its share may reach up to 75% of the total charge mass (as in the case of ferritic ductile iron). However, the issue of producing cast iron without the use of pig iron periodically recurs. This is due to significant price disparities between these charge materials or difficulties in the availability of pig iron resulting from ongoing armed conflicts. Recently, environmental aspects have also become increasingly important, as scrap is a secondary material. In the current experiments, the scope of research was extended to include an analysis of the cooling curve and its derivative, which enables the assessment of the quality of the liquid cast iron already at the furnace stage. An increasing number of foundries are equipped with systems for recording such curves (ITACA, ATAS, etc.). The aim of the authors was to take a broader look at the reduction in pig iron use and to convince foundries that this can be achieved without compromising the quality of the alloy.
Among foundry professionals, there is a common belief that high-quality cast iron can only be produced with the use of pig iron. The main objective of this study was to evaluate how the share of pig iron affects the chemical composition and metallurgical quality, and whether this difference can be detected. The authors of this study have long been trying to demonstrate that this is merely a myth [1,2]. Moreover, pig iron is a blast furnace product containing 3.5–4.5% C. Its production requires the use of natural raw materials (iron ore, coke), results in pollutant emissions, and involves high costs.
It is also possible to carry out melting without the use of pig iron, replacing it with steel scrap and return scrap, i.e., secondary raw materials. In this case, however, it is necessary to compensate for the carbon deficit that arises from removing pig iron from the charge and replacing it with steel scrap [3,4].
Here, recarburizers are commonly used—often industrial by-products obtained from the processing of used electrodes and furnace linings employed in metallurgical processes. This approach is typically applied when the carburizing agent is introduced along with the solid charge [5,6,7].
When analyzing the differences that may arise from substituting the aforementioned materials, several aspects can be considered. A comparison of impurity content—specifically sulfur and phosphorus—has shown that melting cast iron based on steel scrap results in very low levels of these impurities in the final product. This means that in the case of grey cast iron, replacing pig iron with steel scrap leads to a material of higher purity [1,3].
However, certain issues arise when melting ferritic ductile iron, which requires a very low manganese content (recommended up to 0.3%). For producing this alloy, special pig irons containing less than 0.05% Mn are typically used. In contrast, manganese content in steels is usually much higher (often exceeding 1.0% Mn). One way to address this issue is by using deep-drawing or transformer sheet scrap, in which the manganese content does not exceed 0.35%. Additionally, a higher proportion of return scrap can be introduced into the charge in such cases.
In ferritic, pearlitic, or pearlitic cast iron, the manganese content can reach up to 0.8%. Ensuring high alloy quality in a foundry is also related to the use of sorted steel scrap with appropriate chemical composition and physical form. The physical form includes both the dimensions and the surface area of the scrap. The size of the pieces is particularly important for melting in an induction furnace, due to the penetration depth of the induced current in the charge. Moreover, very fine scrap—due to its high specific surface area—is more prone to oxidation, which results in increased slag formation [8].

2. Materials and Methods

During the course of the research, approximately 40 grey cast iron melts were carried out (10 of which are presented in this article), along with 12 ductile iron melts (8 included in the article), all based exclusively on steel scrap and recarburizers. Some melts were carried out using special pig iron (melt designation—PI). Recarburizing materials were added to the solid charge in the furnace in previously calculated and weighed portions. The mass of steel scrap ranged from 10 to 15 kg. Recarburizers were added in varying amounts, depending on the intended increase in carbon content in the cast iron [9].
The efficiency of carbon recovery from different recarburizers was not analyzed in this article, as it was the subject of other publications [2]; instead, the focus here was on the metallurgical quality of the alloy. The silicon content was adjusted by either adding FeSi75 to the surface of the molten metal after the charge had melted or by introducing SiC into the solid charge. The composition of the charge materials for grey cast iron is presented in Table 1.
All melts were carried out in a high-frequency coreless induction furnace with a crucible capacity of 20 kg. As part of the study, ductile iron melts were also performed (Table 2). The spheroidization process was carried out in the melting furnace using the cored wire method. The length of the wire introduced was 50–55 cm, which corresponded to 34–37.5 g of magnesium. The flexible wire contained 30% Mg, 42.63% Si, 1.87% Re, and 0.7% Al.
A series of six melts was also conducted using pig iron in varying proportions ranging from 0% to 50%, in 10% increments. The melts were carried out, as before, in a laboratory induction furnace. The objective of this study was to examine the effect of increasing the pig iron content on the quality of cast iron.
The chemical composition was analyzed using a spectrometer on a sample cast after melting (prior to any modification process). To assess the metallurgical quality, the analysis of the cooling curve and its derivative was employed. The essence of this method is the recording of the cooling curve—the temperature (T) over time—and its time derivative, commonly referred to as the crystallization curve (dT/dt) [10,11,12,13,14,15,16,17].
In the studies and analyses, the following were used above all:
  • Nikon ECLIPSE LV150 metallographic microscope equipped with a Nikon DS-Fi1-U2 camera (Nikon Corporation, Tokyo, Japan);
  • ZEISS SUPRA 35 high-resolution (Carl Zeiss AG, Oberkochen, Germany) scanning electron microscope, equipped with an EDS chemical composition analysis system;
  • LECO GDS500A emission spectrometer (LECO Corporation, St. Joseph, MI, USA);
  • LECO CS-125 analyzer (LECO Corporation, St. Joseph, MI, USA), enabling precise determination of the carbon and sulfur concentrations.
The cooling curve allows observation of temperature changes during the metal solidification process. It defines characteristic points, with the first indicating the beginning of crystallization (liquidus temperature) and the second marking the end of solidification (solidus temperature). The derivative curve makes it possible to detect even the slightest thermal effects occurring in the metal, thus allowing for the identification of thermal plateaus. The diagram below (Figure 1) shows a representative of the cooling curve and its derivative with the characteristic points marked [10,11,12].
The curve representing the temperature derivative is determined after its recording. The most important recorded parameters include the following:
  • Liquidus temperature (Tliq)—the temperature at which the first solid particles form, marking the beginning of solidification. For alloys with compositions deviating from the eutectic point, a liquidus temperature appears on the cooling curve: it corresponds to the austenite liquidus for hypoeutectic cast irons and to the graphite liquidus for hypereutectic cast irons. In strictly eutectic alloys, the liquidus temperature is not defined as a single point but rather as part of the eutectic reaction region [18];
  • Minimum eutectic temperature (Temin)—the lowest temperature reached during eutectic solidification. At this point, the latent heat of crystallization equals the heat released during cooling. This is the most important indicator of cast iron nucleation. The higher the Temin, the better the nucleation potential. It is commonly accepted that below 1135 °C, nucleation is low and there is a high risk of primary carbides forming in the casting. Between 1135 °C and 1145 °C, nucleation is considered optimal, and the risk of primary carbides appears only in thin-walled castings. Above 1145 °C, nucleation is very good and there is no risk of primary carbide formation [10,18,19,20];
  • Maximum eutectic temperature (Temax)—the highest temperature during the eutectic transformation [18];
  • Solidus temperature (Tsolidus)—the temperature at which the solidification process ends [18];
  • Recalescence (Rec)—the difference between the maximum and minimum eutectic temperatures. The optimal value of recalescence for gray cast iron is between 4 and 9 °C, and for ductile iron it ranges from 2 to 5 °C. A low Rec value may indicate a low level of graphite expansion, which can lead to porosity formation. This value should be assessed in relation to the nucleation level and the current position in the Fe-C phase diagram. A high Rec value is associated with a high level of graphite expansion and may cause mold distortion [10,18,19,20].

3. Results

As previously mentioned, during each melt, a sample was cast for chemical analysis and the cooling curves and their derivatives were recorded.

3.1. Chemical Composition
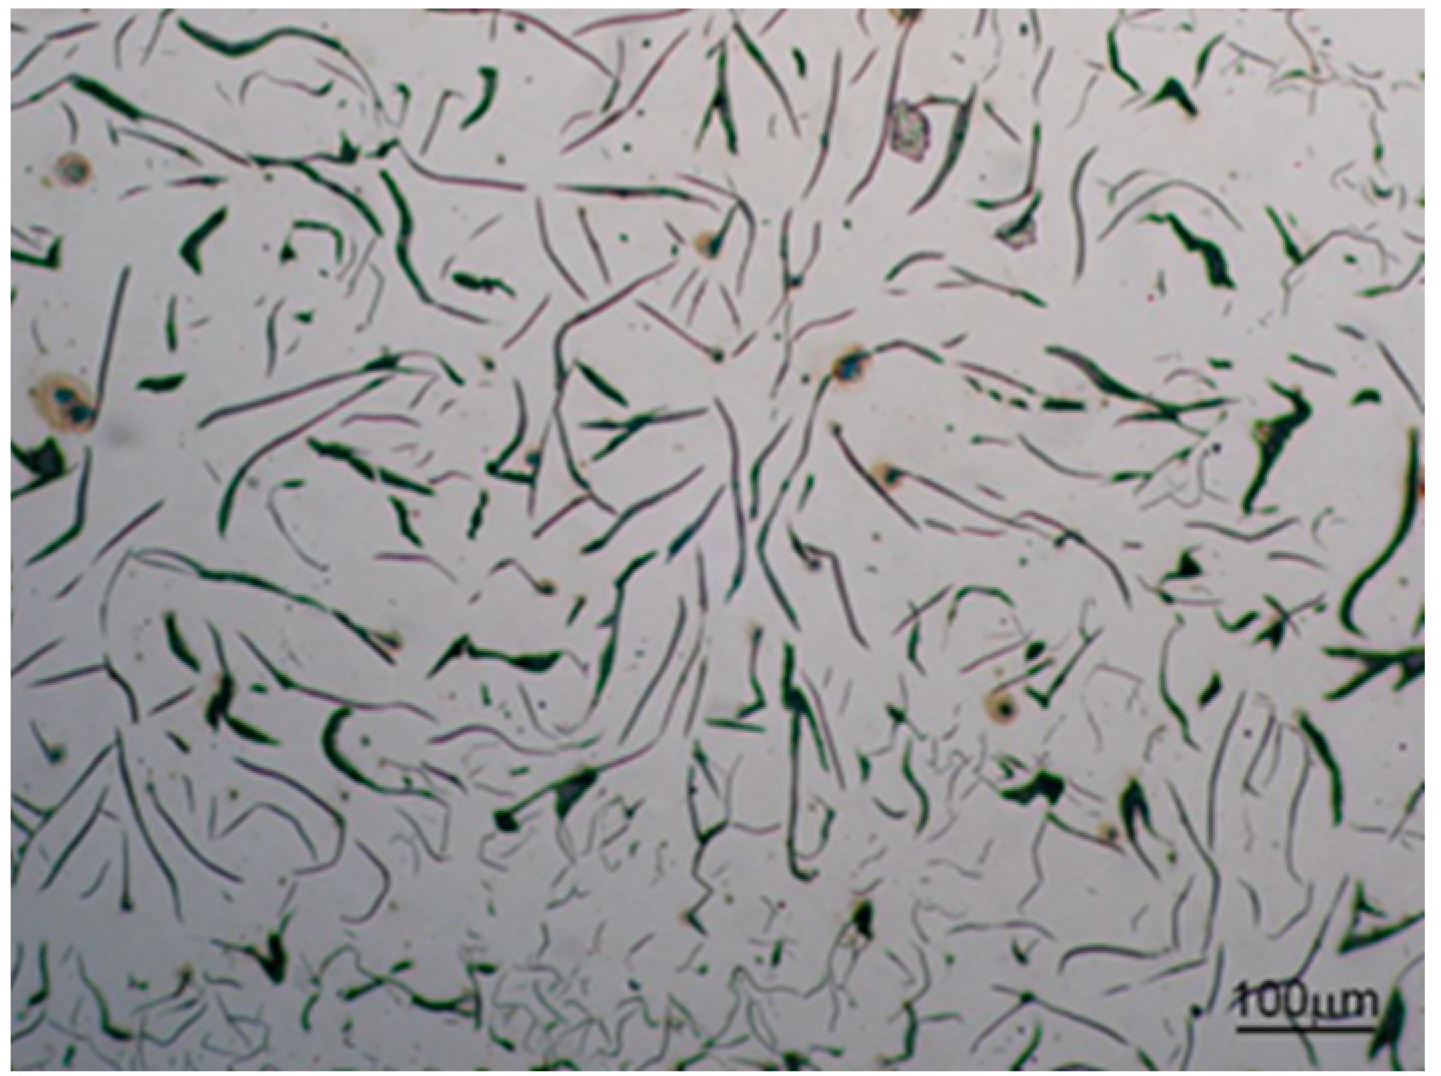
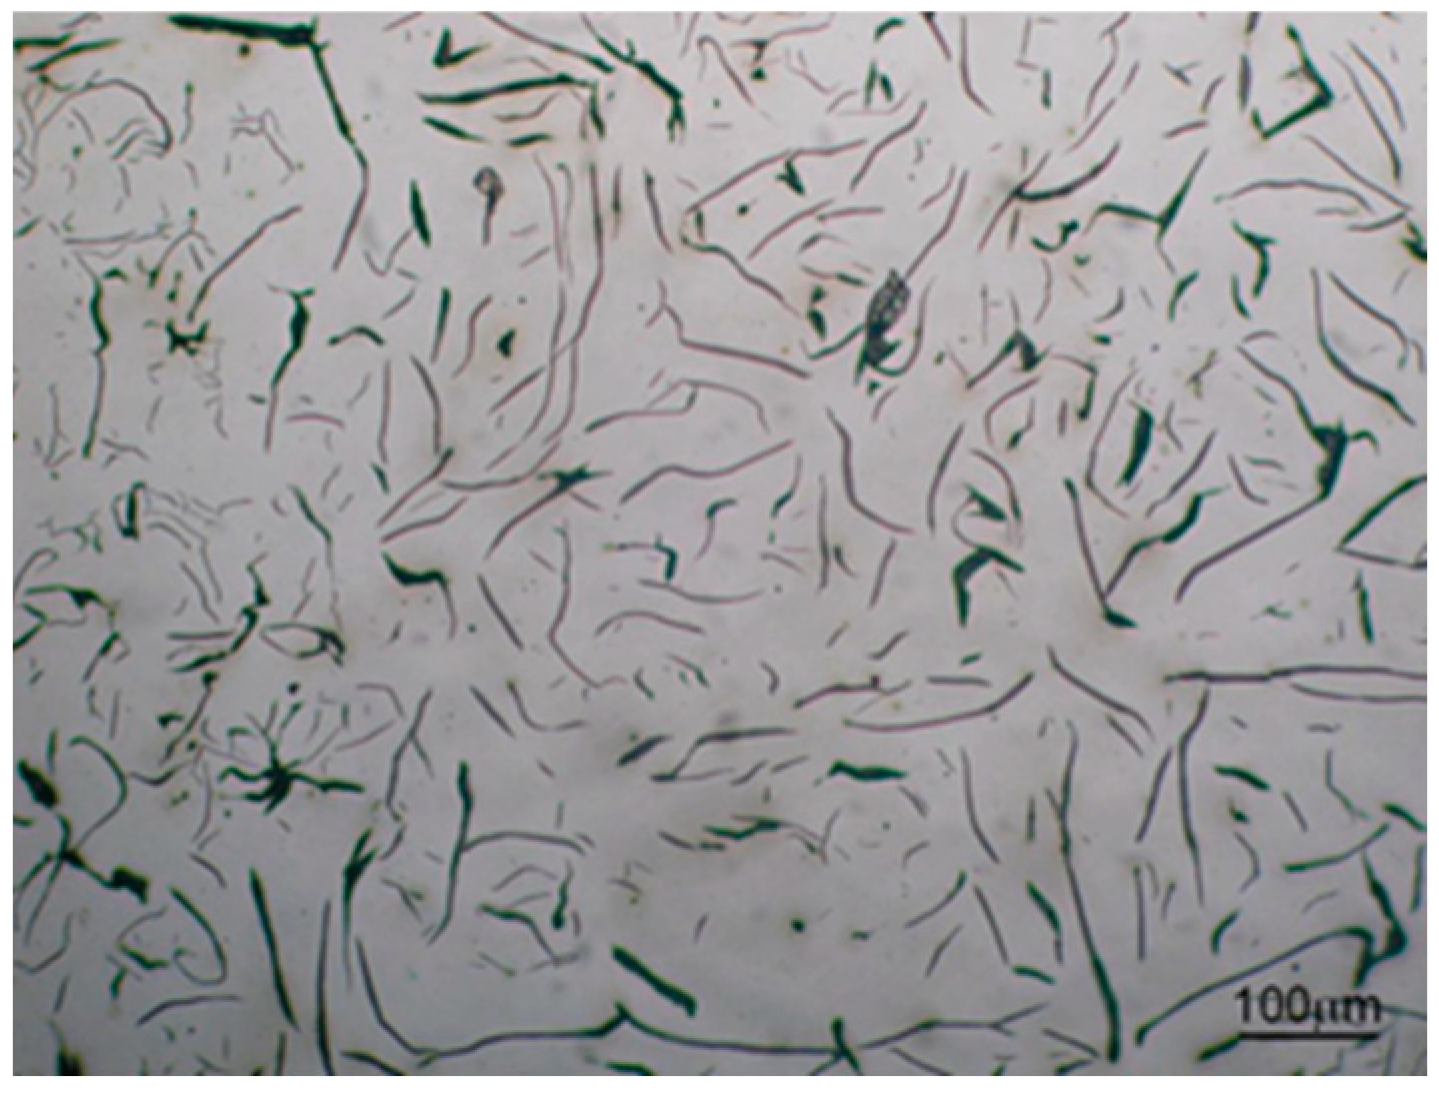
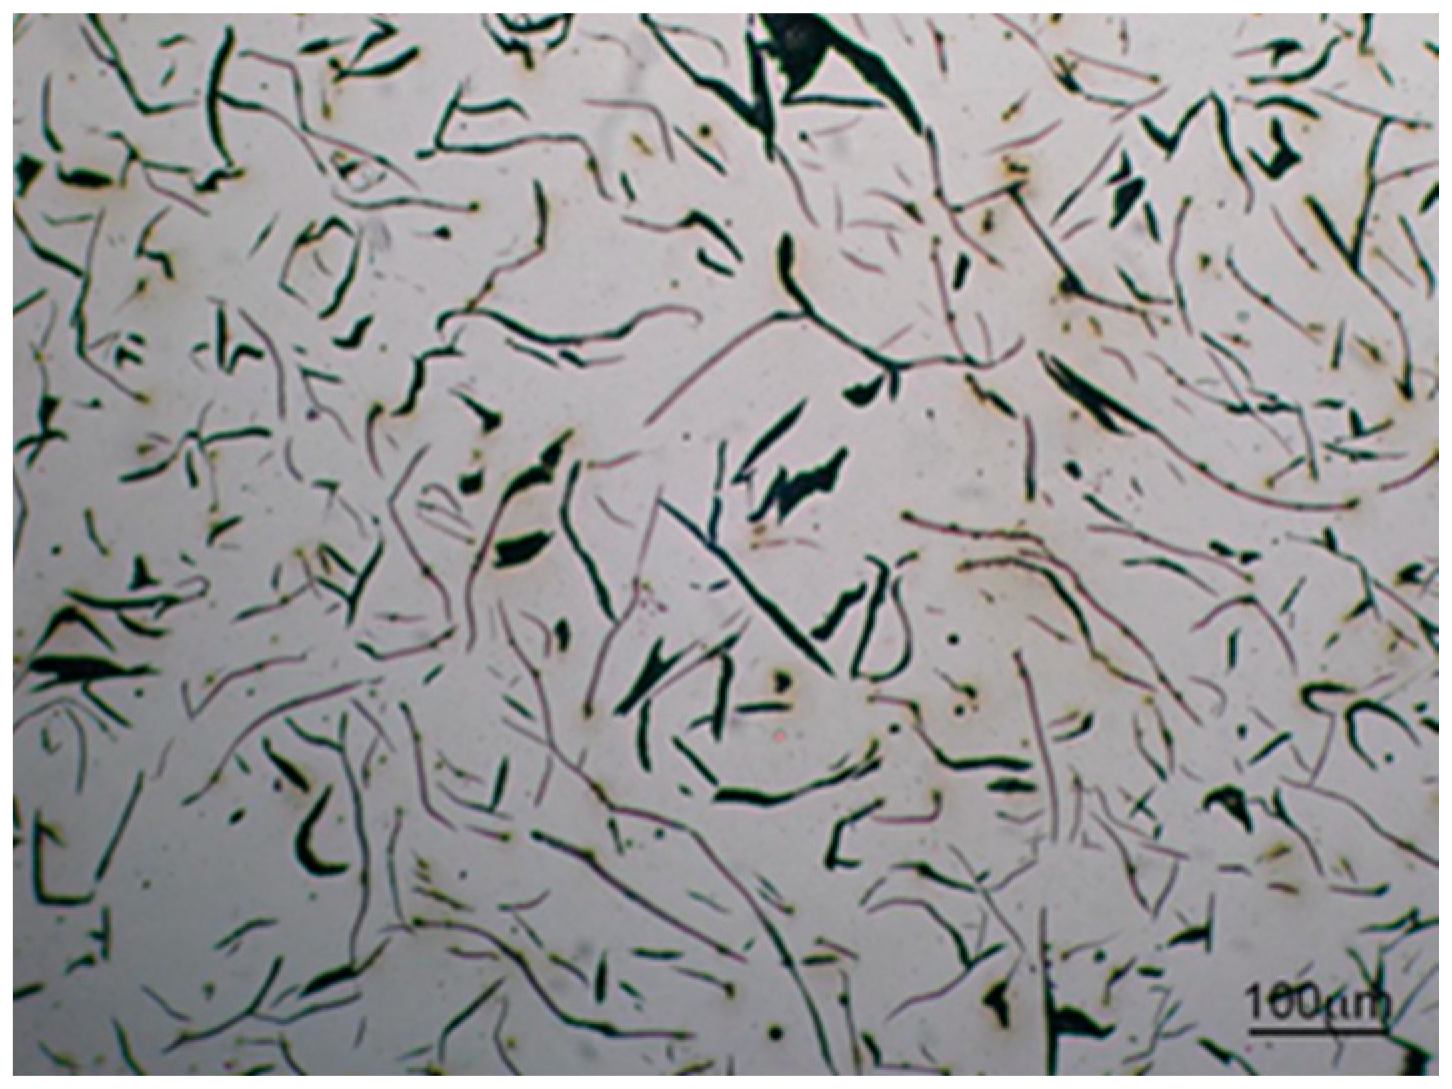
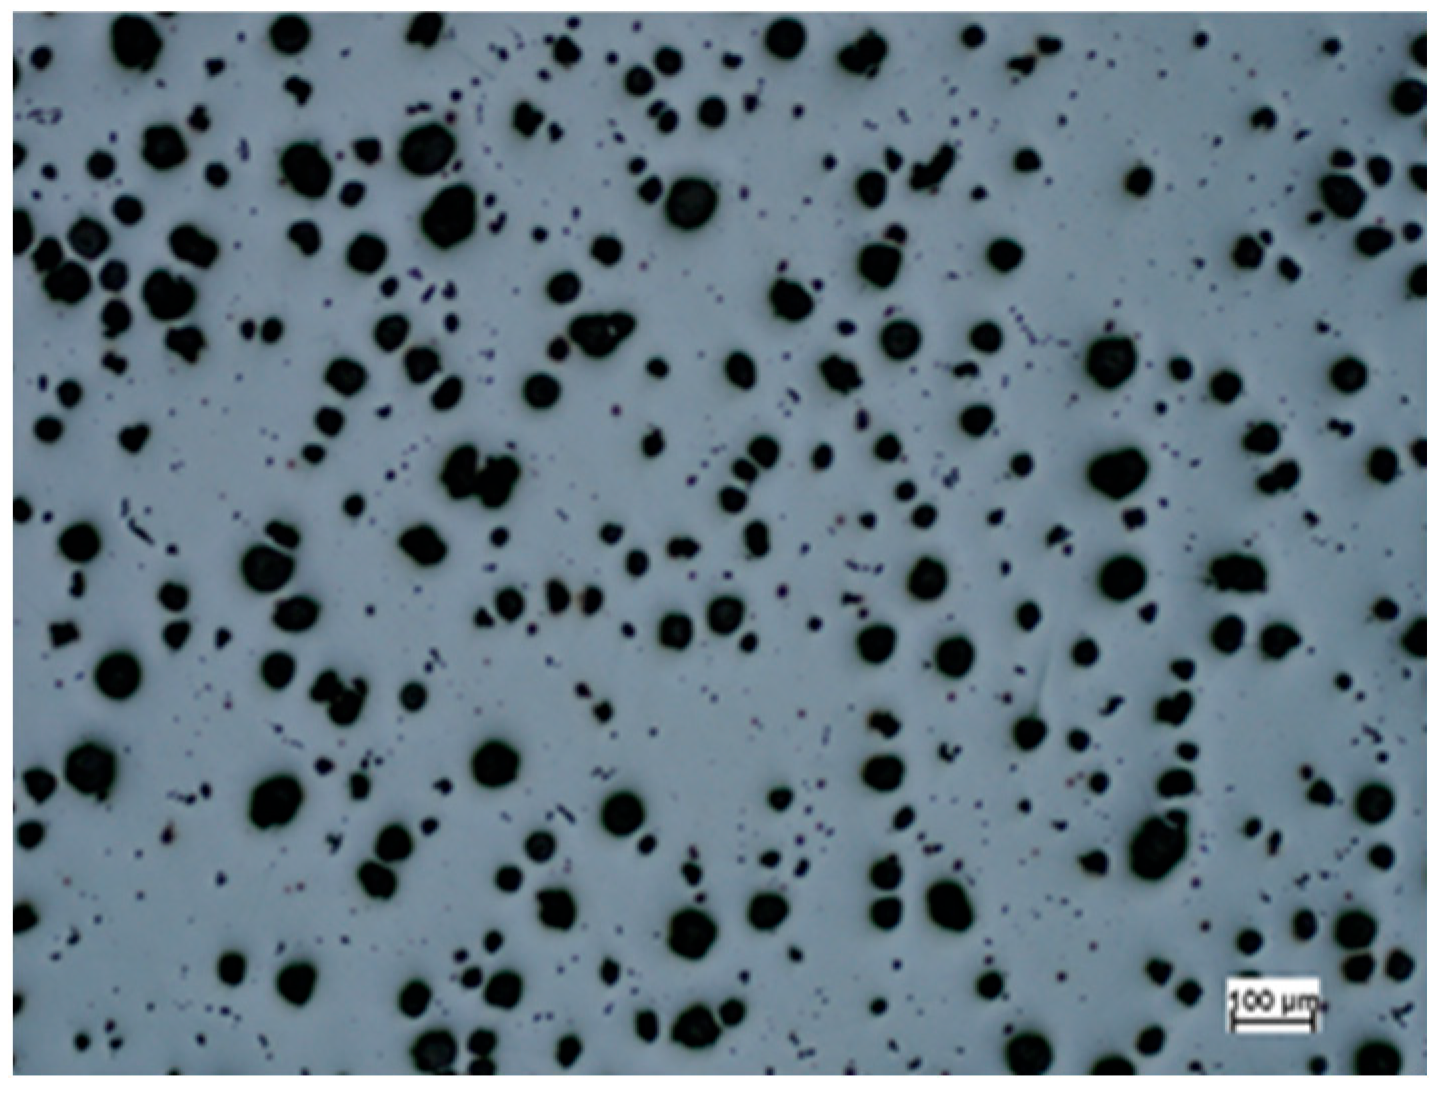
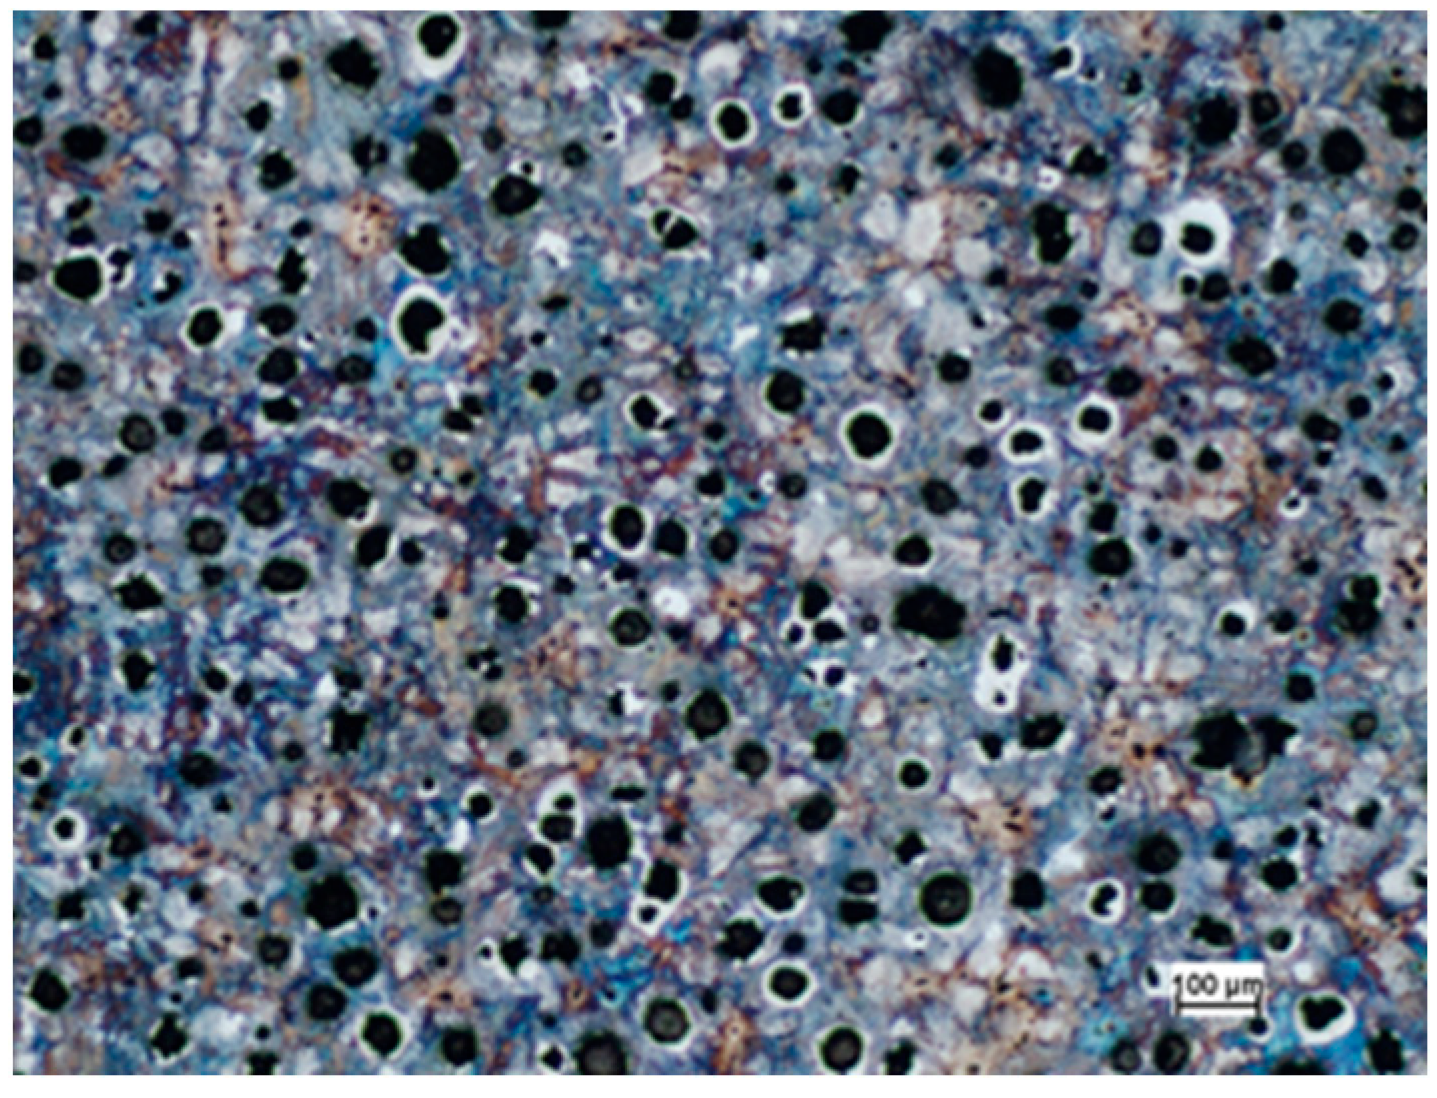
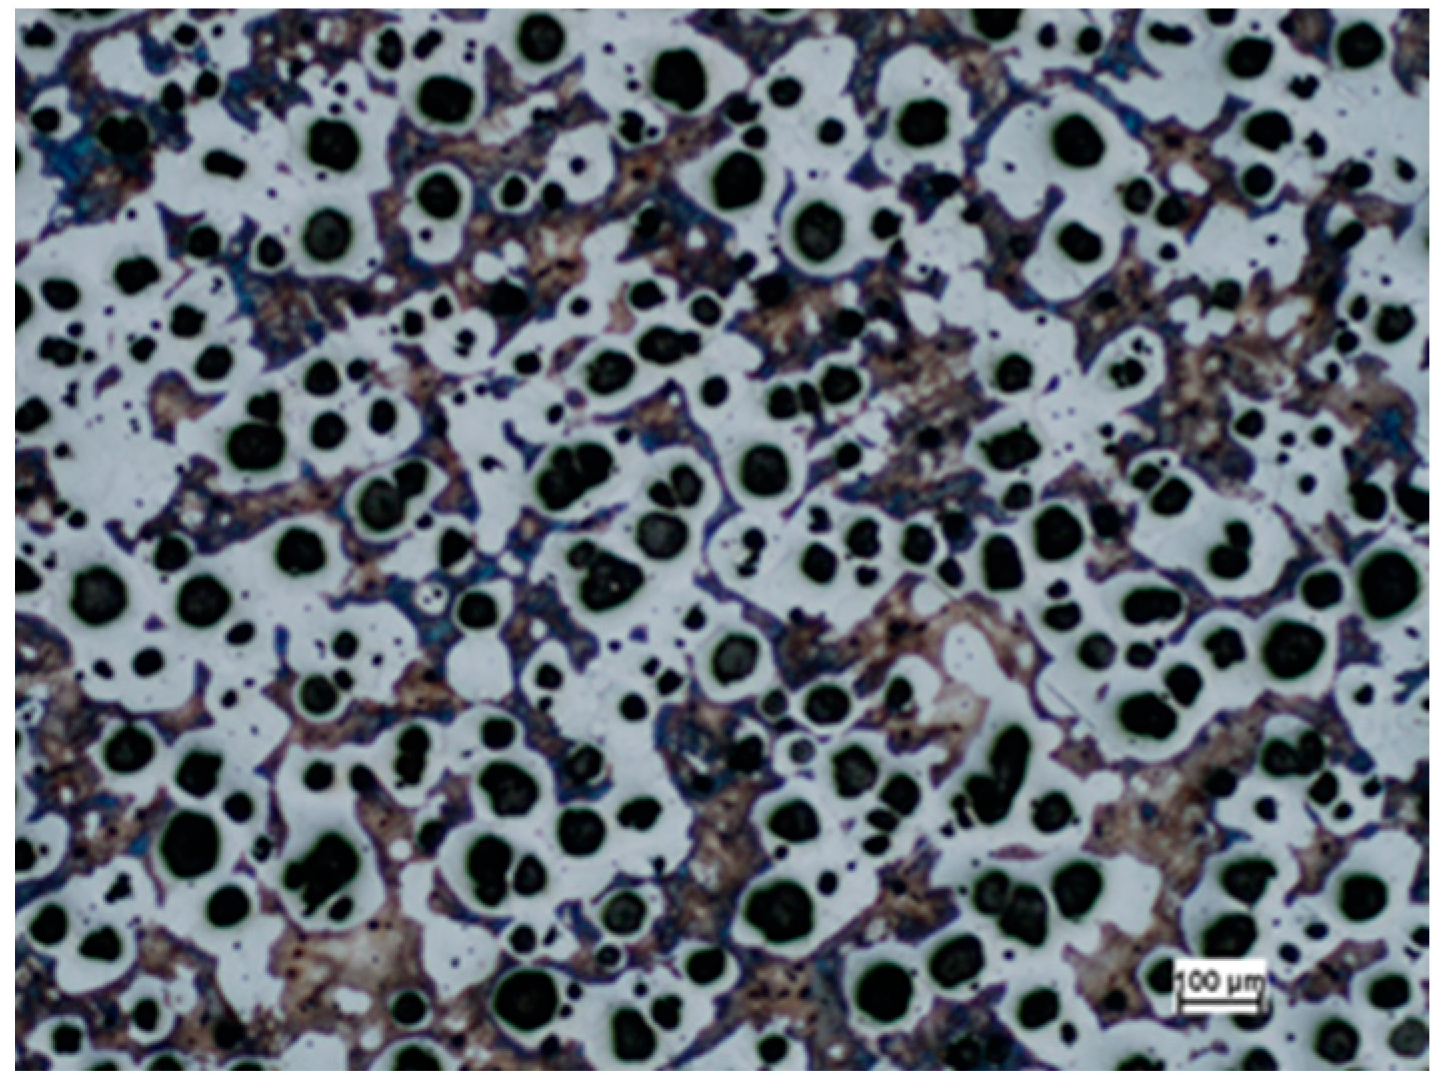
Chemical analyses were performed using a LECO GDS500A glow discharge spectrometer. The results of the chemical composition analysis for gray cast iron are presented in Table 3 and for ductile iron in Table 4. The content of individual elements is given as mass percentage (% wt.) in all tables and figures.
An analysis of the chemical composition of the produced grey cast iron shows that the carbon content varied in the range of 2.84–3.46% C, while the silicon content ranged from 1.90 to 2.24% Si. All the produced cast irons are hypoeutectic. The phosphorus and sulfur content in the cast iron melted without pig iron was lower than in the melts based on pig iron (the only exception is the 8_GCI melt, where crushed foundry coke was experimentally used for carburizing), in which a significant increase in the content of these elements was observed.
The chemical composition of the ductile iron presented in Table 4 shows that it is possible to produce high-quality cast iron using only steel scrap as the charge material. A carbon content in the range of 3.55–3.80% C was achieved solely by introducing a carburizer into the solid charge. The low manganese content in melt 8PI_DI (based on pig iron) indicates that a ferritic matrix can be obtained in this melt. Analysis of sulfur and phosphorus content reveals that when melting ductile iron based on steel scrap, the levels of these elements are significantly lower.
The study also included melts with an increasing share of pig iron in the charge. The total charge mass was 12 kg, with the pig iron content ranging from 0% to 50%. The carburizer, in the form of synthetic graphite (carbon content 99.25%), was added to the solid charge, while FeSi75 was introduced onto the surface of the molten metal after melting. The results of the chemical analysis are presented in Table 5.
Analysis of the chemical composition of the melted gray cast iron shows that the carbon content ranged from 3.27 to 3.56% C, while the silicon content varied between 1.99 and 3.06% Si. It can be concluded that cast iron with different chemical compositions can be produced by adjusting the element ratios. This indicates that achieving cast iron with a specific carbon content is not problematic.

3.2. Microstructure

For some of these melts, samples were cut, polished, and microstructure images were taken. The results are presented in Figure 2, Figure 3, Figure 4, Figure 5, Figure 6, Figure 7, Figure 8, Figure 9, Figure 10 and Figure 11.
Upon analyzing the microstructures of the melted gray cast iron, it should be stated that no significant differences were observed between the cast iron melted without pig iron and that with its addition (10PI_GCI).
Similarly, in the case of spheroidal cast iron, no differences were observed in the graphite precipitates. Differences can be noticed in the matrix on the etched polished sections. For cast iron melted based on steel scrap, a pearlitic structure with small areas of ferrite was obtained, whereas for cast iron melted with pig iron, a ferritic–pearlitic structure is present. This results from the lower manganese content in the 9PI_DI melt.

3.3. Cooling Curve Analysis

It is widely acknowledged that the analysis of the cooling curve and its derivative is a simple and highly effective method. It is used to assess the quality of molten metals and their alloys both in research units and in foundries. One of the key advantages of it is the short time required to obtain data about the tested material—approximately 240 s to determine critical parameters of the liquid alloy. The metal is poured into standard test cups [13,20,21]. The most well-known systems include ITACA [22] and ATAS [23].
During measurement, the cooling and crystallization curves are recorded. The crystallization curve is the first derivative of the cooling curve, automatically calculated in parallel with the temperature measurement. This curve reflects the crystallization process of the analyzed alloy. In general, the temperature plateaus observed on the cooling curve result from internal heat sources. This is because the tested metal sample continuously releases heat to the surroundings. A temperature plateau indicates that heat is being released inside the metal (e.g., from crystallization), and a temporary temperature rise on the cooling curve reflects a highly intense heat release.
The lowest temperature reached on the cooling curve before the next increase is referred to as the undercooling temperature. All of these phenomena illustrate the progress of the crystallization process. The values of the key parameters mentioned above are presented in the Table 6, Table 7 and Table 8.
As previously mentioned, the most important parameter indicating alloy quality is the minimum eutectic temperature. For cast iron, this temperature should not be lower than 1135 °C [20]. A value that is too low is often obtained when the oxygen content or the number of nuclei is too low. In all melts, values above 1144 °C were obtained. Therefore, it can be stated that eliminating pig iron from the charge did not cause a decrease in Temin and consequently did not worsen the metallurgical quality. Good alloy quality results from the short melting time and the addition of FeSi at the final stage on the surface of the liquid metal. The liquidus temperature for gray cast iron should, according to recommendations, be in the range of 1170–1230 °C [10,18,19,20]. This was achieved in all melts except 1_GCI. The required recalescence value was achieved in only three melts. If it is too low, graphite expansion may be too weak to compensate for the initial shrinkage of the liquid. In the others, it is lower, even in the melt containing pig iron. The solidus temperature for gray cast iron should, according to recommendations, be in the range of 1100–1125 °C [10,18,19,20]. If the value is too low, it may indicate the presence of certain phases with low solidification temperatures.
In the case of ductile iron, the recommended values for these parameters are as follows: a liquidus temperature between 1140 and 1160 °C, the minimum eutectic temperature—as previously—should be higher than 1135 °C, the solidus temperature should range from 1090 to 1115 °C, and recalescence should be within 2–4 °C. It can be observed that these parameters deviate from the recommended ranges. Exceeding these limits occurred in both melts without pig iron and those containing pig iron.
This situation results from the fact that the analysis of the cooling curve and its derivative was intentionally carried out immediately after the spheroidization process, which temporarily deteriorates the graphite-forming potential of the cast iron. It is standard practice to follow spheroidization with a modification treatment, which significantly improves the metallurgical quality of the alloy.
In these melts, it can also be observed that the elimination of pig iron did not cause significant or consistent differences compared to the melts containing pig iron.
Analysis of the obtained results indicates a relationship between the minimum eutectic temperature and the pig iron content in the charge (Figure 12). However, it should be emphasized that even in melt GCI_0PI (without pig iron), the minimum eutectic temperature significantly exceeds 1135 °C. This means that even in this case, the cast iron produced is of good quality.
For these melts, tensile strength (Rm) and hardness (HB) measurements were carried out. The obtained results are presented in the Figure 13.
Analyzing the obtained test results, it can be stated that with an increase in the pig iron content in the charge, both tensile strength and hardness decrease. This is most likely due to the decreasing manganese content in the alloy. This results from the low manganese content in the pig iron and its high content in the steel scrap.
In the cast iron melting process, the alloy treatment plays a crucial role. Inoculation of cast iron refers to the addition of FeSi-based compounds containing elements such as Ca, Ba, Bi, or Ce into the molten metal. These elements serve as graphite nucleants because they are poorly soluble in liquid cast iron. This treatment allows control over the microstructure and properties of the alloy by minimizing undercooling during the eutectic transformation.
The effectiveness of the inoculation increases with the alloy’s tendency to undercool—that is, the fewer active graphite nucleation sites it initially contains. Inoculation helps achieve uniform graphite particle size throughout the casting volume and reduces structural heterogeneity caused by elemental segregation. As a result, isotropy in properties such as tensile strength, elongation, hardness, and machinability can be obtained.
The inoculation process improves both the mechanical and plastic properties of the cast iron by refining its structure. The newly introduced nucleation sites become points at which the solidification and growth of stable eutectic graphite + austenite structures begin. The action of the inoculant is immediate upon its introduction but diminishes over time. The rate of fading depends on the temperature of the metal, the cooling rate until solidification is complete, and the composition of the inoculant. The effect of inoculation declines most rapidly during the first few minutes after addition—after 5 min, approximately 50% of its effectiveness is lost.
Therefore, every effort should be made to pour the mold as quickly as possible. The inoculant is typically added in an amount of 0.1–0.5% of the metal’s mass. The results of secondary inoculation tests for ductile iron, aimed at determining the impact of inoculation on the quality of the produced alloy, are presented below in Table 9 [17].
The results of these studies clearly show that the inoculation process significantly improves the quality of the produced cast iron. The Temin temperature, which prior to inoculation did not indicate good graphite nucleation and suggested the risk of chill formation, exceeded the 1135 °C threshold by a wide margin after inoculation. This reinforces the notion that the inoculation process becomes essential even when producing cast iron based on pig iron.
The significant decrease in graphite nucleation potential may be caused by factors such as excessively long melting and holding times in the furnace, an excessively high superheating temperature, or prolonged holding time in the ladle during pouring.

4. Conclusions

The conducted research and its results demonstrated that it is possible to produce good-quality gray and ductile cast iron without the use of pig iron in the charge. The studies showed that in order to achieve high metallurgical quality of the molten cast iron, it is essential to ensure the proper quality of charge materials as well as accuracy and repeatability in their dosing. It is also necessary to maintain a short melting and holding time in both the furnace and the ladle.
If the cast iron parameters fall below the required levels, a modification process should be applied. However, such quick and flexible corrective action is only possible if the foundry is equipped with a cooling curve and its derivative analysis system, which allows for alloy evaluation within a very short time, approximately 240 s. This enables the implementation of an optimization algorithm to improve metal quality while it is still in the liquid state.
Based on the preliminary studies conducted with varying pig iron content in the charge, the following conclusions can be drawn:
  • It is possible to produce good-quality gray and ductile cast iron without the use of pig iron in the charge;
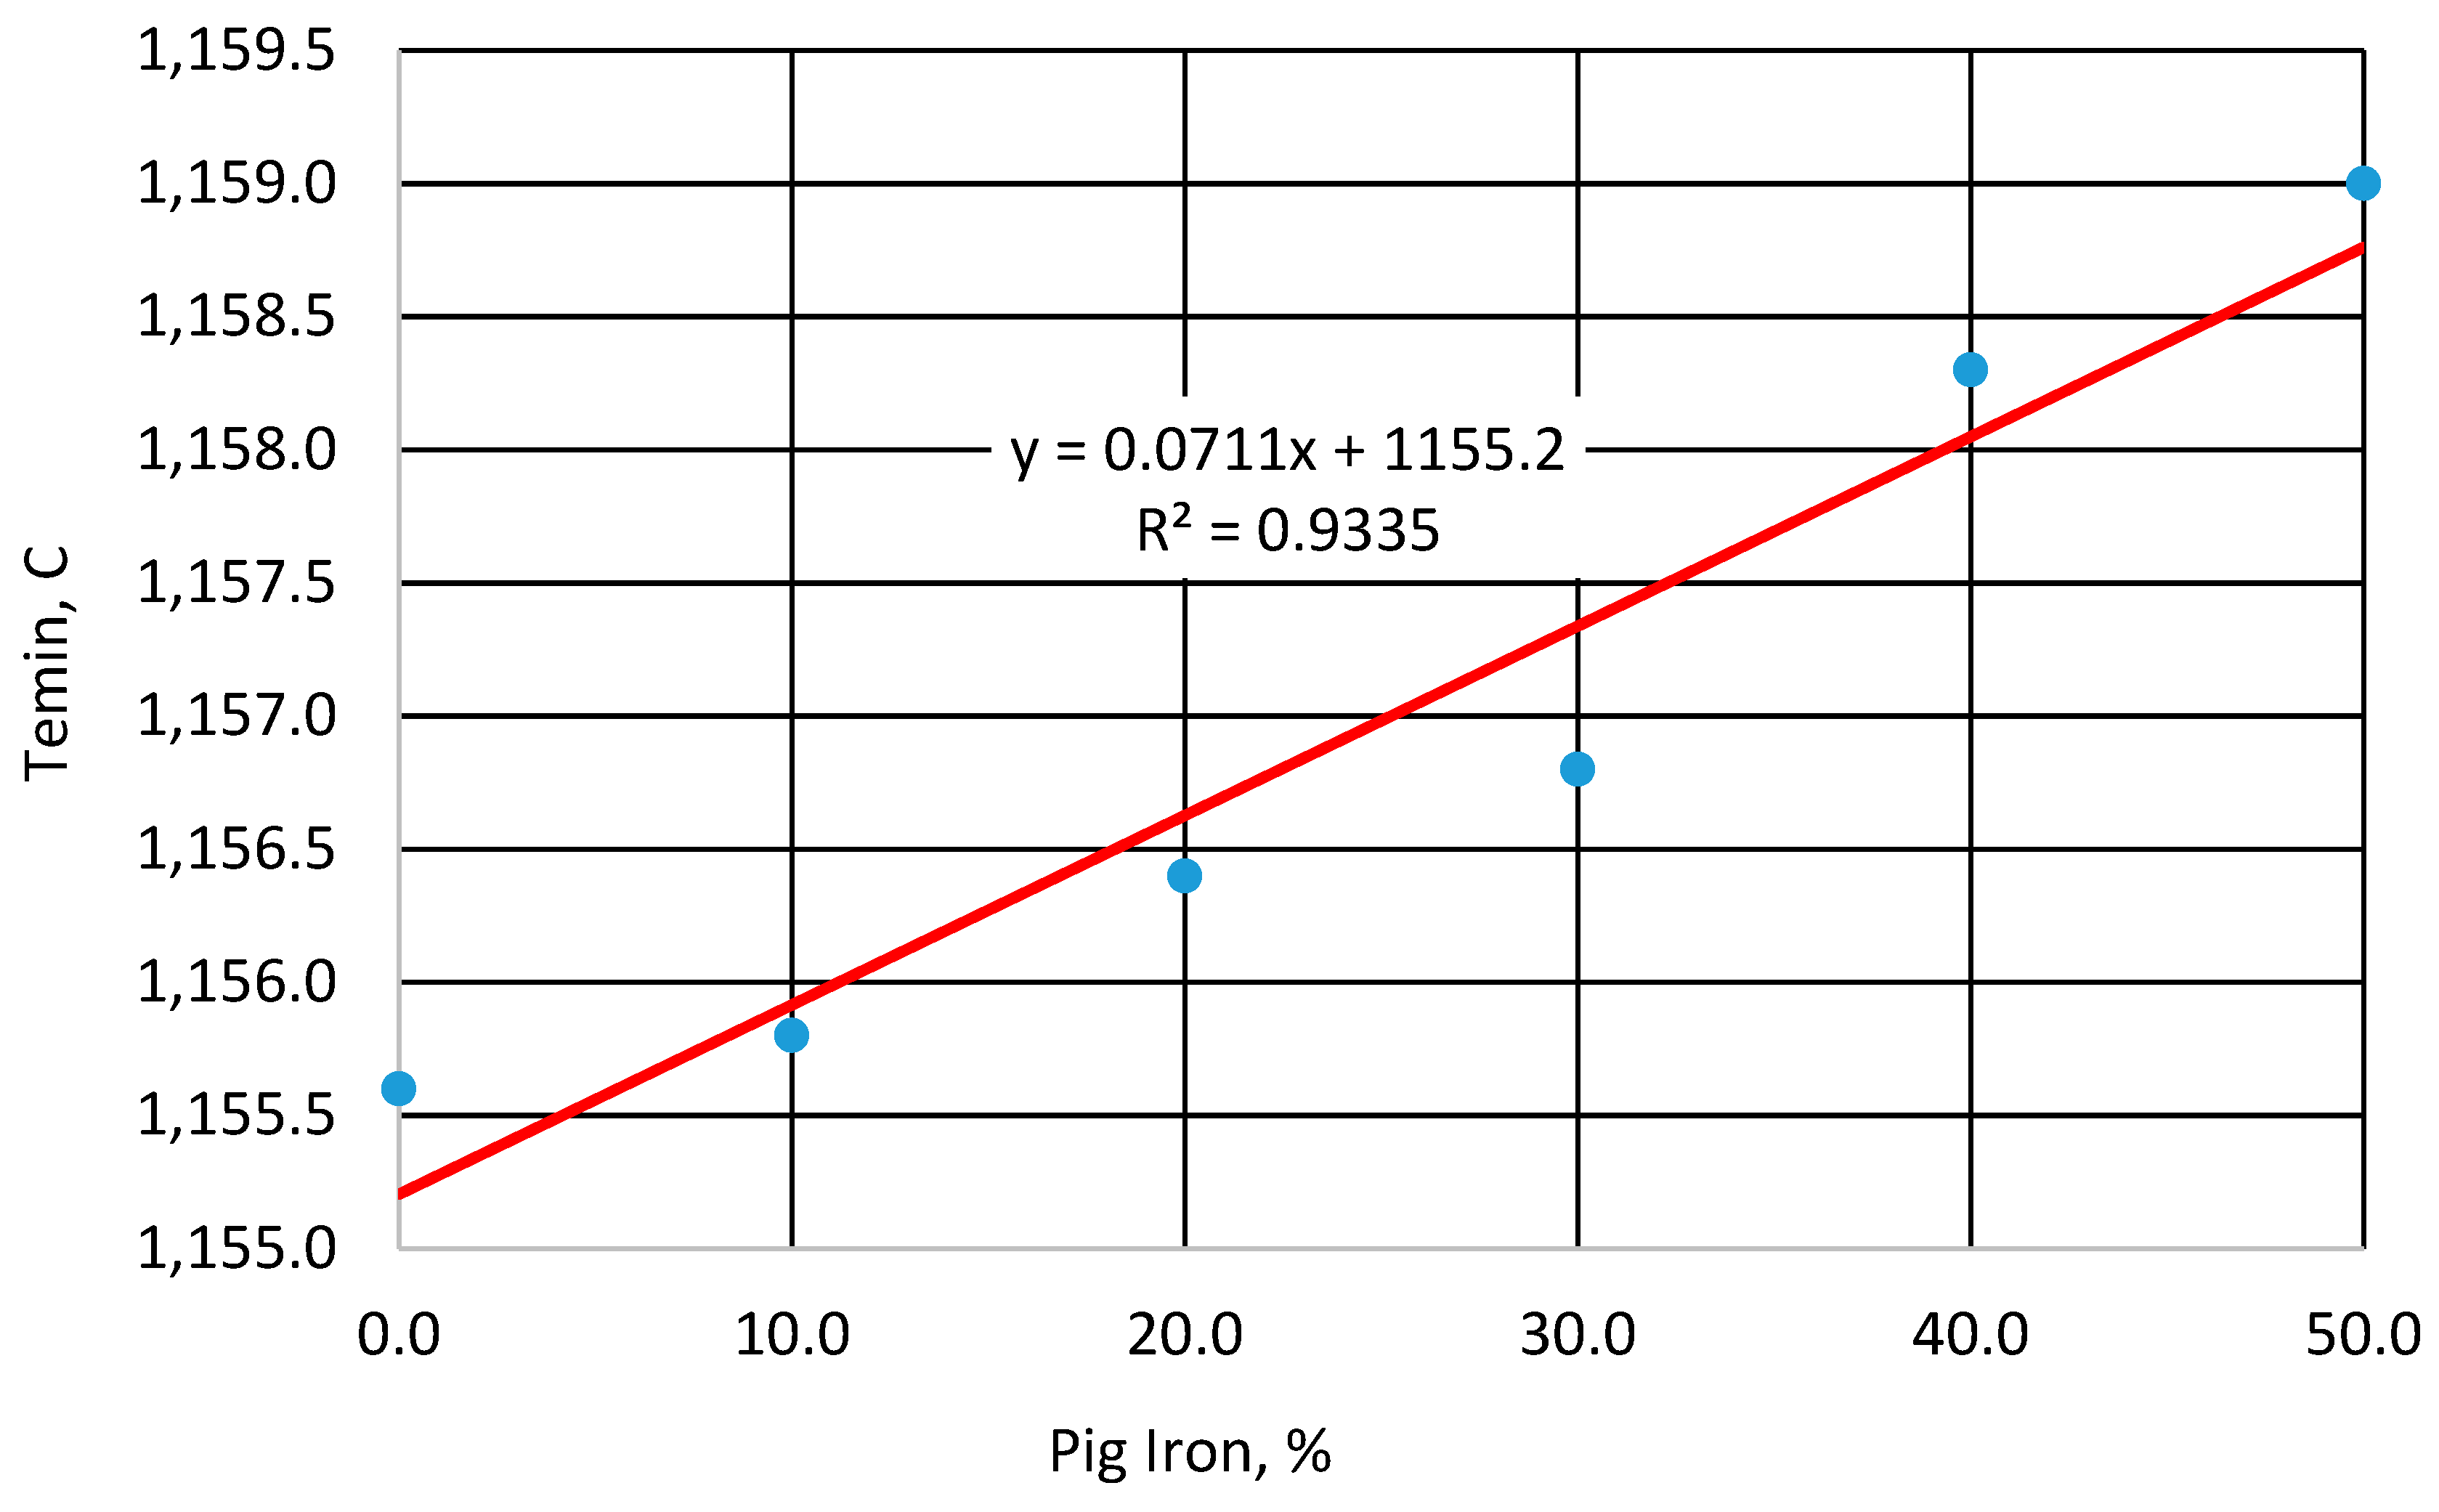
  • Regardless of the applied charge composition, high values of the minimum eutectic transformation temperature (Temin > 1135 °C is necessary) are achieved for unmodified cast iron for the temperature range from 115.6 °C to 1159 °C, indicating a sufficient level of graphite nucleation. An increase in pig iron content from 0 to 50% led to a rise in Temin of only 4.3 °C, which allows for a reduction in the amount of inoculant needed to ensure solidification in the stable Fe–C system;
  • The modification process allows an increase in the Temin temperature in the range of 18–26 °C;
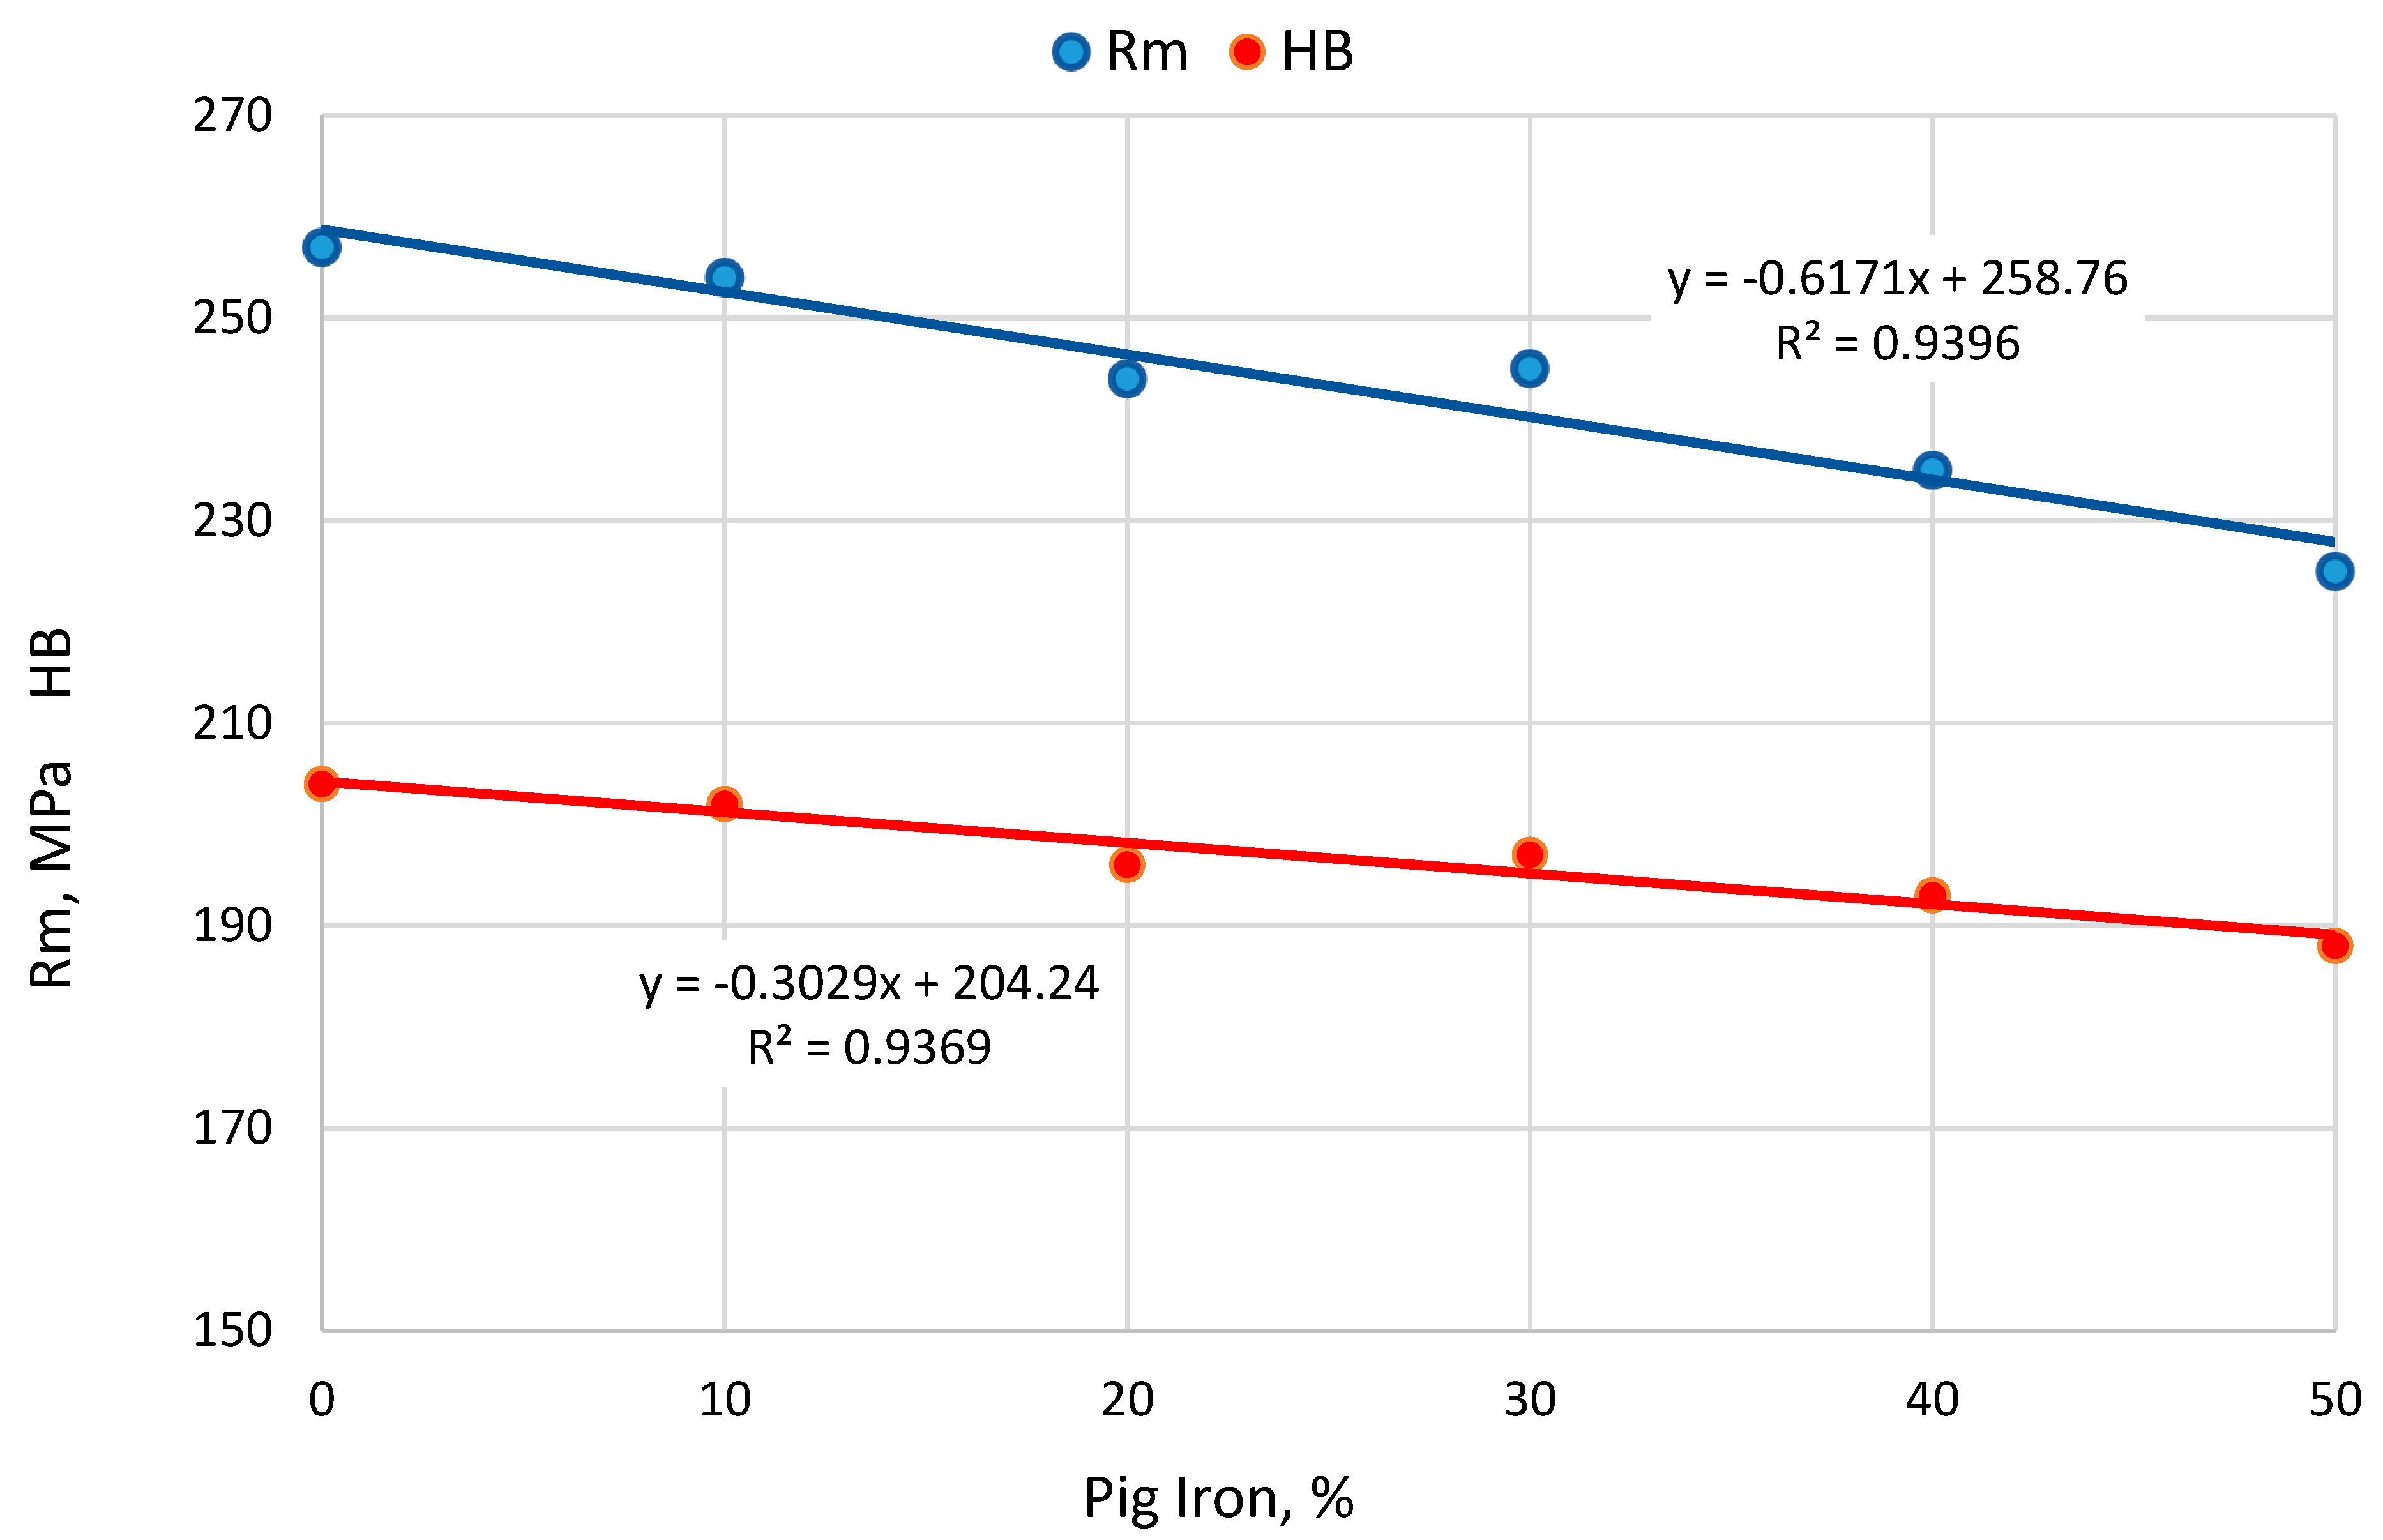
  • Increasing the pig iron content in the charge from 0 to 50% causes a decrease in tensile strength and HB hardness by approximately 10%. This most likely results from a reduction in the Mn content in the alloy, which is due to the lower Mn content in pig iron compared to steel scrap.

Author Contributions

Conceptualization, K.J.; methodology, K.J. and J.J.; formal analysis, K.J. and J.J.; investigation, K.J.; resources, K.J. and J.J.; data curation, K.J.; writing—original draft preparation, K.J.; writing—review and editing, J.J. All authors have read and agreed to the published version of the manuscript.

Funding

This research received no external funding.

Data Availability Statement

The original contributions presented in this study are included in the article. Further inquiries can be directed to the corresponding author(s).

Conflicts of Interest

The authors declare no conflicts of interest.

References

  1. Dwulat, R.; Janerka, K.; Grzesiak, K. Influence of Charge Materials on the Metallurgical Quality of Gray Cast Iron. Arch. Foundry Eng. 2023, 23, 66–71. [Google Scholar] [CrossRef]
  2. Dwulat, R.; Janerka, K. Evaluation of the metallurgical quality of nodular cast iron in the production conditions of a foundry. J. Manuf. Mater. Process. 2023, 7, 18. [Google Scholar] [CrossRef]
  3. Riposan, I.; Chisamera, M.; Stan, S. Enhanced Quality in Electric Melt Grey Cast Irons. ISIJ Int. 2013, 53, 1683–1695. [Google Scholar] [CrossRef]
  4. Riposan, I.; Chisamera, M.; Stan, S. Performance of heavy ductile iron castings for windmills. China Foundry 2010, 7, 163–170. [Google Scholar]
  5. Futas, P.; Pribulova, A.; Petrik, J.; Blasko, P.; Junakova, A.; Sabik, V. Metallurgical Quality of Cast Iron Made from Steel Scrap and Possibilities of Its Improvement. Metals 2023, 13, 27. [Google Scholar] [CrossRef]
  6. Futas, P.; Pribulova, A.; Fedorko, G.; Molnar, V. Influence of Steel Scrap in the Charge on the Properties of Gray Cast Iron. ISIJ Int. 2017, 57, 374–379. [Google Scholar] [CrossRef]
  7. Hiratsuka, S.; Horie, H.; Kowata, T.; Koike, K.; Shimizu, K. Influence of Steel Scrap on Microstructure and Mechanical Properties of Spheroidal Graphite Cast Iron. Mater. Trans. 2003, 44, 1419–1424. [Google Scholar] [CrossRef]
  8. Karsay, S.I. Ductile Iron I, Production: The State of the Art; Quebec Iron and Titanium Corporation: Quebec City, QC, Canada, 1976. [Google Scholar]
  9. Chişamera, M.; Ripoşan, I.; Stan, S.; Ecob, C.; Grasmo, G.; Wilkinson, D. Preconditioning of Electrically Melted Grey Cast Irons. U.P.B. Sci. Bull. Ser. B 2009, 71, 115–126. [Google Scholar]
  10. Stan, S.; Chisamera, M.; Riposan, I.; Barstow, M. Application of thermal analysis to monitor the quality of hypoeutectic cast irons during solidification in sand and metal moulds. J. Therm. Anal. Calorim. 2012, 110, 1185–1192. [Google Scholar] [CrossRef]
  11. Riposan, I.; Chisamera, M.; Stan, S. Application of cooling curve analysis in solidification pattern and structure control of grey cast irons. J. Therm. Anal. Calorim. 2018, 132, 1017–1028. [Google Scholar] [CrossRef]
  12. Cojocaru, A.M.; Riposan, I.; Stan, S. Solidification influence in the control of inoculation effects in ductile cast irons by thermal analysis. J. Therm. Anal. Calorim. 2019, 138, 2131–2143. [Google Scholar] [CrossRef]
  13. Stefanescu, D.M.; Suarez, R.; Kim, S.B. 90 years of thermal analysis as a control tool in the melting of cast iron. China Foundry 2020, 17, 69–84. [Google Scholar] [CrossRef]
  14. Chisamera, M.; Riposan, I.; Stan, S.; Stefan, E.; Costache, G. Thermal analysis control of in-mould and ladle inoculated grey cast irons. China Foundry 2015, 6, 145–151. [Google Scholar]
  15. Erturka, S.O.; Kumruoglub, L.C.; Ozel, A. Determination of Feederless Casting Limits by Thermal Analysis in Cast Iron. Acta Phys. Pol. Ser. A 2017, 131, 370–373. [Google Scholar] [CrossRef]
  16. Seidu, S.O. Thermal Analysis of Preconditioned Ductile Cast Iron. Int. J. Curr. Eng. Technol. 2013, 3, 813–818. [Google Scholar]
  17. Kołakowski, J.; Brzeżański, M.; Burdzy, D.; Sobieraj, J.; Urbanowicz, M.; Paruch, T.; Janerka, K. The effect of successive stages of the melting process on the nucleation of ductile cast iron. Arch. Foundry Eng. 2023, 23, 61–67. [Google Scholar] [CrossRef]
  18. Stefan, E.; Riposan, I.; Chisamera, M. Application of thermal analysis in solidification pattern control of La-inoculated grey cast irons. J. Therm. Anal. Calorim. 2019, 138, 2491–2503. [Google Scholar] [CrossRef]
  19. Seidu, S.O.; Riposan, I. Thermal analysis of inoculated ductile irons. U.P.B. Sci. Bull. Ser. B 2011, 73, 241–254. [Google Scholar]
  20. Chisamera, M.; Stan, S.; Riposan, I.; Stefan, E.; Costache, G. Thermal analysis of inoculated grey cast irons. Ann. “Dunarea de Jos” Univ. Galati. Fascicle IX. Metall. Mater. Sci. 2008, 2, 11–16. [Google Scholar]
  21. Stefanescu, D.M. Analysis of the rationale and accuracy of the use of carbon Equivalent and thermal analysis in the quality control of cast iron. Int. J. Met. 2022, 16, 1057–1078. [Google Scholar] [CrossRef]
  22. Available online: http://www.proservicetech.it/itacax-thermal-analysis-final-iron-quality-control (accessed on 14 March 2025).
  23. Available online: https://www.novacast.se/product/atas/ (accessed on 17 March 2025).
Figure 1. Typical graph of the cooling curve and its derivative with the characteristic points.
Crystals 15 00614 g001
Figure 2. Microstructure of 2_GCI iron.
Crystals 15 00614 g002
Figure 3. Microstructure of 3_GCI iron.
Crystals 15 00614 g003
Figure 4. Microstructure of 4_GCI iron.
Crystals 15 00614 g004
Figure 5. Microstructure of 7_GCI iron.
Crystals 15 00614 g005
Figure 6. Microstructure of 8_GCI iron.
Crystals 15 00614 g006
Figure 7. Microstructure of 10PI_GCI iron.
Crystals 15 00614 g007
Figure 8. Microstructure of 1_DI iron.
Crystals 15 00614 g008
Figure 9. Microstructure of 9PI_DI iron.
Crystals 15 00614 g009
Figure 10. Microstructure of 1_DI iron, etched in 3% nital.
Crystals 15 00614 g010
Figure 11. Microstructure of 9PI_DI iron, etched in 3% nital.
Crystals 15 00614 g011
Figure 12. Effect of pig iron content in the charge on the minimum eutectic temperature.
Crystals 15 00614 g012
Figure 13. Dependence of tensile strength and hardness on pig iron content.
Crystals 15 00614 g013
Table 1. Charge materials composition in the grey iron melts.
Melt No.Steel Scrap kgPig Iron
kg
Recarburizer
g
FeSi75
g
1_GCI10.37-376350
2_GCI11.47-520290
3_GCI14.15-522421
4_GCI11.59-440300
5_GCI10.04-370350
6_GCI10.32-385350
7_GCI14.12-522415
8_GCI11.57-450300
9_GCI11.43-460300
10PI_GCI2.959.41-260
Table 2. Charge materials composition in the ductile iron melts.
Melt No.Steel Scrap
kg
Pig Iron
kg
Recarburizer
g
FeSi75
g
1_DI10.0-400372
2_DI9.8-400275
3_DI9.6-400275
4_DI10.2-400276
5_DI10.2-460276
6_DI10.3-465270
7_DI10.0-520265
8PI_DI1.5010-281
Table 3. Grey cast iron chemical analysis.
Melt No.C
%
Si
%
Mn
%
P
%
S
%
1_GCI2.842.140.490.0350.031
2_GCI3.551.900.560.0250.020
3_GCI3.262.240.400.0330.017
4_GCI3.301.960.460.0330.024
5_GCI3.462.130.480.0260.024
6_GCI3.162.140.480.0220.032
7_GCI3.342.120.370.0290.028
8_GCI3.341.960.480.0430.047
9_GCI3.251.970.510.0220.021
10PI_GCI3.341.980.330.0450.035
Table 4. Ductile iron chemical analysis.
Melt No.C
%
Si
%
Mn
%
P
%
S
%
1_DI3.593.170.460.0170.004
2_DI3.682.880.480.0180.006
3_DI3.792.720.390.0070.006
4_DI3.802.550.540.0200.001
5_DI3.552.530.470.0180.002
6_DI3.752.400.540.0150.009
7_DI3.742.311.080.0420.018
8PI_DI3.623.200.100.0410.009
Table 5. Results of the chemical composition analysis of samples from individual melts.
Melt No.CSiMnPS
GCI1_0PI3.272.250.8540.0300.022
GCI2_10PI3.483.060.7340.0360.019
GCI3_20PI3.382.120.7320.0350.022
GCI4_30PI3.322.360.6950.0340.011
GCI5_40PI3.531.810.6410.0460.022
GCI6_50PI3.561.990.5970.0460.021
Table 6. Thermal-derivative analysis parameters for gray cast iron.
Melt No.Tliquidus °CTemin °CTemax °CTsolidus °CRec °C
1_GCI1235.41144.51148.51103.74.0
2_GCI1198.51147.61148.51094.40.9
3_GCI1192.31156.21157.01099.40.8
4_GCI1200.51156.61157.11112.20.5
5_GCI1204.81150.91152.81113.71.9
6_GCI1199.01145.51150.61087.55.1
7_GCI1197.01150.81152.71113.71.9
8_GCI1191.71148.31148.51103.60.2
9_GCI1184.11152.91157.31116.34.4
10PI_GCI1203.71150.51153.31107.52.8
Table 7. Cooling curve and its derivative parameters for ductile iron.
Melt No.Tliquidus °CTemin
°C
Temax
°C
Tsolidus
°C
Rec
°C
1_DI1149.71133.11143.41080.910.3
2_DI1148.11115.81123.21069.27.4
3_DI1152.11124.41129.21092.44.8
4_DI1160.41133.41141.31094.27.9
5_DI1186.71124.61128.41095.43.8
6_DI1144.61129.71143.11086.713.4
7_DI1159.31133.21139.41098.66.2
8PI_DI1142.41133.11145.61084.512.5
Table 8. Cooling curve and its derivative parameters for gray cast iron with different proportions of pig iron in the charge.
Melt No.Tliquidus °CTemin °CTemax °CTsolidus °CRec °C
GCI1_0PI1203.01155.61158.81121.23.2
GCI2_10PI1183.91155.81158.21125.32.4
GCI3_20PI1192.21156.41158.91114.62.5
GCI4_30PI1161.01156.81158.81119.42.0
GCI5_40PI1164.21158.31164.71122.44.4
GCI6_50PI1177.91159.01161.41125.52.4
Table 9. Cooling curve and its derivative analysis results for various inoculants.
InoculantTemin [°C]Tsolidus [°C]Rec [°C]
No inoculation112510849.9
FeSi-based inoculant114310957.1
Ce-based inoculant114911035.6
Ba-based inoculant114410987.4
Bi-based inoculant115111003.8
Disclaimer/Publisher’s Note: The statements, opinions and data contained in all publications are solely those of the individual author(s) and contributor(s) and not of MDPI and/or the editor(s). MDPI and/or the editor(s) disclaim responsibility for any injury to people or property resulting from any ideas, methods, instructions or products referred to in the content.

