1. Introduction
5G communication technology represents the primary development trajectory among communication technologies, encompassing next-generation mobile communication and the Internet of Things, thereby exhibiting significant strategic importance in both military and civilian science and technology. In comparison to 3G/4G communications, 5G communication base stations impose a multitude of novel requirements on devices and materials. These requirements necessitate broader bandwidth to support enhanced data rates and reduced latency. Consequently, devices and materials must possess faster signal transmission speeds and exhibit lower signal distortion to accommodate the demand for high-speed and stable data transmission. The adoption of large-scale array antenna technology in 5G communication base stations is primarily motivated by the aim to achieve superior signal coverage, higher data rates, and diminished latency [
1,
2,
3,
4,
5,
6,
7,
8,
9].
In recent years, microwave dielectric ceramics have garnered significant attention owing to their distinctive properties, prompting numerous scholars to engage in extensive research within this domain [
1,
2,
3,
4,
5,
6,
7,
8,
9,
10,
11,
12,
13,
14]. In terms of preparation methods, traditional high-temperature sintering of microwave dielectric ceramics is not only costly but also prone to abnormal grain growth or phase transitions, which can degrade dielectric properties. The high-temperature requirements impose significant demands on equipment and limit the precise fabrication of ceramics with complex geometries. Cold sintering technology offers a promising solution by enabling ceramic densification at low temperatures, combining energy efficiency with superior performance. For instance, Gu et al. [
1] fabricated Mg
3B
2O
6 ceramics via cold sintering (150 °C, 800 MPa, 90 min), achieving a density of 91% after post-annealing at 900 °C, with
εr = 5.15,
Q ×
f = 16,686 GHz, and
τf = −48.45 ppm/°C. The cold sintering process preserves appropriate grain size and prevents structural damage, facilitating a uniform microstructure and outstanding dielectric properties. Tian et al. [
2] discovered that the LiLn(PO
3)
4 ceramic system exhibited exceptional performance at low sintering temperatures (ranging from 910 °C to 925 °C). Specifically, it demonstrated a high quality factor of 41,607–75,968 GHz, a low temperature coefficient of resonant frequency varying between −19.64 and −47.49 ppm/°C, a low permittivity within the range of 5.04 to 5.26, and a low density of 3.04–3.26 g/cm
3. Bao et al. [
3] made a discovery: when x = 0.08 and sintered at 700 °C, optimal microwave dielectric properties of the Nd
2(Zr
1−xTi
x)
3(MoO
4)
9 ceramics were obtained, including
εr = 10.94,
Q ×
f = 82,525 GHz (at 9.62 GHz), and
τf = −12.99 ppm/°C. Due to the very low polarizability of boron (B) ions (0.05 Å), which renders them a crucial component in microwave dielectric ceramics (MWDCs) with low permittivity [
15,
16,
17], borate ceramics are promising candidates for 5G communication applications, exhibiting excellent microwave dielectric properties and requiring lower sintering temperatures. Concurrently, their relatively low sintering temperature has facilitated their application in low-temperature co-fired ceramic (LTCC) technology. Li et al. [
18] effectively lowered the sintering temperature of Zn
3B
2O
6 (ZBO) ceramics through a combined approach of cold sintering and post-annealing, enabling densification at 200 °C, significantly below conventional sintering temperatures. In the investigation, preliminary microwave properties of pre-densified ZBO ceramics (relative density of 92%), featuring
εr = 5.05,
Q ×
f = 6353 GHz, and
τf = −69.51 ppm/°C, were obtained via CSP using acetic acid as the liquid phase at 200 °C for 60 min under 300 MPa. Subsequent annealing at 550 °C significantly enhanced the microwave dielectric properties, yielding ZBO ceramics with a relative density exceeding 95%,
εr = 5.95,
Q ×
f = 20,620 GHz, and
τf = −67 ppm/°C. This process minimizes energy consumption compared to traditional high-temperature solid-phase reactions for microwave dielectric ceramics. Cold sintering utilizes a transient liquid phase and external pressure to accelerate powder densification, thereby enabling the fabrication of high-density ceramic materials within a reduced timeframe. Ding et al. [
4] synthesized dense H
3BO
3 ceramics with a relative density of approximately 97.6% through dry pressing at room temperature under a uniaxial pressure of 384 MPa for 300 s. These H
3BO
3 ceramics demonstrated remarkable microwave dielectric properties:
εr = 2.83,
Q ×
f = 59,400 GHz, and
τf = −91 ppm/°C.
Despite significant progress in the development of microwave dielectric ceramic materials, several challenges remain. Much of the current research has focused on improving dielectric properties by varying the composition and sintering temperature of the material. However, there are still large gaps in the in-depth understanding of the relationship between the lattice dynamics, crystal structure, and dielectric properties of the materials. There is a dearth of literature on the structural properties of Ca3(BO3)2 (CBO) ceramics and their impact on physical properties. This research gap limits the ability of high-performance microwave dielectric ceramic materials to be developed for future communication technologies. Meanwhile, although cold sintering and subsequent annealing techniques have been applied to reduce the sintering temperature, further optimization of these processes remains critical to improving the dielectric properties of ceramics.
The primary objective of this study is to conduct an in-depth analysis of the crystal structure trends of CBO ceramics, specifically from the perspective of lattice dynamics, and to explore its lattice vibrational behavior in detail. Through a thorough investigation of the microstructure, this work aims to elucidate the intrinsic correlation between the crystal structure of CBO ceramics and the macroscopic dielectric properties. Additionally, this study will delve into the influence of pressure on the properties of CBO ceramics, with the goal of further enhancing their dielectric properties via the optimization of the sintering process. Microstrip patch antennas (MPAs), which are essential components in 5G base stations and mobile devices, directly affect the overall efficiency and stability of communication systems. Consequently, the urgent development of advanced microwave dielectric ceramics tailored for 5G applications is required to enhance the performance of MPAs. This study employs CBO ceramic as a dielectric substrate for the design and simulation of MPAs. The primary objective of the simulations is to evaluate the efficacy of CBO ceramic when employed in MPAs, with a particular emphasis on its influence on signal propagation and radiation performance. The results derived from these simulations will serve to validate the capability of CBO ceramic in augmenting the functionality of 5G communication apparatuses, while also laying a robust scientific groundwork for the deployment of advanced high-performance MWDCs in forthcoming technological applications.
3. Results and Discussion
Figure 2 illustrates the X-ray diffraction patterns of CBO ceramics at different pressures (200 MPa to 1000 MPa) after annealing. The exhaustive cell parameter data, refined through the Rietveld method utilizing Topas academic V6 software, are tabulated in
Table 1. This confirms that CBO crystallizes in the trigonal system with space group R-3c (No. 167). The congruency with the ICSD#70-0868 entry in the Crystal Structure Database, coupled with the absence of additional impurity peaks in the X-ray diffractograms, signifies the successful synthesis of a single-phase CBO ceramic. Additionally,
Figure 2 includes a magnified view of the (113) diffraction peak at 2
θ = 30.52°. A notable trend is observed in the diffraction peak (113), shifting towards higher angles as the pressure escalates up to 800 MPa, before reversing direction to lower angles at 1000 MPa. This phenomenon, explained by Bragg’s law (2
dsin
θ = n
λ), signifies alterations in the interplanar spacing. Specifically, the shift towards higher angles correlates with a decrease in interplanar spacing, subsequently leading to a contraction of the cell volume. Evaluation of the cell volume (
Vm) data presented in
Table 1 reveals an initial decline in cell volume with increasing pressure, followed by an upturn. This pattern aligns with the variations observed in the interplanar spacing.
With the evolution of the ceramic crystal structure, the relative density will be changed accordingly, which can be calculated from Equation (1) [
19,
20]:
Z represents the number of molecules within a single cell. Analysis of the data presented in
Table 1 reveals that the relative density of CBO ceramics initially increases and subsequently decreases with the application of higher pressures. This trend aligns with the variation in
Vm, which initially contracts and then expands.
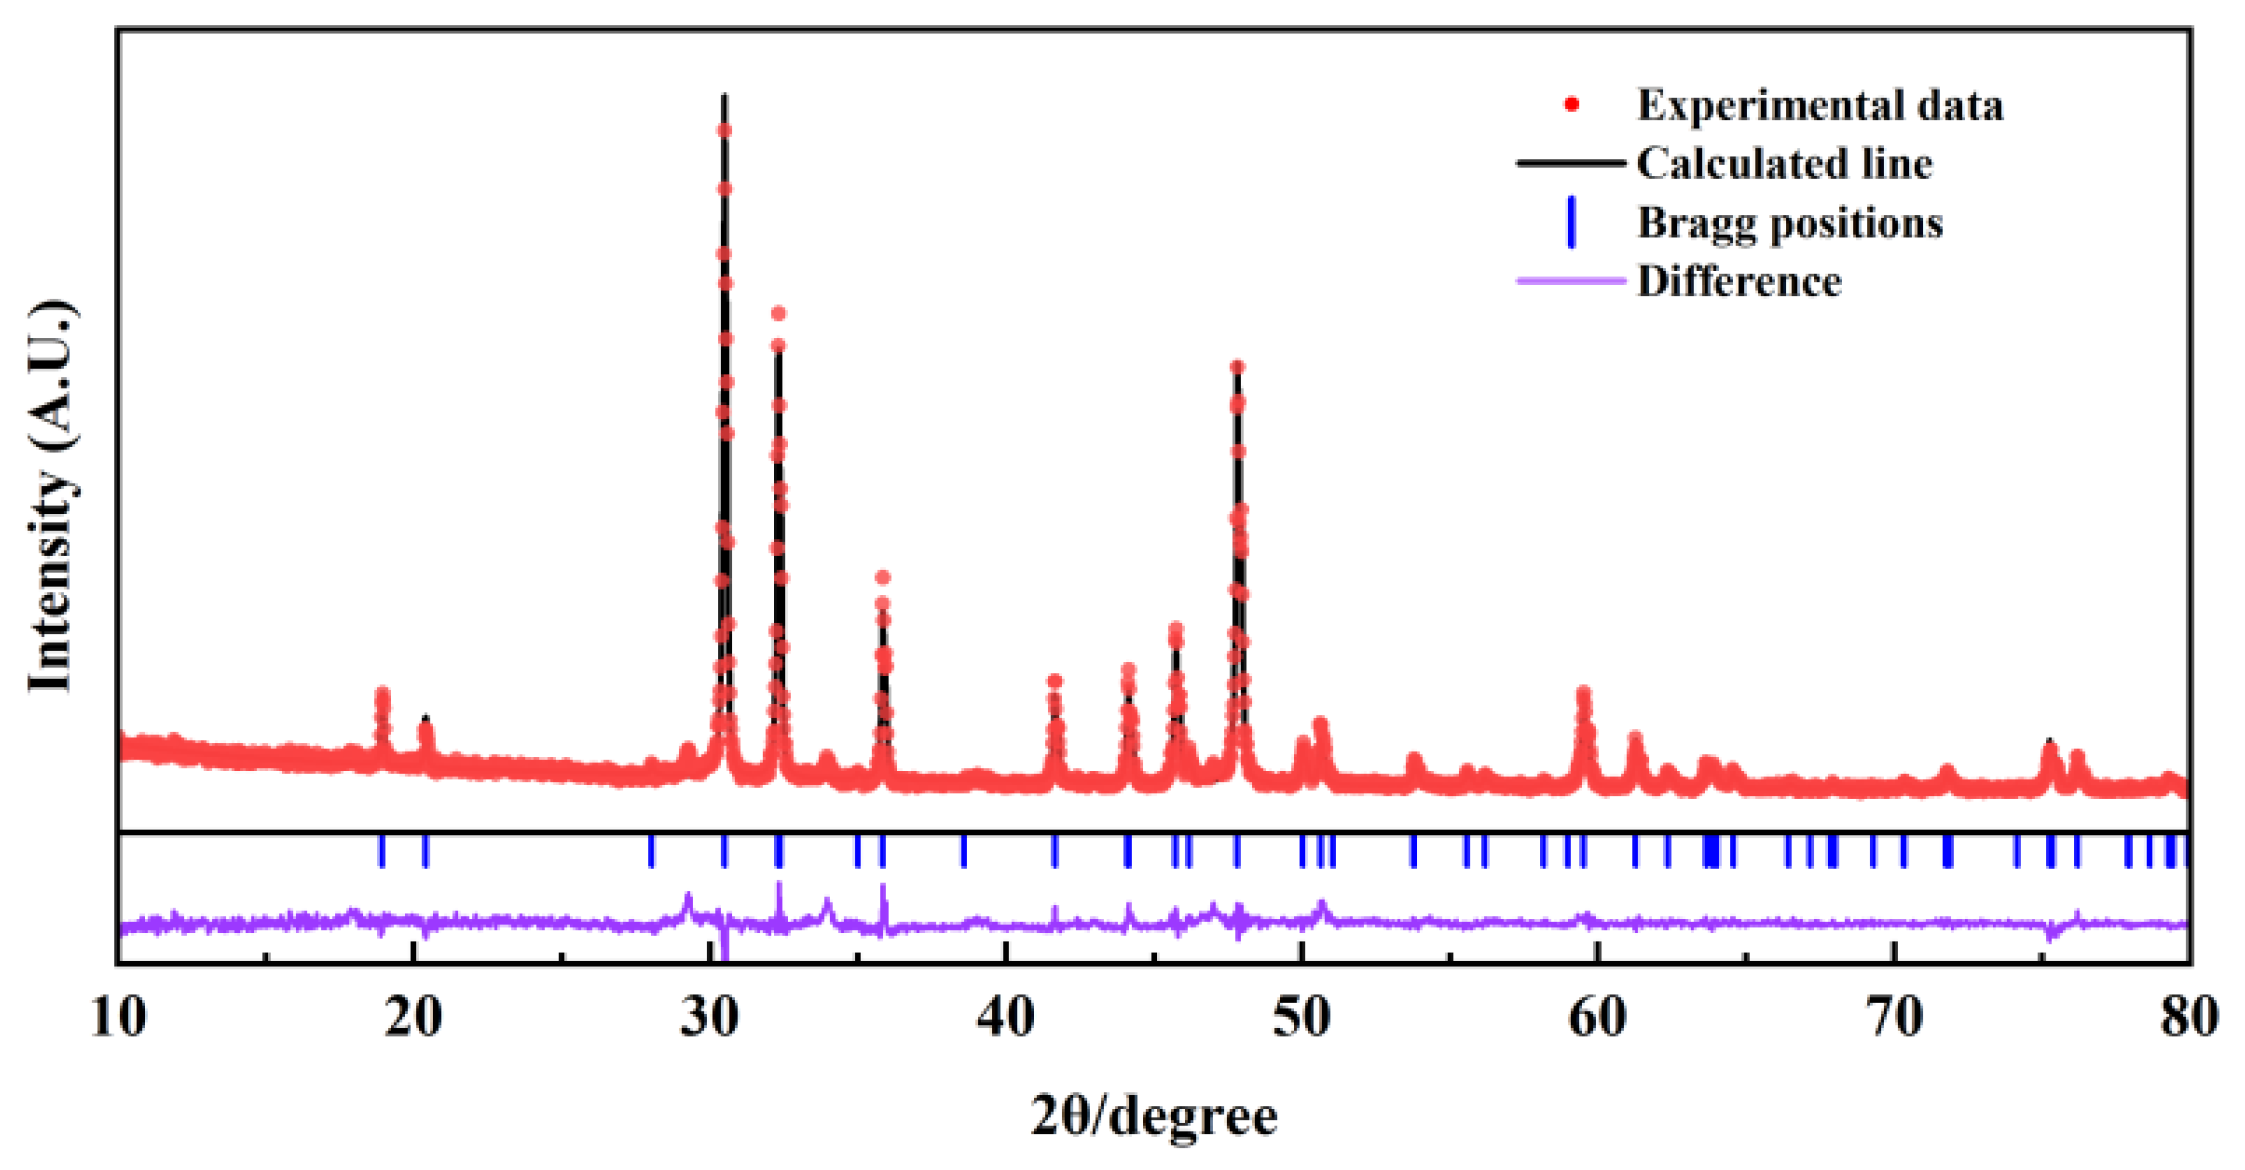
The XRD data pertaining to CBO ceramics underwent a refined Rietveld analysis using Topas academic V6 software, employing the ICSD#70-0868 card from the International Crystal Structure Database as the reference model.
Figure 3 presents the XRD patterns obtained after performing the refined Rietveld analysis under 800 MPa. Within
Figure 3, the experimental data (marked by red circles) show general agreement with the calculated line (depicted as black curves). Furthermore, the residual lines (illustrated by purple curves) demonstrate a smooth trend and low amplitude, reinforcing the precision of the analytical outcomes.
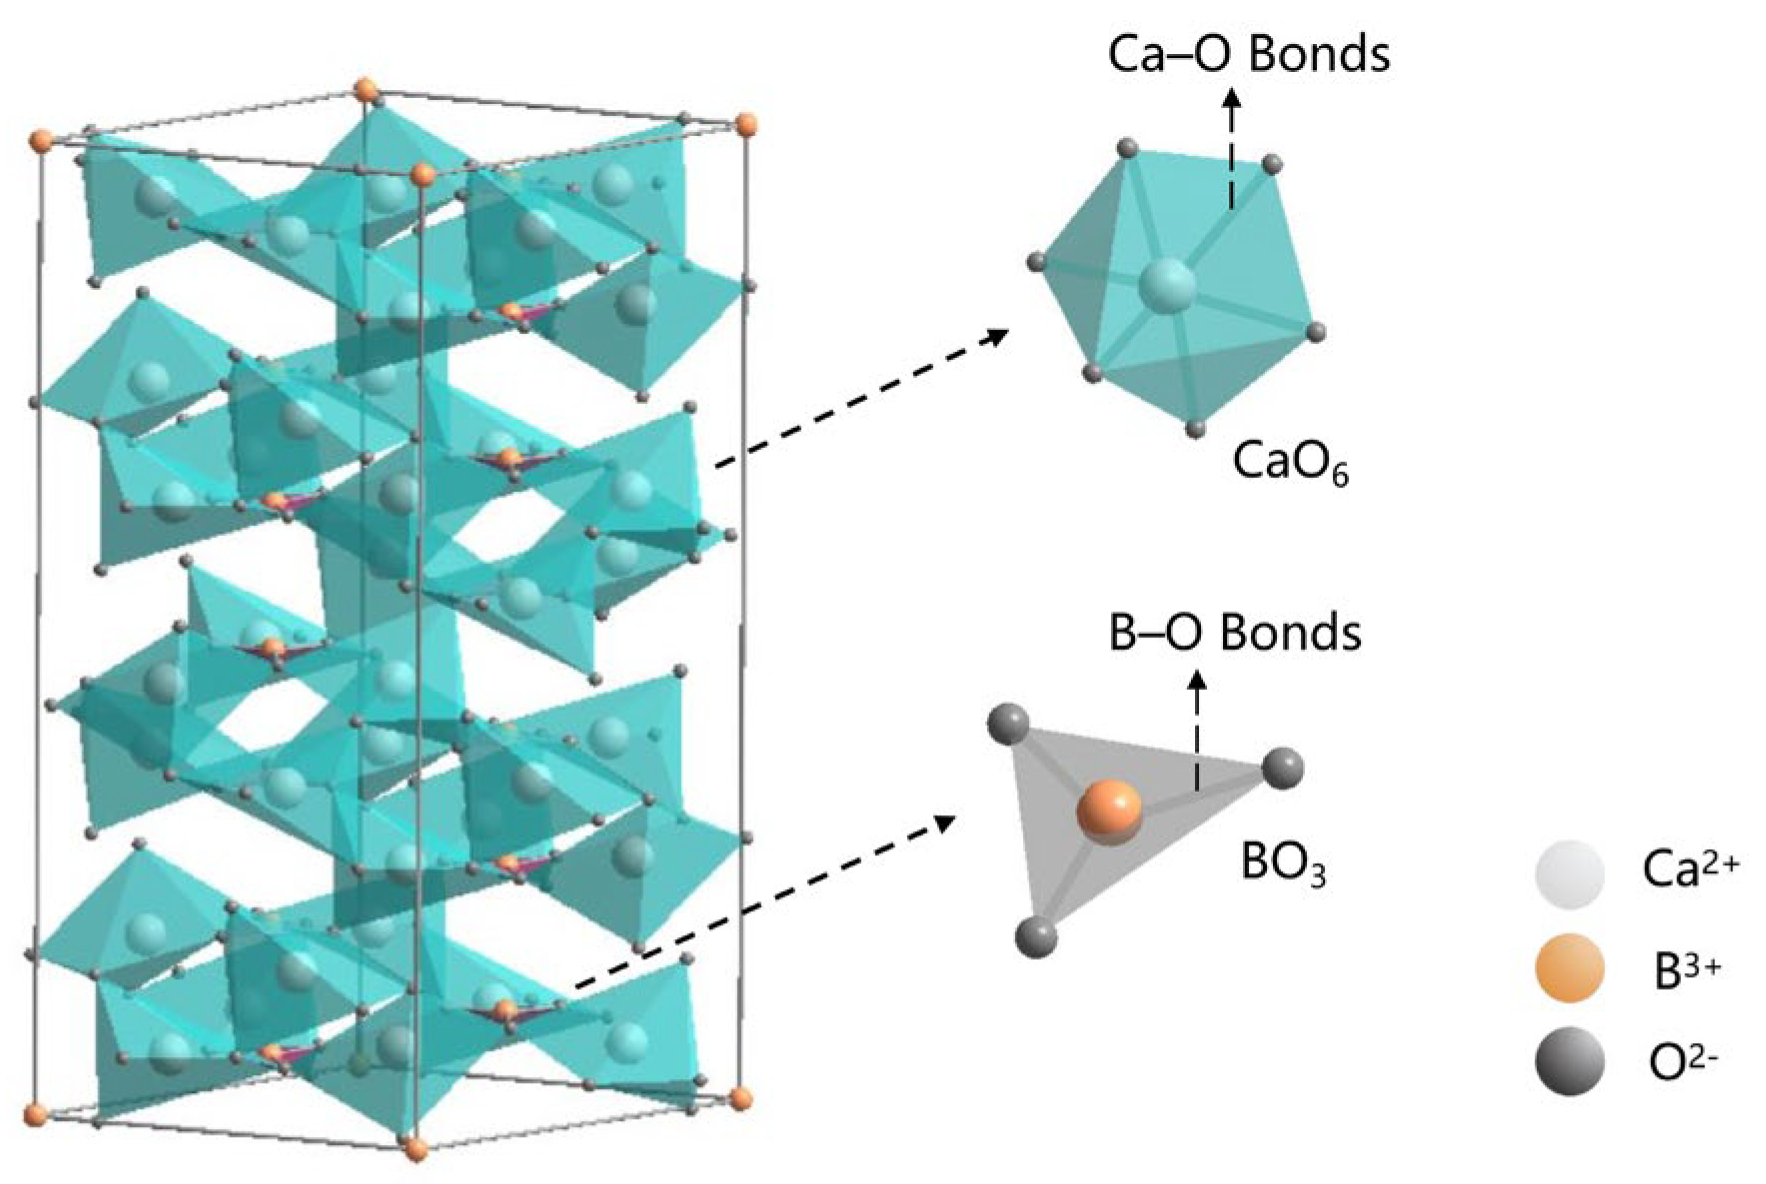
Figure 4 displays the unit cell structure of CBO ceramics, whereas
Table 2 outlines the Wyckoff positions of each atom within the cell, as determined through Rietveld’s refined analysis. Upon inspection of the structural diagram presented in
Figure 4, it becomes evident that each Ca
2+ ion forms an octahedral geometry centered on [CaO
6]. The crystal structure of CBO is remarkable for its distinctive layered arrangement, which comprises alternating stacks of [Ca-O] octahedra and [BO
3] triangular planes. Furthermore, an in-depth analysis of the cell structure reveals that each unit cell encompasses three [Ca-O] octahedral units, interconnected in a specific manner to constitute the framework of the entire crystal. The interlayer connectivity is facilitated by the oxygen atoms positioned at the vertices.
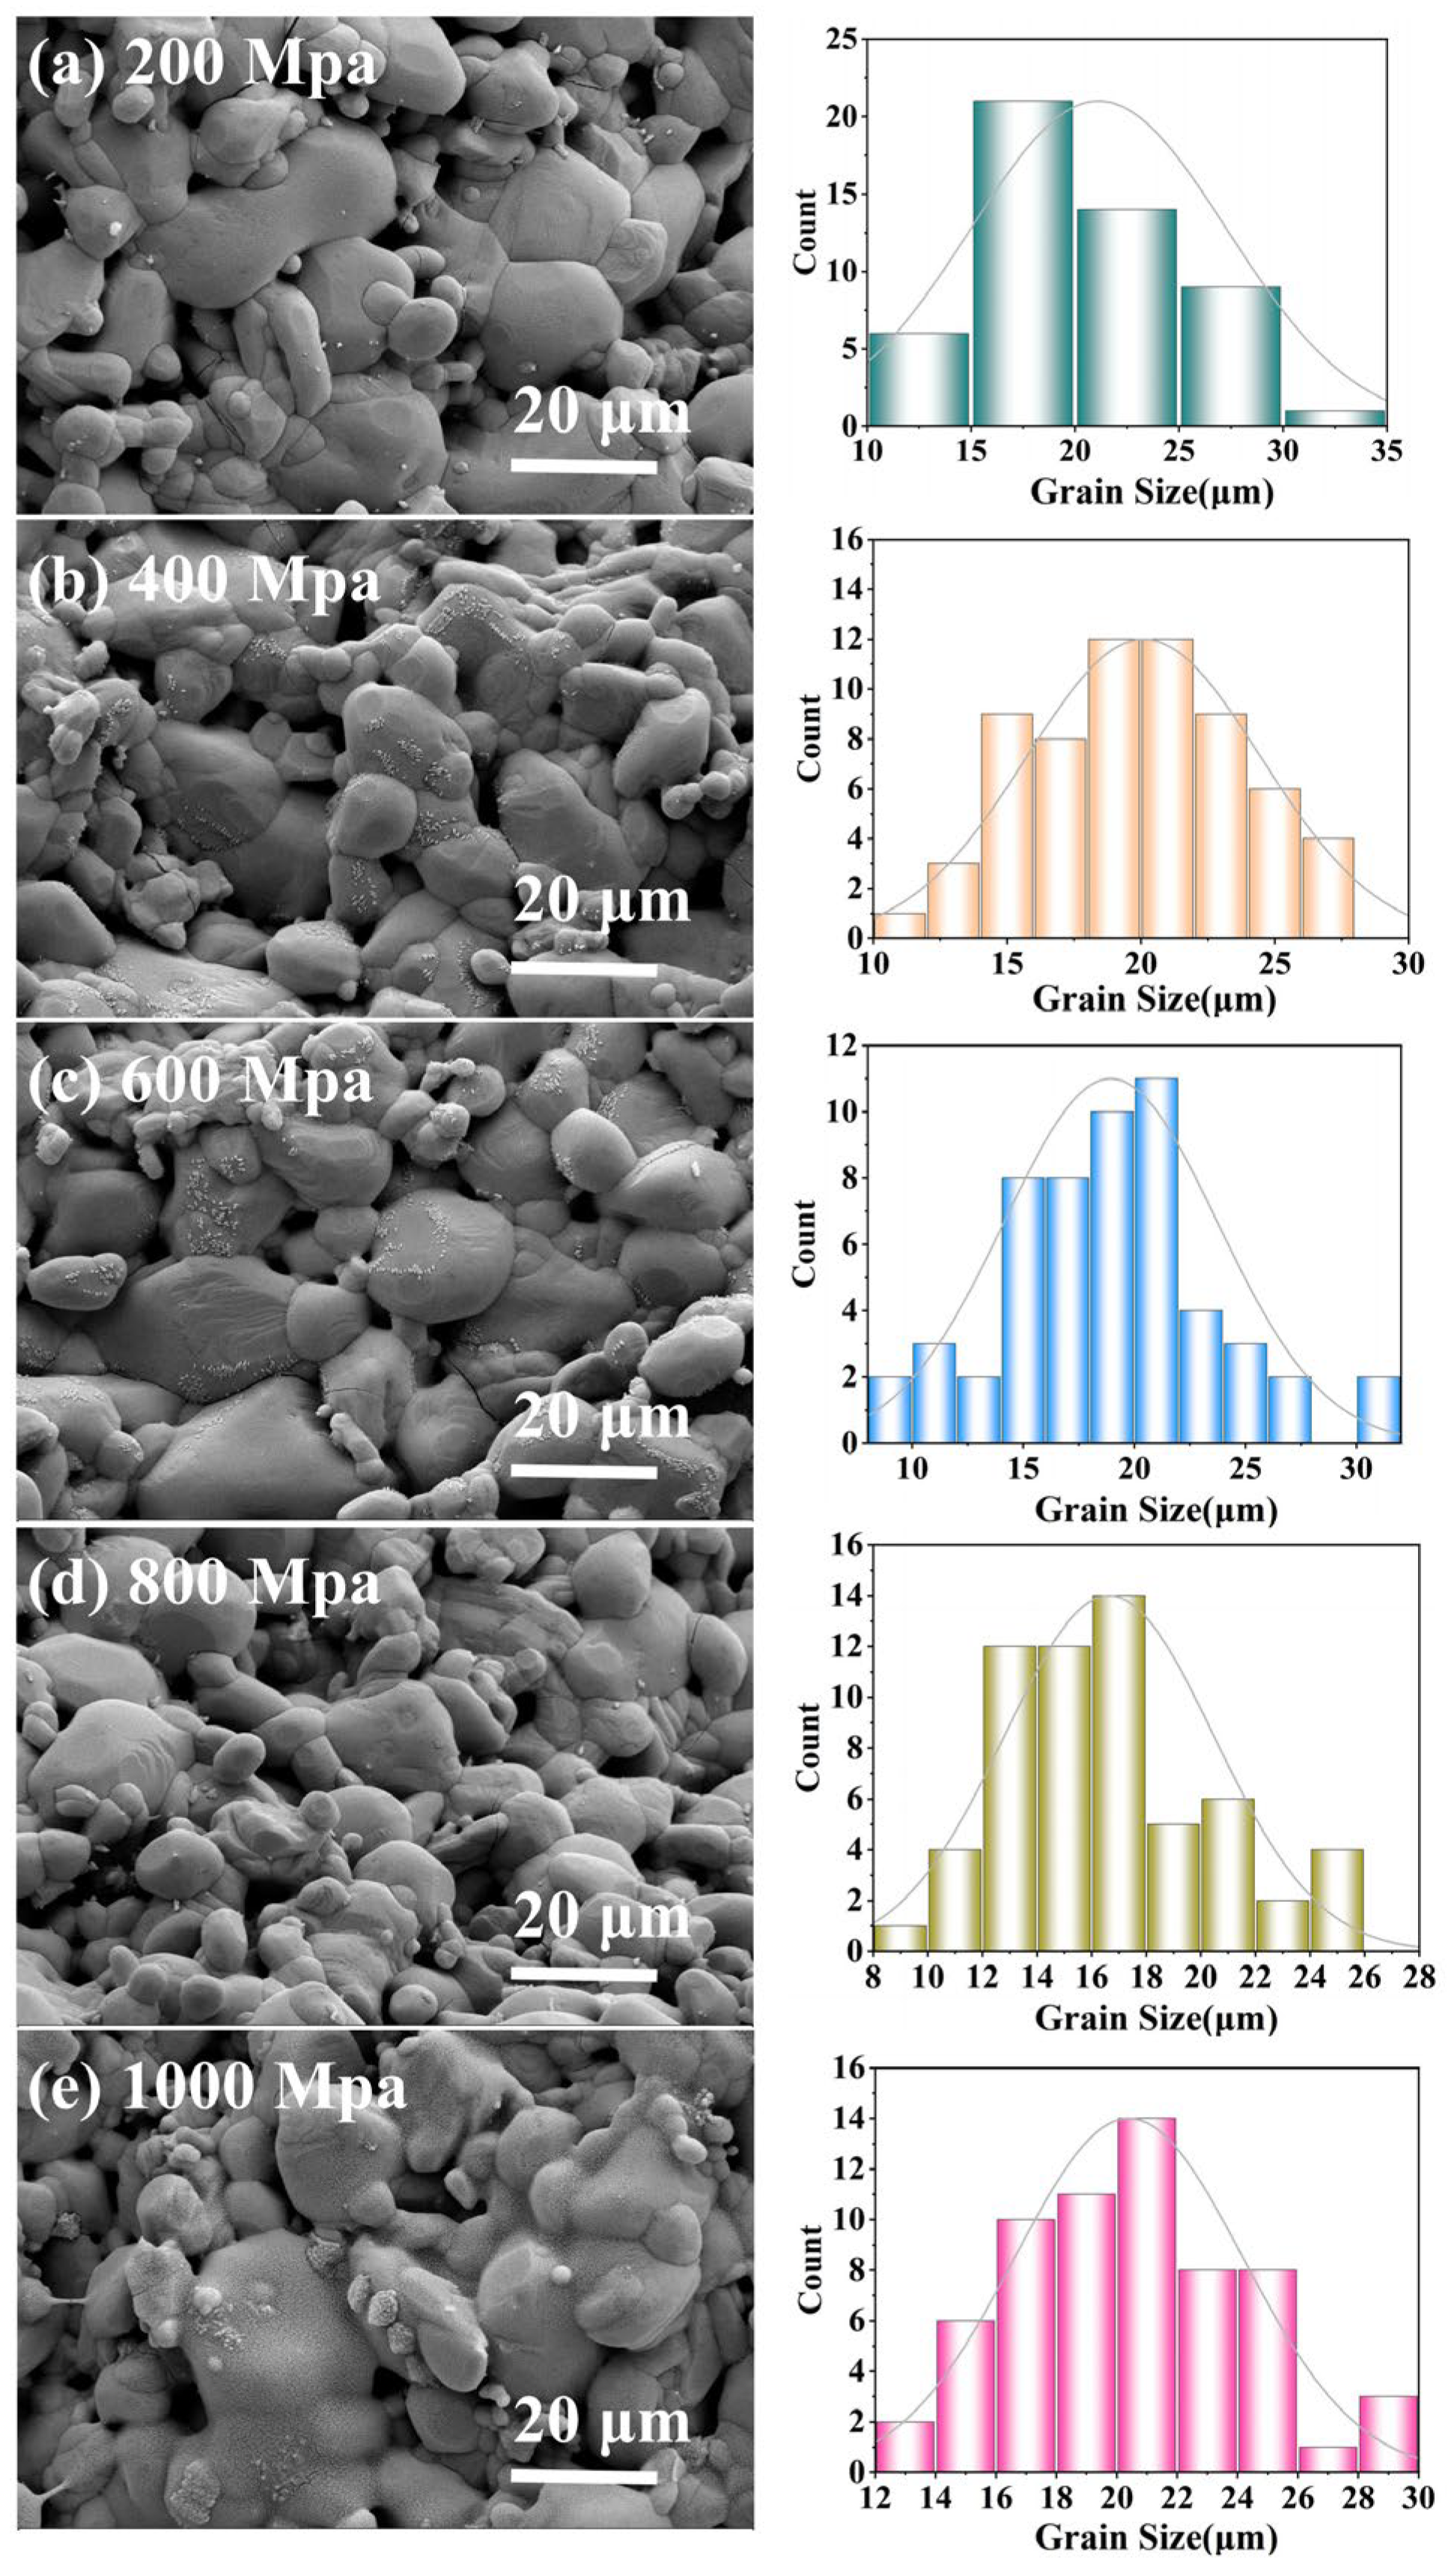
Figure 5 presents SEM images of CBO ceramics. As the pressure increases from 200 MPa to 800 MPa, the images (a) to (d) demonstrate a gradual reduction in pores, refinement and convergence of grains, and enhanced crystallinity. Under 200 MPa, the ceramics exhibit numerous intergranular pores and an uneven grain size distribution, spanning from 10 to 35 μm, with an average grain size of approximately 20.56 μm. Conversely, under 800 MPa, the ceramics display an improved microstructure characterized by a significantly finer grain size ranging from 8 to 26 μm, an average grain size reduced to 14.85 μm, clear grain boundaries, and high density. However, further increasing the pressure to 1000 MPa (as shown in
Figure 5d) results in significant microstructural degradation, specifically manifesting as indistinct grain boundaries, non-uniform grain size distributions, and localized regions of abnormal grain growth. This suggests that exceeding a critical pressure threshold disrupts the initially dense and uniform grain structure, potentially inducing stress concentration within the ceramic. Consequently, grains lose their original regularity and uniformity, grain boundary clarity decreases, and some grains grow abnormally, leading to an uneven grain size distribution. Ultimately, these changes deteriorate the microwave ceramic properties.
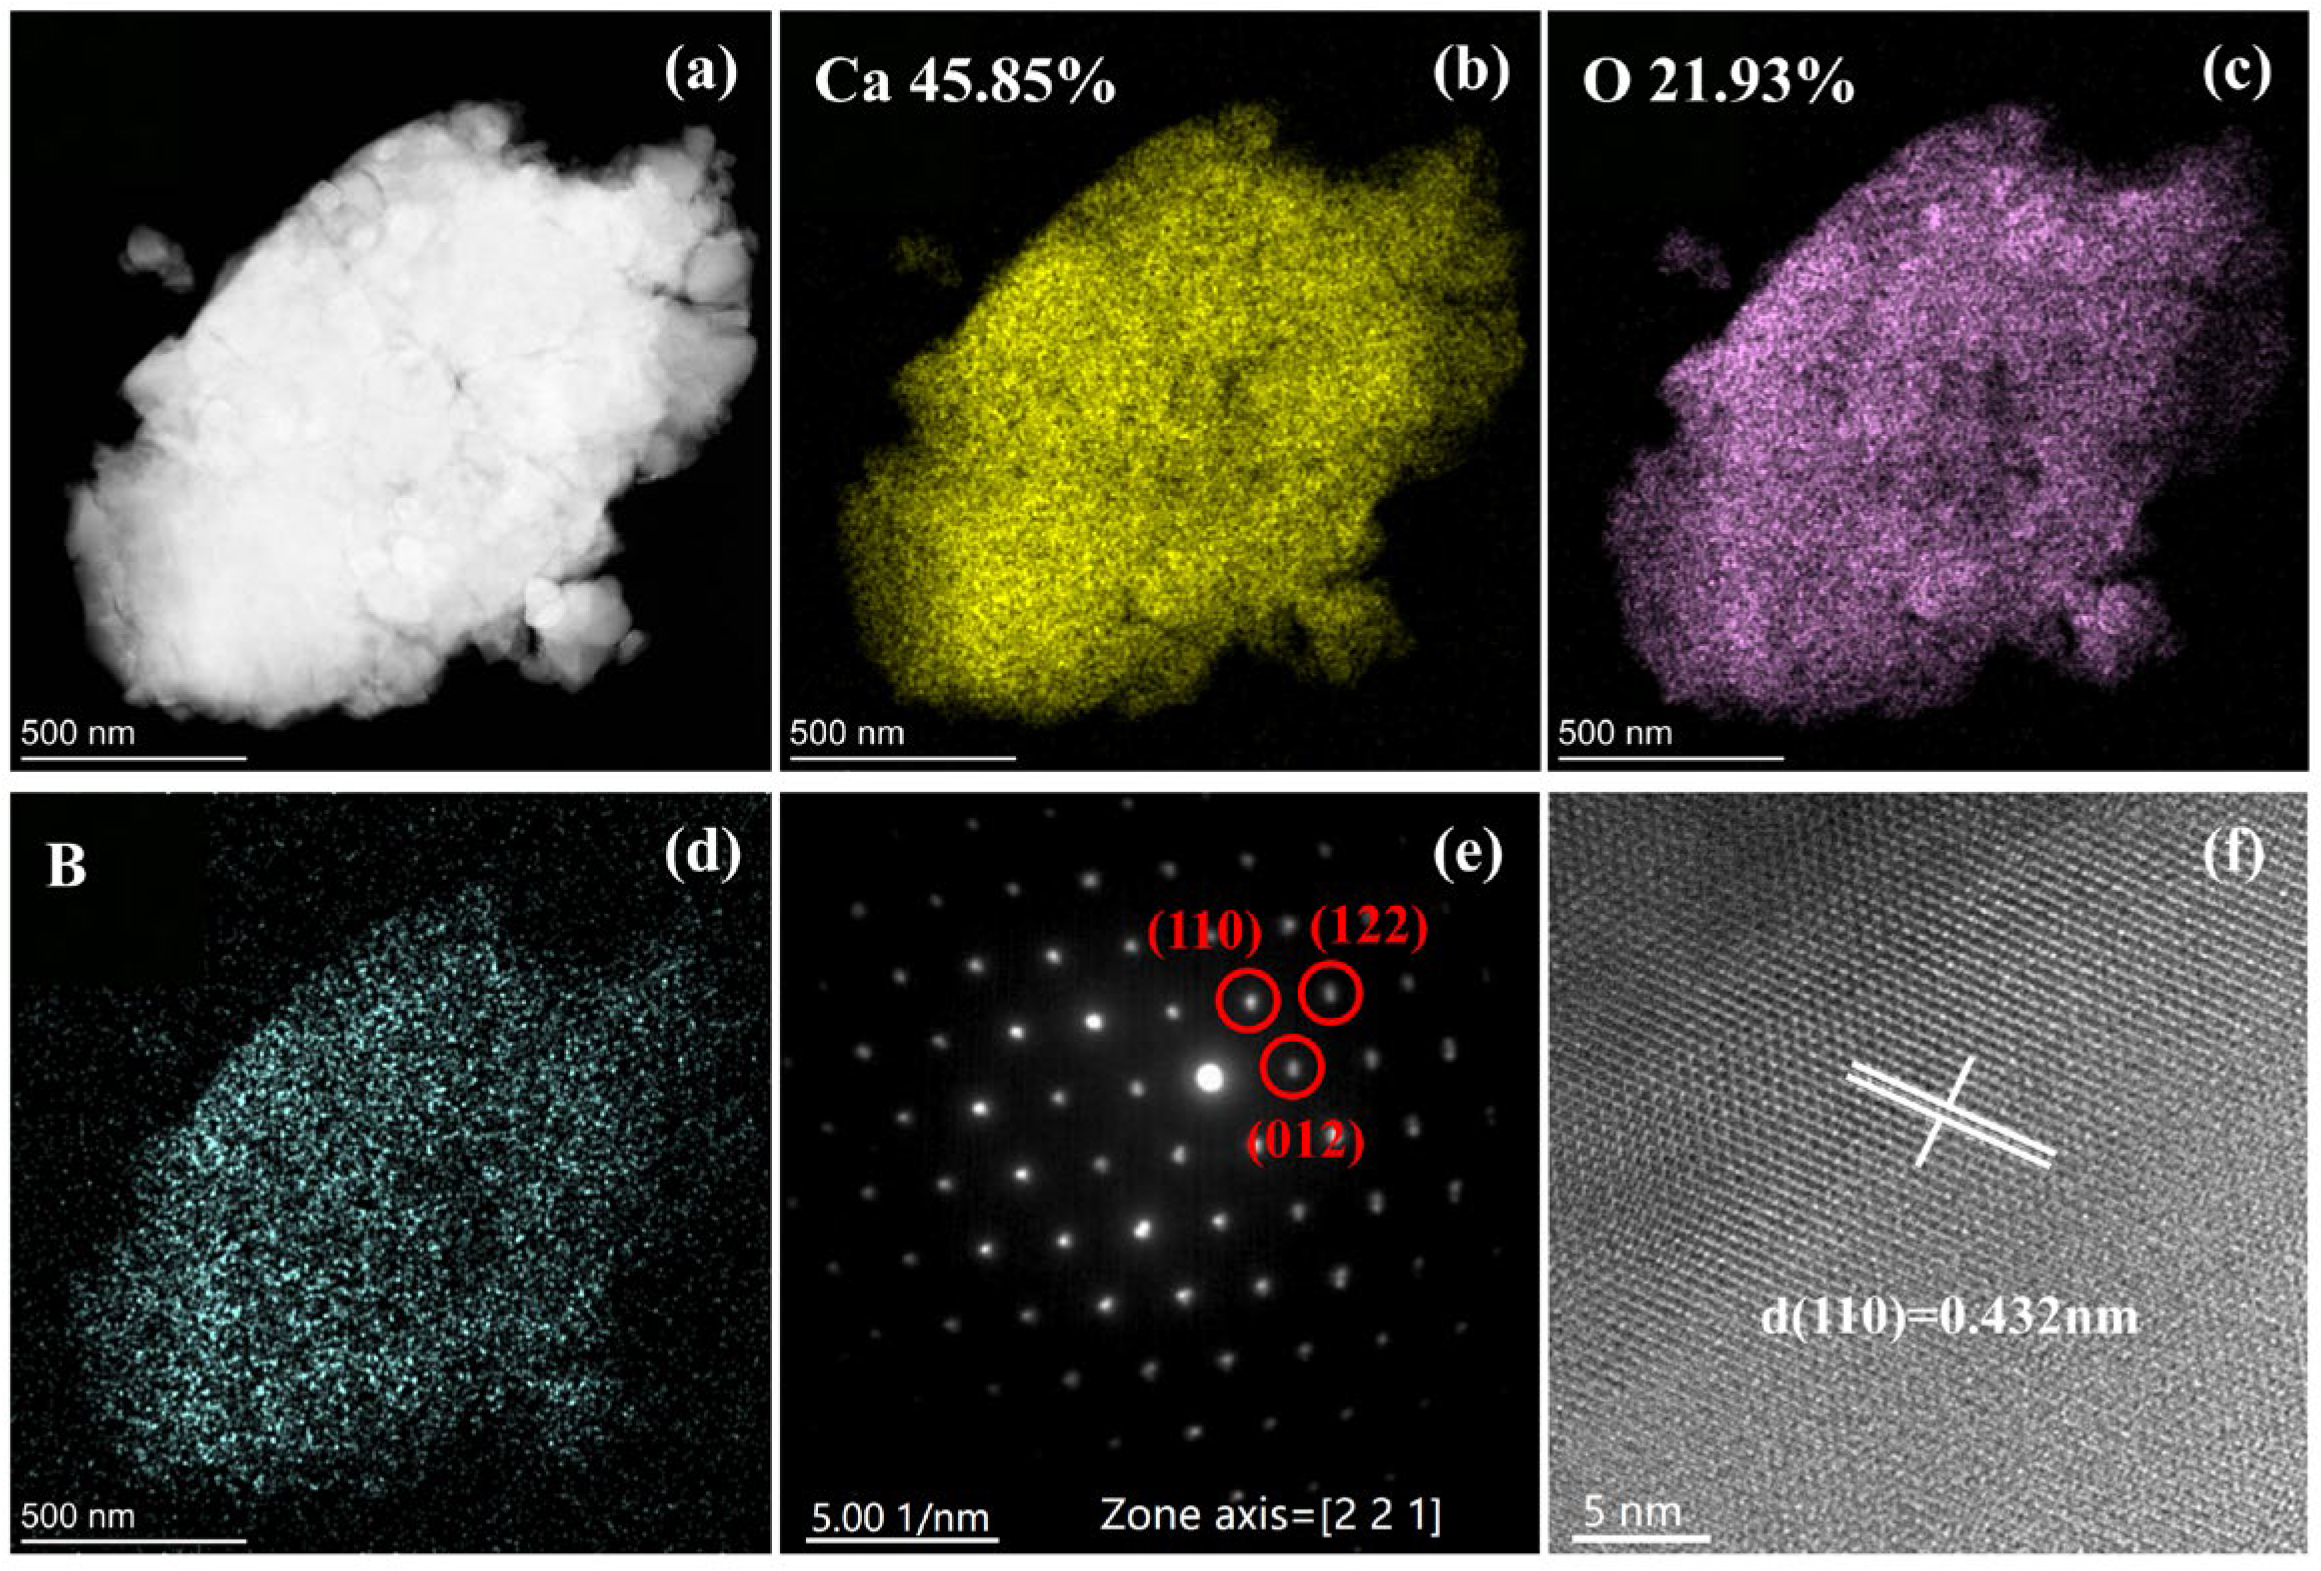
The TEM and EDS analyses of CBO ceramics under 800 MPa are presented in
Figure 6a–c. The percentages of calcium and oxygen atoms are 45.85% and 21.93%, respectively, which closely resemble the theoretical atomic ratio of 2:1. Additionally,
Figure 6e displays a TEM selected area electron diffraction pattern, revealing that the atomic arrangement of CBO crystals aligns along the [2 2 1] axis. The interplanar spacing of the (110) crystal planes can be determined using the following Equation (2) [
21,
22].
The spacing between the (110) crystal planes is 0.432 nm. The experimental data are in close agreement with the calculated value of 0.445 nm, confirming the accuracy of the crystal structure. The XRD data and simulation results are consistent with the TEM observations, confirming that CBO ceramics exhibit a trigonal structure with the space group R-3c (No. 167).
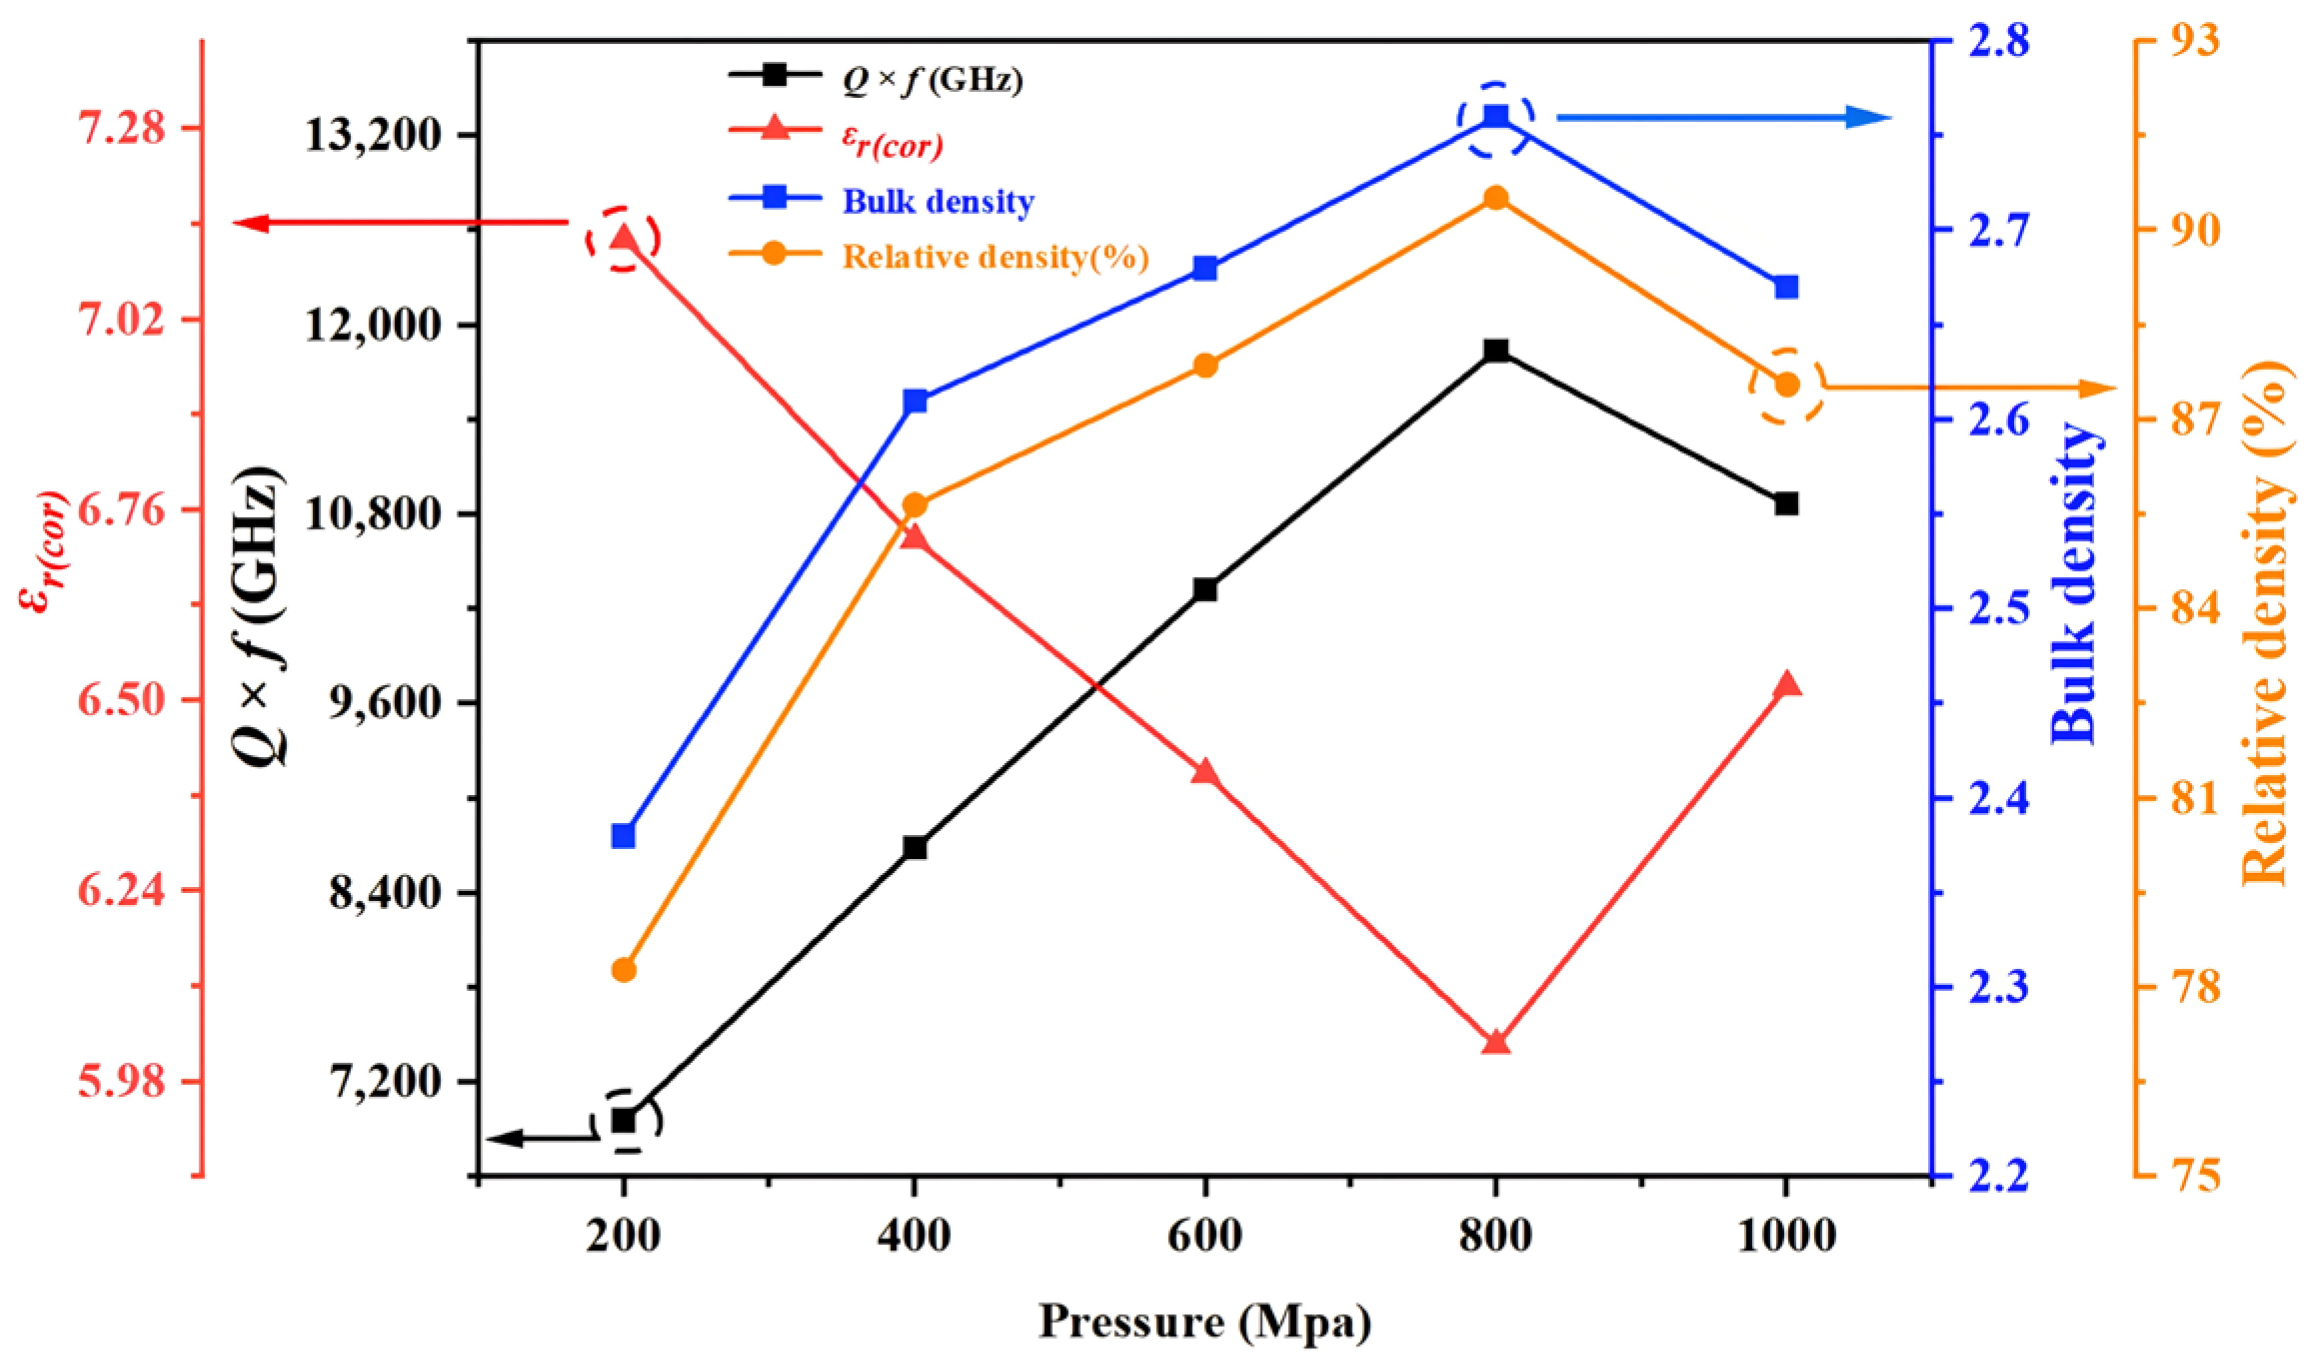
Microwave dielectric ceramics, as key materials for microwave applications, exhibit dielectric properties that are directly influenced by the material’s density. Dielectric loss, a critical parameter, can be categorized into internal and extrinsic losses. Internal loss primarily arises from the lattice vibrational characteristics, which reflect the energy conversion and dissipation mechanisms within the crystal structure. External loss, on the other hand, is mainly dominated by defects, porosity, and other structural issues in the material, which can affect its dielectric performance to some extent. Through in-depth analysis and study of these two types of losses, a more comprehensive understanding of the material’s dielectric properties can be achieved, providing theoretical support for optimizing material performance. In practice, ceramics with higher relative density generally exhibit lower dielectric loss, as the dense structure helps reduce microscopic defects, thereby improving the material’s electromagnetic wave transmission characteristics.
Figure 7 is observed that as the different pressures increases from 200 MPa to 800 MPa, the corrected dielectric constant (
εr(cor)) shows a decreasing trend, while the
Q ×
f value exhibits an opposite increasing trend. When the pressure reaches 800 MPa, both the relative density and the quality factor of CBO ceramics reach their maximum values, approximately 90.52% and 11,836 GHz, respectively. However, as the pressure continues to increase to 1000 MPa, the dielectric constant begins to increase, while the quality factor decreases. Ceramic samples with higher relative density typically exhibit lower corrected dielectric constants. This phenomenon may result from the more compact lattice arrangement within high-density ceramics, which reduces dielectric loss. Furthermore, these high-density ceramics demonstrate superior quality factor values. The enhancement of these properties may be attributed to the reduction of defects and impurities during the manufacturing process, thereby improving their overall performance. This observation reveals the close relationship between relative density and dielectric properties, providing strong data support for subsequent research.
The polarization is a key factor influencing the dielectric constant of ceramics. The theoretical
εr of the samples can be calculated using the Clausius–Mossotti (C-M) equation, as shown in Equations (3) and (4) [
19,
20].
Vm represents the molar volume, and
αe denotes the molecular polarizability. The calculation results are presented in
Table 3.
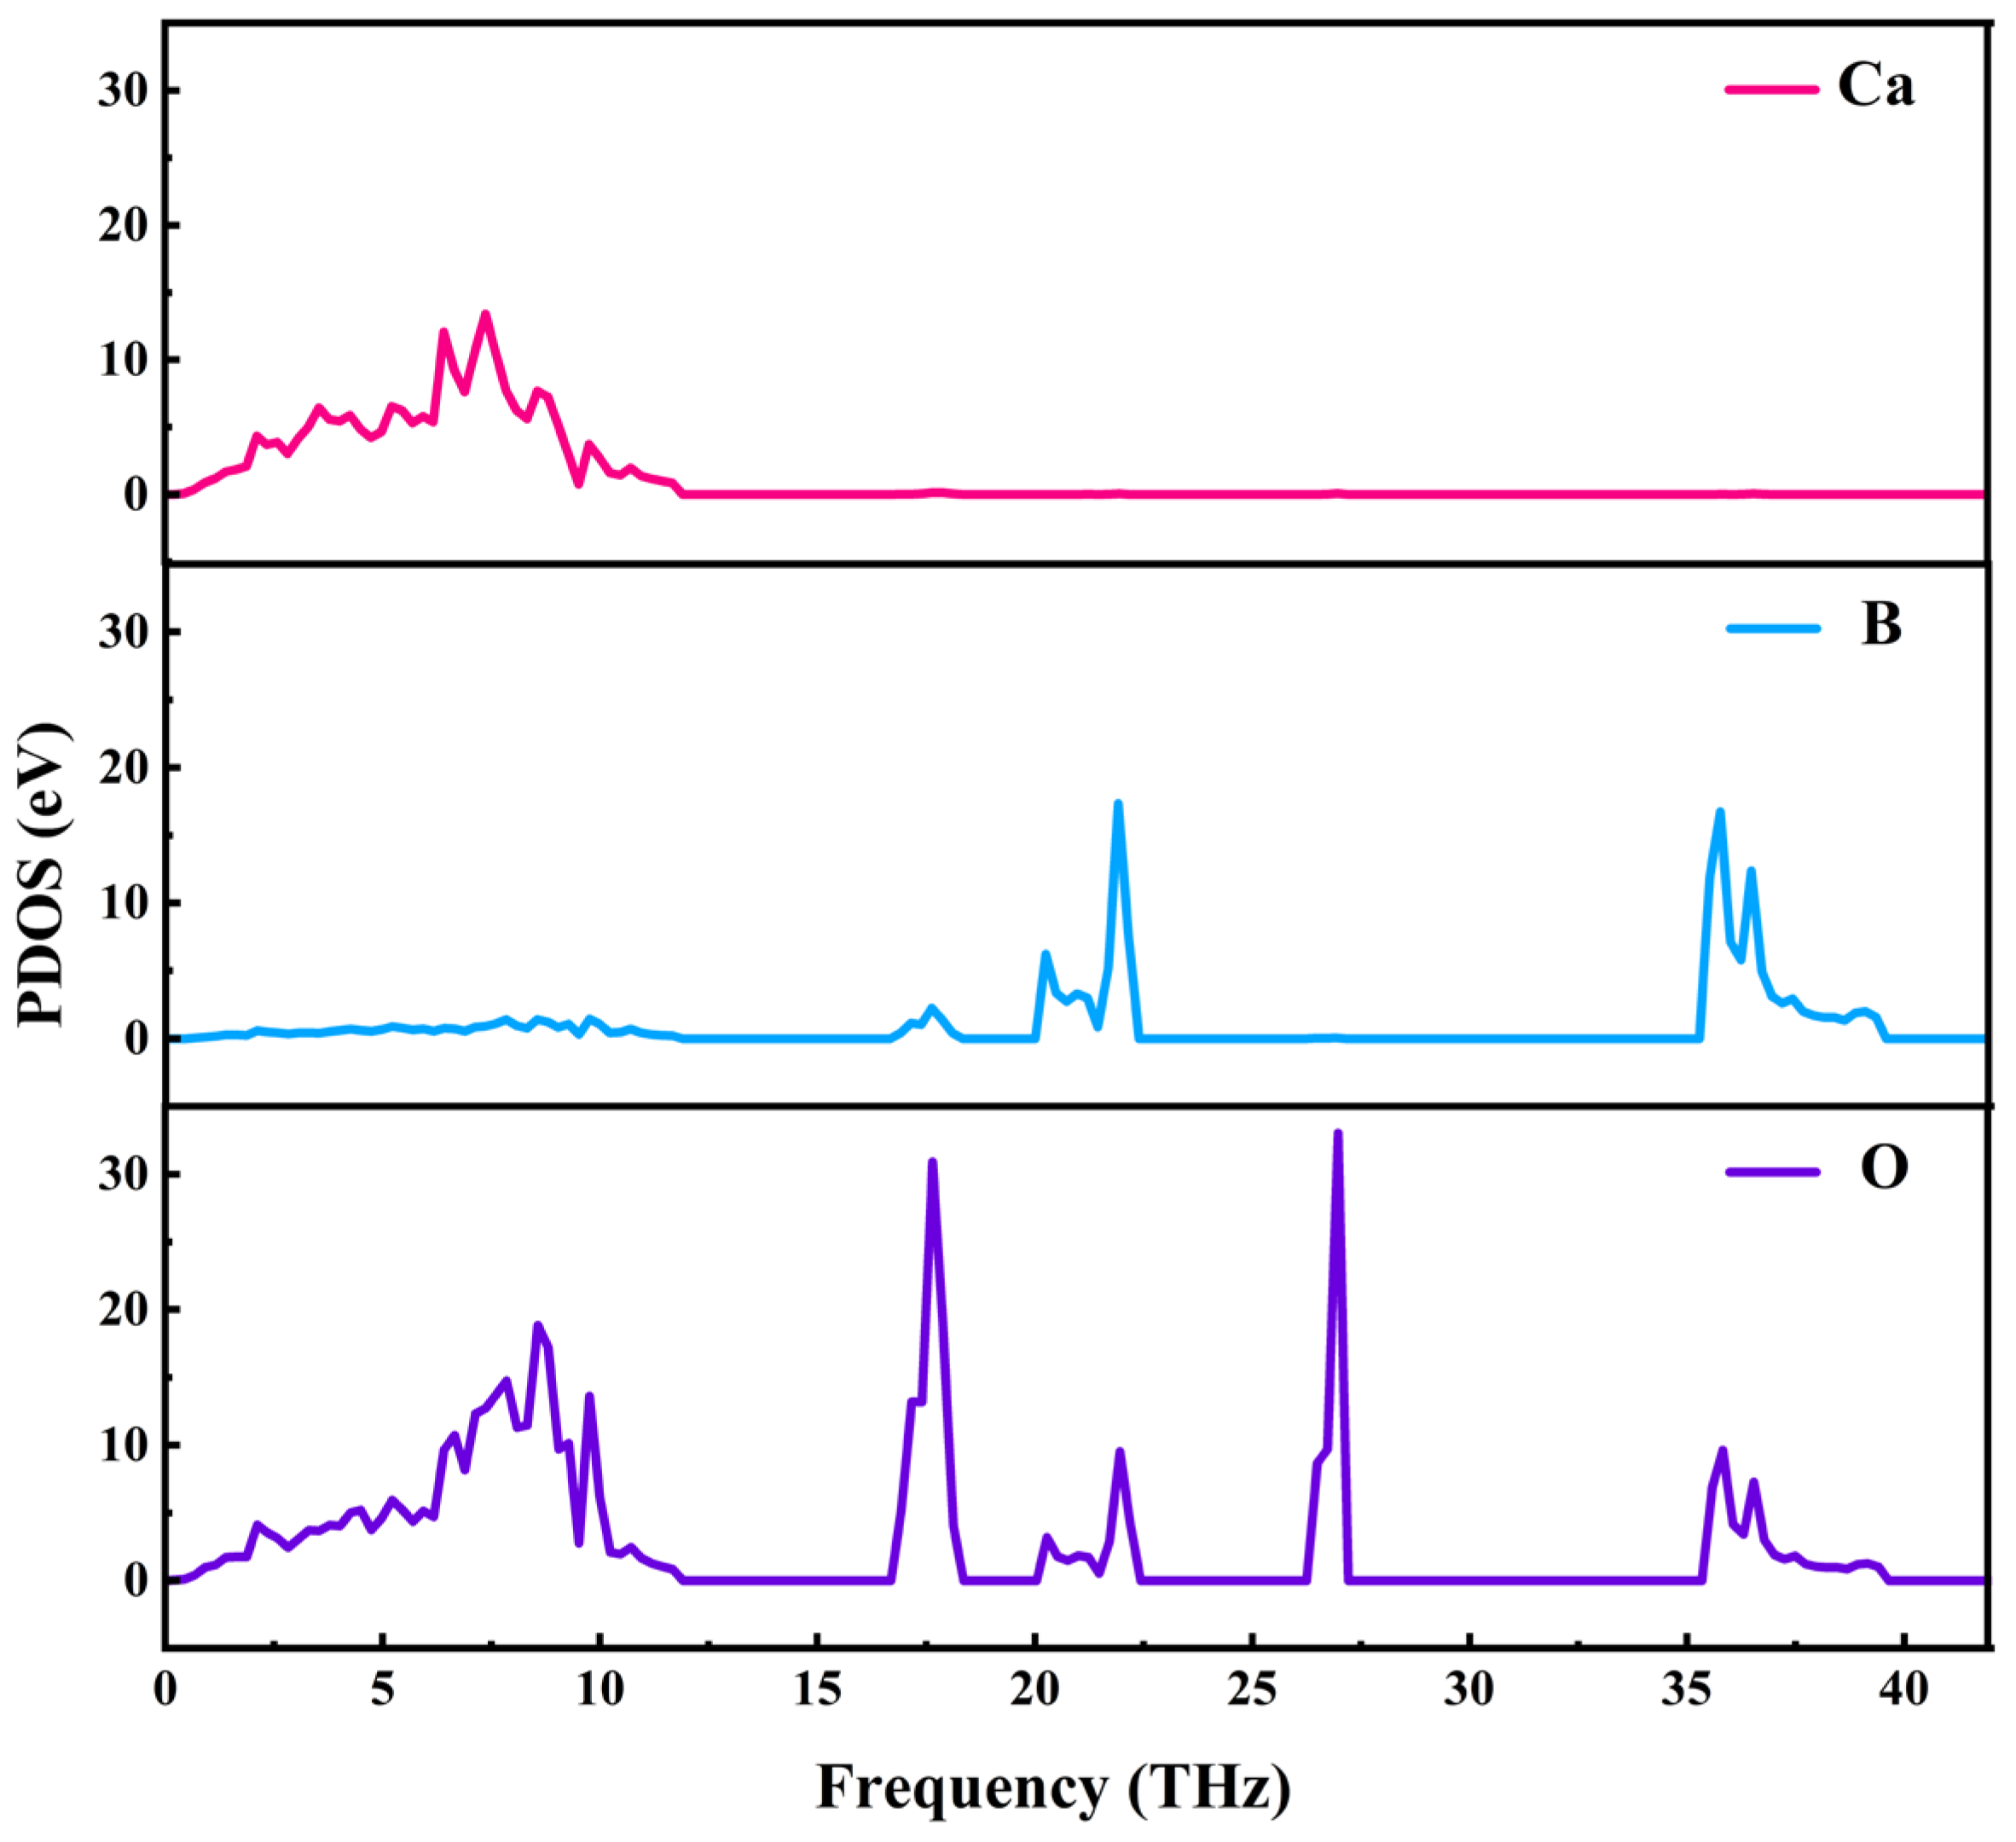
Phonon state density represents the number of phonon states within a unit frequency interval. By utilizing density-functional theory (DFT) in conjunction with density-functional perturbation theory (DFPT), the phonon frequencies of crystals at various wave vectors (k-points) can be computed, allowing for the derivation of phonon state density. The partial phonon density of states (PDOS) for CBO, illustrated in
Figure 8, elucidates the contributions of different lattice atoms to vibrational modes. Specifically, oxygen (O) atoms vibrate across the entire frequency range outside the phonon gap, calcium (Ca) atoms predominantly contribute to optical modes below 15 THz, and boron (B) atoms primarily affect modes above 15 THZ. Notably, there exists a significant complementarity between the calculated results of the phonon spectrum and phonon density of states and experimental data obtained from Raman and infrared spectroscopy. Theoretical calculations furnish comprehensive predictions of material vibrational properties, while experimental observations offer direct validation of these predictions, mutually reinforcing and supplementing each other.
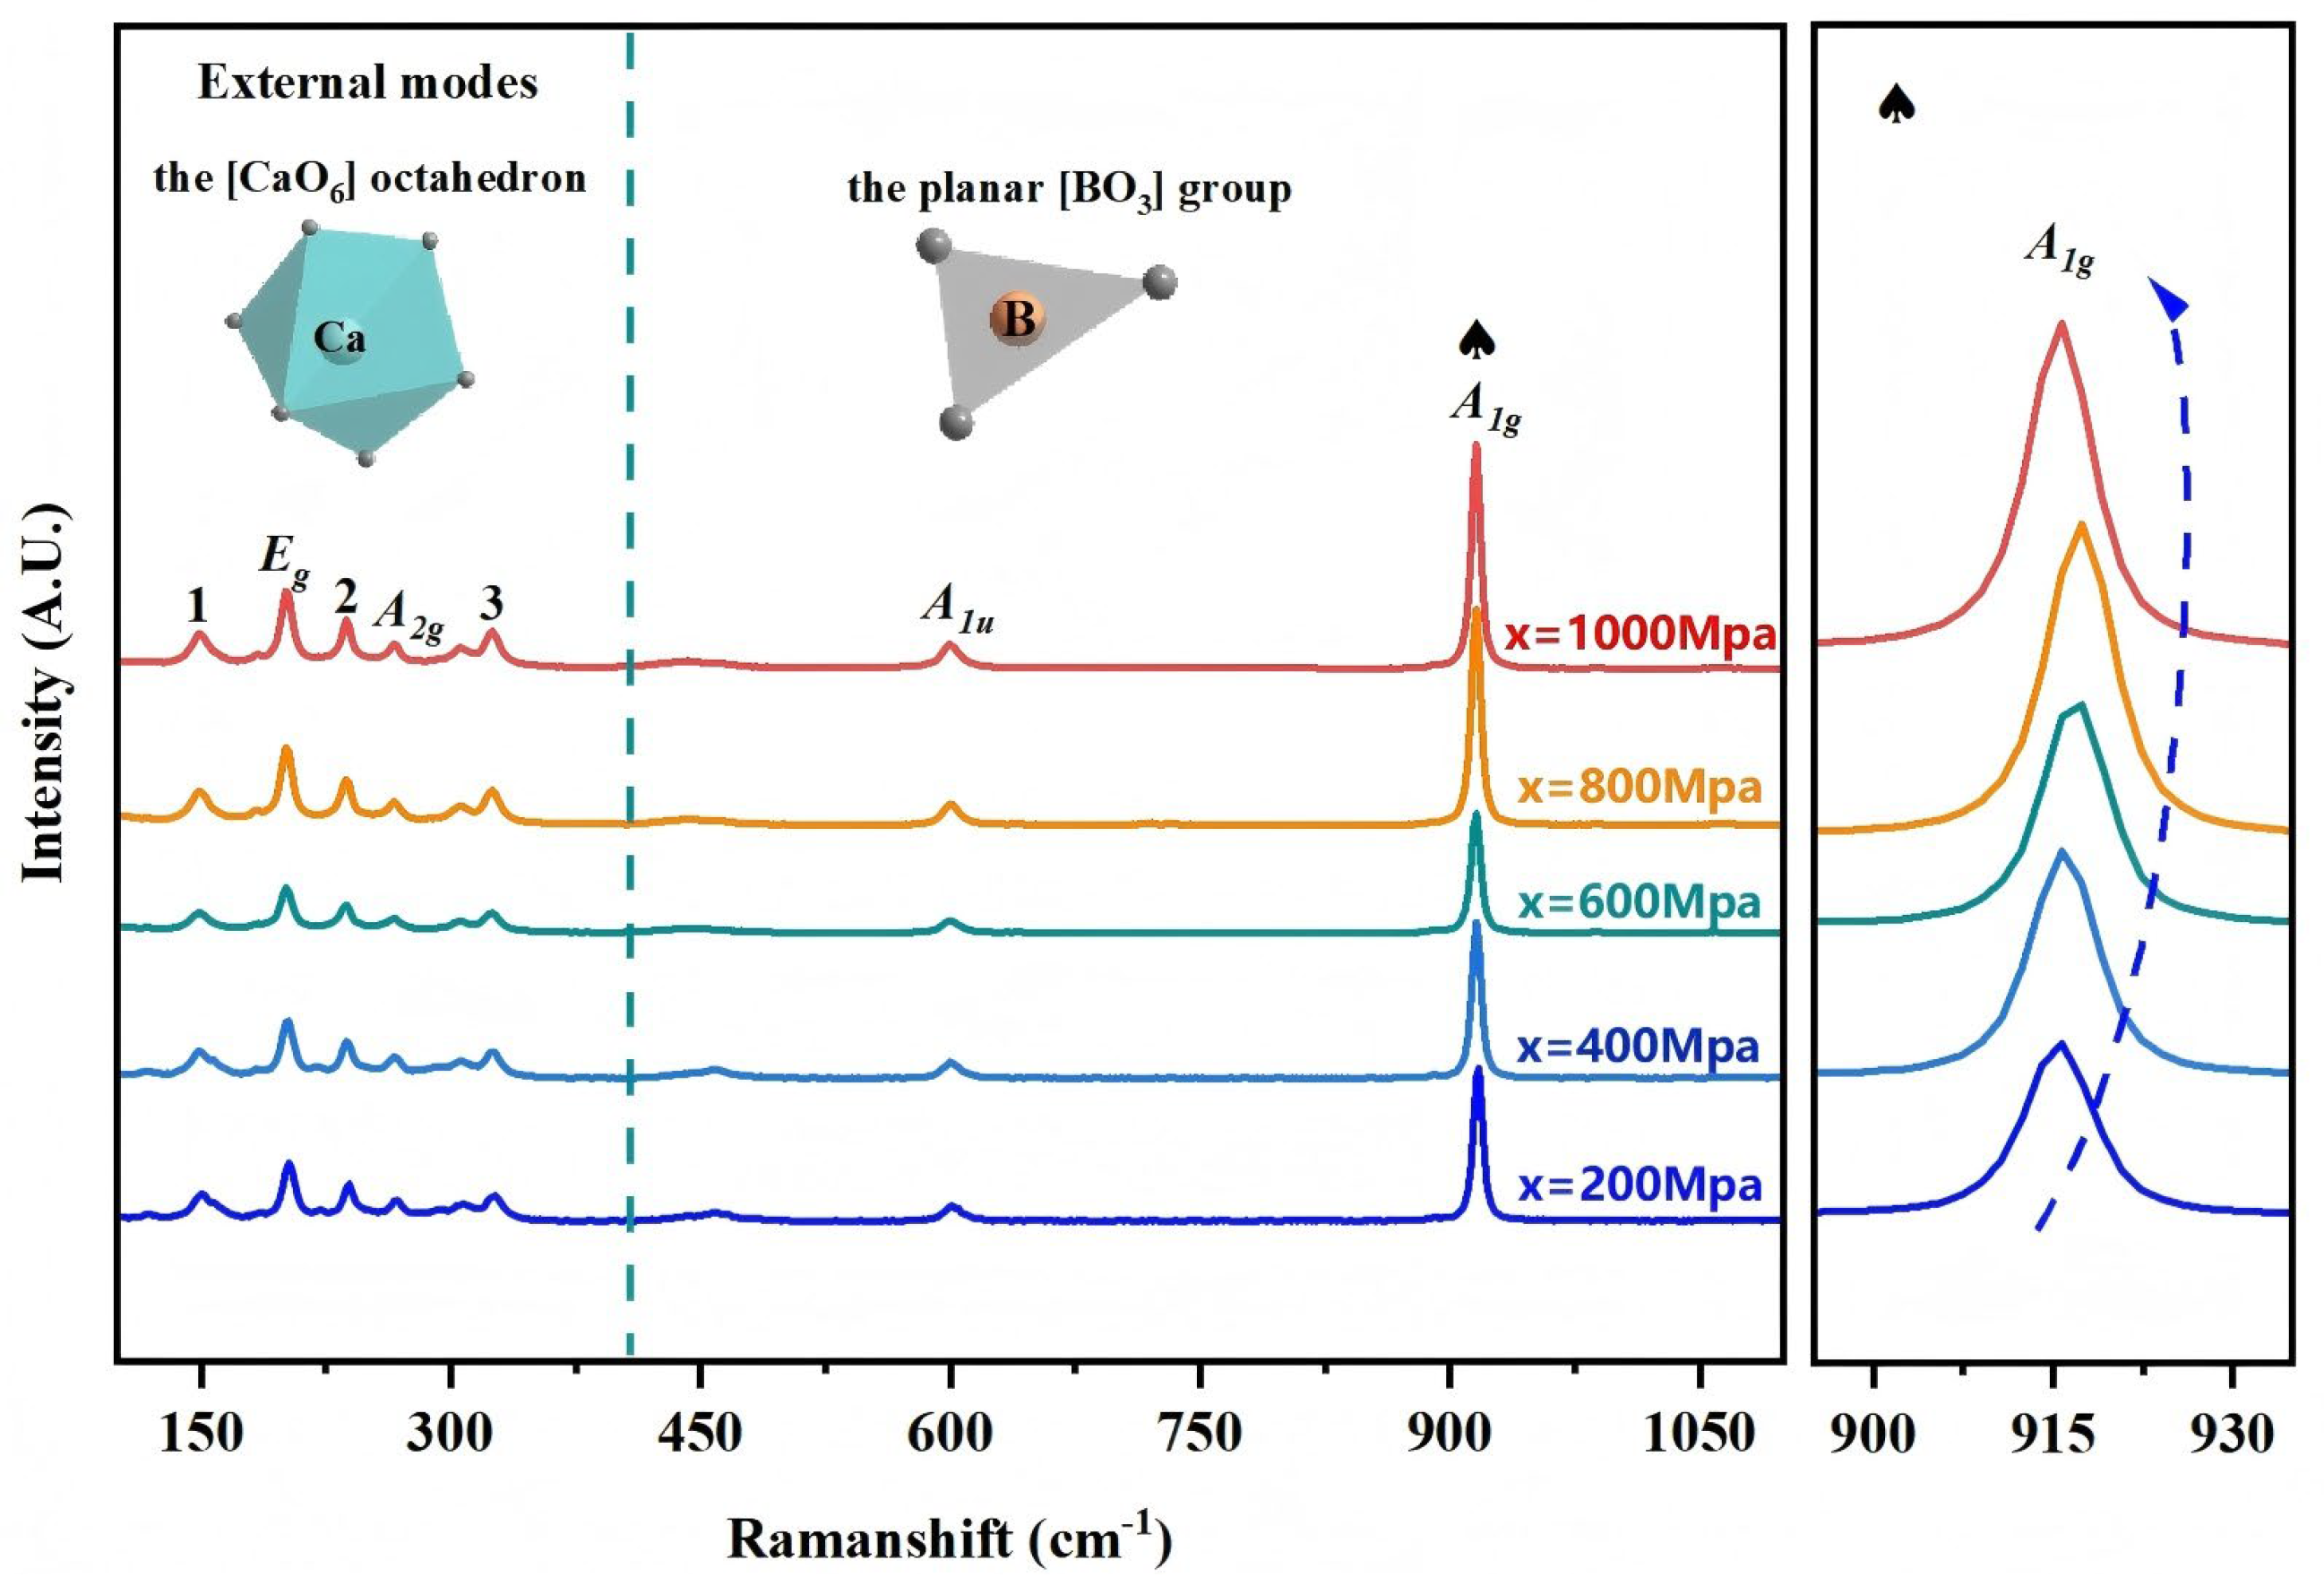
Raman spectroscopy, as an effective research method, provides detailed information regarding molecular vibrations and rotations. This information helps to elucidate the close relationship between the evolution of the ceramic’s internal structure and its dielectric properties. By utilizing Raman scattering spectroscopy, the interaction between the structure and dielectric performance of microwave dielectric ceramics can be thoroughly investigated, revealing the underlying physical mechanisms.
Figure 9 presents the Raman spectrum of CBO ceramics, with the frequency sampling range extending from 50 cm
−1 to 1100 cm
−1. Based on group theory predictions and the crystal structure data of this ceramic, CBO, belonging to the R-3c space group (No. 167), is theoretically expected to exhibit 44 Raman-active vibrational modes, as shown in Equation (5) [
19,
20].
Theoretical analysis suggests that Raman spectroscopy should reveal multiple Raman vibrational modes, including 5A1g, 5A1u, 11Eg, and 6A2g, while 5A2u and 10Eu are assigned to infrared vibrational modes, and A2u and Eu are attributed to phonon modes. In practical testing, due to potential interactions between vibrational modes and limitations in equipment accuracy, only seven Raman vibrational modes are detected. This result reflects the discrepancy between experimental conditions and theoretical predictions and indicates the need to further consider the influence of experimental conditions on the results in future studies.
Figure 9 presents the Raman spectrum of CBO ceramics, from which seven distinct Raman-active vibrational modes can be identified, with frequencies of 152 cm
−1, 201 cm
−1, 237 cm
−1, 266 cm
−1, 325 cm
−1, 600 cm
−1, and 915 cm
−1. These vibrational modes can be classified into two categories: internal and external modes. The frequencies of external modes range from 50 cm
−1 to 450 cm
−1, while internal modes occur within the frequency range of 450 cm
−1 to 1100 cm
−1. Specifically, the
A1g and
A1u modes are related to the vibrational behavior of the planar [BO
3] group, with
A1g corresponding to bending vibrations within the plane of the [BO
3] group, and
A1u associated with the symmetric stretching vibrations of the [BO
3] group. The
Eg and
A2g vibrational modes are associated with the vibrational characteristics of the [CaO
6] octahedron.
There is a specific mathematical relationship between the half-height width (FWHM) of the Raman scattering spectrum and the damping factor
γ as well as the center frequency
ω0 as shown in the expression in Equation (6) [
23,
24]:
To further investigate the characteristic variations of the Raman spectrum, the Raman scattering spectra are precisely fitted using the Lorentzian function through Origin (2024) software. The fitted data are detailed in
Table 4.
The present research concentrates on elucidating the fundamental dielectric properties inherent to microwave dielectric ceramics through systematic investigation. To this end, a four-parameter semi-quantum (FPSQ) model is introduced, which enables precise fitting and calculation of infrared reflectance spectra. By applying this model, detailed information regarding the dielectric properties of microwave dielectric ceramics is successfully obtained. The complex dielectric function is converted according to the definition provided in Equation (7). This approach allows for a deeper understanding of the dielectric characteristics of microwave dielectric ceramics, providing strong support for research in related fields [
20,
25].
ε∞ is the specific value of the dielectric constant at extremely high frequencies due to the electronic polarization effect. For optical modes, Ω
jTO and
γjTO are used to represent the frequency and damping coefficient of the
j-th transverse optical mode, respectively, while Ω
jLO and
γjLO describe the frequency and damping coefficient of the
j-th longitudinal optical mode. The intrinsic relationship between the complex dielectric constant
ε*
(ω) and the optical reflectance
R(
ω) is expressed by Equation (8) [
26]:
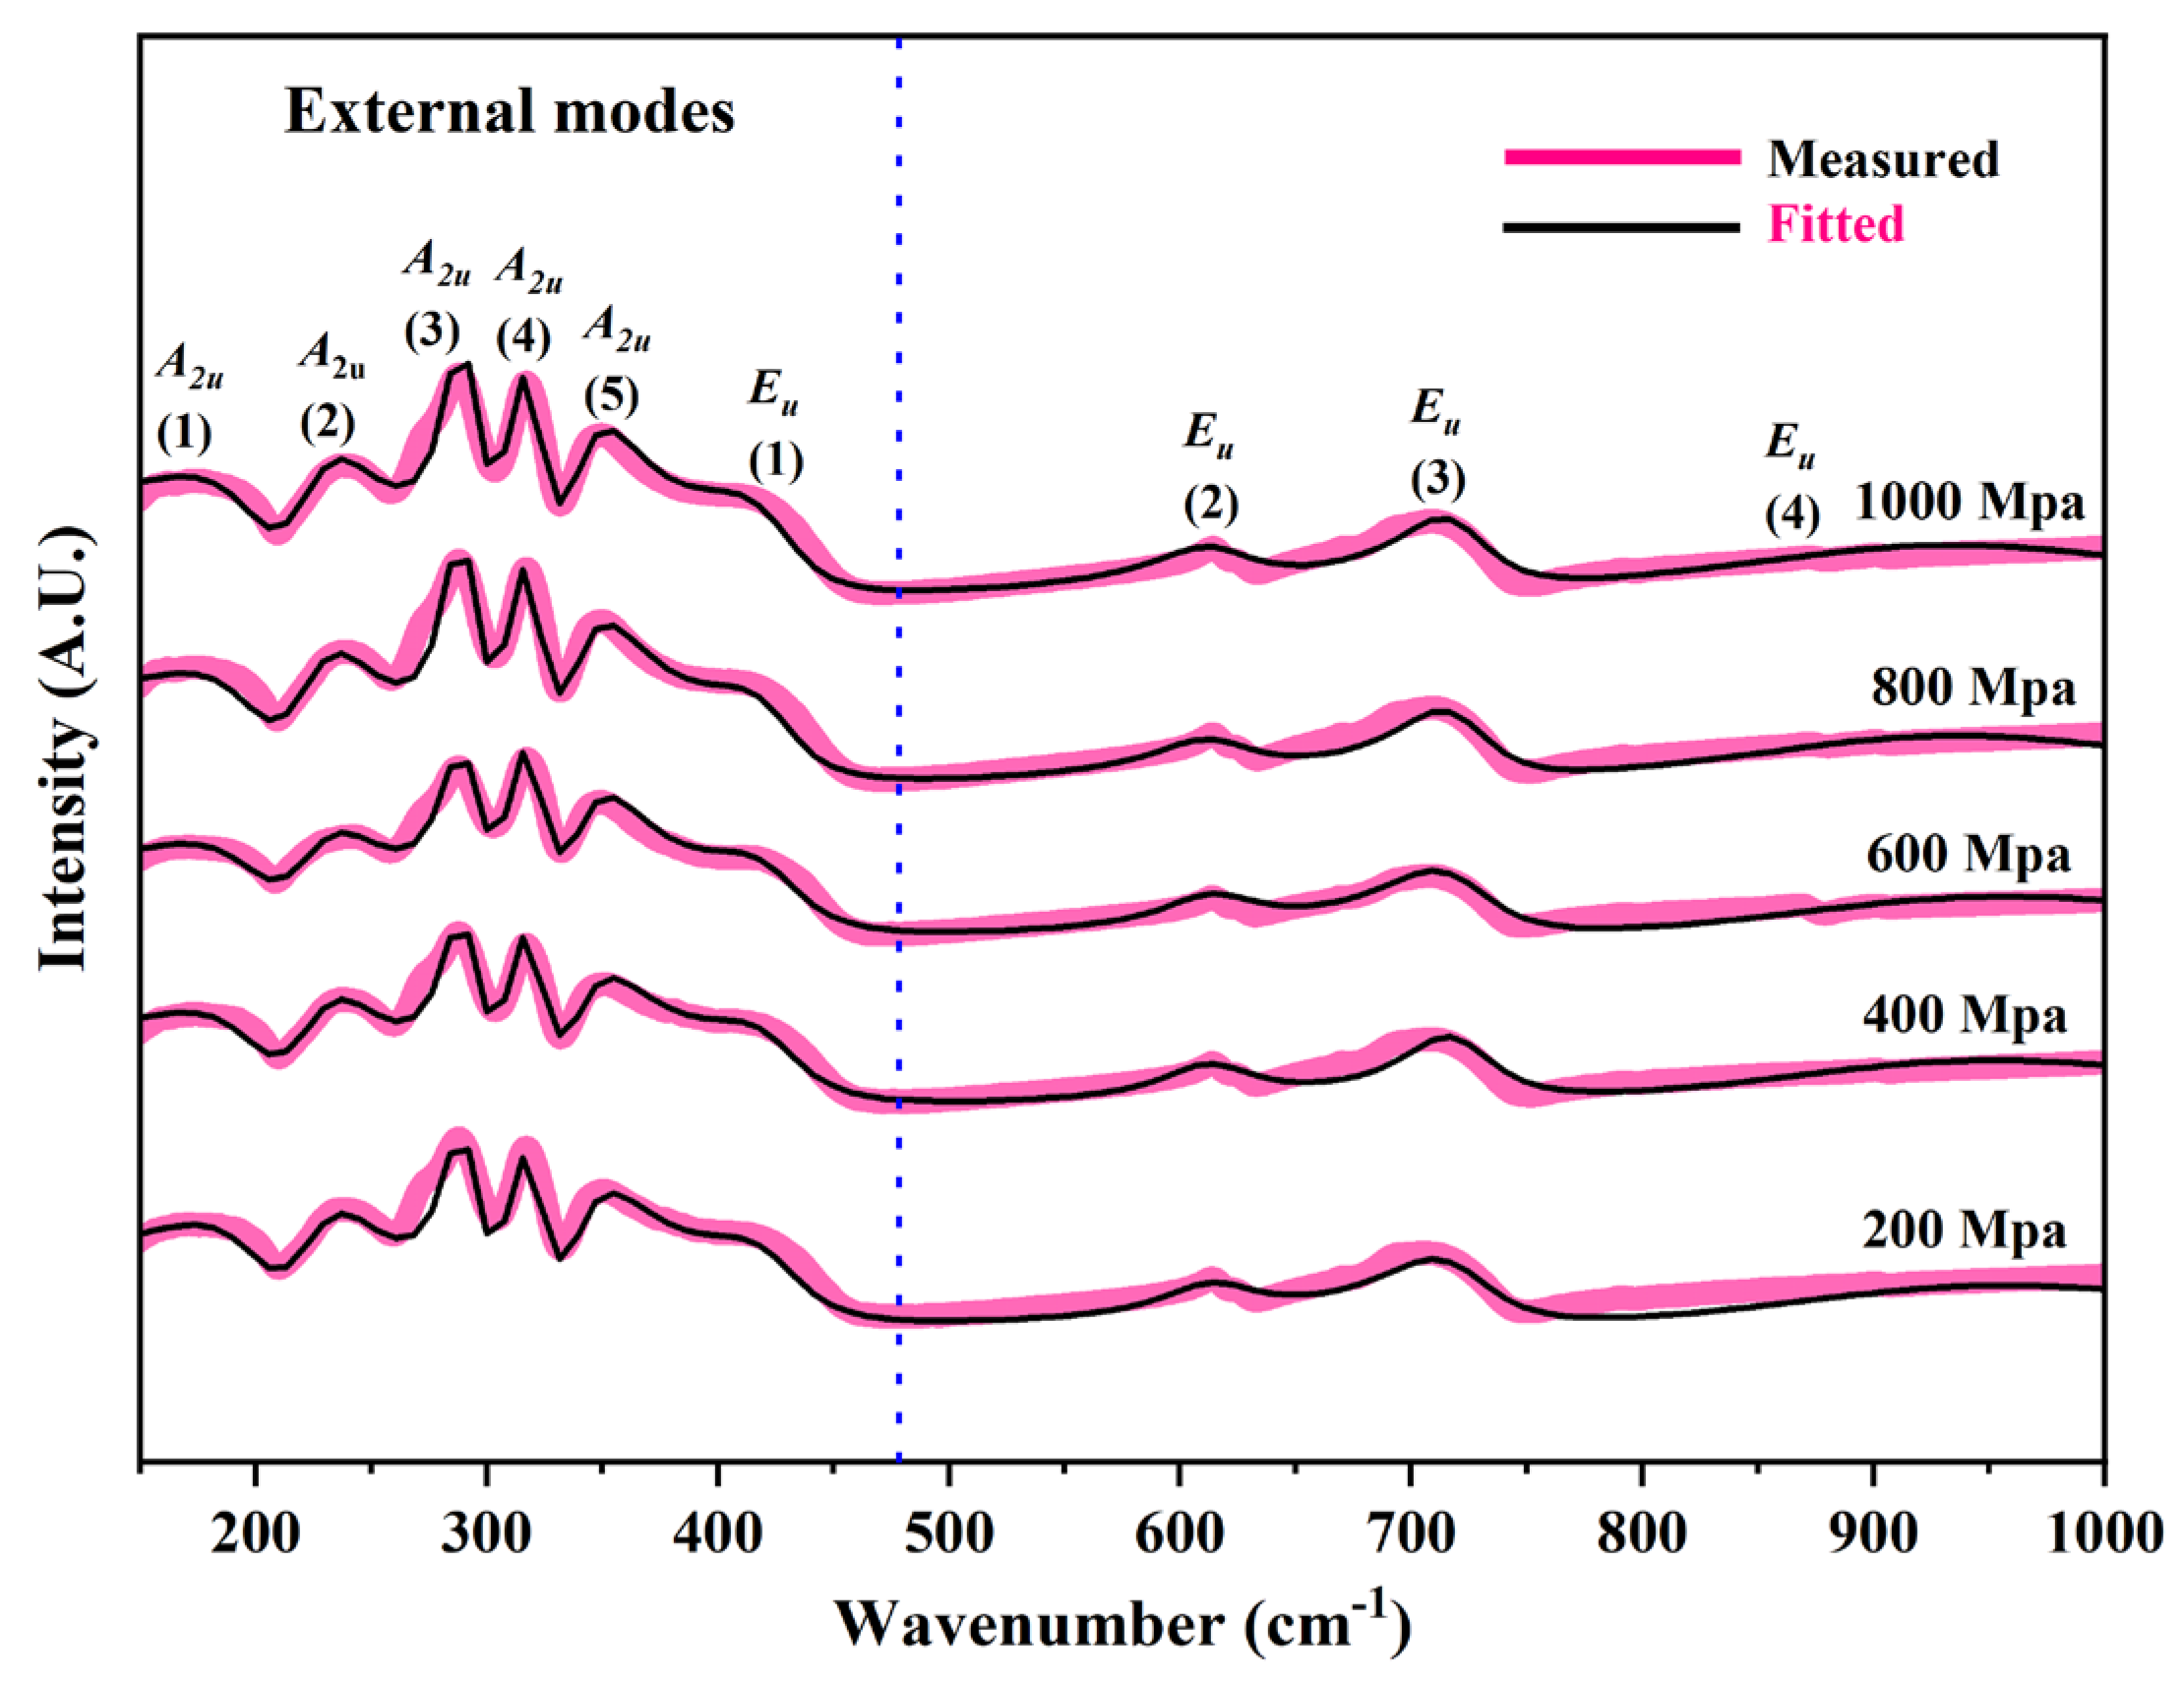
The infrared reflectance spectrum of CBO ceramics in the wavenumber range of 150 cm
−1 to 1000 cm
−1 is shown in
Figure 10. This spectrum clearly displays nine infrared-active vibrational modes, of which the modes at 175 cm
−1, 236 cm
−1, 275 cm
−1, 317 cm
−1, 348 cm
−1, and 418 cm
−1 are classified as external modes. These external modes are primarily associated with cation vibrations; however, due to the coupling effects between vibrational modes, the lattice vibrational modes in these bands are difficult to distinguish precisely. Additionally, internal modes at 613 cm
−1, 708 cm
−1, and 942 cm
−1 are observed, which are directly related to the vibrational characteristics of the planar triangular [BO
3] group. Through in-depth analysis of the infrared reflectance spectrum, further insight into the vibrational modes of CBO ceramics and their intrinsic relationship with material properties is obtained.
The intrinsic dielectric constant can be determined using Equations (9) and (10) [
27].
The parameter Δ
εj signifies the extent to which the
j-th transverse optical vibration mode influences the dielectric constant of the ceramic material. Additionally, the contribution to the intrinsic dielectric loss can be calculated using Equation (11) [
27].
Table 5 presents the results obtained from fitting the infrared reflection spectra using the FPSQ model. Analysis reveals that the intrinsic dielectric properties of the ceramic material are primarily governed by low-frequency vibration modes. These low-frequency modes exert a significantly greater influence on the dielectric properties compared to high-frequency modes, thereby indicating that the dielectric characteristics of the ceramic are predominantly determined by low-frequency vibrations, i.e., external modes. Sintering pressure changes the spacing between atoms and the strength of bonds in ceramics, thereby affecting vibration modes. To validate the accuracy of the FPSQ model, a comparison is made in
Table 6 between the intrinsic dielectric properties derived from the model and the experimental results. The comparison shows that although the model-predicted values are slightly lower than the experimental measurements, both exhibit consistent trends in dielectric constant and loss, and their magnitudes are in agreement. This discrepancy may be attributed to defects on the sample surface, which could have caused partial signal loss during testing. Furthermore, using the dielectric property data obtained from the fitting, additional dielectric performance calculations were conducted using Equations (3), (4), and (6). The computed results are found to be in close agreement with the experimental values for the samples under 800 MPa. This outcome further confirms that the dielectric properties of the ceramic samples are primarily influenced by ionic polarization, while dielectric polarization in the far-infrared region is mainly induced by phonon absorption. These findings not only enhance the understanding of the dielectric properties of ceramic materials but also provide an important reference for subsequent research and applications.
In the expression of the complex dielectric constant,
ε(
ω) =
ε′(
ω) +
ε″(
ω), the imaginary part,
ε″(
ω), serves as a key indicator for the ability of phonons to absorb electromagnetic waves. The real part,
ε′(
ω), also referred to as the dielectric constant, reflects the polarization level of the ceramic at the macroscopic scale. Through the Kramers–Krönig (K-K) relation, the characteristic parameters of the phonons can be effectively transformed, allowing information to be extracted from the reflection spectra.
Figure 11 presents the curves of the dielectric constant
ε′(
ω) and the absorption characteristics
ε″(
ω) derived for the material within the microwave region. A comparative analysis of the calculated results with experimental data reveals a high degree of correspondence between the two. This finding strongly suggests that the dielectric properties of CBO ceramics in the microwave frequency range are primarily attributed to the polarization effect of internal ionic displacements and lattice vibrations. In other words, the dielectric behavior of this ceramic in the microwave frequency range is determined by the displacement of internal ions under the influence of an electric field and the vibrations of the lattice structure. This discovery provides an important basis for a deeper understanding of the dielectric properties of CBO ceramics and offers theoretical support for their application in microwave devices.
Bond length, as a critical indicator of atomic interaction strength, plays a crucial role in the analysis of material microstructure. When exploring the relationship between the microstructure and macroscopic electrical properties of materials, bond length becomes an indispensable consideration. In fact, even subtle variations in bond length can lead to corresponding adjustments in polarization, thereby further influencing the dielectric properties of the material. To precisely obtain the bond length data of atoms within the crystal structure, the Rietveld refinement method using Fullprof-Suite (Nov. 2013) software is employed, with the calculated results presented in
Table 7 for subsequent analysis and discussion.
Figure 12 presents a detailed depiction of the relationship between B-O bond length, filling rate,
εr(cor), and
A1g Raman shift as a function of pressure. Among these key parameters, the variation trend of
εr(cor) aligns with that of the B-O bond length, while the change in filling rate exhibits a similar trend to that of the
A1g Raman mode shift. As the pressure increases from 200 MPa to 800 MPa, a decrease in
εr(cor) is observed, accompanied by a gradual shortening of the B-O bond length and a blue shift (i.e., a shift toward higher wavenumbers) of the
A1g Raman mode. At the same time, the relative density increases. However, when the pressure is further raised to 1000 MPa,
εr(cor) begins to increase, the B-O bond length elongates, the
A1g Raman mode shifts to lower wavenumbers, and the filling rate decreases. These shifts in Raman modes reveal the dynamic changes in the chemical environment within the ceramics. They exhibit a high sensitivity to subtle variations in the crystal structure and can indirectly reflect the evolving trends in dielectric performance. Therefore, the variations in Raman modes serve as crucial indicators for studying the relationship between dielectric properties and crystal structure. Notably, the blue shift of the
A1g mode frequency shows a negative correlation with the reduction in B-O bond length, suggesting that as the bond length shortens, bond energy increases, thereby limiting the spatial extent of electron migration. This increase in bond energy, together with the reduced electron migration space, leads to a decrease in the polarization of CBO ceramics, which subsequently results in a reduction of the dielectric constant. These findings provide valuable insights into the complex relationship between the dielectric properties and the crystal structure of ceramic materials.
Figure 13 depicts the pressure-dependent correlations among the
Q ×
f value, the FWHM of the Raman-active
Eg vibrational mode, and the bond length of the Ca-O coordination polyhedron. The FWHM of the Raman-active
Eg vibrational mode and the interatomic distance of the Ca-O coordination polyhedron demonstrate a concurrent evolution with pressure, whereas the
Q ×
f value exhibits an inverse correlation. Specifically, under hydrostatic compression from 200 MPa to 800 MPa, the
Q ×
f value experiences a monotonic augmentation, while the FWHM of the
Eg mode undergoes a proportional reduction, accompanied by a contraction of the Ca-O bond length. However, when the pressure is further increased to 1000 MPa, the
Q ×
f value decreases, the FWHM of the
Eg mode increases, and the Ca-O bond length lengthens. The FWHM value, as a key indicator of crystal order, directly reflects the degree of structural order. Specifically, lower FWHM values indicate higher crystal order. In the context of microwave dielectric ceramics, this sequence is closely associated with both the dielectric loss and the damping coefficient of lattice vibrations, and it also has a substantial impact on the physical properties of the crystal. In general, an increase in crystal order tends to reduce dielectric loss. Therefore, an increase in the FWHM of the
Eg mode suggests a decrease in crystal order and an increase in the damping coefficient, which elevates the inherent losses of the material, resulting in a reduction of the
Q ×
f value. In contrast, a decrease in the FWHM value indicates an improvement in the
Q ×
f value.
The development of information technology has increasingly positioned the communication industry as a pivotal sector, leading to an accelerated evolution of antenna technology. As an important antenna type, the structure of MPAs usually consists of a conductive patch of a specific shape with a layer of dielectric substrate. Notably, in this study, CBO ceramic under 800 MPa was utilized to model a microstrip patch antenna with dimensions of 3.75 × 5.4 × 1.4 mm. As depicted in
Figure 14a, the geometric configuration of the designed antenna is shown. The reflection coefficient, expressed as return loss (
S11), serves as an essential metric for evaluating the connection integrity between an antenna and its associated feedline. To achieve optimal signal propagation within MPAs, it is generally stipulated that the S
11 value must remain below −10 dB.
Figure 14b showcases the simulated S
11 characteristics of the antenna, revealing a resonant frequency of 14.97 GHz accompanied by an S
11 value of −25.5 dB. Such a low S
11 value is indicative of exceptional performance, signifying that the antenna effectively radiates a substantial portion of the input power. Another vital parameter for assessing MPAs is antenna gain, which quantifies the power radiated by the antenna in a designated direction.
Figure 14c displays the simulated three-dimensional (3D) gain distribution of the antenna, whereas the radiation patterns in the E-plane and H-plane are illustrated in
Figure 14d. The microstrip patch antenna exhibits a directional radiation pattern, with its primary lobe oriented towards the positive z-axis. The peak gain attains a value of 7.15 dBi at an elevation angle (
θ) of 0°. The outcomes of the simulated antenna experiments underscore the considerable promise of CBO ceramics for utilization in 5G antenna technologies.


 ,
, 


