Article

Influence of Post-Heat Treatment on the Tensile Strength and Microstructure of Metal Inert Gas Dissimilar Welded Joints

1
Faculty of Mechanical Engineering, Ho Chi Minh City University of Technology and Education, Ho Chi Minh City 7000, Vietnam
2
Advanced Manufacturing Lab, Artificial Intelligence and Digital Transformation Institute, Binh Duong University, Thu Dau Mot City 75000, Vietnam
3
Faculty of Mechanical Engineering, Industrial University of Ho Chi Minh City, Nguyen Van Bao Street, Ward 4, Go Vap District, Ho Chi Minh City 70000, Vietnam
*
Author to whom correspondence should be addressed.
Crystals 2025, 15(7), 586; https://doi.org/10.3390/cryst15070586
Submission received: 18 May 2025 / Revised: 13 June 2025 / Accepted: 17 June 2025 / Published: 20 June 2025

Abstract

Taguchi and post-heat treatment methods have been used in this study to optimize the metal inert gas (MIG) welding joints between SUS304 austenite stainless steel and plain carbon SS400 steel using AWS ER 308L filler wire. The dissimilar welding joints’ microstructure and tensile strength have been examined. The findings show that the fast cooling of the weld joint and the ferrite-forming element of the filler wire cause the dendrites’ δ-ferrite phase to emerge on both the weld bead and the heat-affected zone (HAZ) of the SUS304 side. The stickout parameter has the largest impact on the ultimate tensile strength (UTS), next to the welding speed, welding voltage, and welding current, due to the strong impact of the heat distribution. The optimal welding parameters are a welding current of 105 A, a welding voltage of 14.5 V, a stickout of 12 mm, and a welding speed of 420 mm/min, producing the UTS value of 445.3 MPa, which is close to the predicted value of 469.2 ± 53.6 MPa. Post-heat treatment with an annealing temperature that is lower than 700 °C could improve the optimized weld joints’ strength by up to 5%. The findings may provide a more realistic understanding of the dissimilar welding technology.

1. Introduction

Transition joints of dissimilar welding have become an attractive field due to their wide range of applications in pipes and complex structures such as petroleum, power plants, shipbuilding, and automobiles [1,2,3]. Using the hybrid structure with dissimilar welding joints could achieve both high strength and cost savings [4,5,6]. Therefore, this technique can be seen in joining carbon steel and stainless steel, steel and aluminum, steel and copper, and copper and aluminum [7,8,9,10]. Among them, dissimilar welding between carbon steel and stainless steel could obtain a high strength level. However, welding different materials always faces many downsides, such as a low fusion level, cracking, or low strength due to the differences in solubility, melting temperature, and thermal expansion [11,12,13,14]. Improving the quality of dissimilar welding joints is critical to achieving reliable structures.
Dissimilar welding joints could be enhanced by selecting suitable materials, welding methods, fillers, welding parameters, and heat treatment. For example, Singh et al. [15] examined the quality of dissimilar welding joints between SUS304 and EN 8 carbon steels by examining the electrical current, voltage, and welding speed. The investigation identified the presence of an austenite grain with large and small grain sizes and δ-ferrite. Moreover, the austenite phase’s in-grain orientation and δ-ferrite ratio significantly impact strength. Kim et al. [16] investigated the microstructure and thermomechanical properties of dissimilar welding of STS441 ferritic stainless steel and Grade SS400carbon steel. They observed that the martensite phase grows at the weld joint as the Cr and Nb concentrations decrease. Torkamany et al. [17] reported the intermetallic compounds issue in dissimilar welding between aluminum alloy and carbon steel with a laser source. The effects of pulse duration, laser intensity, and overlapping factors were investigated to reduce the production of intermetallic compounds.
The decrease in peak power, pulse duration, and overlapping factor leads to a decline in the intermetallic compound percentage and an improvement in the tensile strength. Naffakh et al. [18] examined the welding between AISI310 stainless steel and Inconel 657 using four filler types, including Inconel A, Inconel 82, Inconel 617, and AISI310 stainless steel. The study focused on conducting the hot-cracking test of the dissimilar weld joints with various types of fillers. The results presented that Inconel A filler has the best hot-cracking resistance, tensile strength, and ductility compared with the other filler types. Notably, Yao et al. [19] indicated that a post-processing step like annealing could treat the dissimilar structure uniformly, reducing the residual stress while avoiding distortion and wrapping because of the variations in thermal expansion and elastic modulus. Therefore, applying a post-heating treatment could improve the quality of this welding type.
Dissimilar welding between carbon steel and stainless steel attracts many researchers due to the weld joint’s high strength and low cost. For instance, Khan et al. [20] examined the welding process between AISI 1020 and AISI 304 steel by indicating the impacts of welding techniques, filler types, and post-heat treatment on the welding quality. Tensile and bending tests were used to examine the welding samples. For the tungsten inert gas (TIG) welding technique, post-heat treatment at 600 °C leads to the best tensile and bending strength. Moreover, for shielded metal arc welding (SMAW), the temperature should be 30 °C higher. The hardness of the post-heat treatment welds is lower than that of the as-welded samples. Jamaludin et al. [21] surveyed the welding between mild steel and 304 stainless steel with AWS E6013 mild steel filler and AWS E308L-16 stainless steel filler. The tensile test pointed out that welding with the stainless steel filler is slightly stronger than with mild steel. Interestingly, samples generated with both the stainless and mild steel fillers had the simple fracture mode, in which the mild steel base is cracked rather than the other zones, such as the fusion zone, heat-affected zone (HAZ), and stainless steel zone. Ma et al. [22] welded AISI 1045 carbon steel and 304 stainless steel using friction welding. The interface zone consisted of mechanical mixing with a peripheral shape under severe plastic deformation and high temperature. Interestingly, the austenite grain size is decreased on the stainless steel base. Through the welding settings, the tensile strength of the weld joint is directly impacted by the dimensions of the carbide layer and the interface zone.
Optimization methods can be applied when controlling multi-parameter techniques such as welding [23]. Van Huong et al. [24] also used the Taguchi approach to increase the carbon–stainless steel dissimilar welding joint by controlling the welding current, voltage, speed, and root face. The highest UTS value achieved by the optimization method is 469.4 MPa, which is consistent with the prediction value. Furthermore, it exceeds the greatest value of 440.7 MPa obtained by using the L16 Taguchi array, indicating the merits of this optimization method. Roy et al. [25] applied the L9 Taguchi array to find out the ideal process parameters when welding ferritic and austenitic stainless steels. The study concentrated on visual and X-ray examinations to evaluate the welding quality. Principal component analysis (PCA) appears to be the most effective way to optimize the welding quality among many analysis tools.
An optimization tool combined with post-heat treatment is rarely discussed and may be necessary to improve welding strength. In this work, the dissimilar welding of SS400 and SUS304 carbon steel using the GMAG technique was surveyed. Following Taguchi optimization of the welding parameters, the ideal samples underwent a post-heat treatment process to eliminate residual stress and increase mechanical strength. The microstructure and tensile strength of the weld joints were considered. The results may offer a greater practical understanding of the dissimilar welding field between mild steel and stainless steel.

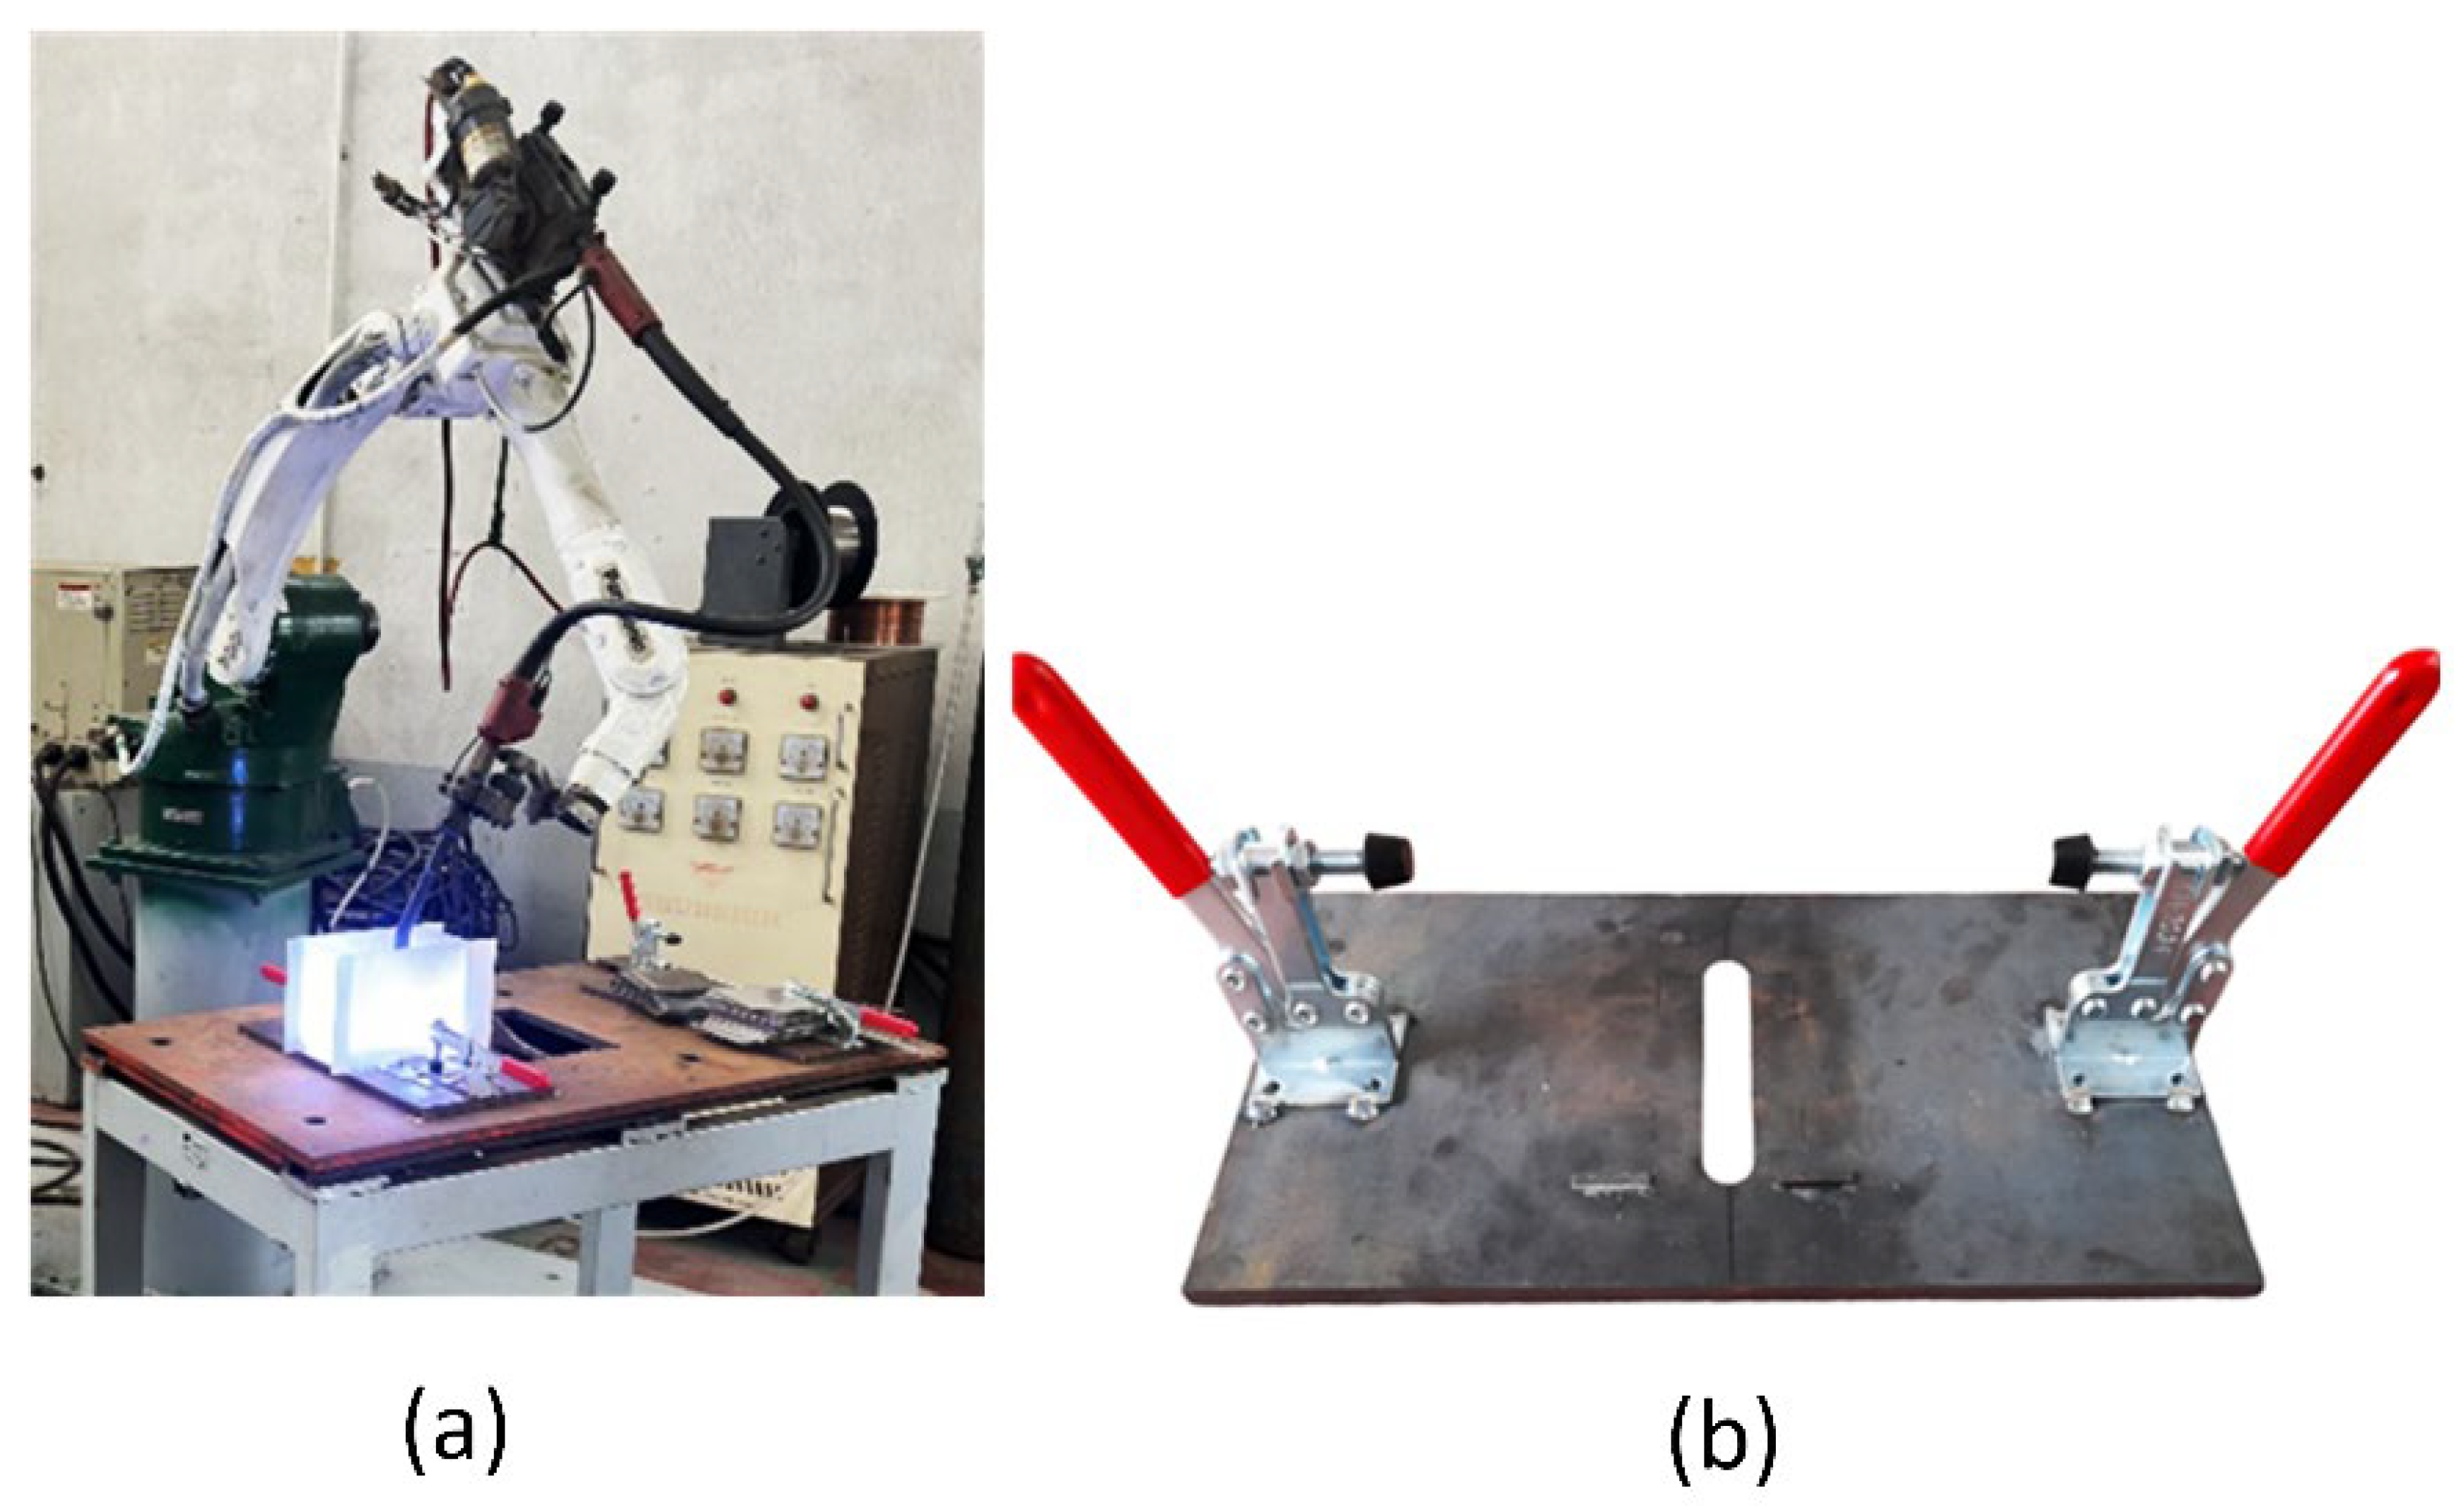
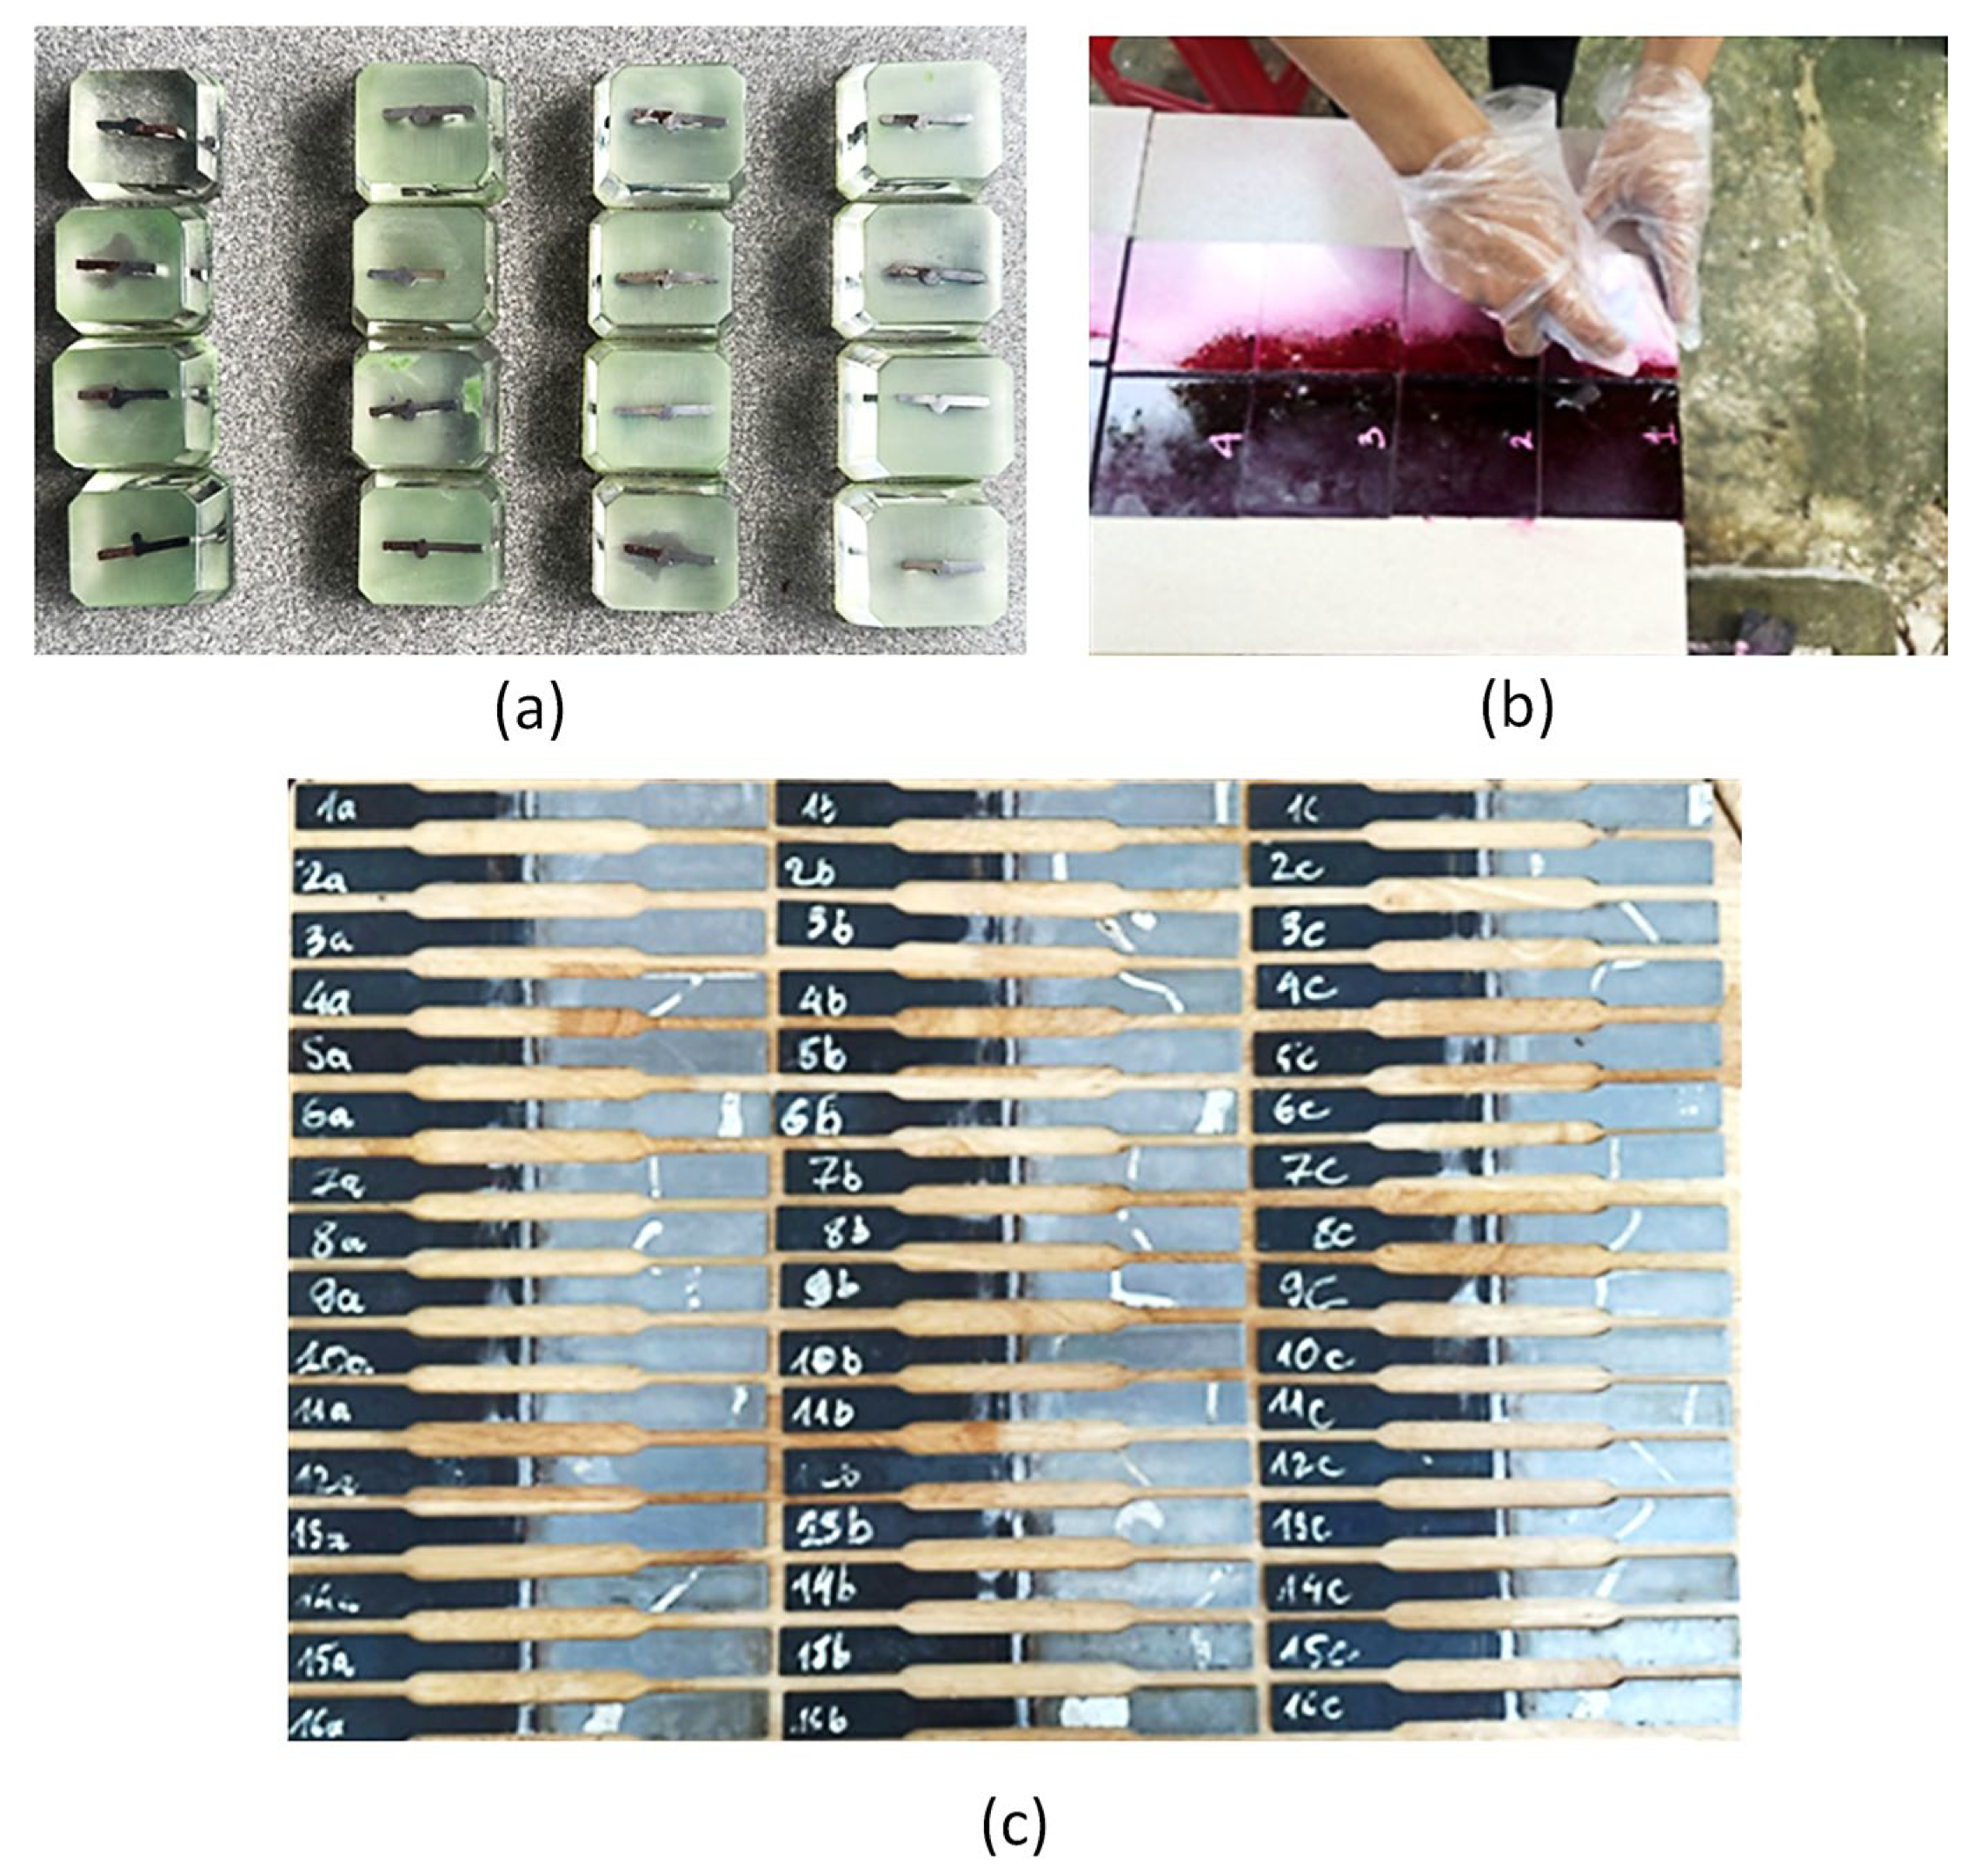
2. Materials and Methods

The welding process was conducted using a 6-axis Robot, Panasonic TA-1400G2 series YA-1NA (Panasonic, Osaka City, Japan), as shown in Figure 1. Initially, the SUS304 and SS400 steel sheets with a 2 mm thickness were prepared with a dimension of 110 mm × 105 mm. Table 1 shows the chemical compositions of these steels.
These sheets were welded with AWS ER 308L filler wire, with different welding levels, as shown in Table 2. Table 3 is designed on the basis of both Taguchi calculation and preliminary tests, following the L16 array created by Taguchi methods, ensuring good welding parameter ranges. In this study, four basic welding parameters, including welding current, welding voltage, welding speed, and electrical stickout, were surveyed. To provide adequately protective weld connections, the gas flow rate was set at 14 L/min. The dissimilar welding joints were then tested via a penetration test, using a Megacheck Penetrant (Nabakem Co., Pyeongtaek-si, Republic of Korea).
After the penetration test, the dissimilar welding samples were cut to prepare for the penetration test and the tensile test, following the ASTM E290 standard [26], and the microstructure examination, as shown in Figure 2. Every sample number had three specimens for calculating the average value. The samples were machined at the welding bead to create the same thickness for the whole specimen by carefully milling and grinding before the tensile test.
Figure 3 shows the tensile test machine and the microscope. The WE1000B universal testing machine (Jinan, China) was used to test the tensile samples. The Oxion OX.2153-PLM EUROMEX metallurgical microscope (Euromex Microscopen BV, Arnhem, The Netherlands) was utilized to view the samples’ microstructure. Samples for the microstructure analysis were cut, ground, polished, and etched with 4% nital for the carbon steel part and a HCl/HNO3 solution for the stainless steel part. Scanning electron microscopy (SEM) TM4000 (Hitachi, Ibaraki, Japan) was used to examine the fracture surfaces.

3. Results and Discussion

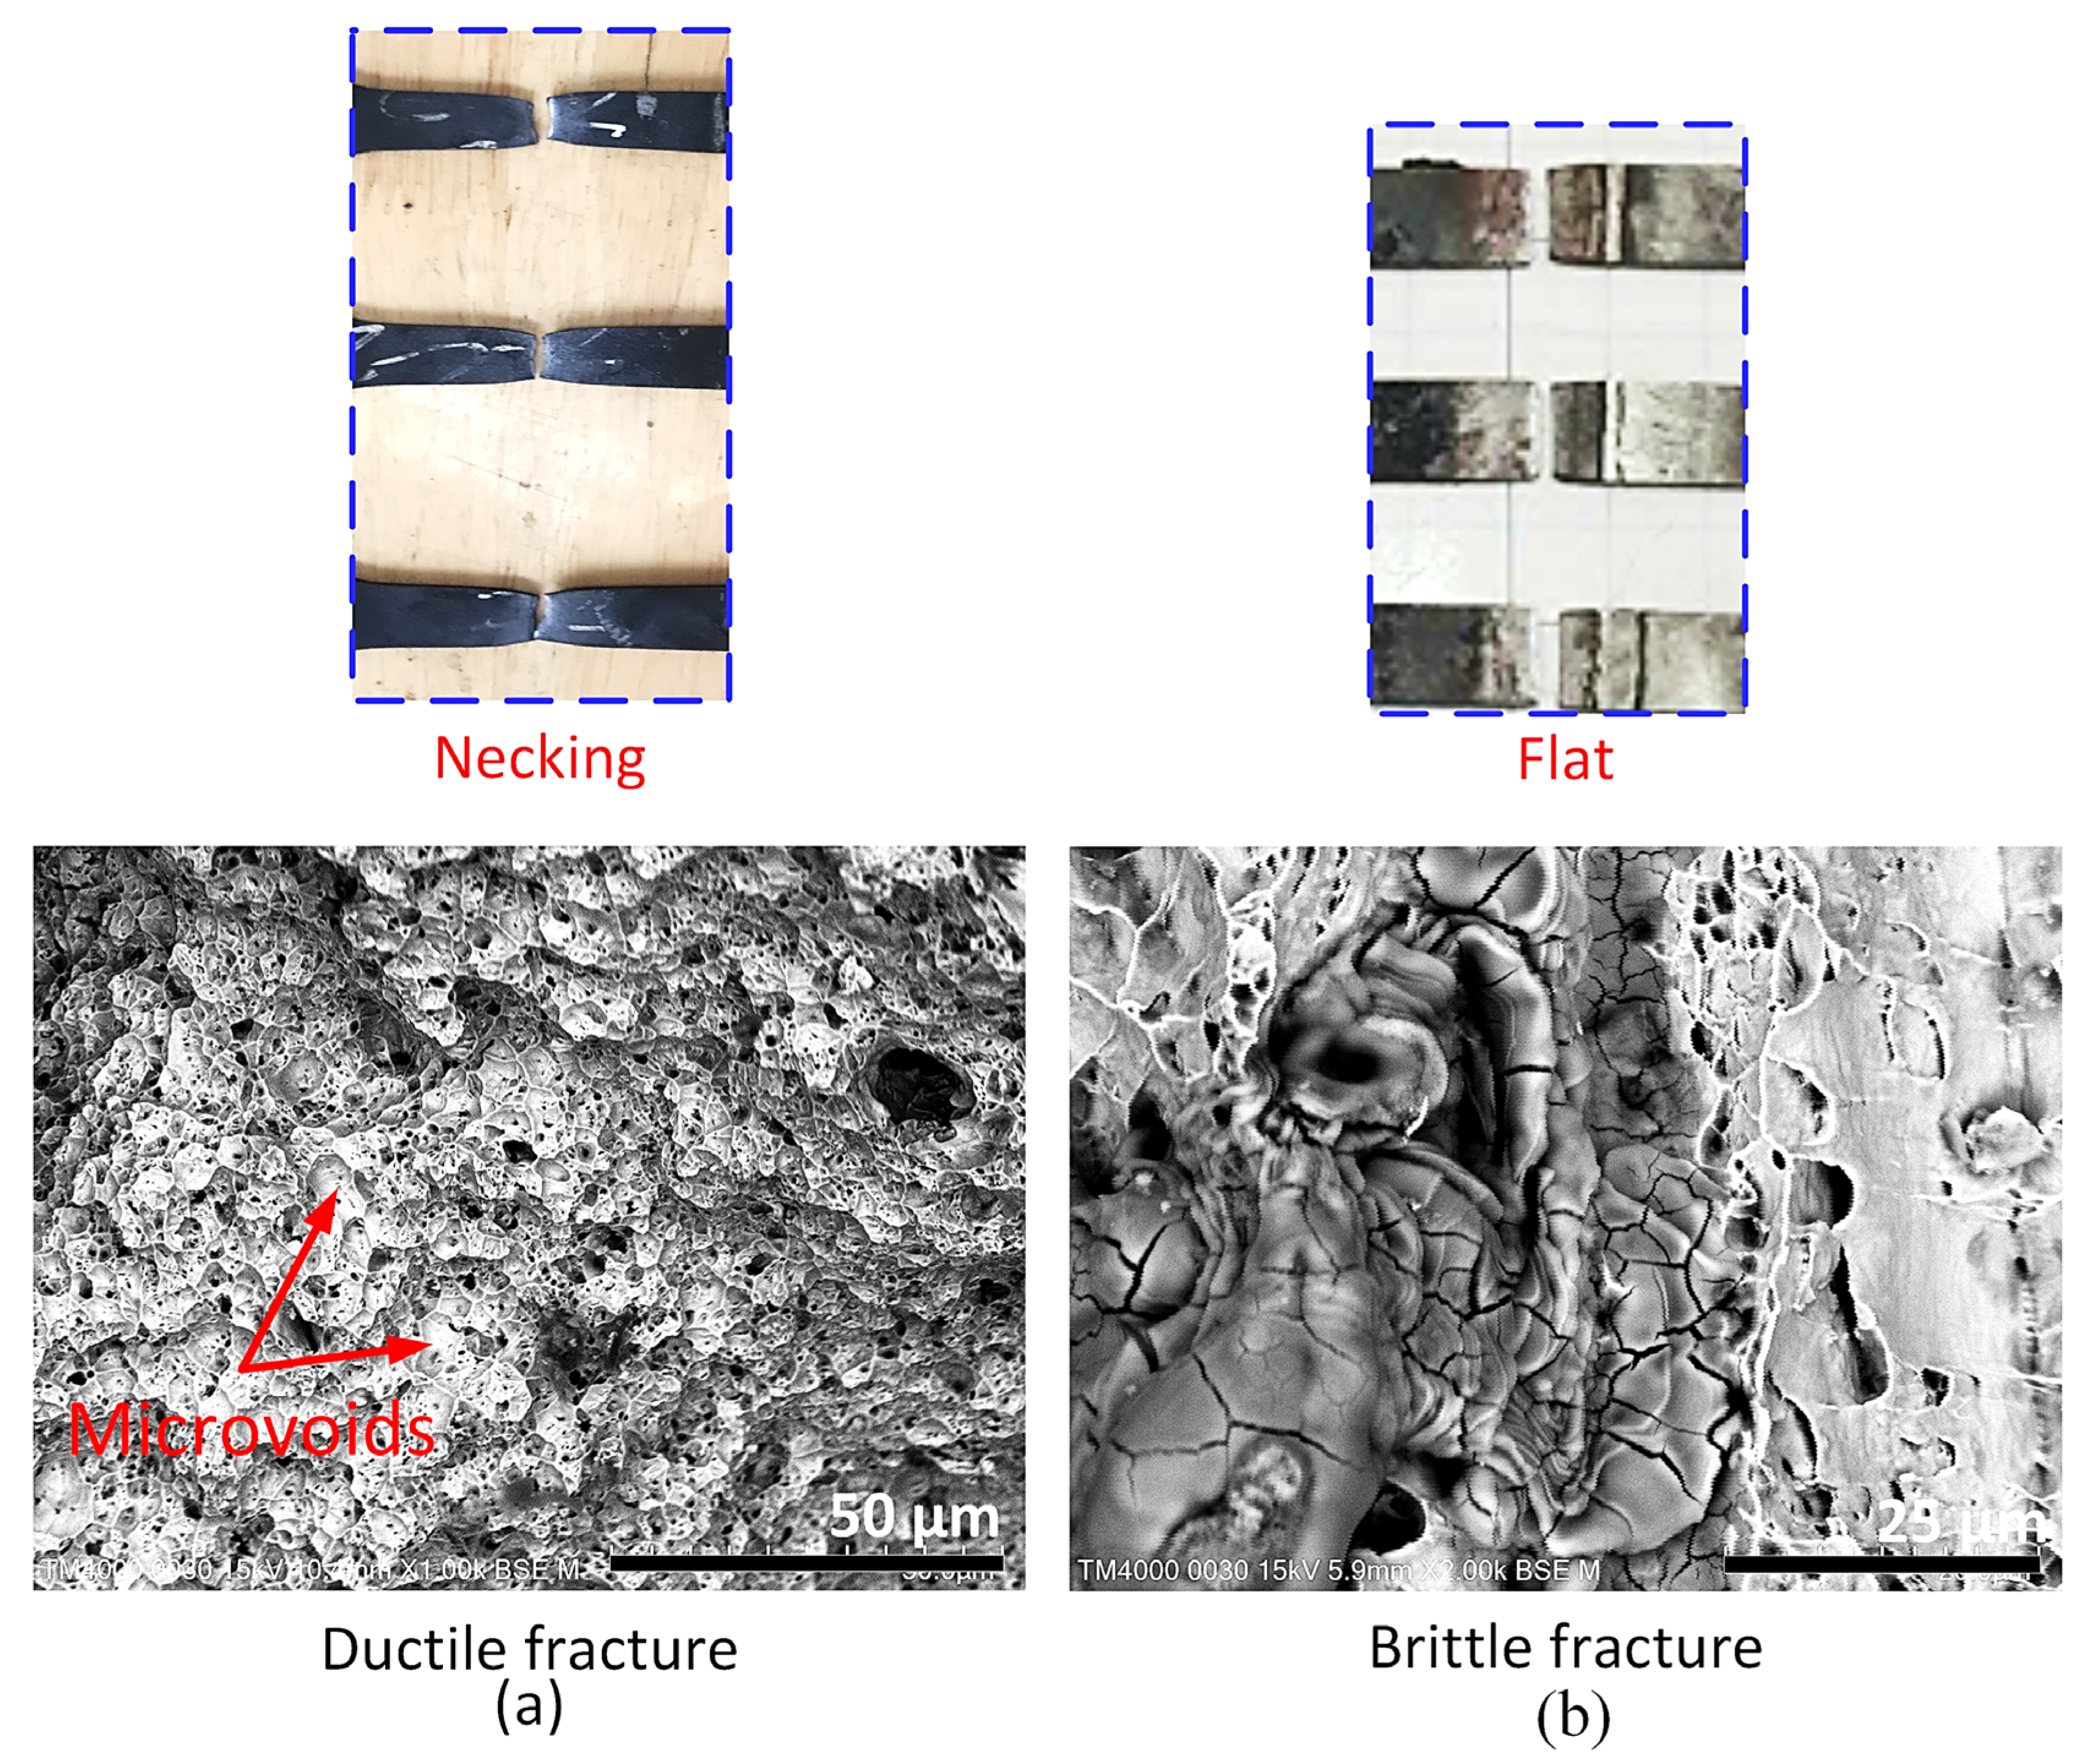
3.1. Penetration and Microstructure Examinations

Firstly, the non-destructive testing method called the penetration test was applied to examine the penetration level of the dissimilar weld at the macro-structure scale. The penetration test helps identify the discontinuities on the weld surface. First, a liquid penetrant is sprayed onto the weld’s surface for a particular period. Following that, any remaining penetrant is removed from the surface. The developer is used to generate test indications by absorbing the existing substances. Consequently, the position and nature of the discontinuity are exposed.
After using the penetrant testing method on 16 weld specimens, the results show that 9 welds were classified as good and 7 as fair, as presented in Table 3 and Figure 4. The first group, samples from No. 8 to No. 16, is classified as good. They have welds with a smooth surface, free of cracks, voids, or any surface defects. The welds demonstrate stability and good quality. No significant defects are presented. There is no remaining color of the dye penetrant around the weld joints. The second group, samples Nos. 1, 2, 3, 4, 5, 6, and 7, are classified as having fair quality. These weld joints have some minor defects; for example, the weld scar has not been completely cleaned, indicated by some marks of dye penetrant color on the surface. This is a concern when connecting SUS304 and SS400, as differences in the thermal characteristics of the two materials can lead to incompatibility.” However, these dissimilar factors do not significantly affect the sustainability and performance of the weld joints. Although there are small defects, the weld still ensures durability and load-bearing capacity. Further investigations will be conducted to examine the characteristics of these dissimilar welds.
Figure 5 shows the microstructures of the dissimilar welding joints between SUS304 and SS400 steels. They can be divided into five zones, including Zones A, B, C, D, and E. Zone B shows the microstructure of SS400 steel, including the pearlite phase on the ferrite matrix. Zone D shows the microstructure of SUS304, showing the austenite phase. The microstructures of these zones are suitable for the chemical composition in Table 1. Moreover, Zone A shows the HAZ on the SS400 steel side, indicating the larger ferritic grain and pearlitic colonies due to the heat-affected phenomenon. The heat input during the welding operation is the reason for these greater structures. Notably, this HAZ zone could strongly impact the mechanical characteristics, as the microstructure is dramatically changed. The HAZ of the SUS304 steel is displayed in Zone E, presenting δ-ferrite dendrites on the austenite matrix as a result of the heat input effect. Zone C shows the weld bead zone, created from AWS ER 308L filler wire, which shows the existence of δ-ferrite on the austenite matrix as the filler wire is melted and cooled down rapidly, a consistent result with Chuaiphan et al.’s [27] report. Notably, the ferrite-forming elements in the filler wire, including Cr, Mo, and Si, also support the δ-ferrite phase formation.

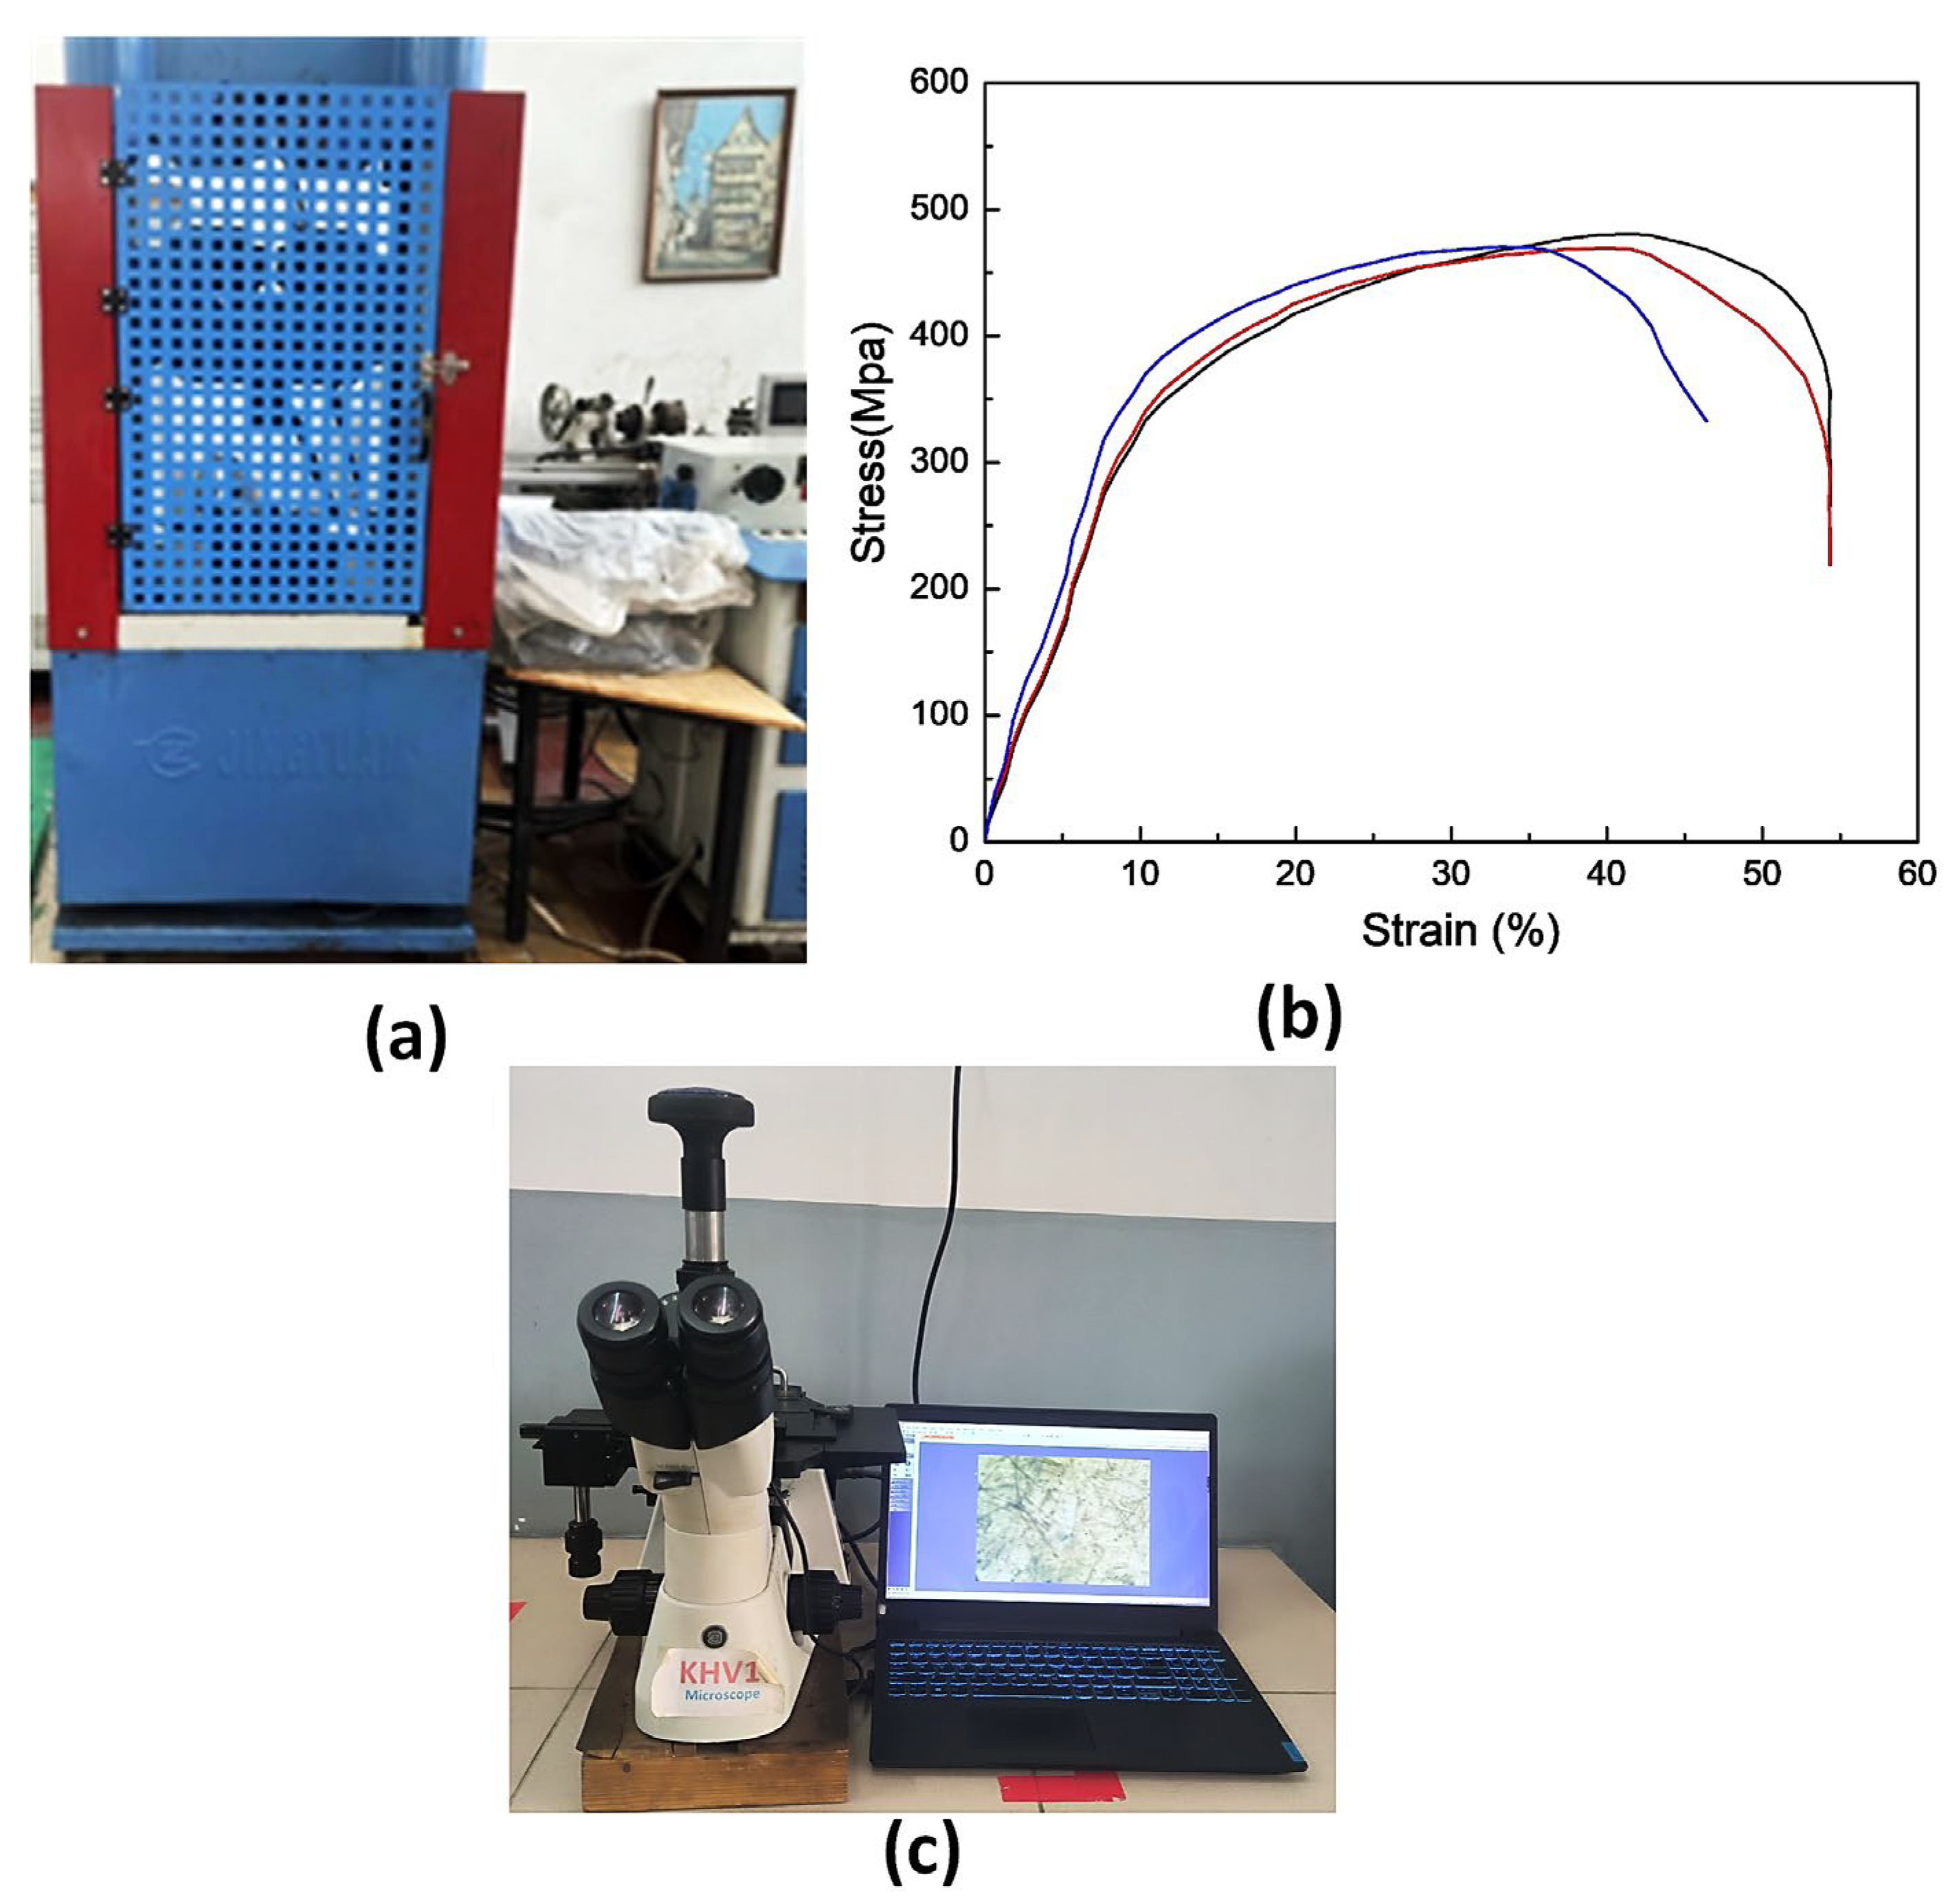
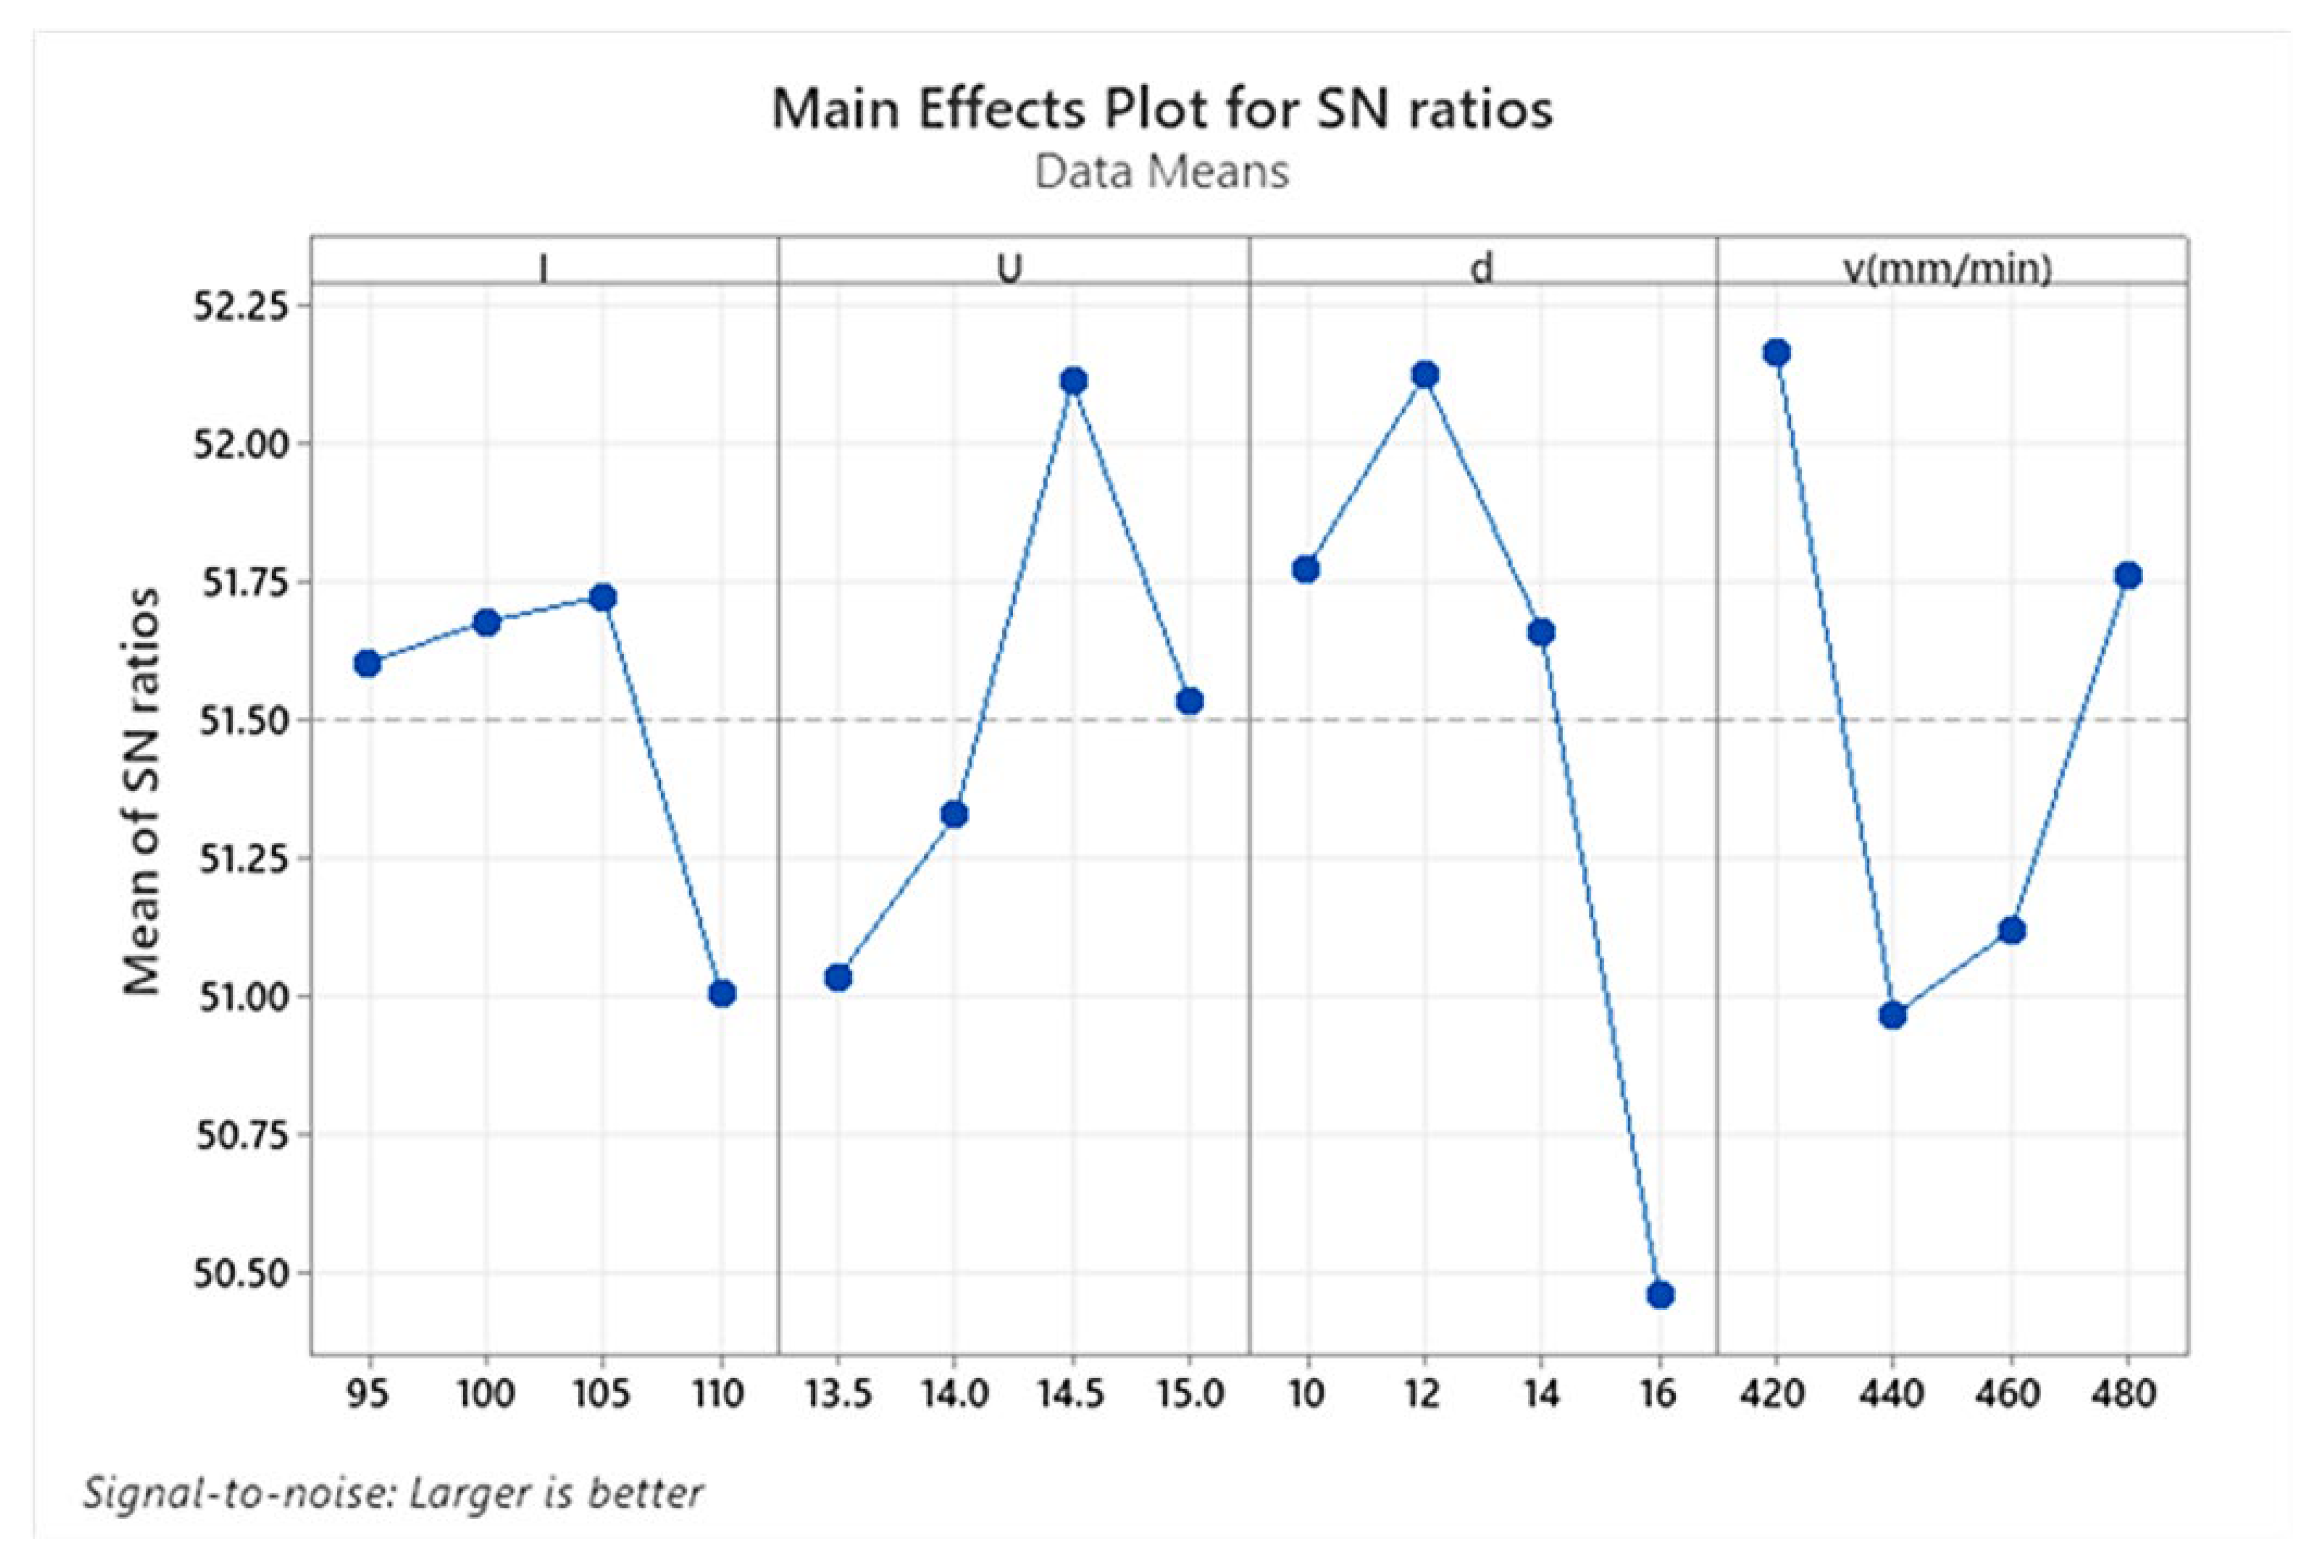
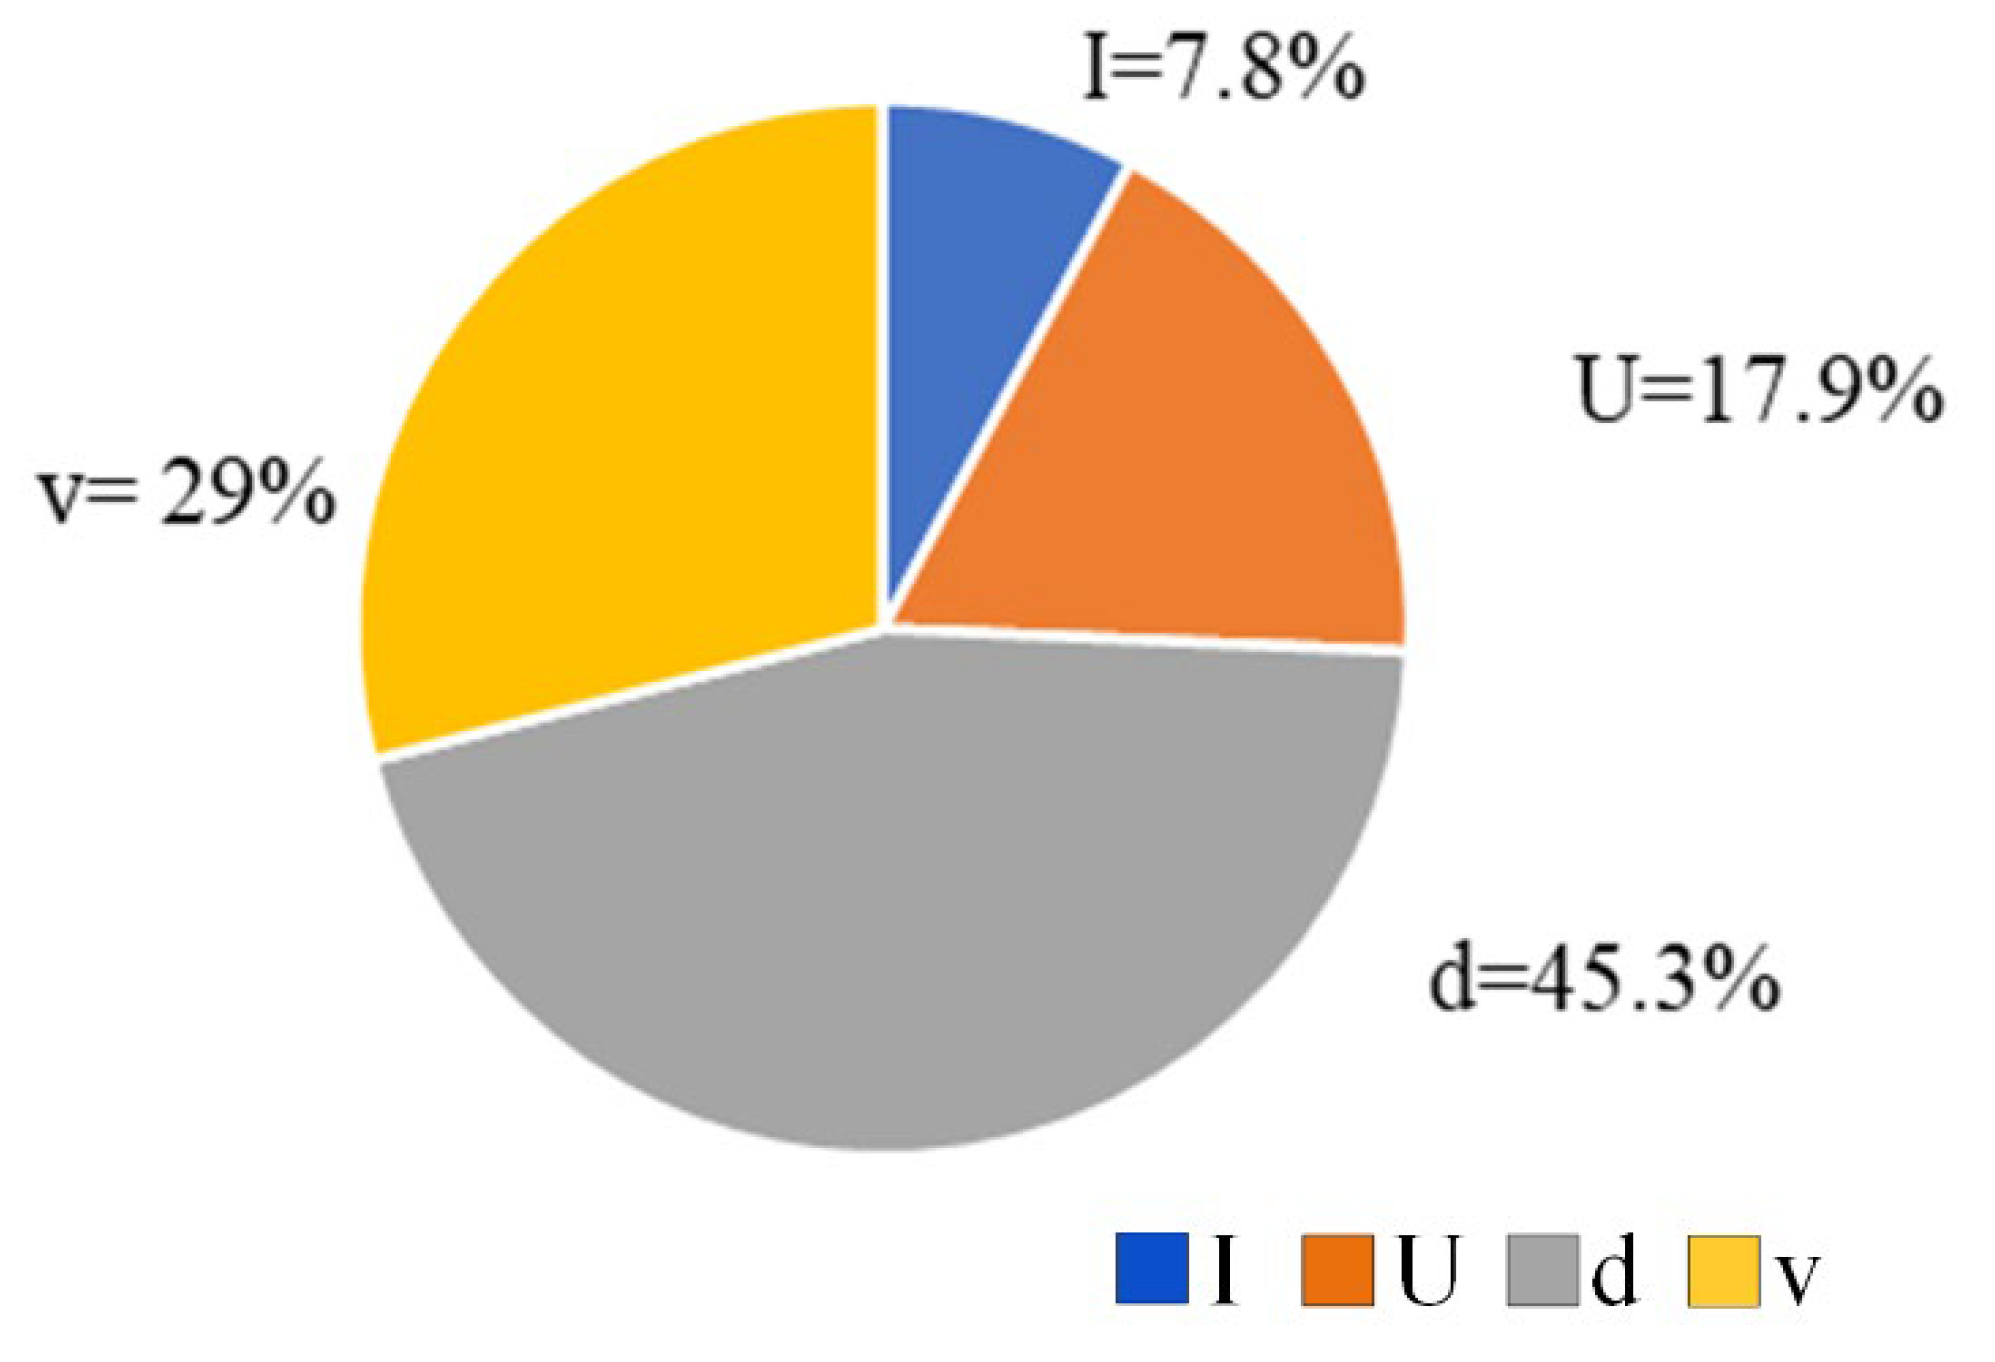
3.2. Taguchi Analysis of Tensile Strength and Confirmation Test

Taguchi optimization is a statistical approach that could enhance product quality. This is a resilient design methodology and is extensively utilized in both industry and academia [28]. Taguchi analysis is conducted by using Minitab 18 software. This study aimed to identify the optimal parameters related to the quality of the weld. Therefore, we decided to choose the S/N ratio (signal to noise ratio) related to the “Larger-the-Better” quality characteristic. In this method, the S/N ratio is one of the key approaches for analyzing the variation in the quality of the weld. The S/N ratio not only evaluates the performance of the process but also helps optimize the parameters, leading to better and more stable quality. The UTS value is typically used following the “Larger-the-Better” S/N ratio as
S / N = 10 log ( 1 n i = 1 n 1 y i 2 )
where yi is the value of the ith measurement, and n is the total number of experiments in the orthogonal array.
Table 4 shows the response table for the S/N ratios of the UTS value. Notably, the stickout value possesses the highest impact, with the highest delta value of 1.62 and ranking first on the UTS value. The welding speed ranks at the second level, while the welding voltage ranks at the third level. The welding current has the lowest impact. It is noteworthy that this ranking order of these parameters is reliable in the experimental ranges. This result is different from the studies of Ogbonna et al. [29] and Ogedengbe et al. [30], which indicated the strongest impact of the voltage and current. The reason for this difference could be due to the differences in the welding parameters and welding steels. Especially, the stronger impact of heat input compared with the heat distribution could also be an important reason for this phenomenon because the voltage and current relate to the heat input, while the stickout relates to the heat distribution on the welding joints [31].
The main effect plot for the UTS value with the “Larger-the-Better” option of the dissimilar weld joint is shown in Figure 6. The optimal parameters are a voltage of 14.5 V, a current of 105 A, a stickout of 12 mm, and a speed of 420 mm·min−1. According to the Taguchi results, the optimal UTS value corresponding to these parameters is 469.2 ± 53.6 MPa or 415.6–522.8 MPa.
The analysis of variance for the dissimilar weld joints’ UTS value between SUS304 and SS400 is shown in Table 5. With an R-squared value of 84.40%, the statistical significance is exceeded by 50%.
The impact level of the welding parameters on the UTS value of dissimilar weld joints between SUS304 and SS400 is presented in Figure 7. In the examination range, the stickout parameter has the highest impact on the tensile strength, contributing 45.3%. The welding speed parameters contribute 29% to the UTS value, followed by the welding voltage with 17.9%. The welding current has the lowest impact level, contributing only 7.8%. The reason for this order could be the surveyed range, where the sensitivity of the heat distribution is higher than the heat input. The heat distribution is strongly dependent on the stickout value [31], while the heat input is related to the current, voltage, and welding speed [29,30]. As a result, depending on the inspection range, the impact order of the welding parameters may vary due to the heat conditions.
The optimal UTS value is indicated to be about 469.2 MPa ± 53.6 MPa, which is slightly higher than the strongest sample (No. 15), achieving a UTS value of 449.9 MPa.
As mentioned above, with the R-squared value of 84.40%, the statistical significance is exceeded by 50%. There may be some potential unaccounted factors, such as the gas flow rate or the shielding gas composition during the experiment process. However, even if this value reaches 100%, the R-squared value is not enough to verify the model. Therefore, a confirmation test was necessary to clarify the statistical significance. To confirm the optimal value, a confirmatory test was carried out, using the above mentioned optimal parameters, which are 105 A, 14.5 V, 12 mm, and 420 mm/min. The confirmation test shows that the average UTS is 445.3 MPa. This value is suitable for the predicted range of 469.2 MPa ± 53.6 MPa, indicating the good prediction quality of the Taguchi approach and good statistical significance.
Interestingly, Huang et al. [32] reported a lower UTS value of 331.5 MPa, as they also investigated a similar welding joint. This UTS value is quite low due to their high heat input level compared with this study. Thamprajamjit et al. [33] reported a high UTS value of 456 MPa; however, they applied plasma arc welding (PAW). PAW is more expensive and pollutedl however, it can create a better HAZ due to the higher heat concentration. Moreover, this UTS value of 445.3 MPa is very close to the strongest sample (No. 15) presented in Table 5, which is 449.9 MPa. Generally, the mechanical properties of the dissimilar SUS304 stainless steel and SS400 steel are successfully improved by the Taguchi method’s optimal parameters.

3.3. Post-Heat Treatment Effects

In the previous section, the UTS value of the optimal welding sample is 445.3 MPa. However, this sample was not collected after the heat treatment process. As described in this section, the optimal welding parameters were applied to create a welding joint for the subsequent post-heat treatment process. After welding, the samples were annealed with a temperature range of 500–700 °C for 30 min, as shown in Table 6. This report selected this range of 500–700 °C on the basis of the results of other studies. For instance, Khan et al. [20] examined the post-heat treatment process of the dissimilar welding joint between AISI 304 and AISI 1020 steel at 600 °C, 630 °C, and 650 °C. They indicated that the best mechanical properties are achieved at 600 °C. Therefore, this report selected a wider range of 500 °C, 550 °C, 600 °C, 650 °C, and 700 °C to examine. Moreover, when applying post-heat treatment to the weld joints, An et al. [34] also revealed that heating at 595 °C results in better tensile strength than 900 °C. The chosen range of 500 °C, 550 °C, 600 °C, 650 °C, and 700 °C examined in this study is therefore appropriate. In further studies, another annealing range could be examined.
The annealing process could improve the welding strength by removing the residual stress and stabilizing the microstructure. The post-heat treatment effect can be divided into two stages: “improving” in the temperature range of 500–650 °C and “decreasing” when the annealing temperature exceeds 700 °C. At 500 °C, the sample obtains the greatest UTS value of 468.9 MPa, having a 5% further improvement compared with the optimal sample without post-heat treatment. Remarkably, this value is quite near the predicted UTS value of the Taguchi method, which is 469.2 MPa ± 53.6 MPa.
In the improving stage, an improvement in the annealing temperature from 500 °C to 700 °C leads to a gradual decrease in the UTS value from 468.9 MPa to 312.1 MPa. At 500 °C, the UTS value reaches its highest peak of 468.9 MPa. At 550 °C, the UTS value also has a high value of 467.3 MPa, a minor reduction from 500 °C. Further increasing the annealing temperature to 600 °C and then 650 °C only leads to a slight reduction in the UTS value to 453.9 MPa and 447.3 MPa, respectively. However, in the decreasing stage, at 700 °C, the UTS value suffers a dramatic drop to 312.1 MPa due to the growth of grain size. In general, annealing at 500 °C helps achieve the highest UTS value of the dissimilar welding joint of SUS304 and SS400 compared with other temperatures and pre-heat treatment samples.
Figure 8 presents the microstructure of the HAZ of SS400 of dissimilar weld joints between SUS304 and SS400 at different annealing temperatures. The HAZ is considered a sensitive region in the welding product, leading to the weakest strength compared with the other regions.
The average grain size of these samples is calculated by applying the intercept method, following the ASTM E112-10 standard [35], using ImageJ software version 1.54g. The average grain size values of these samples at the fracture side are 1.4 μm, 1.9 μm, 2.0 μm, 2.7 μm, 7.1 μm, and 3.3 μm, corresponding to the annealing temperatures of 500 °C, 550 °C, 600 °C, 650 °C, 700 °C, and room temperature. The results show that the samples annealed at 500 °C to 650 °C obtain fine grain sizes, as shown in Figure 8a–d. On the contrary, the grain size of the sample annealed at 700 °C is greatly larger than the other sample. This coarse grain size phenomenon is the reason for the significant reduction in the UTS value of the sample annealed at 700 °C. According to the Hall–Petch equation, the alloy’s strength could be improved by forming a finer grain size. Therefore, the larger grain results in lower strength. In Figure 8g, the fracture of the sample annealed at 700 °C with a coarse grain also presents a brittle type with a flat surface, as the fracture region is less plastically deformed than the other samples. On the contrary, the other samples have a ductile fracture type, with a necking shape. Notably, all the fracture surfaces appear far from the welding joint. The reason for this phenomenon is that they are dissimilar welding joints, created from carbon steel and stainless steel with AWS ER 308L filler wire. The weld bead generated from the stainless steel filler wire is stronger than the SS400 carbon steel part. The SUS304 part is also stronger than the SS400 carbon steel one. In other words, the carbon steel one is the weakest part in the welding joints. Therefore, the fracture surface appears in this area.
Generally, the overheating at 700 °C is the reason for the sudden decrease in the post-heat treatment process.
Besides optical microscopy, the microstructure was also observed via SEM with a greatly higher magnification. Figure 9 shows the SEM fractography of the samples after annealing with ductile fractures and brittle fractures. As mentioned in Figure 8g, the fracture of the sample annealed at 700 °C has a brittle type with a flat surface, as the fracture region only suffers minor plastic deformation. On the other hand, the other samples have a ductile fracture type, with a necking shape. Figure 9a shows that samples annealed at a temperature lower than 700 °C present ductile fractures with dimples and a necking phenomenon. Microvoids are formed when the materials separate at the fracture surface during ductile fracture [36]. These spaces expand throughout the material’s plastic flow and eventually combine to form larger voids. Finally, these voids split at the fracture surface and experience substantial necking, resulting in a unique dimpled texture, as shown in Figure 9a. On the contrary, when annealed at 700 °C, the sample shows a brittle fracture type. A metal brittle fracture requires the fracture plane to either split or traverse around individual metal grains, with transgranular and intergranular cleavage types [37,38,39]. Figure 9b shows the microcracks with dark lines separating the grains of the samples, indicating the possibility of a brittle fracture type. Moreover, there is no necking phenomenon of the ductile type; the fracture sample has a flat surface, indicating a brittle fracture type. Therefore, the fracture type of the sample annealed at 700 °C could be brittle.
This study focused on optimizing the welding parameters, observing the microstructure, and annealing the weld joints. The outcomes could provide the structure–property relations, improving the tensile strength of the weld joints. The corrosion resistance and fatigue behavior are also critical characteristics of the weld joint and need further investigation to apply the welding structure in corrosive environments.

4. Conclusions

This research used Taguchi and then post-heat treatment methods to improve the MIG welding joint between SUS304 stainless steel and SS400 steel with AWS ER 308L filler wire. The results indicate some important notes.
The dendrites of the δ-ferrite phase appear on both the weld bead and the HAZ of the SUS304 side due to the fast cooling of the weld joint and the ferrite-forming element of the filler wire.
In the surveyed range, the stickout parameter has the biggest impact on tensile strength, accounting for 45.3%. The welding speed parameters provide 29% of the UTS value, next to the voltage and current. The heat distribution has a stronger impact than the heat input. Because of the heat issue, the impact order of the welding parameters may vary on the basis of the examination range.
The optimal parameters are a current of 105 A, a voltage of 14.5 V, a stickout of 12 mm, and a speed of 420 mm/min. The optimal UTS value corresponding to these parameters is 469.2 ± 53.6 MPa, while the confirmation UTS value is 445.3 MPa, presenting a successful prediction result.
Annealing at 500 °C could further improve the UTS value of the dissimilar welding joint of SUS304 and SS400 by about 5%, reaching a value of 468.9 MPa, which is close to the optimal UTS predicted via the Taguchi method. Under post-heat treatment with an annealing temperature higher than 700 °C, the welding joints suffer a sudden reduction due to sudden grain size growth. The findings might provide a more useful comprehension of the welding between stainless steel and mild steel.

Author Contributions

V.-T.N., T.T.N. and V.T.T.N.: conceptualization, funding acquisition; V.H.H., T.T.N., V.T.T.N. and V.-T.N.: writing—original draft, investigation; V.-T.N., T.N.T., L.M.T., T.H.M., A.T.N. and D.T.K.Y.: analyzing, visualization, and project administration; H.T.N., P.Q.A., V.T.T.N. and P.Q.B.: writing—review, and editing. All authors have read and agreed to the published version of the manuscript.

Funding

The authors would like to thank the HCMC University of Technology and Education (HCMUTE) for their support of this work through Grant No. T2025-53.

Data Availability Statement

The raw/processed data required to reproduce these findings cannot be shared at this time, as the data also forms part of an ongoing study.

Conflicts of Interest

The authors declare no conflict of interest.

References

  1. Maurya, A.K.; Pandey, C.; Chhibber, R. Dissimilar welding of duplex stainless steel with Ni alloys: A review. Int. J. Press. Vessel. Pip. 2021, 192, 104439. [Google Scholar] [CrossRef]
  2. Mvola, B.; Kah, P.; Martikainen, J.; Suoranta, R. Dissimilar welded joints operating in sub-zero temperature environment. Int. J. Adv. Manuf. Technol. 2016, 87, 3619–3635. [Google Scholar] [CrossRef]
  3. Liu, L.; Ren, D.; Liu, F. A review of dissimilar welding techniques for magnesium alloys to aluminum alloys. Materials 2014, 7, 3735–3757. [Google Scholar] [CrossRef] [PubMed]
  4. Morishige, T.; Kawaguchi, A.; Tsujikawa, M.; Hino, M.; Hirata, T.; Higashi, K. Dissimilar welding of Al and Mg alloys by FSW. Mater. Trans. 2008, 49, 1129–1131. [Google Scholar] [CrossRef]
  5. Fang, X.; Zhang, F. Hybrid joining of a modular multi-material body-in-white structure. J. Mater. Process. Technol. 2020, 275, 116351. [Google Scholar] [CrossRef]
  6. Kah, P.; Shrestha, M.; Martikainen, J. Trends in joining dissimilar metals by welding. Appl. Mech. Mater. 2014, 440, 269–276. [Google Scholar] [CrossRef]
  7. Sadeghian, A.; Iqbal, N. A review on dissimilar laser welding of steel-copper, steel-aluminum, aluminum-copper, and steel-nickel for electric vehicle battery manufacturing. Opt. Laser Technol. 2022, 146, 107595. [Google Scholar] [CrossRef]
  8. Beygi, R.; Carbas, R.; Queiros, A.; Marques, E.A.S.; Shi, R.; Da Silva, L.F.M. Comparative study between stainless steel and carbon steel during dissimilar friction stir welding with aluminum: Kinetics of Al–Fe intermetallic growth. Met. Mater. Int. 2022, 28, 1948–1959. [Google Scholar] [CrossRef]
  9. Yang, Y.; Luo, Z.; Zhang, Y.; Su, J. Dissimilar welding of aluminium to steel: A review. J. Manuf. Process. 2024, 110, 376–397. [Google Scholar] [CrossRef]
  10. Mehta, K.P. A review on friction-based joining of dissimilar aluminum–steel joints. J. Mater. Res. 2019, 34, 78–96. [Google Scholar] [CrossRef]
  11. Kaisheva, D.; Anchev, A.; Dunchev, V.; Kotlarski, G.; Stoyanov, B.; Ormanova, M.; Valkov, S. Electron-Beam Welding Cu and Al6082T6 Aluminum Alloys with Circular Beam Oscillations. Crystals 2022, 12, 1757. [Google Scholar] [CrossRef]
  12. Martinsen, K.; Hu, S.J.; Carlson, B.E. Joining of dissimilar materials. Cirp Ann. 2015, 64, 679–699. [Google Scholar] [CrossRef]
  13. Patel, D.; Jani, S. Techniques to weld similar and dissimilar materials by ATIG welding-an overview. Mater. Manuf. Process. 2021, 36, 1–16. [Google Scholar] [CrossRef]
  14. Neeru, S.S.; Satsangi, P.S. A review on friction stir spot welding of similar and dissimilar materials. In Advances in Engineering Design: Select Proceedings of ICOIED 2020; Springer: Singapore, 2021; pp. 531–541. [Google Scholar]
  15. Singh, D.K.; Sahoo, G.; Basu, R.; Sharma, V.; Mohtadi-Bonab, M.A. Investigation on the microstructure—Mechanical property correlation in dissimilar steel welds of stainless steel SS 304 and medium carbon steel EN 8. J. Manuf. Process. 2018, 36, 281–292. [Google Scholar] [CrossRef]
  16. Kim, J.K.; Hong, S.G.; Kang, K.B.; Kang, C.Y. Microstructure and high temperature properties of the dissimilar weld between ferritic stainless steel and carbon steel. Met. Mater. Int. 2009, 15, 843–849. [Google Scholar] [CrossRef]
  17. Torkamany, M.J.; Tahamtan, S.; Sabbaghzadeh, J. Dissimilar welding of carbon steel to 5754 aluminum alloy by Nd: YAG pulsed laser. Mater. Des. 2010, 31, 458–465. [Google Scholar] [CrossRef]
  18. Naffakh, H.; Shamanian, M.; Ashrafizadeh, F. Dissimilar welding of AISI 310 austenitic stainless steel to nickel-based alloy Inconel 657. J. Mater. Process. Technol. 2009, 209, 3628–3639. [Google Scholar] [CrossRef]
  19. Yao, L.; Ramesh, A.; Xiao, Z.; Chen, Y.; Zhuang, Q. Multimetal research in powder bed fusion: A review. Materials 2023, 16, 4287. [Google Scholar] [CrossRef]
  20. Khan, M.; Dewan, M.W.; Sarkar, M.Z. Effects of welding technique, filler metal and post-weld heat treatment on stainless steel and mild steel dissimilar welding joint. J. Manuf. Process. 2021, 64, 1307–1321. [Google Scholar] [CrossRef]
  21. Jamaludin, S.B.; Mazlee, M.N.; Kadir, S.K.A.; Ahmad, K.R. Mechanical properties of dissimilar welds between stainless steel and mild steel. Adv. Mater. Res. 2013, 795, 74–77. [Google Scholar] [CrossRef]
  22. Ma, H.; Qin, G.; Geng, P.; Li, F.; Fu, B.; Meng, X. Microstructure characterization and properties of carbon steel to stainless steel dissimilar metal joint made by friction welding. Mater. Des. 2015, 86, 587–597. [Google Scholar] [CrossRef]
  23. Liu, Y.; Ge, M.; Zeng, G.; Wang, Z.; Chen, K.; Yin, X.; Wang, W. Process analysis and multi-parameter optimization of 5052 aluminum alloy FSW based on thermo-mechanical coupling and Taguchi method. Sci. Rep. 2025, 15, 335. [Google Scholar] [CrossRef] [PubMed]
  24. Van Huong, H.; Nguyen, T.T.; Nguyen, V.T.; Nguyen, V.T.T. Material Strength Optimization of Dissimilar MIG Welding between Carbon and Stainless Steels. Metals 2024, 14, 1011. [Google Scholar] [CrossRef]
  25. Roy, A.; Ghosh, N.; Mondal, S. Analysis of the multi-criteria optimization strategies for determining the weld quality of dissimilar TIG welding between ferritic and austenitic stainless steel. Int. J. Interact. Des. Manuf. 2024, 18, 1443–1457. [Google Scholar] [CrossRef]
  26. ASTM E290-09; Standard Test Methods for Bend Testing of Material for Ductility. ASTM: West Conshohocken, PA, USA, 2013.
  27. Chuaiphan, W.; Somrerk, C.A.; Niltawach, S.; Sornil, B. Dissimilar welding between AISI 304 stainless steel and AISI 1020 carbon steel plates. Appl. Mech. Mater. 2013, 268, 283–290. [Google Scholar] [CrossRef]
  28. Roy, R.; St, C. Design of Experiments Using the Taguchi Approach 16 Steps to Product and Process Improvement; John Wiley & Sons: Hoboken, NJ, USA, 2001. [Google Scholar]
  29. Ogbonna, O.S.; Akinlabi, S.A.; Madushele, N.; Fatoba, O.S.; Akinlabi, E.T. Grey-based taguchi method for multi-weld quality optimization of gas metal arc dissimilar joining of mild steel and 316 stainless steel. Results Eng. 2023, 17, 100963. [Google Scholar] [CrossRef]
  30. Ogedengbe, T.I.; Abioye, T.E.; Ekpemogu, A.I. Investigation of mechanical properties and parametric optimization of the dissimilar GTAW of AISI 304 stainless steel and low carbon steel. World J. Eng. 2018, 15, 584–591. [Google Scholar] [CrossRef]
  31. e Silva, R.H.G.; dos Santos Paes, L.E.; Barbosa, R.C.; Sartori, F.; Schwedersky, M.B. Assessing the effects of solid wire electrode extension (stick out) increase in MIG/MAG welding. J. Braz. Soc. Mech. Sci. Eng. 2018, 40, 31. [Google Scholar] [CrossRef]
  32. Huang, C.H.; Hou, C.H.; Hsieh, T.S.; Tsai, L.; Chiang, C.C. Investigation of distinct welding parameters on mechanical and corrosion properties of dissimilar welded joints between stainless steel and low carbon steel. Sci. Prog. 2022, 105, 00368504221126795. [Google Scholar] [CrossRef]
  33. Thamprajamjit, J.; Surin, P. Dissimilar metal joining between stainless steel SUS304 and carbon steel SS400 using plasma arc welding process. In Proceedings of the 2018 2nd International Conference on Engineering Innovation (ICEI), Bangkok, Thailand, 5–6 July 2018; IEEE: Piscataway, NJ, USA, 2018; pp. 42–45. [Google Scholar]
  34. An, J.H.; Lee, J.; Kim, Y.S.; Kim, W.C.; Kim, J.G. Effects of post weld heat treatment on mechanical and electrochemical properties of welded carbon steel pipe. Met. Mater. Int. 2019, 25, 304–312. [Google Scholar] [CrossRef]
  35. ASTM E112-10; Standard Test Methods for Determining Average Grain Size. ASTM: West Conshohocken, PA, USA, 2013.
  36. Wciślik, W.; Lipiec, S. Void-induced ductile fracture of metals: Experimental observations. Materials 2022, 15, 6473. [Google Scholar] [CrossRef]
  37. Schroeder, C.J.; Parrington, R.J.; Maciejewski, J.O.; Lane, J.F. (Eds.) Fractography; ASM International: Novelty, OH, USA, 2024. [Google Scholar]
  38. Broek, D. Elementary Engineering Fracture Mechanics; Springer Science & Business Media: Berlin/Heidelberg, Germany, 1982. [Google Scholar]
  39. Anderson, T.L.; Anderson, T.L. Fracture Mechanics: Fundamentals and Applications; CRC Press: Boca Raton, FL, USA, 2005. [Google Scholar]
Figure 1. Welding robot and jig fixture: (a) Panasonic TA-1400G2 robot, and (b) jig fixture.
Crystals 15 00586 g001
Figure 2. Test samples: (a) microstructure samples, (b) penetration test samples, and (c) tensile test samples.
Crystals 15 00586 g002
Figure 3. Testing equipment: (a) tensile test machine, (b) stress–strain diagrams, and (c) microscopy.
Crystals 15 00586 g003
Figure 4. Penetration test results of the dissimilar welding between SUS304 and SS400 steels.
Crystals 15 00586 g004
Figure 5. The surveyed areas of the weld and the affected zones.
Crystals 15 00586 g005
Figure 6. Main effect plot for the UTS value of dissimilar weld joints between SUS304 and SS400.
Crystals 15 00586 g006
Figure 7. The impact level of welding parameters on the UTS value of dissimilar weld joints between SUS304 and SS400.
Crystals 15 00586 g007
Figure 8. The microstructure and fracture region of the HAZ of SS400 of dissimilar weld joints between SUS304 and SS400 at different annealing temperatures: (a) 500 °C, (b) 550 °C, (c) 600 °C, (d) 650 °C, (e) 700 °C, and (f) room temperature. (g) Fracture region.
Crystals 15 00586 g008
Figure 9. SEM fractography of the samples after annealing: (a) ductile fracture and (b) brittle fracture.
Crystals 15 00586 g009
Table 1. Chemical composition of SUS304 and SS400 steels and ER 308L filler wire (%).
StandardsCSiMnPSCrNiCuMo
SUS3040.0440.3811.0950.0360.000717.6947.6690.0370.049
SS4000.1060.0730.5520.01250.00850.02440.03840.0090.0005
AWS ER 308L0.030.3–0.651.0–2.50.03 max0.03 max19.5–229–110.75 max0.75 max
Table 2. The welding parameter levels for the Taguchi method.
Welding ParametersLevel 1Level 2Level 3Level 4
Welding Current, I (Ampere)95100105110
Welding Voltage, U (Voltage)13.51414.515
Welding Speed, v (mm/min)420440460480
Electrical Stickout, d (mm)10121416
Table 3. Taguchi table for welding parameters, average UTS, and penetration evaluation (good: no defects; fair: minor defects).
No.I (A)U (V)Stickout (mm)Speed (mm/min)UTS (MPa)Penetration Evaluation
19513.510420429.6Fair
2951412440373.4Fair
39514.514460394.9Fair
4951516480331.2Fair
510013.512460354.8Fair
61001410480396.9Fair
710014.516420392.9Fair
81001514440388.1Good
910513.514480382.1Good
101051416460340.1Good
1110514.510440373.7Good
121051512420444.4Good
1311013.516440283.9Good
141101414420351.0Good
1511014.512480449.9Good
161101510460359.5Good
Table 4. Response table for the S/N ratio of the UTS value.
LevelS/N Value for the Respective Parameter
IUdv
151.6151.0951.8052.10
251.6651.2452.1150.93
351.6752.0851.5651.17
451.0451.5650.5051.77
Delta0.630.991.621.17
Rank4312
Table 5. Analysis of variance for tensile strength.
SourceDFAdj SSAdj MSF-Valuep-Value
Current (A)31841613.70.420.755
Voltage (V)342701423.30.970.511
Stickout (mm)310,8413613.62.450.240
V (mm/min)369542317.91.570.359
Error344191472.8
Total1528,324
S = 38.3776R-sq = 84.40%R-sq (adj) = 22%
Table 6. Annealing temperature and average UTS value of the dissimilar welding between SUS304 and SS400 steels.
No.Temperature (°C)Average UTS (MPa)
1500468.9
2550467.3
3600453.9
4650447.3
5700312.1
6RT.445.3
Disclaimer/Publisher’s Note: The statements, opinions and data contained in all publications are solely those of the individual author(s) and contributor(s) and not of MDPI and/or the editor(s). MDPI and/or the editor(s) disclaim responsibility for any injury to people or property resulting from any ideas, methods, instructions or products referred to in the content.

