Abstract
TiAl intermetallic alloy is a crucial high-performance material, and its microstructure evolution at high temperatures is closely related to the process parameters. Observing the lamellar structure is key to exploring growth kinetics, and the feature extraction of precipitate phases can provide an effective basis for subsequent evolution studies and process parameter settings. Traditional observation methods struggle to promptly grasp the growth state of lamellar structures, and conventional object detection has certain limitations for clustered lamellar structures. This paper introduces a novel method for high-temperature precipitate phase feature extraction based on the YOLOv5-obb rotational object detection network, and a corresponding precipitate phase dataset was created. The improved YOLOv5-obb network was compared with other detection networks. The results show that the proposed YOLOv5-obb network model achieved a precision rate of 93.6% on the validation set for detecting and identifying lamellar structures, with a detection time of 0.02 s per image. It can effectively and accurately identify γ lamellar structures, providing a reference for intelligent morphology detection of alloy precipitate phases under high-temperature conditions. This method achieved good detection performance and high robustness. Additionally, the network can obtain precise positional information for target structures, thus determining the true length of the lamellar structure, which provides strong support for subsequent growth rate calculations.
1. Introduction
Materials science is an indispensable part of human development. With the continuous advancement of technology, innovation and development of materials play an increasingly important role in our daily lives. The emergence of new materials drives continuous technological innovation, and from metals to alloys, each material provides us with new solutions. Among the various microstructures in TiAl alloys, γ-Ti-Al alloys based on the γ (TiAl) phase have the most promising practical prospects [1]. When controlling the phase transition process to adjust the microstructure of the alloy, it is difficult to observe the precipitation and growth of lamellar microstructures in a timely manner with the naked eye alone. Therefore, finding a method for intelligent morphology detection of precipitated phases to achieve automatic detection and identification is of great significance for studying the mechanisms of lamellar phase transition and the evolution of microstructures.
Traditional experimental observations rely on high-temperature confocal microscopy, where the naked eye captures the precipitation sites of lamellar microstructures. Although these observations can detect the appearance of microstructures at normal magnifications early, it is challenging to observe subtle changes in the microstructure. When using higher magnifications, it becomes difficult to adjust the observation of each site of precipitated microstructures promptly. Therefore, utilizing video data obtained from microscopy and imaging systems for neural network training, followed by algorithmic processing to achieve automatic identification and detection networks, can effectively address this issue. In recent years, TiAl intermetallic compound alloys have garnered extensive attention from scholars worldwide due to their outstanding performance. Ding Xiaofei et al. [2] designed and prepared Ti-Al-Nb ternary alloys, employing various methods to observe their microstructures and distribution, and through some experiments, they demonstrated the close correlation between the alloy’s microstructure and its performance. Wang Hao et al. [3] investigated the solidification microstructure evolution and mechanical properties of Ti-48Al-2Cr-2Nb-(Ni,TiB2) alloys, providing important references for the design and preparation of high-performance, high-temperature alloys. In the field of laser cladding, Li Xiaolei et al. [4] obtained crack-free single-pass deposits through the study of the microstructure and geometry of γ-Ti-Al alloys.
Through an understanding of previous studies, it is evident that the material structure and comprehensive performance of Ti-Al alloys are inseparable from the exploration of microstructures. In previous experiments, optical instruments were mainly used to capture images, which were then manually analyzed, and key structures were extracted by the experimenters. Therefore, conducting intelligent recognition of Ti-Al alloy microstructures has high practical value.
With the rapid development in the fields of computer science and artificial intelligence, computer vision technology based on neural networks has begun to demonstrate superior performance in various domains. Various deep learning networks are gradually being applied in industrial scenarios. In the field of metal smelting, numerous methods utilizing deep learning for detecting internal defects in alloy components have emerged. There are also methods for locating and extracting liquid contours in metal melting states. As algorithms continue to iterate, the optimization and improvement of models make them increasingly suitable for rapid identification of metal phases.
The YOLO series of deep learning networks, with development by researchers [5,6], have steadily improved their detection accuracy and speed. Rotated box detection was initially widely used for ship detection in remote sensing satellite images and performed well on large public datasets [7]. Fu Changhong et al. [8] applied YOLOv5 to the detection of rotated aircraft fasteners, achieving an accuracy of 77.16% on public datasets. Song Huaibo et al. [9] applied deep learning algorithms to detect cracks in maize embryos at different angles and directions.
With the continuous development of metal preparation processes and the upgrading of detection equipment, a large amount of metal microscopic image data has emerged. However, manual identification of these images requires a considerable amount of time and effort and is subject to subjectivity and human error. By utilizing computer vision technology, automated and efficient processing and analysis of microstructure images can be achieved. Technologies such as deep learning can extract features and classify microscopic structure images, accurately identifying various organizational structures and relative contents in metal materials.
The purpose of this study is to construct a high-temperature precipitated phase dataset and find an automatic method for detecting the lamellar microstructures of γ-Ti-Al alloys. High-temperature confocal microscopy is used to obtain video data of γ-Ti-Al alloy lamellar microstructures. High-definition images are selected from slices, and an improved rotated object detection network based on YOLOv5 [10] is used for accurate automatic detection of targets, obtaining length information for the precipitated phases in lamellar microstructures. This will contribute to a better understanding of the relationship between the performance and microstructure of metal materials, providing guidance for the preparation and processing of metal materials.
2. Detection of High-Temperature Precipitated Phases in Alloys Based on YOLOv5-Obb
2.1. Object Detection Algorithm
Object detection is an important task in the field of computer vision, aiming to detect and locate specific objects in images or videos. At present, object detection can be divided into two categories: one-stage and two-stage. One-stage object detection algorithms directly detect objects in input images, with fast speed and good real-time performance. Representative algorithms include YOLOv3 and SSD [11]. On the other hand, two-stage object detection algorithms decompose the object detection problem into sub-problems such as candidate box generation, classification and position regression. Compared with one-stage algorithms, two-stage algorithms have higher accuracy and stability but slower speed. Representative algorithms include Fast-RCNN [12] and SPP-Net [13].
In the exploration of the evolution law of lamellar formation and growth in titanium-aluminum alloy at high temperatures [1], analyzing the organization of precipitation and growth at high temperatures is particularly important for studying the kinetics of alloy phase transition and predicting organizational evolution. However, it is challenging to select and measure the precipitated lamellar structure directly. Experimenters mainly rely on manually capturing frames from video data and then manually measuring them. This method is influenced by subjective factors and has low accuracy. Object detection algorithms based on deep learning provide a new approach for intelligent recognition of high-temperature precipitated phases in titanium-aluminum alloys.
The YOLOv5 algorithm is the latest algorithm in the YOLO series. It has a fast inference speed and strong generalization ability, integrating many excellent technologies in the field of object detection algorithms, such as Mosaic data augmentation, an FPN+PAN structure [14] and adaptive anchor calculation. Therefore, in this study, YOLOv5 was selected as the base network for improvement as an intelligent recognition algorithm for precipitated phases.
2.2. YOLOv5 Network Architecture
The YOLOv5 algorithm is a relatively lightweight detection model in the YOLO series, as shown in Figure 1. The YOLOv5 algorithm mainly consists of four parts: the image input, a backbone network (Backbone), a feature fusion module (Neck) and a detection head (Head). The backbone network adopts a structure based on ResNet and Cross Stage Partial (CSP) [15] to extract image features. Additionally, adaptive domain scaling technology is employed to adapt to objects of different scales, thereby improving the model’s detection accuracy. The Neck module typically adopts some special structures, such as FPN and PAN, which effectively fuse features from different scales, enhancing the algorithm’s detection accuracy and robustness.
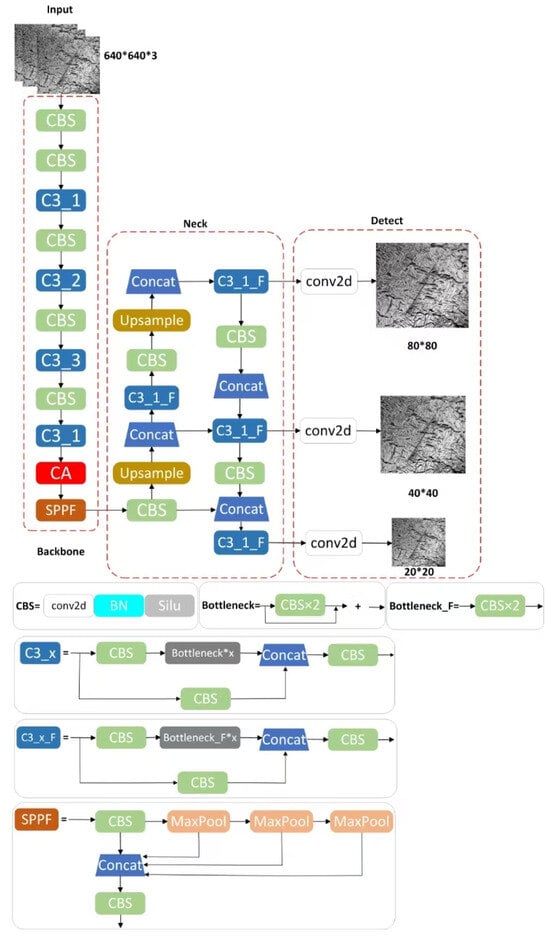
Figure 1.
Network structure diagram.
The detection head is the output layer of the object detection algorithm and is responsible for generating detection boxes and category information for targets. The Head module usually includes two parts: a regression head and a classification head. The regression head predicts the position information of targets, such as the coordinates and sizes of detection boxes, while the classification head predicts the category information of the targets. Different convolutional layers can be combined to concatenate and output heads of different sizes. The CBS module consists of convolutional layers, BN layers [16] and SiLU activation functions [17]. The role of the CBS module is to enhance the nonlinear ability and feature representation ability of convolutional layers, increase the network’s expressive power and enable it to better adapt to various object detection tasks. The C3 module consists of three convolutional layers, with each convolutional layer containing BN layers and SiLU activation functions. The SPPF module is used for spatial pyramid pooling and is composed of pooling layers of different scales, each with different stride and kernel sizes. The SPPF module extracts features of different scales and can reduce the dimensionality of features without changing the size of the feature maps, thereby improving the network’s detection accuracy and efficiency.
2.3. Model Improvement and Optimization
2.3.1. Input End
Appropriate annotation methods can reduce redundant information at the input end, better constrain the direction of training the network and reduce the training volume and convergence time of the network. The initial YOLOv5 network generates horizontal rectangular detection boxes to predict the position information and categories of targets. However, the lamellar structure of γ-Ti-Al alloy presents a crack-like elongation and layer distribution, with a high degree of randomness in the growth direction. Traditional horizontal rectangular boxes are not suitable. Therefore, using rotated rectangular boxes for the recognition of precipitated phases in γ-Ti-Al is conducive to further research and analysis. The annotation effects of the two types of rectangular boxes are shown in Figure 2. From the figure, it can be seen that horizontal rectangular boxes cause a large number of overlapping target boxes, and even large target boxes completely surround small target boxes, resulting in a large amount of redundant information. However, using rotated rectangular boxes can effectively avoid this problem.
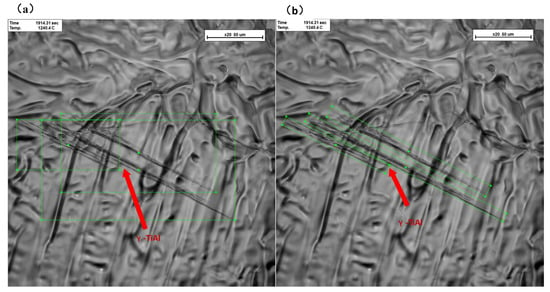
Figure 2.
Comparison of two types of rectangular box annotations. (a) Original rectangular box. (b) Rotated rectangular box.
The difference between rotated and horizontal boxes lies in the introduction of angle features. Common angle regression methods include the following:
- OpenCV-defined method: The angle is defined as the acute angle between the rectangular box and the x axis. One side of the box forms the angle, denoted as “w”, while the other side is “h”. Therefore, the angle range is [−90, 0].
- Long edge-defined method: The angle is defined as the angle between the long edge of the rectangular box and the x axis. Therefore, the angle range is [−90, 90], as shown in Figure 3.
 Figure 3. Common angle regression methods: OpenCV definition method (a) and long edge definition method (b).
Common angle prediction methods may encounter boundary issues, where the angle predicted by the network deviates from the true angle of the box. In Figure 4, the solid line box represents the true box, and the dashed line box represents the predicted box. Due to boundary effects, the true angle β of the target is −90°, while the predicted angle is α + β. The deviation of the angle obtained from network training is α-2β, whereas the true difference is α. Loss increases at the boundary where there is periodic variation, leading to reduced fitting accuracy of the network.
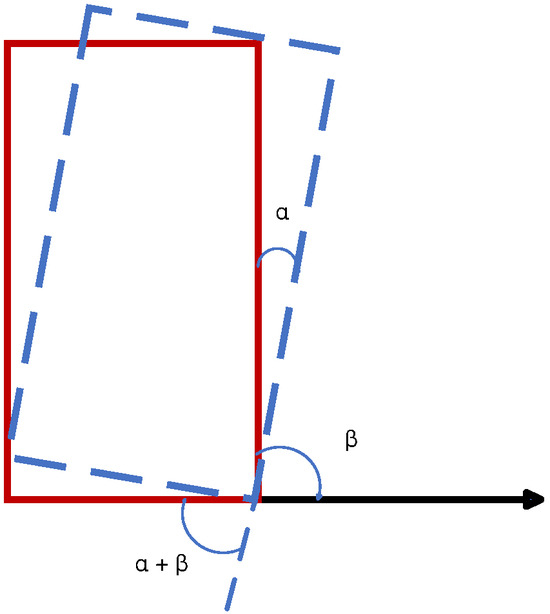
Figure 4.
Angle issue of rotation box.
A circular smooth label (CSL) [18], based on regression algorithms, can address this issue by smoothing the angle prediction. As shown in Figure 5, the CSL is a method for angle prediction designed to tackle the periodicity problem. Its formula is as follows:
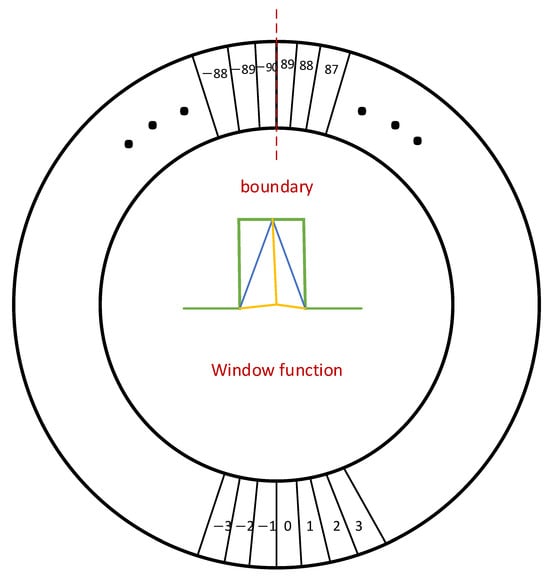
Figure 5.
Circular label.
In the formula, g(x) is the window function, and r is the window radius.
The circular smooth label (CSL) method transforms the regression problem into a classification problem by segmenting angles based on a circular structure, as shown in Figure 5. It balances the angle problem between true and predicted boxes. By combining the long edge-defined method with a CSL, it addresses the angle issues that may arise during network training for rotated rectangular boxes.
The label file format for rotated boxes annotated with the long edge-defined method is as follows: [name, xc, yc, w, h, θ], where “name” is the name of the target category, “xc” and “yc” are the x and y coordinates of the center point of the rotated box, respectively, “w” and “h” are the length and width of the rectangular box, respectively, and “θ” is the angle between the long edge of the rectangular box and the x axis.
This combined approach effectively addresses the angle problems that may arise during network training for rotated rectangular boxes by using the long edge-defined method for annotation.
In the YOLOv5n network, random affine transformations such as rotation and shear can indeed alter the angles of the targets, causing inconsistencies between the annotated labels and the transformed images. Therefore, it is advisable to disable rotation and shear transformations before feeding the images into the network. This ensures that the network receives consistent and accurate input data, leading to more reliable detection results.
2.3.2. Attention Mechanism Module
Unlike conventional rectangular box detection, rotated rectangular boxes incorporate angle features during prediction. However, angle-related issues can introduce deviations in the prediction results, affecting the accuracy. Therefore, after the SPPF module, a channel attention (CA) module [19] is added to the network architecture.
The CA module learns the correlations between different channels in the feature maps, dynamically adjusting the weights of each channel to enhance the representation ability of important features and suppress irrelevant features’ interference. As shown in Figure 6, by observing the class activation map (CAM) heatmap with the inclusion of the attention mechanism, it can be noted that the model’s focus on different parts of the image is indicated by the heatmap’s color intensity. With the addition of attention, the network model pays more attention to recognizing the target.
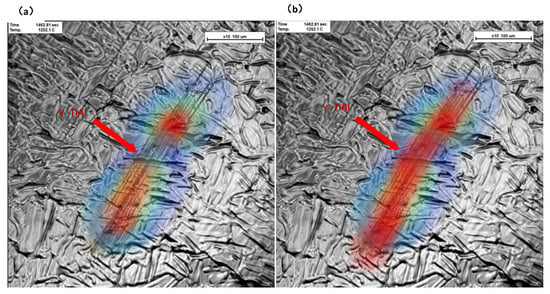
Figure 6.
Lamellar microstructure CAM heatmap (a) after insertion (b).
2.3.3. Rotated Box Non-Maximum Suppression (NMS)
Traditional NMS algorithms only consider the degree of overlap between the predicted boxes and target boxes without taking into account the angle features. Therefore, Skew-NMS [20] is adopted for non-maximum suppression to obtain the final rotated predicted boxes. The implementation process is as follows:
- Sort the output predicted boxes in descending order based on their scores.
- Iterate through these predicted boxes and compute the intersection points with the remaining predicted boxes. Based on these intersection points, calculate the intersection over union (IOU) for each pair of predicted boxes.
- Filter out the predicted boxes with an IOU greater than a preset threshold, retaining the predicted boxes that fall within the threshold range.
Skew-NMS considers the angle features of the rotated boxes during non-maximum suppression, effectively filtering out redundant predicted boxes and retaining those that meet the criteria for accuracy.
2.3.4. Activation Functions
The activation function, loss function, intersection over union (IoU) loss and activation function [21,22] constitute three crucial components of YOLO. The loss function encompasses three types—classification loss, localization loss and confidence loss—with the total loss function being the sum of these three. The IoU serves as a significant evaluation metric in object detection, quantifying the proximity between the predicted bounding box and the ground truth position. In YOLOv5, there are three IoU-improved loss functions: the CIoU, DIoU and GIoU [23].
The IoU represents the overlap between the predicted box and the ground truth box in object detection. Given A as the ground truth box and B as the predicted box, the expression for the IoU is as follows:
In general, each neuron in a deep learning model requires an activation function to transform input signals into output signals. The role of activation functions is to introduce nonlinearity, enabling the model to learn complex nonlinear relationships. The rectified linear unit (ReLU) function is one of the most commonly used activation functions. Its formula is as follows:
The rectified linear unit (ReLU) activation function is widely used in deep learning due to its simplicity and efficiency. It outputs the input value when the input is greater than zero, and it outputs zero when the input is less than or equal to zero. Therefore, it offers advantages such as computational simplicity and preventing gradient vanishing, which can effectively accelerate the training process. However, the ReLU function also has some drawbacks. Firstly, when the input is negative, the derivative is zero, which may result in certain neurons never being activated, a phenomenon known as “neuron death”. Additionally, the ReLU function is not smooth when dealing with negative inputs, which may lead to oscillations and noise.
The Sigmoid function is an S-shaped curve defined by the following mathematical formula:
It outputs values in the range between 0 and 1, making it suitable for the output layer of binary classification problems. However, due to the complexity of its exponential computation, it tends to have a slower computational speed. Additionally, when the absolute value of the input is extremely large or extremely small, the derivative approaches zero, leading to the vanishing gradient problem, which can affect the training effectiveness of the model.
The Swish function is a novel activation function which was proposed in recent years. It is defined by the following formula:
Compared with the ReLU and Sigmoid functions, the Swish function exhibits a smoother curve and better approximates the standard normal distribution. Additionally, it possesses lower computational complexity and a faster training speed. Consequently, the Swish function is widely regarded as an excellent activation function and is adopted in this paper for use in neural networks.
3. Experiment and Result Analysis
3.1. Experimental Equipment and Acquisition of Layered Tissue Images
The focus of this study is on the γ-TiAl alloy high-temperature precipitate phase. Utilizing a combination of high-temperature in situ observation and high-temperature quenching, the lamellar microstructure of the alloy was observed and characterized at both macroscopic and microscopic levels using scanning electron microscopy, the electron backscatter diffraction (EBSD) technique and transmission electron microscopy (TEM). The morphological characteristics of the precipitated lamellar structures are illustrated in Figure 7, which presents electron microscopy images acquired at magnifications of 5×, 10×, 20× and 35×. Both the in situ recorded videos and subsequently segmented image frames maintained a uniform resolution of 1024 × 1024 pixels. The lamellar structures typically manifest as clustered assemblies, exhibiting distinct needle-like protrusive morphologies that grow along specific crystallographic orientations, demonstrating directional preferential growth behavior. In Figure 7, A1, A2, A3 and A4 represent some lamellar structures under various magnification ratios.
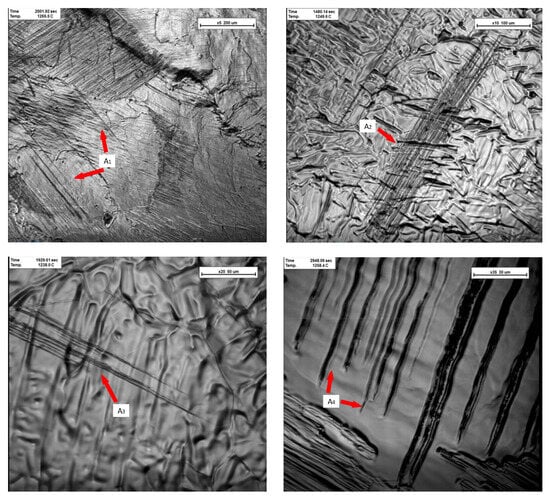
Figure 7.
Images of lamellar structures at different magnifications (from the upper left to the lower right: 5×, 10×, 20× and 35×).
To systematically document the precipitation behavior of γ lamellae, a computerized imaging system was deployed to record the in situ evolution process within the 1260–1280 °C temperature regime. The obtained time-lapse videos served as the primary data source, from which individual frames were extracted to generate a series of 1024 × 1024 pixel grayscale images, comprehensively capturing the entire precipitation process from the initial nucleation to the complete coverage of the metal surface by the lamellar microstructure. Following a meticulous manual curation process to eliminate redundant and highly similar images, data augmentation techniques were applied to expand the dataset, resulting in an initial database consisting of 800 representative images. This dataset was subsequently partitioned into training (80%), validation (10%) and testing (10%) subsets. The training and validation subsets were utilized iteratively for model training and performance evaluation during each training epoch, while the testing subset was reserved for the final, unbiased assessment of the trained model’s detection accuracy. Data augmentation techniques generate new images by applying transformations such as rotation, cropping, splicing, translation and color adjustment to original images. By increasing the dataset size and diversity, these methods enhance the generalization capability of deep learning networks, effectively mitigating overfitting and improving model robustness. For YOLOv5-obb network training, mosaic data augmentation is applied during image input, a technique first introduced in the YOLOv4 architecture. As illustrated in Figure 8, this approach involves specific mosaic-style image processing to augment training data, optimizing model performance through enhanced input variability. The training and validation sets are used for model training and evaluation after each training epoch, while the testing set is reserved for the final evaluation of the detection performance of the trained model.
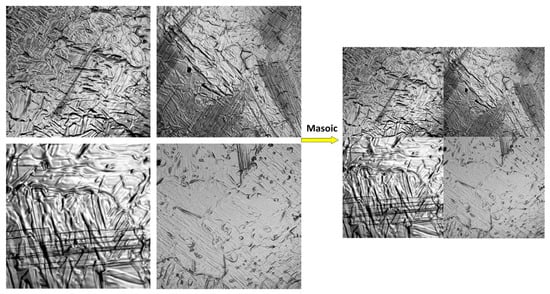
Figure 8.
Mosaic image enhancement technique.
The dataset is manually annotated using the rolabelImg annotation tool to obtain corresponding label files containing information about the features and coordinates of the target microstructures. To ensure the availability of the annotated dataset and mitigate subjective errors in manual annotation, the dataset is annotated by three researchers with computer vision expertise in the field of laser cladding.
3.2. Experimental Environment Set-Up
The experiment was conducted on a Windows 10 64-bit operating system. The software environment utilized was a Python 3.9 virtual environment created with Anaconda, and the deep learning framework employed was PyTorch.
The hardware set-up consisted of an Intel i3-12100F 3.30 GHz CPU with 16 GB of RAM and an NVIDIA GeForce RTX 2060 GPU with 6 GB of VRAM.
The experimental hyperparameters were configured as follows: batch size = 4, epochs = 200 and learning rate = 0.003. The cosine annealing [24] scheduling strategy was adopted to adjust the learning rate, and the stochastic gradient descent (SGD) optimizer was used.
3.3. Evaluation Metrics
In this experiment, the mean average precision (mAP) [25] was chosen as the performance evaluation metric for the model. Precision (P) and recall (R) are the key components of mAP, and their formulas are as follows:
In the formula, true positive (TP) represents the number of truly detected target boxes; false positive (FP) is the number of target boxes with a loss function less than 0.5; and false negative (FN) is the number of undetected target boxes.
The mean average precision (mAP) is derived from the average precision (AP) values, and its formula is as follows:
3.4. Results Analysis
In this experiment, the neural network was trained for 200 iterations. The changes in various parameters obtained during network training are depicted in Figure 9. During the first 100 iterations, the precision (P), recall (R) and mean average precision (mAP) exhibited a gradually oscillating upward trend. The convergence speed of the loss value was relatively fast. Near iteration 150, the metrics began to stabilize, with the final network model achieving stable P, R and mAP values of 93.6%, 81.5% and 88.2%, respectively. The loss value fluctuated around 0.06.
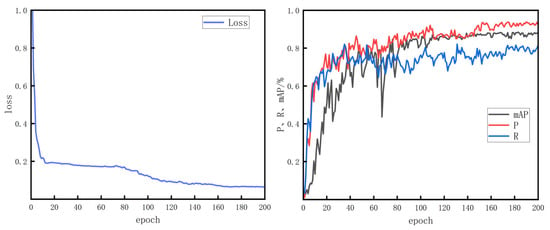
Figure 9.
Training results of lamellar microstructure network.
3.5. Calculation of γ Phase Length
By examining the relationship between the magnification scale shown in the scanning electron microscope (SEM) images and the number of pixels, the actual lamellar length scale could be determined to be 0.47 μm/pixel. When selecting a clear key frame from the video, as shown in the Figure 10, the YOLOv5-obb network detected the lamellar microstructure and extracted the contour features. The number of contour pixels obtained was calculated in proportion to the scale, resulting in lamellar lengths of 95.71 μm and 71.43 μm for the longer and shorter ones, respectively.

Figure 10.
Contour feature extraction and scale pixel-level measurement of lamellar microstructure.
3.6. Comparison of Different Rotation Detection Network Algorithms
To ensure the accuracy of the experiment and validate the detection performance, as well as evaluate the detection effectiveness of the YOLOv5 network on lamellar microstructures, three rotation detection networks, namely SASM [26], S2A-Net [27] and ReDet [28], as well as YOLOv5 were trained on the same dataset under identical experimental conditions. Subsequently, the trained models were evaluated using the test set. The detection performance of four detection networks and YOLOv5-obb is shown in the following table.
According to the Table 1, the detection accuracies (AP) of SASM, S2A-Net, ReDet, YOLOv5 and YOLOv5-obb for lamellar microstructures were 72%, 71%, 81%, 88% and 88%, respectively. The average detection times per image were 0.21, 0.24, 0.49, 0.03 and 0.02 s, respectively. When comparing the experimental results, YOLOv5-obb achieved 15.7%, 16.8% and 7.05% higher AP values than SASM, S2A-Net and ReDet, respectively. Its average detection time per image was 0.19, 0.22 and 0.47 s faster than the three respective networks, and compared with the traditional YOLOv5 network detection results, there was not much difference.

Table 1.
Performance comparison and analysis table of different network models.
These results indicate that in the intelligent detection of linearly clustered γ-lamellar microstructures, YOLOv5-obb exhibited better overall performance compared with the other network algorithms. It can effectively meet the requirements of detection accuracy while consuming relatively less computational resources. Additionally, it demonstrated strong model compatibility, making it suitable for rapid identification of γ-lamellar microstructures.
3.7. Comparison of Detection Results Between Bounding Boxes and Rotated Bounding Boxes
To better observe the advantages and performance of the rotated bounding boxes, the original dataset was separately trained under the same experimental conditions on the YOLOv5n network and the YOLOv5-obb network. Subsequently, the trained networks were evaluated on the test set for model assessment. The obtained results were compared with those of the S2A-Net, ReDet and YOLOv5-obb networks for detecting the same images. Figure 11a presents the detection results of YOLOv5n with the original rectangular bounding boxes, while Figure 11b–d depicts the detection results of the S2A-Net, ReDet and YOLOv5-obb networks with the rotated bounding boxes, respectively. From the rectangles shown in the figures, it can be observed that for detection targets with a large aspect ratio and an unfavorable distribution orientation, the adoption of rotated bounding boxes enabled more accurate identification of slice orientation information without being influenced by other tissues. The S2A-Net and ReDet networks exhibited issues such as missed detections and angular deviations, while using regular rectangular bounding boxes for detection resulted in problems such as tissue occlusion and inaccurate identification. YOLOv5-obb demonstrated superior detection accuracy, and the rotated bounding boxes could more accurately reflect the actual length of slice tissue, providing strong support for subsequent measurements of the slice length.
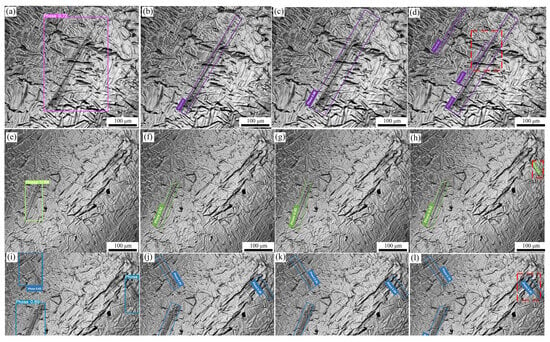
Figure 11.
Comparison of four types of network detection effects for the lamellar microstructure. (a,e,i) YOLOv5n; (b,f,j) S2A-Net; (c,g,k) ReDet; (d,h,l) YOLOv5-obb.
Compared with traditional metallographic analysis methods, the approach proposed in this study enables efficient and accurate identification and extraction of lamellar structures, offering a novel methodology for observing the microstructural evolution of titanium-aluminum alloys at high temperatures. As shown in Table 2, our method demonstrated significant technical advantages in high-temperature phase transformation research, delivering objective results independent of human subjectivity. Building upon this foundation, future studies could implement dynamic tracking of lamellar structures and measure their growth rates.

Table 2.
Comparison of various indicators between traditional detection and YOLO network.
4. Conclusions
In this study, by combining object detection technology and machine learning algorithms, we conducted in-depth research on the lamellar microstructure of γ-TiAl alloy. Utilizing the YOLOv5-obb network, we established a database for lamellar microstructures and identified microscopic structures. Our aim was to explore its organizational evolution laws, phase transition mechanisms and guidance role in alloy design and improvement under high-temperature conditions.
Through extensive learning and training on large datasets, the YOLOv5-obb object detection algorithm achieved efficient and accurate identification of the γ-TiAl alloy’s lamellar microstructure. The experimental results demonstrate that the model’s mean average precision reached 88.2%, avoiding subjective interference from traditional manual observation methods and ensuring the objectivity and reliability of the observation results. Furthermore, machine learning technology possesses the capability to handle large-scale data, enabling rapid and effective processing of a large number of alloy lamellar microstructure images and providing reliable means for a more comprehensive understanding of the alloy’s structural characteristics and evolution laws.
The application of machine learning object detection technology not only improves research efficiency and reduces labor and time costs but also uncovers hidden patterns and information, providing important clues and guidance for a deeper understanding of the alloy’s performance and stability. Therefore, the application of machine learning object detection technology is expected to promote further progress in the study of the high-temperature oxidation behavior of γ-TiAl alloys, providing important support for alloy design and improvement.
Future research directions could further explore the application of machine learning algorithms in the study of alloy structural evolution laws and phase transition mechanisms, combined with experimental verification, to enhance the understanding and predictive capabilities of high-temperature oxidation behavior in alloys.
Author Contributions
Writing—review and editing and data curation, X.L. (corresponding author); writing—original draft, data curation and resources, C.H.; investigation, S.Z.; supervision, L.C. (Linlin Cui), S.G., B.Z., Y.C. (Yinghao Cui), Y.C. (Yongqian Chen), Y.Z., L.C. (Lujun Cui) and C.X. All authors have read and agreed to the published version of the manuscript.
Funding
This research was funded by the key Research and Development and Promotion Projects in Henan Province [242102221033 and 242102231026], the Postgraduate Education Reform and Quality Improvement Project of Henan Province [YJS2025XQLH24 and YJS2025AL60], the Postgraduate Education Quality Improvement Project of Zhongyuan University of Technology [JG202524], the Key Research and Development Program of henan Henan province Province [241111220100], a Basic basic research project of key scientific research projects in Henan Province [24ZX004], and the key scientific research projects in Henan Province [25CY044].
Data Availability Statement
All the data generated during this study are included in this article.
Acknowledgments
This study was supported by Key Research and Development and Promotion Projects in Henan Province, the Postgraduate Education Reform and Quality Improvement Project of Henan Province, the Postgraduate Education Quality Improvement Project of Zhongyuan University of Technology, the Key Research and Development Program of Henan Province, a basic research project of key scientific research projects in Henan Province, and key scientific research projects in Henan Province. We would like to thank everyone who supplied help.
Conflicts of Interest
The authors declare that they have no known competing financial interests or personal relationships that could have appeared to influence the work reported in this paper.
References
- Li, X. Study on the Formation and Growth Behavior of Lamellae in TiAl Alloy. Ph.D. Thesis, Northwestern Polytechnical University, Xi’an, China, 2018. [Google Scholar] [CrossRef]
- Ding, X.; Zeng, B.; Xie, Z.; Lin, A.; Tan, Y. Effect of Microstructure on Mechanical Properties of Ti-Al-Nb Ternary Alloys. Rare Met. Mater. Eng. 2012, 41, 38–41. [Google Scholar]
- Hao, W.; Guangming, X.; Yi, J.; Yao, H.; Wang, T. Study on Solidification Microstructure Evolution and Mechanical Properties of Ti-48Al-2Cr-2Nb-(Ni, TiB2) Alloy. Rare Met. Mater. Eng. 2022, 51, 2316–2322. [Google Scholar]
- Li, X.; Yuan, G.; Zhang, K.; Cui, L.; Xu, C.; Zhang, G.; Guo, S. Microstructure and Properties of Laser Metal Deposited γ-TiAl Alloy. Non Ferr. Met. Eng. 2022, 12, 25–30. [Google Scholar]
- Redmon, J.; Farhadi, A. YOLOv3: An incremental improvement. arXiv 2018, arXiv:1804.02767. [Google Scholar]
- Ge, Z.; Liu, S.; Wang, F.; Li, Z.; Sun, J. YOLO x: Exceeding YOLO series in 2021. arXiv 2021. [Google Scholar] [CrossRef]
- Wang, Q.; Xie, G.; Zhang, Z. E-WFF Net: An Efficient Remote Sensing Ship Detection Method Based on Weighted Fusion of Ship Features. Remote Sens. 2025, 17, 985. [Google Scholar] [CrossRef]
- Fu, C.; Chen, K.; Lu, K.; Zheng, G.; Zhao, J. Rotation Detection of Aircraft Fasteners for Edge Intelligent Optical Perception. Appl. Opt. 2022, 43, 472–480. [Google Scholar]
- Song, H.; Jiao, Y.; Hua, Z.; Li, R.; Xu, X. Cracked Embryo Detection of Immerse-Seeded Corn Based on YOLO v5-OBB and CT. Trans. Chin. Soc. Agric. Mach. 2023, 54, 394–401+439. [Google Scholar]
- Wang, C.; Li, P.; Zhang, G.; Huang, Y.; Cheng, Y. YOLOv5: A one-stage object detection model for real-time applications. In Proceedings of the IEEE/CVF Conference on Computer Vision and Pattern Recognition (CVPR) Workshops, Seattle, WA, USA, 14–19 June 2020; IEEE: Piscataway, NJ, USA, 2020; pp. 33–40. [Google Scholar]
- Liu, W.; Anguelov, D.; Erhan, D.; Szegedy, C.; Reed, S.; Fu, C.Y.; Berg, A.C. SSD: Single Shot MultiBox Detector. In Proceedings of the European Conference on Computer Vision, Amsterdam, The Netherlands, 11–14 October 2016; Springer: Cham, Switzerland, 2016; pp. 21–37. [Google Scholar]
- Ren, S.; He, K.; Girshick, R.; Sun, J. Faster R-CNN: Towards Real-time object Detection with Region Proposal Networks. IEEE Trans. Pattern Anal. Mach. Intell. 2017, 39, 1137–1149. [Google Scholar] [CrossRef] [PubMed]
- He, K.; Zhang, X.; Ren, S.; Sun, J. Spatial Pyramid Pooling in Deep Convolutional Networks for Visual Recognition. IEEE Trans. Pattern Anal. Mach. Intell. 2015, 37, 1904–1916. [Google Scholar] [CrossRef] [PubMed]
- Trinh, H.C.; Le, D.H.; Kwon, Y.K. PANET: A GPU-based tool for fast parallel analysis of robustness dynamics and feed-forward/feedback loop structures in large-scale biological networks. PLoS ONE 2014, 9, e103010. [Google Scholar] [CrossRef] [PubMed]
- Wang, C.Y.; Liao, H.Y.M.; Wu, Y.H.; Chen, P.Y.; Hsieh, J.W.; Yeh, I.H. CSPNet: A new backbone that can enhance learning capability of CNN. In Proceedings of the 2020 IEEE/CVF Conference on Computer Vision and Pattern Recognition Workshops, Seattle, WA, USA, 14–19 June 2020; pp. 1571–1580. [Google Scholar]
- Ioffe, S.; Szegedy, C. Batch Normalization: Accelerating Deep Network Training by Reducing Internal Covariate Shift. arXiv 2015, arXiv:1502.03167. [Google Scholar]
- Elfwing, S.; Uchibe, E.; Tanno, R. Sigmoid-weighted linear units for neural network function approximation in reinforcement learning. In Proceedings of the 2018 International Conference on Digital Image Computing: Techniques and Applications (DICTA), Canberra, Australia, 10–13 December 2018; pp. 1–8. [Google Scholar]
- Yang, X.; Yan, J. Arbitrary-oriented object detection with circular smooth label. In Proceedings of the European Conference on Computer Vision, Glasgow, UK, 23–28 August 2020; Springer: Cham, Switzerland, 2020; pp. 677–694. [Google Scholar]
- Hou, Q.; Zhou, D.; Feng, J. Coordinate attention for efficient mobile network design. In Proceedings of the IEEE/CVF Conference on Computer Vision and Pattern Recognition, Nashville, TN, USA, 20–25 June 2021; pp. 13708–13717. [Google Scholar]
- Ma, J.; Shao, W.; Ye, H.; Wang, L.; Wang, H.; Zheng, Y.; Xue, X. Arbitrary-oriented scene text detection via rotation proposals. IEEE Trans. Multimed. 2018, 20, 3111–3122. [Google Scholar] [CrossRef]
- Zheng, Z.; Wang, P.; Liu, W.; Li, J.; Ye, R.; Ren, D. Distance IoU loss: Faster and better learning for bounding box regression. In Proceedings of the 34th 2020 AAAI Conference on Artificial Intelligence, New York, NY, USA, 7–12 February 2020; pp. 12993–13000. [Google Scholar]
- Rezatofighi, H.; Tsoi, N.; Gwak, J.; Sadeghian, A.; Reid, I.; Savarese, S. Generalized intersection over union: A metric and a loss for bounding box regression. In Proceedings of the 2019 IEEE/CVF Conference on Computer Vision and Pattern Recognition, Long Beach, CA, USA, 15–20 June 2019; pp. 658–666. [Google Scholar]
- Shao, Y.; Zhang, D.; Chu, H.; Zhang, X.; Rao, Y. A Review of YOLO Object Detection Based on Deep Learning. J. Electron. Inf. Technol. 2022, 44, 3697–3708. [Google Scholar]
- Loshchilov, I.; Hutter, F. SGDR: Stochastic Gradient Descent with Warm Restarts. arXiv 2016, arXiv:1608.03983. [Google Scholar]
- Jiang, Y.; Pang, D.; Li, C. A deep learning approach for fast detection and classification of concrete damage-science direct. Autom. Constr. 2021, 128, 103785. [Google Scholar] [CrossRef]
- Hou, L.; Lu, K.; Xue, J.; Li, Y. Shape-adaptive selection and measurement for oriented object detection. In Proceedings of the AAAI Conference on Artificial Intelligence, Online, 22 February–1 March 2022. [Google Scholar]
- Han, J.; Ding, J.; Li, J.; Xia, G.S. Align deep features for oriented object detection. IEEE Trans. Geosci. Remote Sens. 2021, 60, 5602511. [Google Scholar] [CrossRef]
- Han, J.; Ding, J.; Xue, N.; Xia, G.S. Redet: A rotation-equivariant detector for aerial object detection. In Proceedings of the IEEE/CVF Conference on Computer Vision and Pattern Recognition, Nashville, TN, USA, 20–25 June 2021; pp. 2785–2794. [Google Scholar]
Disclaimer/Publisher’s Note: The statements, opinions and data contained in all publications are solely those of the individual author(s) and contributor(s) and not of MDPI and/or the editor(s). MDPI and/or the editor(s) disclaim responsibility for any injury to people or property resulting from any ideas, methods, instructions or products referred to in the content. |
© 2025 by the authors. Licensee MDPI, Basel, Switzerland. This article is an open access article distributed under the terms and conditions of the Creative Commons Attribution (CC BY) license (https://creativecommons.org/licenses/by/4.0/).