Article

Optimization of Critical Parameters in Friction Stir Spot Welding of AA5052 Aluminum Alloy Using Response Surface Methodology

by
Mohamed M. El-Sayed Seleman
1,2,
Sabbah Ataya
3,*,
Nashmi H. Alrasheedi
3,
Mohamed M. Z. Ahmed
4,
Hagar A. Reyad
2,
Ashraf Bakkar
5 and
Ramy A. Fouad
6
1
Department of Metallurgical and Materials Engineering, Faculty of Petroleum and Mining Engineering, Suez University, Suez 43221, Egypt
2
Suez and Sinai Metallurgical and Materials Research Center of Scientific Excellence (SSMMR-CSE), Faculty of Petroleum and Mining Engineering, Suez University, Suez 43221, Egypt
3
Department of Mechanical Engineering, College of Engineering, Imam Mohammad Ibn Saud Islamic University, Riyadh 11432, Saudi Arabia
4
Mechanical Engineering Department, College of Engineering at Al Kharj, Prince Sattam Bin Abdulaziz University, Al Kharj 11942, Saudi Arabia
5
Department of Civil and Environmental Engineering, College of Engineering and Computers, Umm Al-Qura University, Al-Lith 28425, Saudi Arabia
6
Mechanical Department, Faculty of Technology and Education, Suez University, Suez 43221, Egypt
*
Author to whom correspondence should be addressed.
Crystals 2025, 15(6), 571; https://doi.org/10.3390/cryst15060571
Submission received: 6 May 2025 / Revised: 11 June 2025 / Accepted: 11 June 2025 / Published: 17 June 2025
(This article belongs to the Special Issue Advances in Processing, Simulation and Characterization of Alloys)

Abstract

:
Understanding and optimizing the relationship between critical processing parameters (rotational speed and dwell time) and the resulting weld performance is crucial for the effective application of friction stir spot welding (FSSW) in joining aluminum alloys. FSSW is an increasingly important solid-state, clean technology alternative for joining lightweight alloys such as AA5052-H32 in various industries. To optimize this technique for lap joint configurations, the current study examines the influence of rotational speeds (500, 1000, and 1500 rpm) and dwell times (1, 2, and 3 s) on the heat input energy, hardness across weld zones, and tensile/shear load, using a full factorial Design-Expert (DOE) analysis. The FSSW responses of the numerical model were validated using the experimental results for the spot-welded joints. The findings indicate that the dwell time significantly affected the mechanical properties, while the tool rotational speed had a substantial effect on the heat input energy and mechanical properties. Fracture surfaces predominantly exhibited ductile failure with diverse dimple morphologies, consistent with the enhanced tensile properties under optimal parameters. The presence of finer dimples suggests a mixed-mode fracture involving shear.

1. Introduction

Aluminum alloys are highly regarded as lightweight materials due to their low density, high specific strength, corrosion resistance, impact resistance, and recyclability [1]. Their growing use in the transportation industry, replacing traditional steel, has led to significant weight reduction in vehicles [2]. This improves performance and fuel efficiency and reduces emissions, supporting global sustainability efforts [3]. Therefore, the need to join aluminum alloys in numerous applications, such as automotive, aerospace, and marine industries, has driven the development of advanced welding methods and the optimization of existing welding process parameters [4]. Traditional methods for spot-joining aluminum alloys, such as mechanical fastening (riveting) [5] and electrical resistance welding [5,6], present several limitations. Riveting is associated with low production efficiency and the use of harsh environmental conditions [4], while resistance spot welding suffers from high energy consumption, excessive current requirements, and significant joint distortion [7,8].
While friction stir welding (FSW) and friction stir spot welding (FSSW) both employ a rotating tool to generate frictional heat and plasticize material, their mechanics and applications differ significantly. FSW produces continuous linear welds by traversing the tool along a joint line, making it suitable for long-seam applications. In contrast, FSSW creates discrete nugget-style joints by plunging the tool at a single spot without linear movement, making it ideal for lap-sheet assemblies that require localized joining with minimal thermal distortion [9,10]. In fact, friction stir spot welding (FSSW) [11,12,13,14] derived from friction stir welding (FSW) [10,15], where it is used to join overlapping similar or dissimilar material sheets. Moreover, it is effective for joining materials with lower energy consumption that are difficult to weld using traditional joining methods. The produced welds have high strength, fatigue resistance, and lower defects such as porosity, cracks, and sheet distortion [16,17,18]. FSSW is a promising technology for engineering industries seeking lightweight, high-strength, and defect-free joints, especially in applications involving non-ferrous materials [19,20,21,22]. These applications include the automotive, aerospace, electronics, and shipbuilding industries [23,24].
Zhang et al. [1] investigated applying two variants of FSSW: conventional FSSW and walking FSSW. They used AA5052-H112 alloy sheets with a 1 mm thickness and examined the effect of FSSW parameters in terms of rotational speed and dwell time on the microstructure and mechanical properties of joints. The welding parameters included rotational speeds of 1541 and 2256 rpm and dwell times of 5, 10, and 15 s. They reported that the highest tensile/shear load of 2847.7 N was achieved in joints welded at 1541 rpm and 5 s. Additionally, the FSSW joint strength decreased with increasing rotational speed at a constant dwell time, which can be attributed to the higher heat input energy and the resulting softening of the joint material.
Mitlin et al. [25] studied the effect of the plunge depth on the microstructure and mechanical properties of FSSW joints of AA 6111-T4 alloy. The AA 6111-T4 alloy dimensions were 1 mm in thickness, 25 mm in width, and 100 mm in length. Their findings indicated that the tool plunge depth had a minor effect on the FSSW joint strength. Additionally, they observed that increasing the plunge depth reduced the thickness of the upper sheet.
Tiwan et al. [26] studied the influence of FSSW variables, including the pin geometry (cylindrical and step pin) and tool rotational speed (900, 1400, and 1800 rpm), on the mechanical behavior of AA5052-H112 welded joints. They found that the highest tensile strength was obtained using the cylindrical pin at rotational speeds of 900 and 1400 rpm. Furthermore, the shear and cross-tension loads of welded joints initially improved as the rotational speed increased from 900 to 1400 rpm but decreased when the speed reached 1800 rpm. Conversely, joints processed with a step pin at higher rotational speeds showed reduced shear loads but increased cross-tension loads.
Response Surface Methodology (RSM) utilizing designs such as Face-Centered Composite Design (FCCD) offers a statistical approach to maximizing the yield of a specific material through the optimization of its processing parameters. The analysis of variance (ANOVA) response surface method investigates the relationships between many process variables and one or more response variables [27,28]. FCCD based on RSM offer a statistical approach to maximizing the yield of a specific material through the optimization of its processing parameters [29]. RSM has recently become popular for formulation optimization, particularly when paired with a suitable design of experiments [30]. Unlike traditional approaches, the RSM methodology can identify how process factors interact with one another [31]. Tutar et al. [32] employed a mathematical model based on Taguchi orthogonal array for optimizing the spot welding parameters of 3 mm thick AA3003-H12 in terms of plunge depths (3.2, 4, and 4.8 mm), tool rotational speeds (1500, 2000, and 2500 rpm), and dwell times (1.5, 2, and 2.5 s) with a threaded cylindrical pin and concave shoulder. Their results showed that plunge depth had the strongest influence on joint strength (69.26% contribution), followed by rotational speed and dwell time. The optimal welding parameters were a dwell time of 2 s, a plunge depth of 4.8 mm, and a rotational speed of 1500 rpm. However, their study had two key limitations: (1) the use of a short pin (3 mm) required an excessive plunge depth (~1.8 mm insertion beyond the pin length), potentially causing keyhole defects in the 6 mm thick lap joint; and (2) their model was specifically developed for AA3003-H12 and cannot be directly applied to other aluminum series such as 5XXX alloys, due to differences in the chemical composition and thermal properties, particularly when joining thinner sheets.
Despite previous studies [1,4,8] on the friction stir spot welding (FSSW) of AA5052 alloys, a critical gap remains in the systematic optimization of two key parameters, the tool rotational speed and welding time (dwell time), particularly in lower parameter ranges (rotational speed ≤ 1500 rpm; dwell time < 5 s) for AA5052-H32 alloy. Prior studies have predominantly focused on high-energy regimes (rotational speed > 1500 rpm, dwell time > 5 s [1]), leaving the thermo-mechanical effects and microstructure–property correlations at moderate parameters underexplored. Ahmed et al., in two separate studies [4,8], explored more practical 2 mm AA5052-H32 sheets but employed restrictive one-factor-at-a-time approaches. In the first work [4], they varied only the dwell time (1–3 s) at a fixed rotational speed of 500 rpm to produce spot joints in AA5052 aluminum alloy, while in the second work [8], they examined only the effect of the rotational speed (500–1500 rpm) at a fixed dwell time of 2 s on joint performance. These studies represent isolated investigations, examining only one parameter at a time, and both ignored statistical optimization and the microstructure–property correlations. Furthermore, the synergistic interaction between the rotational speed and dwell time, which critically governs the heat input, grain refinement, and joint strength, lacks rigorous statistical modeling via RSM. Addressing this gap is essential to expand the industrial applicability of FSSW, especially for thin-walled AA5052 applications that demand precise thermal management combined with high productivity, where a reduced welding time and minimized heat input are desirable.
While RSM has demonstrated effectiveness in optimizing FSW [33,34] and FSSW [35] processes for various materials, its specific application to the FSSW of AA5052-H32, specifically for investigating the interaction effects between the tool rotational speed and dwell time in low-to-moderate ranges (≤1500 rpm, <5 s) remains underexplored in the literature.
Thus, the novelty of this work lies in developing the first integrated statistical response methodology based on FCCD for AA5052-H32 FSSW that systematically correlates the welding parameters in terms of tool rotational speed (500–1500 rpm) and dwell time (1–3 s) with multi-objective performance metrics critical for lightweight automotive and aerospace applications. Unlike previous fragmented studies, our RSM approach simultaneously models three key industrial response variables: (1) heat input energy (governing process efficiency); (2) stir zone (SZ) hardness (linked to microstructure evolution); and (3) maximum shear load (determining joint reliability), capturing their complex interdependencies through ANOVA-validated mathematical models. This represents a paradigm shift from conventional one-factor-at-a-time studies by providing (1) a physics-informed statistical framework for parameter optimization, (2) quantitative prediction of the mechanical behavior under varying energy inputs, and (3) a scientific basis for industrial process control in friction stir spot welding applications.

2. Materials and Methods

2.1. Starting Materials and FSSW Procedure

In the present work, spot welds were produced in a lap joint configuration using as-received AA5052-H32 aluminum alloy sheets with dimensions of 150 mm (length) × 40 mm (width) × 2 mm (thickness). Table 1 and Table 2 illustrate the chemical composition and mechanical performance, respectively, of the AA5052-H32 alloy.
An FSSW machine (Model-EG-FSW-M1, Suez, Egypt) [36] was employed to weld AA5052 lap joints (Figure 1a). The designed tool dimensions were a shoulder diameter of 20 mm, a pin diameter of 5 mm, and a pin length of 3 mm, as shown in Figure 1b. This tool was fabricated from H13 steel. Based on numerous preliminary experiments and our previous findings [4,8], as well as additional testing and investigation, this study focused on optimizing key FSSW parameters for AA5052-H32 (Table 3) while maintaining the following constant conditions: 3 mm plunge depth, 0.1 mm/s plunge rate, and a 0-degree tilt angle [4,8].

2.2. Characterization of FSSW Joints

Weld cross-sections were prepared according to ASTM E384-73 for microstructural and hardness analysis. The hardness distribution in the weld zones (SZ: stir zone, TMAZ: thermomechanical affected zone, and HAZ: heat affected zone) was evaluated using a Vickers hardness tester (HWDV-75, TTS Unlimited, Osaka, Japan) with a 5 N load and 15 s indentation time.
In addition, tensile/shear testing was conducted on the spot-welded joints fabricated at various rotational speeds and dwelling times, using the specimen lap joint configuration (Figure 1c). The tensile/shear test was performed at the usual quasi-static strain rate of 0.05 mm/s using a universal testing machine (Type-WDW-300D, Jinan, China), as shown in Figure 1d,e. The welding factors are shown in Table 3. For microstructural evaluation for both the base metal (BM) and the spot-welded specimens, the cross-sectioned specimens were investigated via an electron backscatter diffraction (EBSD) technique using a Quanta FEG 250 SEM (FEI Company, Hillsboro, OR, USA). The specimens were mechanically polished and subsequently electropolished for 60 s at −15 °C and 14 V. In addition, the fractured surfaces were investigated using the same Quanta FEG 250 SEM (Manufacturer is Field Electron and Ion Company, Hillsboro, OR, USA).

2.3. Regression Model

The RSM used in this part utilizes an FCCD and has three autonomous parameters that are block- and repeat-free.
Based on Equation (1), the design expert software (Version 10) prediction for the experimental result is given below [27,34]:
Y = β o + i = 1 k β i   X i + i = 1 k β i i   X 2 i + i j β i j   X i X j + ε
where Y, β o , β i X i , β i i X 2 i , β i j X i X j , k, and ε are the expected response, steady coefficient, linear major impact, non-linear impact, and the interaction impact of variables, reflecting the number of process variables and error, respectively. There are three basic steps in this method. In the initial stage, numerous FCCD method runs are performed, and different FSSW factor values are experimented. Regression modeling is the second phase, which involves creating and developing a compatible mathematical model of the interaction between the FSSW response and experimental input components. The final improvement is to characterize how each FSSW factor contributes to the correct output FSSW response. The mathematical factors were estimated using ANOVA and FCCD. The important aspects of the FSSW technique are evaluated using the RSM data analysis based on the two-factor, three-level FCCD method (L27 orthogonal array). The analysis revealed significant correlations between the process parameters (rotational speed and dwell time) and the response variables, confirming that the friction stir spot welding (FSSW) conditions could be effectively modeled using second-order polynomial equations within the current statistical framework. The complete design matrix with corresponding response characteristics is presented in Table 4.
The R2 coefficient of determination was used to quantify the reasonable degree of the experimental response to the polynomial mathematical modeling equation [37]. Therefore, the F-test was subsequently applied to assess the significance of each term in the polynomial equation, demonstrating 99.08% confidence in the model’s validity. The analysis revealed significant correlations between the process parameters (rotational speed and dwell time) and the response variables, confirming that the friction stir spot welding (FSSW) conditions could be effectively modeled using second-order polynomial equations within the current statistical framework. The complete design matrix with corresponding response characteristics is presented in Table 4.

3. Results

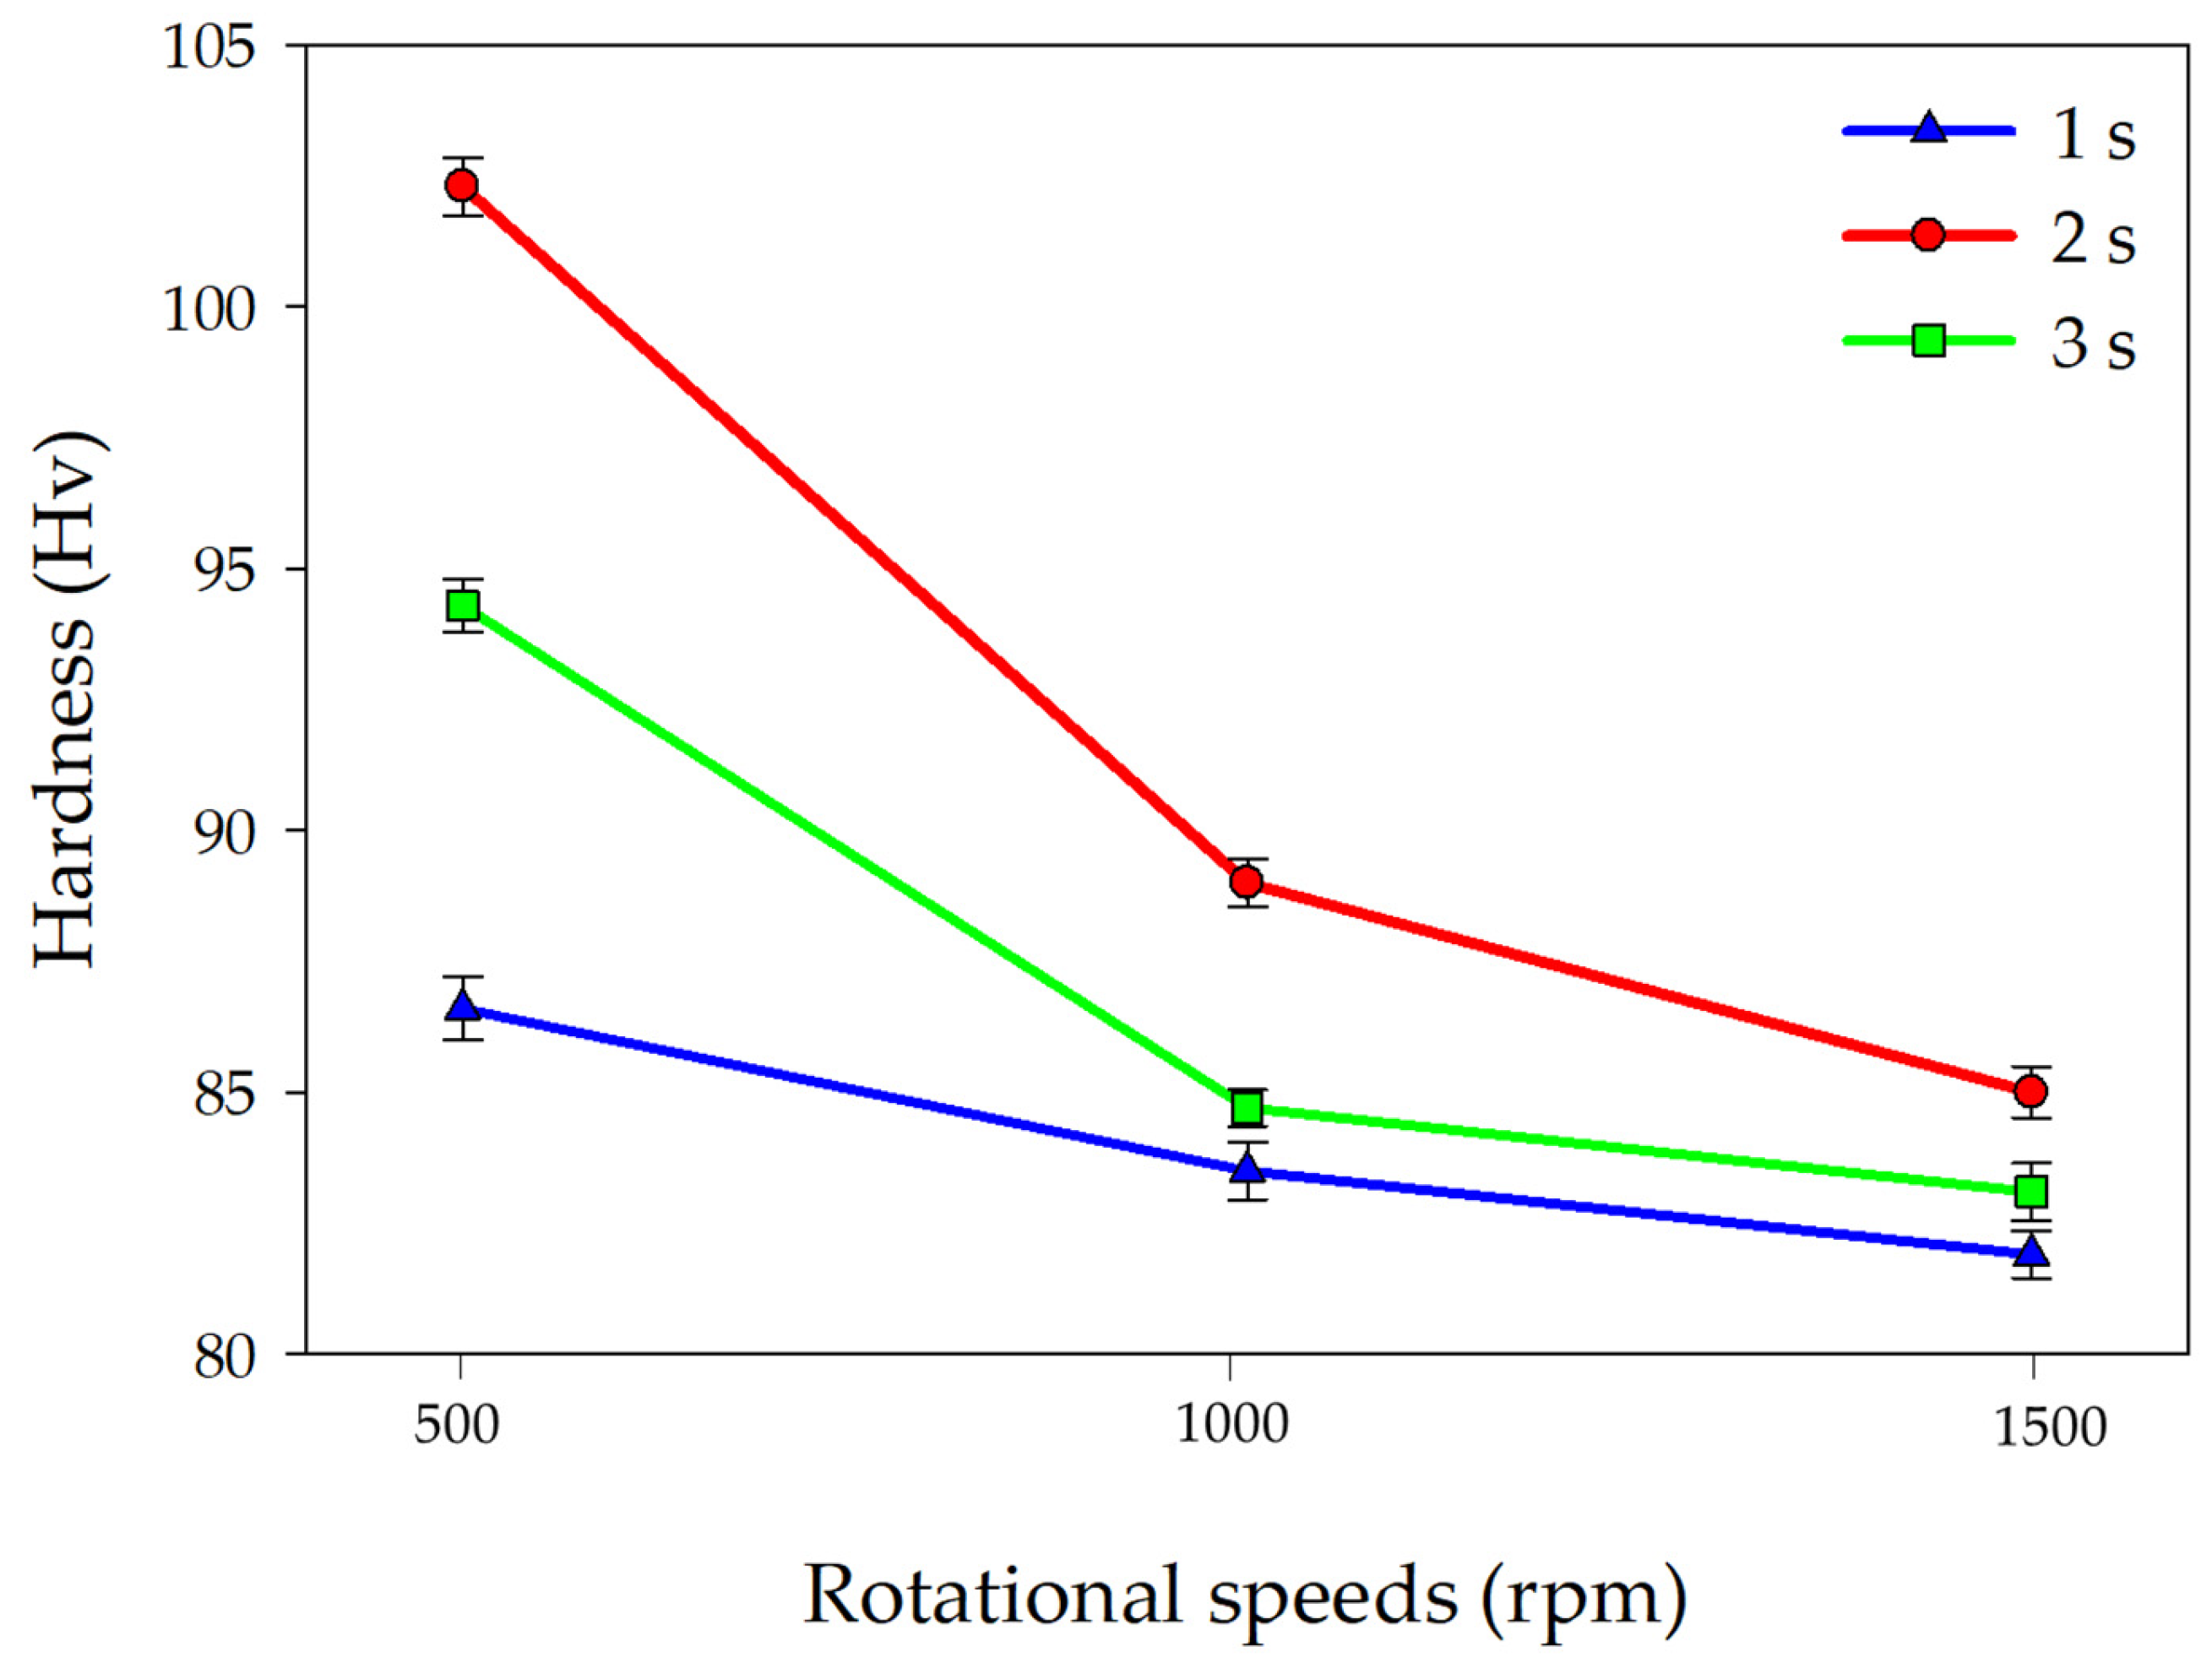
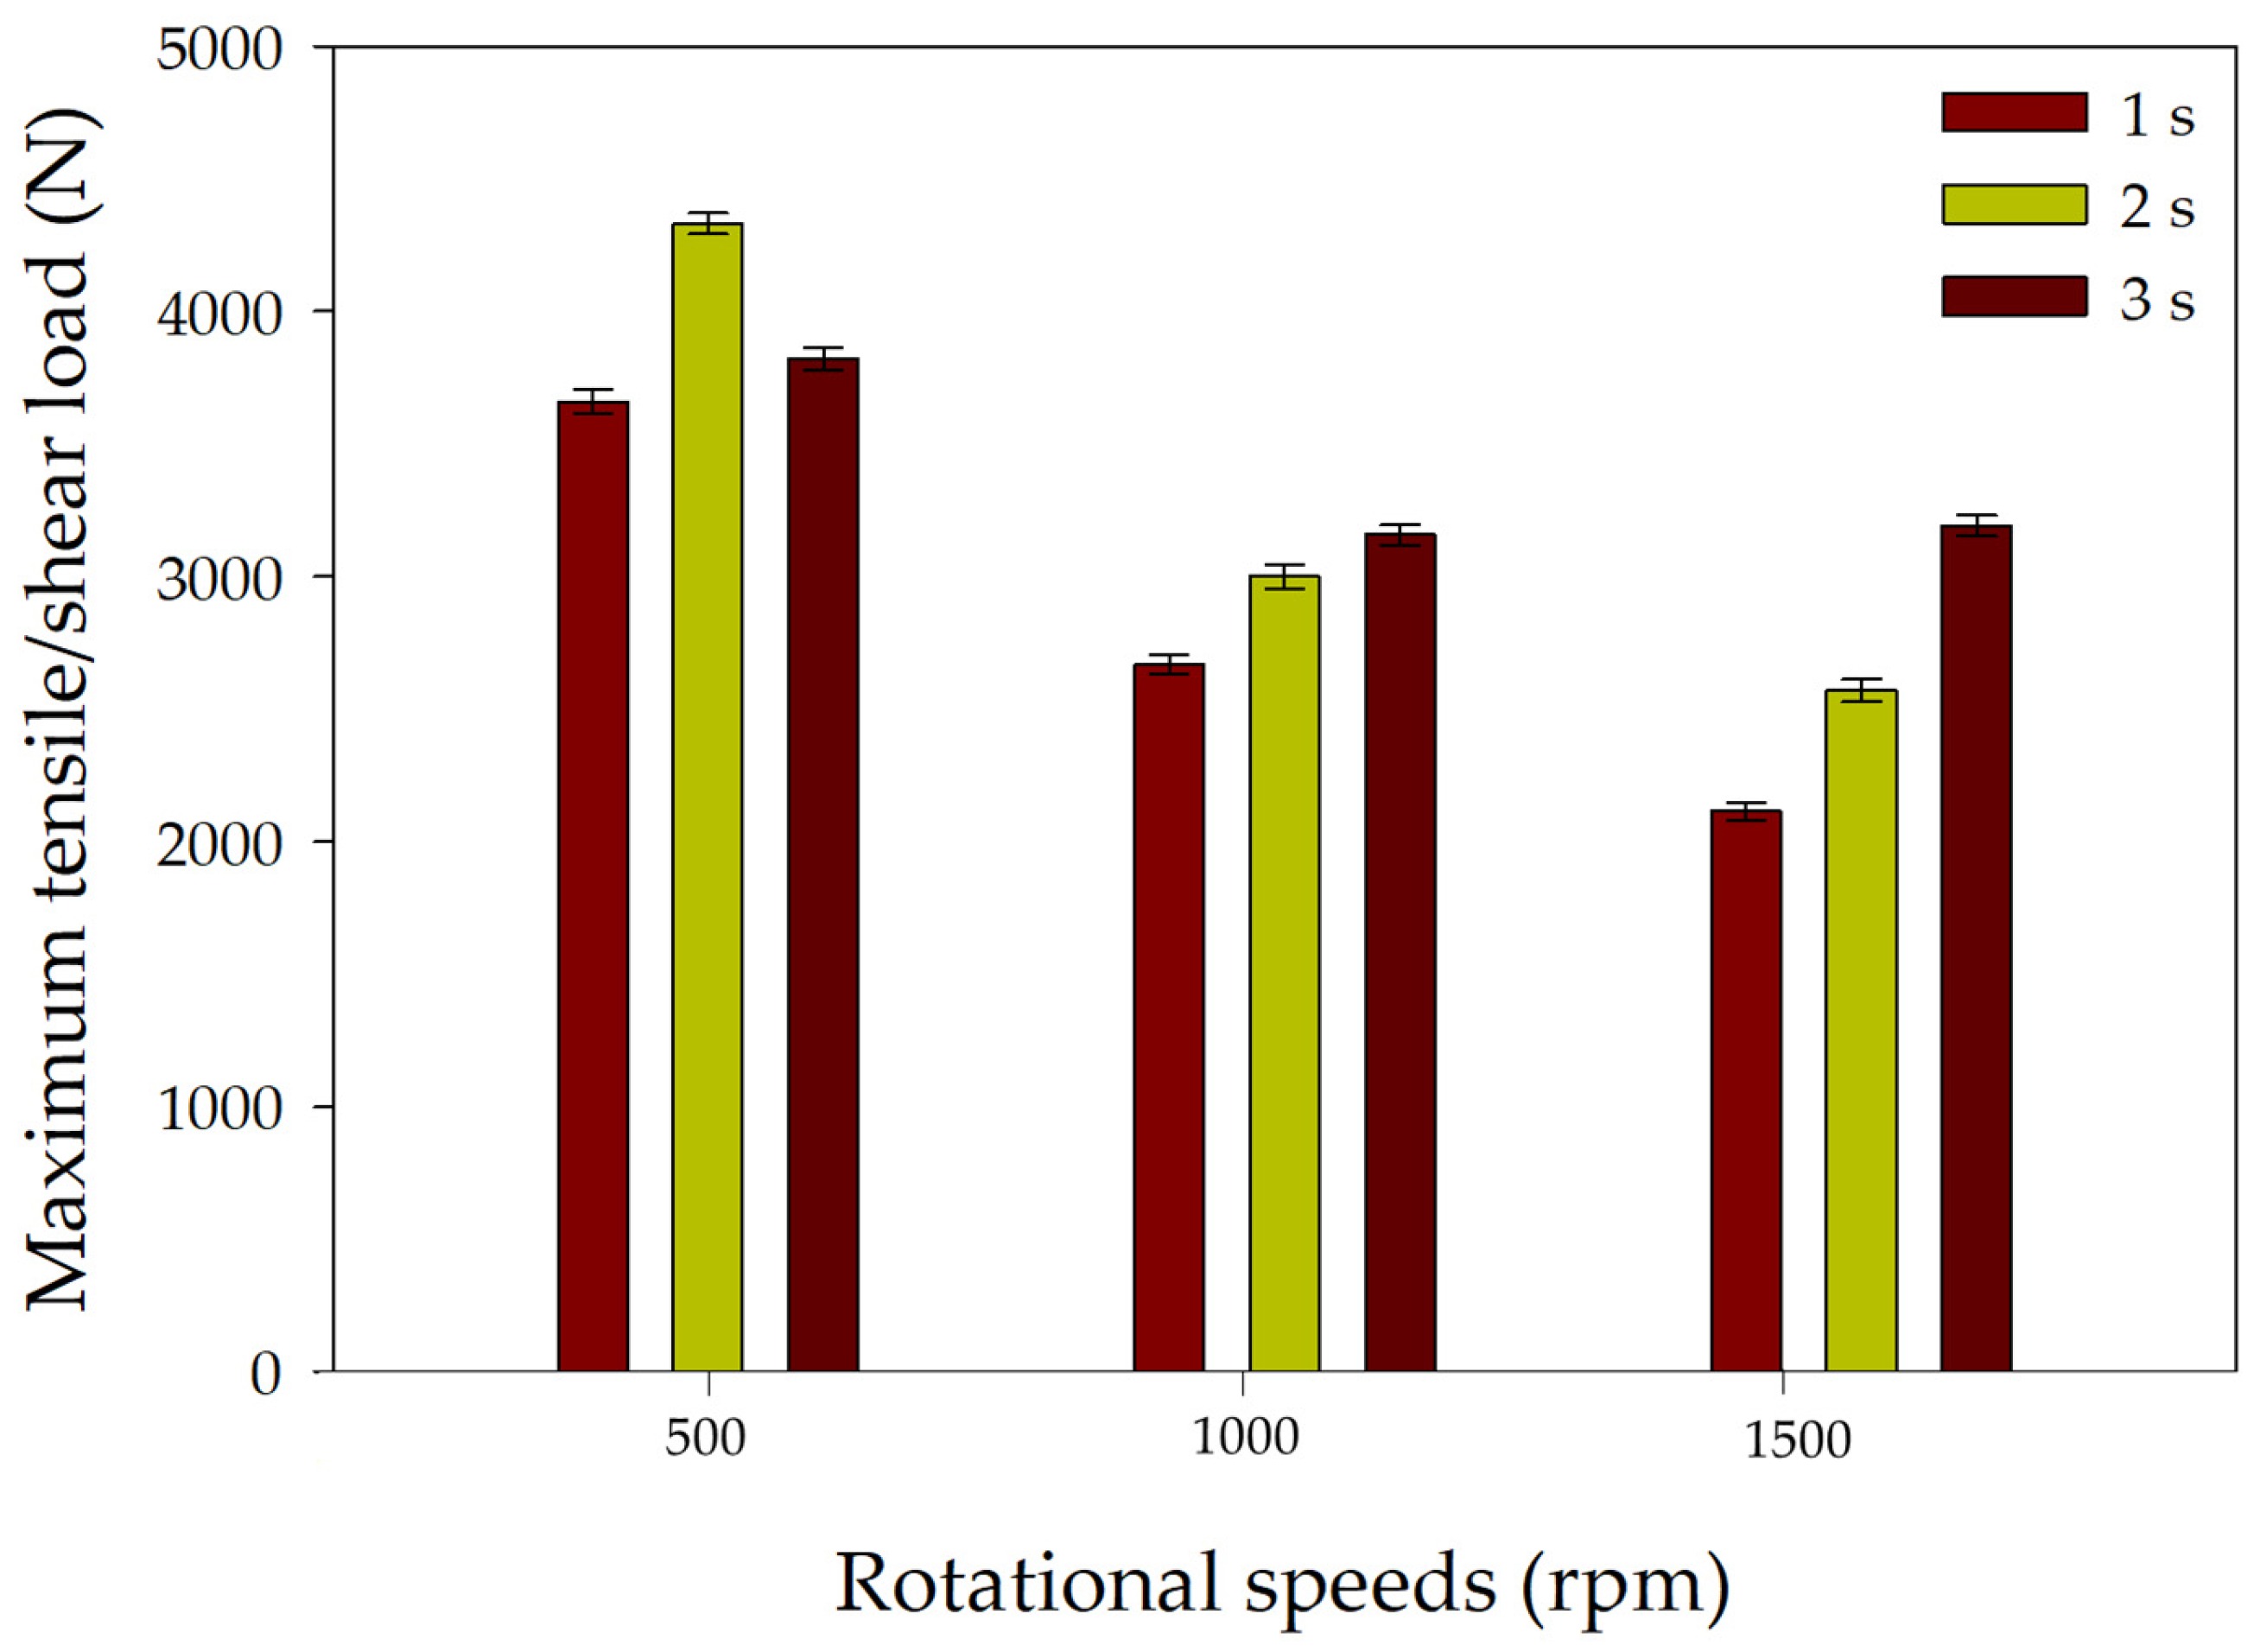
3.1. Mechanical Properties of AA 5052-H32 Spot-Welded Specimens

To assess the joint’s strength, the efficiency of the joining process, and its effect on the material’s internal structure, the hardness and tensile/shear load of the fabricated joints were analyzed. The measured SZ hardness values are presented in Figure 2. At all constant dwell times (1 s, 2 s, and 3 s), the average hardness values of the SZ of the FSSW AA5052-H32 joint decrease with the increase in rotational speed from 500 to 1500 rpm. This consistent trend can be attributed to the higher welding heat input energy and the consequent increased width of the softened area as the rotational speed increases [38]. Otherwise, the highest hardness values of 102.3 Hv, 89 Hv, and 85 Hv are found at rotational speed of 500, 1000, and 1500 rpm, respectively, at a fixed dwell time of 2 s. It can be concluded that the optimum spot welding parameters to have the highest hardness are a 2 s holding time and a 500 rpm rotational speed. Regarding the effect of different dwell times, the FSSW joint spot welded at the lowest dwell time of 1 s generates insufficient heat input energy to create good mixing and wide SZ size. Conversely, the highest dwell time generates high heat input energy, which causes softening of the welded zone area and a decrease in the area beneath the shoulder. From these results, it can be noted that increasing the dwell time causes a decrease in the hardness, which is in good agreement with the previous study [12]. Figure 3 illustrates the relationship between the maximum tensile/shear strength and the applied rotational speeds and dwell times. At a constant dwell time of 2 s, the highest tensile/shear load is noted at a rotational speed of 500 rpm. Furthermore, the maximum tensile/shear load values decrease with an increase in the rotational speed from 500 rpm to 1500 rpm at a constant dwell time. This reduction in maximum tensile/shear load can be attributed to higher heat input energy, which results in the softening of the welded areas of the FSSW joints. Moreover, this result is in agreement with the measured hardness values. Hence, we can conclude that the optimum processing parameters for spot welding to achieve the highest mechanical properties are a 500 rpm rotational speed and a dwell time of 2 s. From the discussed results, it is clear that both a high rotational speed and an extended dwell time negatively impact both the hardness and joint strength [26,39]. After tensile–shear testing, the fracture surfaces of both the 5052-H32 base alloy and the produced FSSW joints were investigated using an ETD-SEM detector, as shown in Figure 4. It can be noted that the primary failure mechanism was ductile fracture, evidenced by the presence of dimples with various sizes and forms, indicative of severe plastic deformation prior to rupture [40]. Furthermore, the observation of finer dimples suggests a superimposed shear component to this ductile fracture, potentially influenced by the refined microstructure achieved through the optimized FSSW parameters.

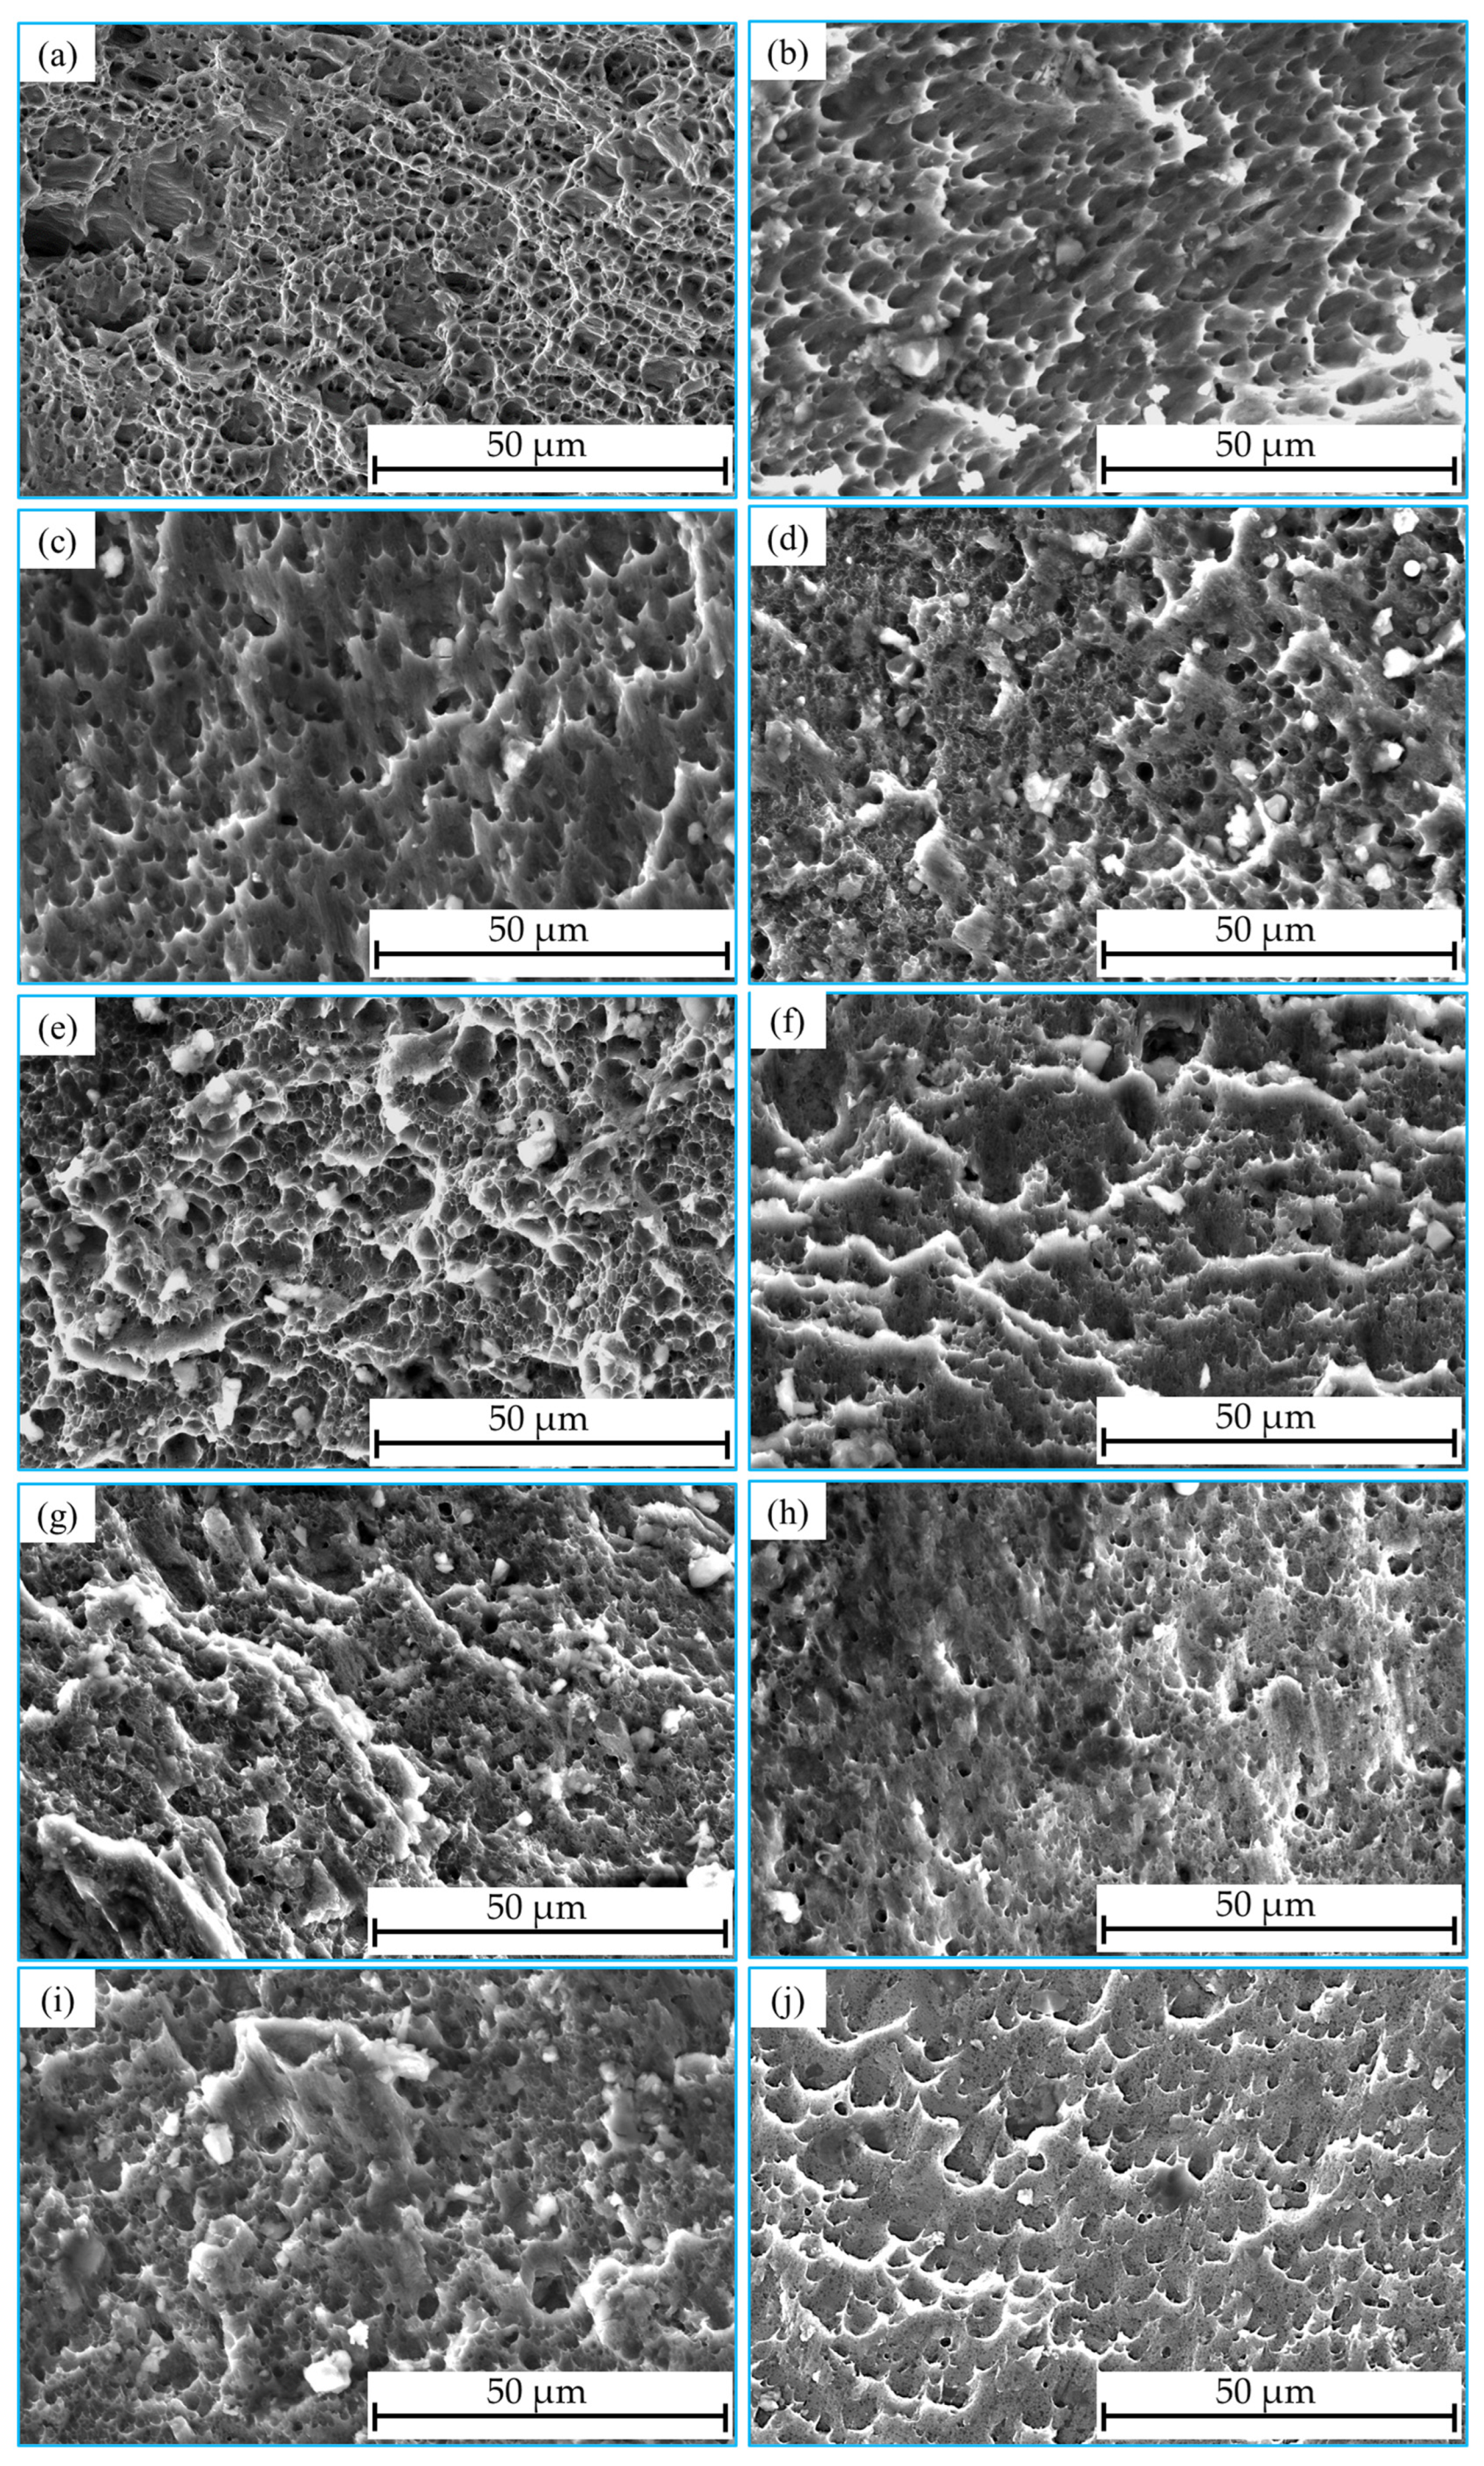
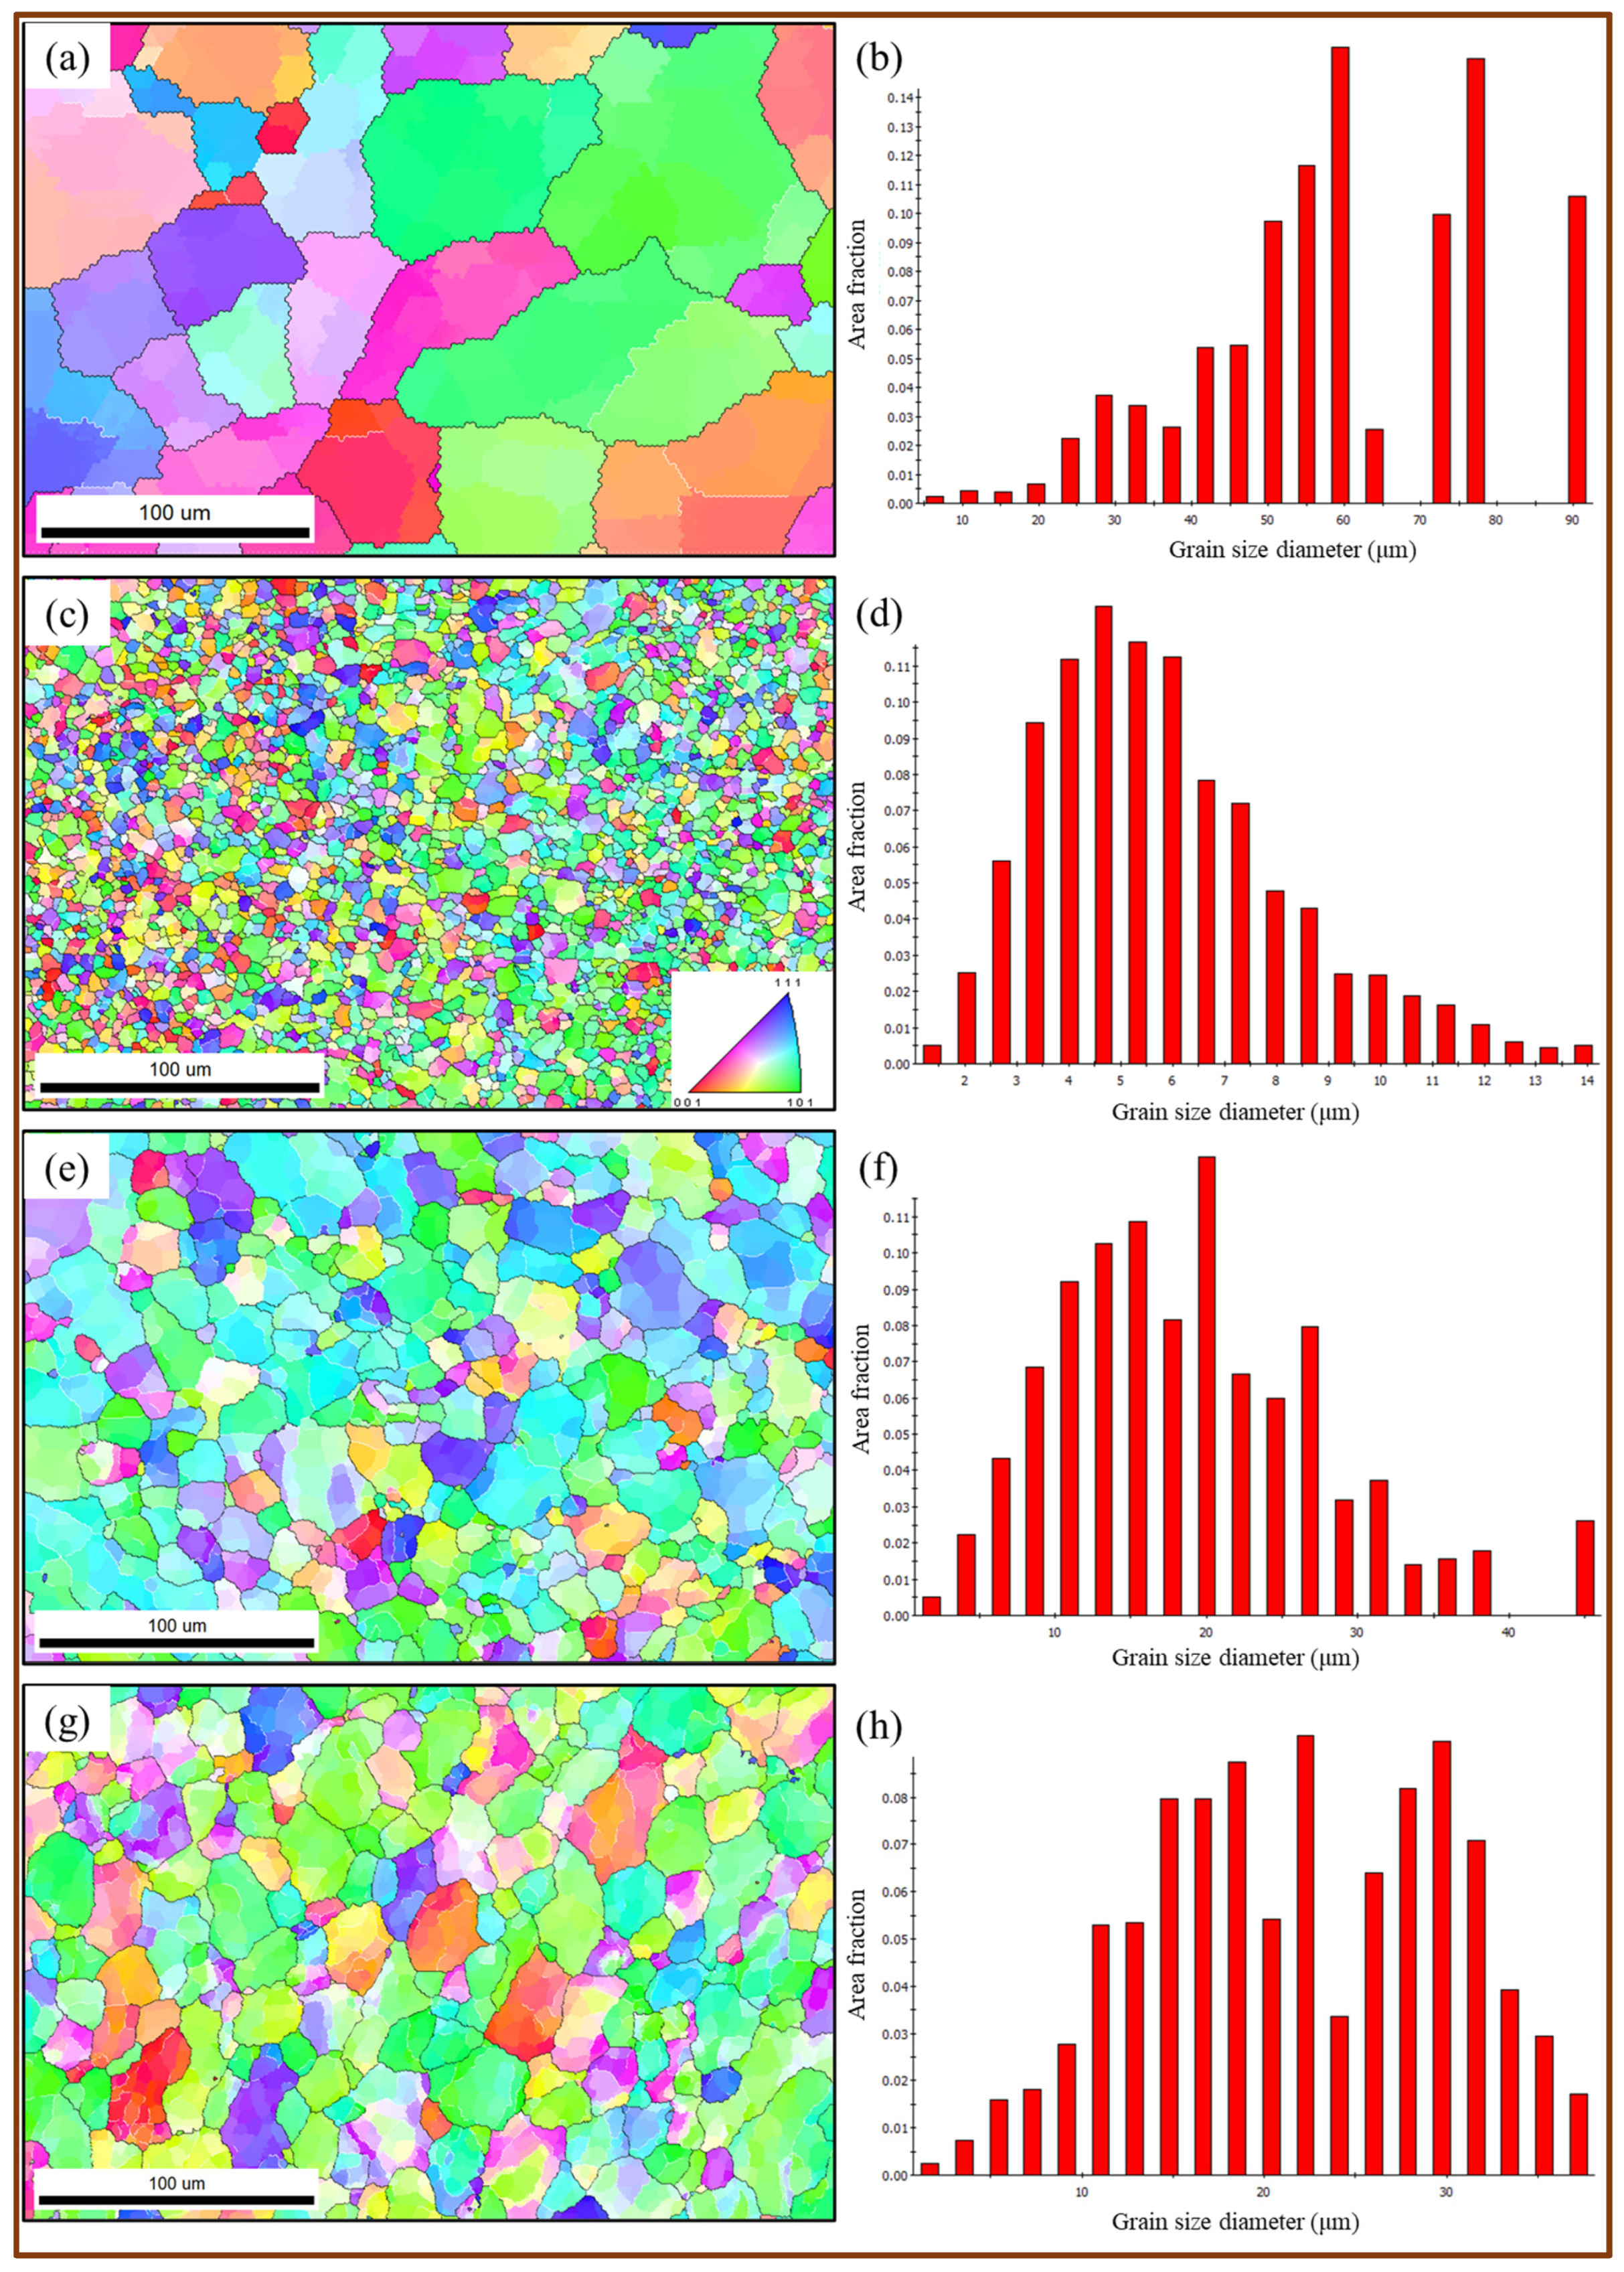
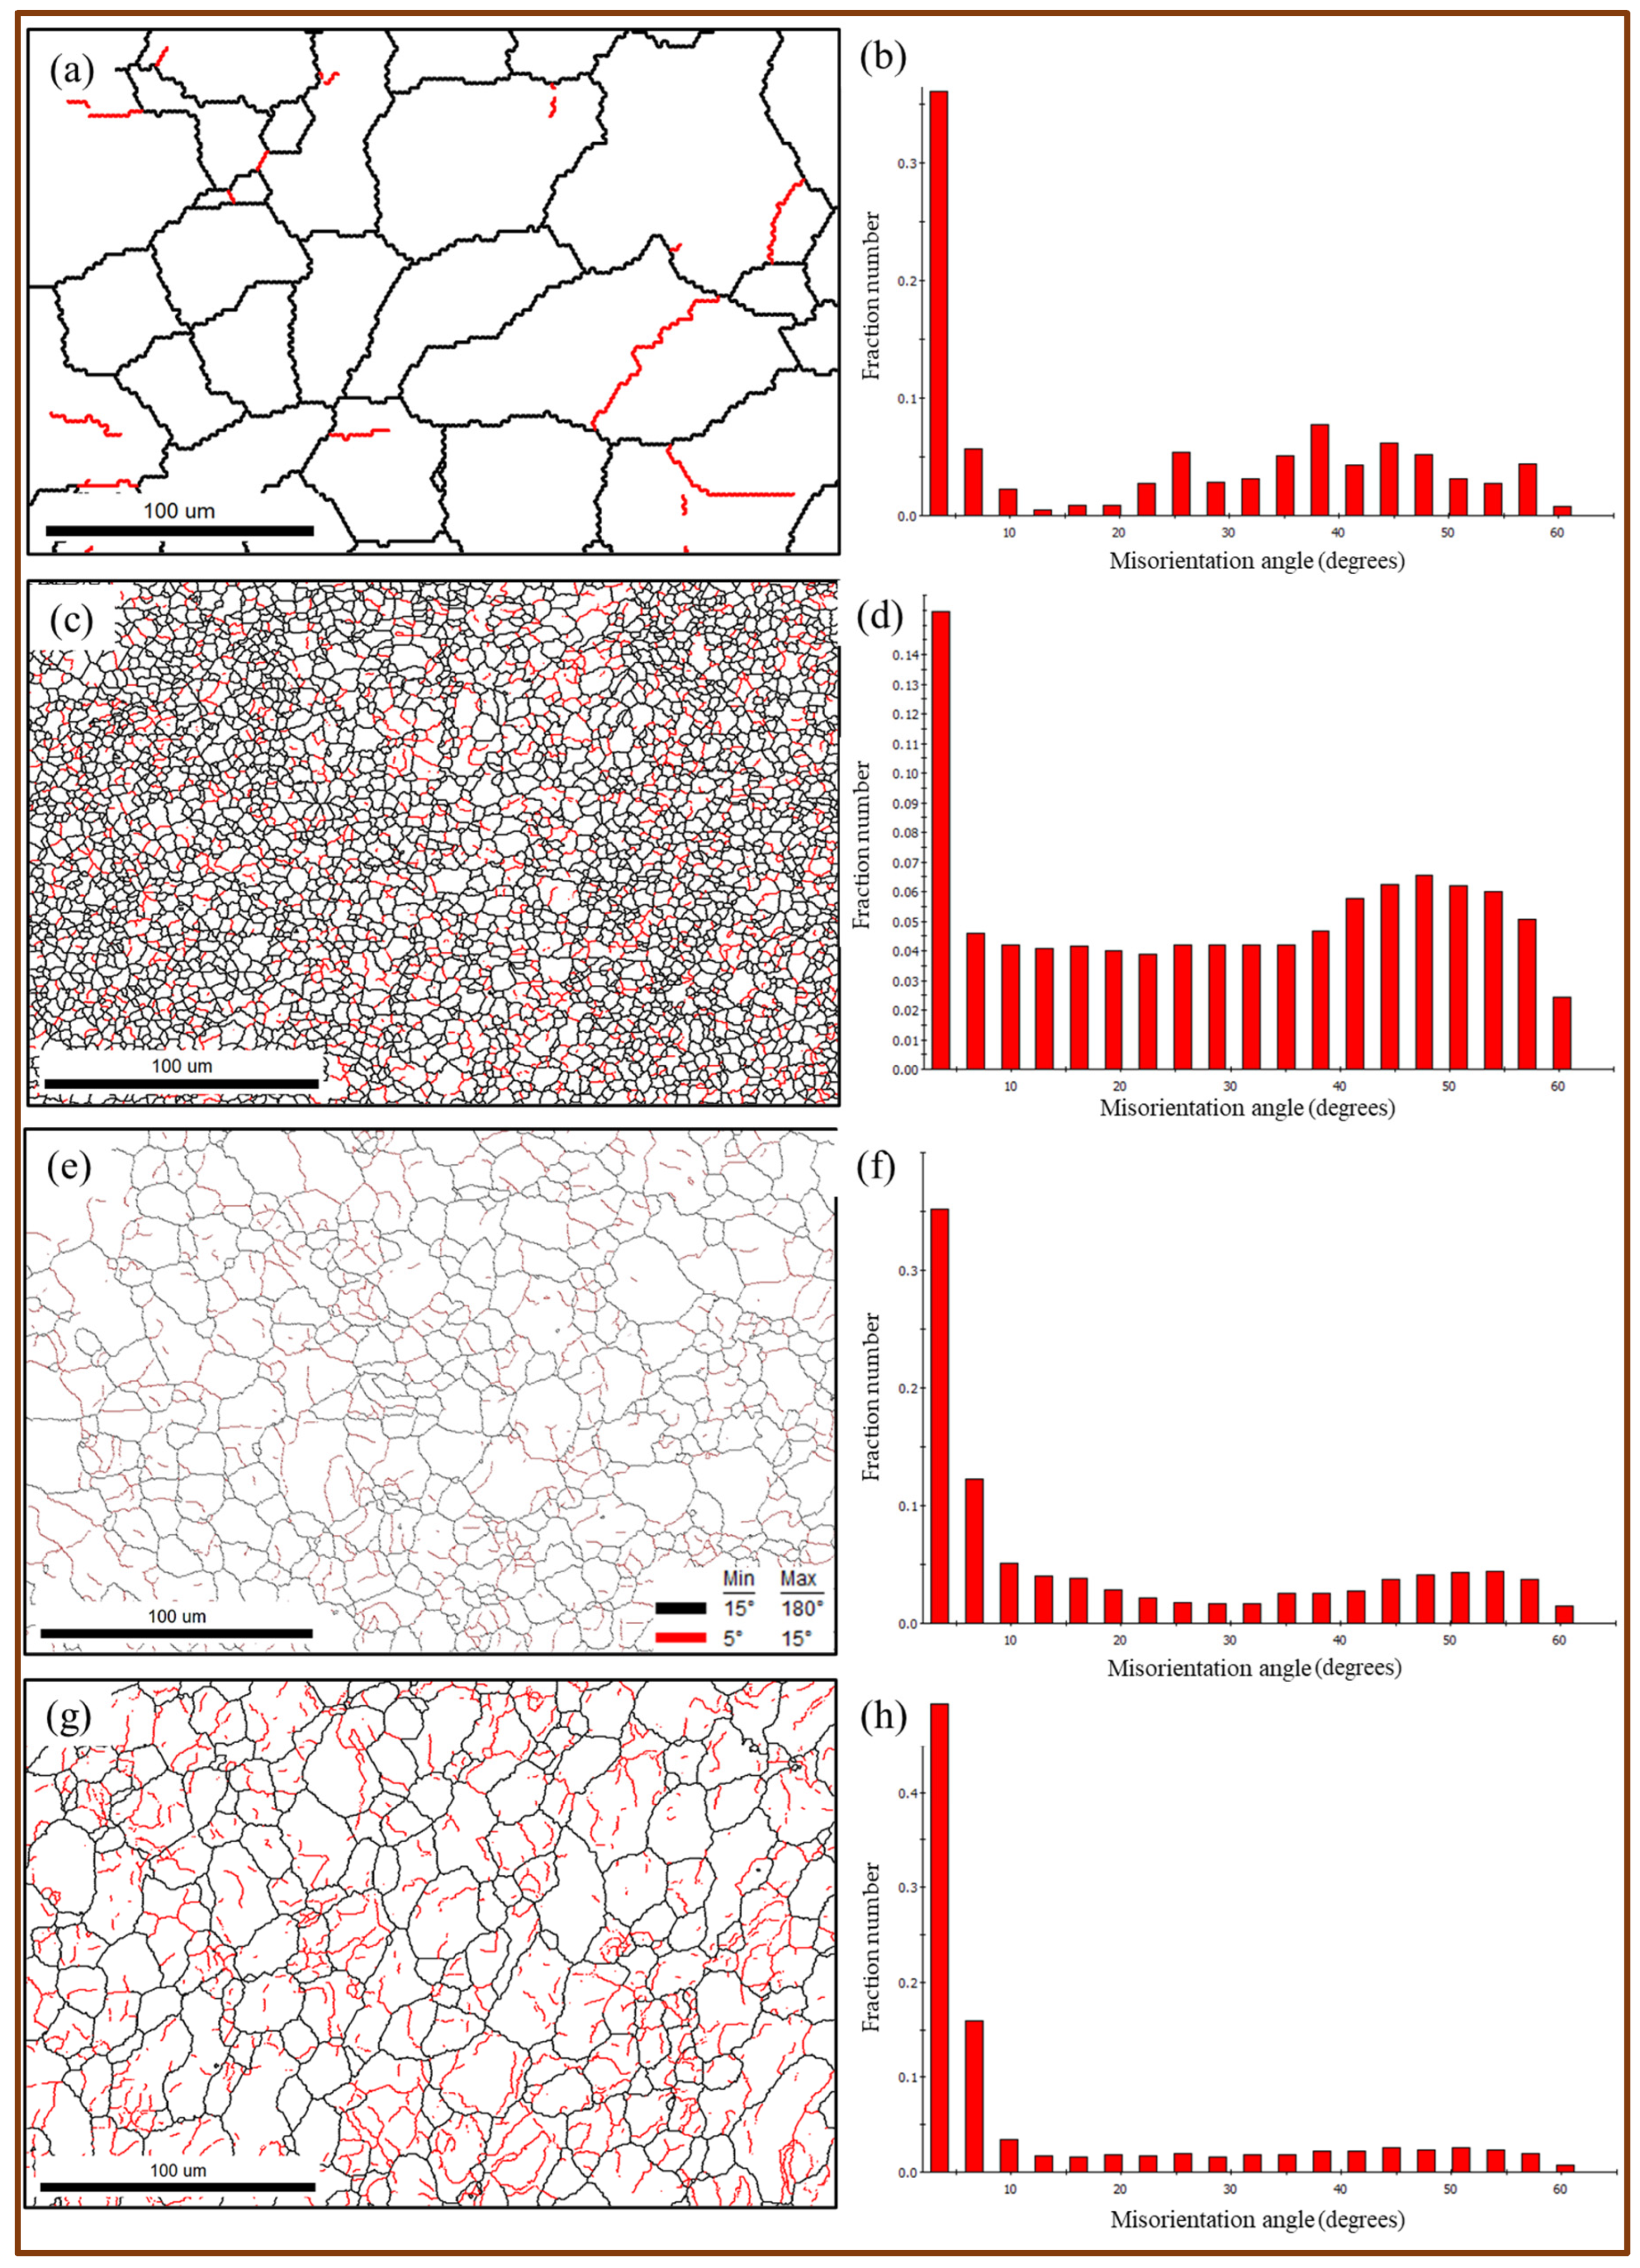
3.2. Microstructure of AA 5052-H32 Spot-Welded Specimen

Based on the mechanical behavior of the produced FSSW joints, microstructural characterization was conducted via EBSD on optimally selected samples, including the AA5052 base alloy and SZ of spot-welded specimens. EBSD analysis was performed for welds produced at a constant dwell time of 2 s with varying rotational speeds (500, 1000, and 1500 rpm). The results are presented as (1) inverse pole figure (IPF)-colored maps with corresponding grain size distribution analyses (Figure 5) and (2) grain boundary maps with associated misorientation angle distributions (Figure 6).
From Figure 5, it can be noted that the coarse equiaxed grains of the AA5052-H32 BM (Figure 5a,b) have an approximately average grain size diameter of 38.5 μm. As a result of the lap spot welding of AA5052-H32 sheets, the grains are refined and the microstructure is dominated by dynamic recrystallization due to high-temperature plastic deformation. Moreover, the finest grain size diameter of 4.1 μm is found in the spot-welded joint processed at a dwell time of 2 s and a rotational speed of 500 rpm (Figure 5c,d). However, the plasticized, deformed grains become coarser with an increase in rotational speed from 500 rpm to 1500 rpm. This can be attributed to the higher heat input energy and increased plastic deformation energy. The spot-welded joint at the highest rotational speed has an average grain size diameter of 11.2 μm (Figure 5g,h).
Figure 6 reveals that the grain boundary map of the AA5052-H32 BM predominantly features high-angle grain boundaries (>15°), as shown in Figure 6a,b, which are represented by black lines. As a result of the spot welding of AA5052-H32, the density of low-angle grain boundaries (<15°) increases with increasing rotational speed from 500 rpm to 1500 rpm. This increase in low-angle grain boundaries (<15°) can be ascribed to the high heat input energy generated and severe dynamic plastic deformation (Figure 6c–h).

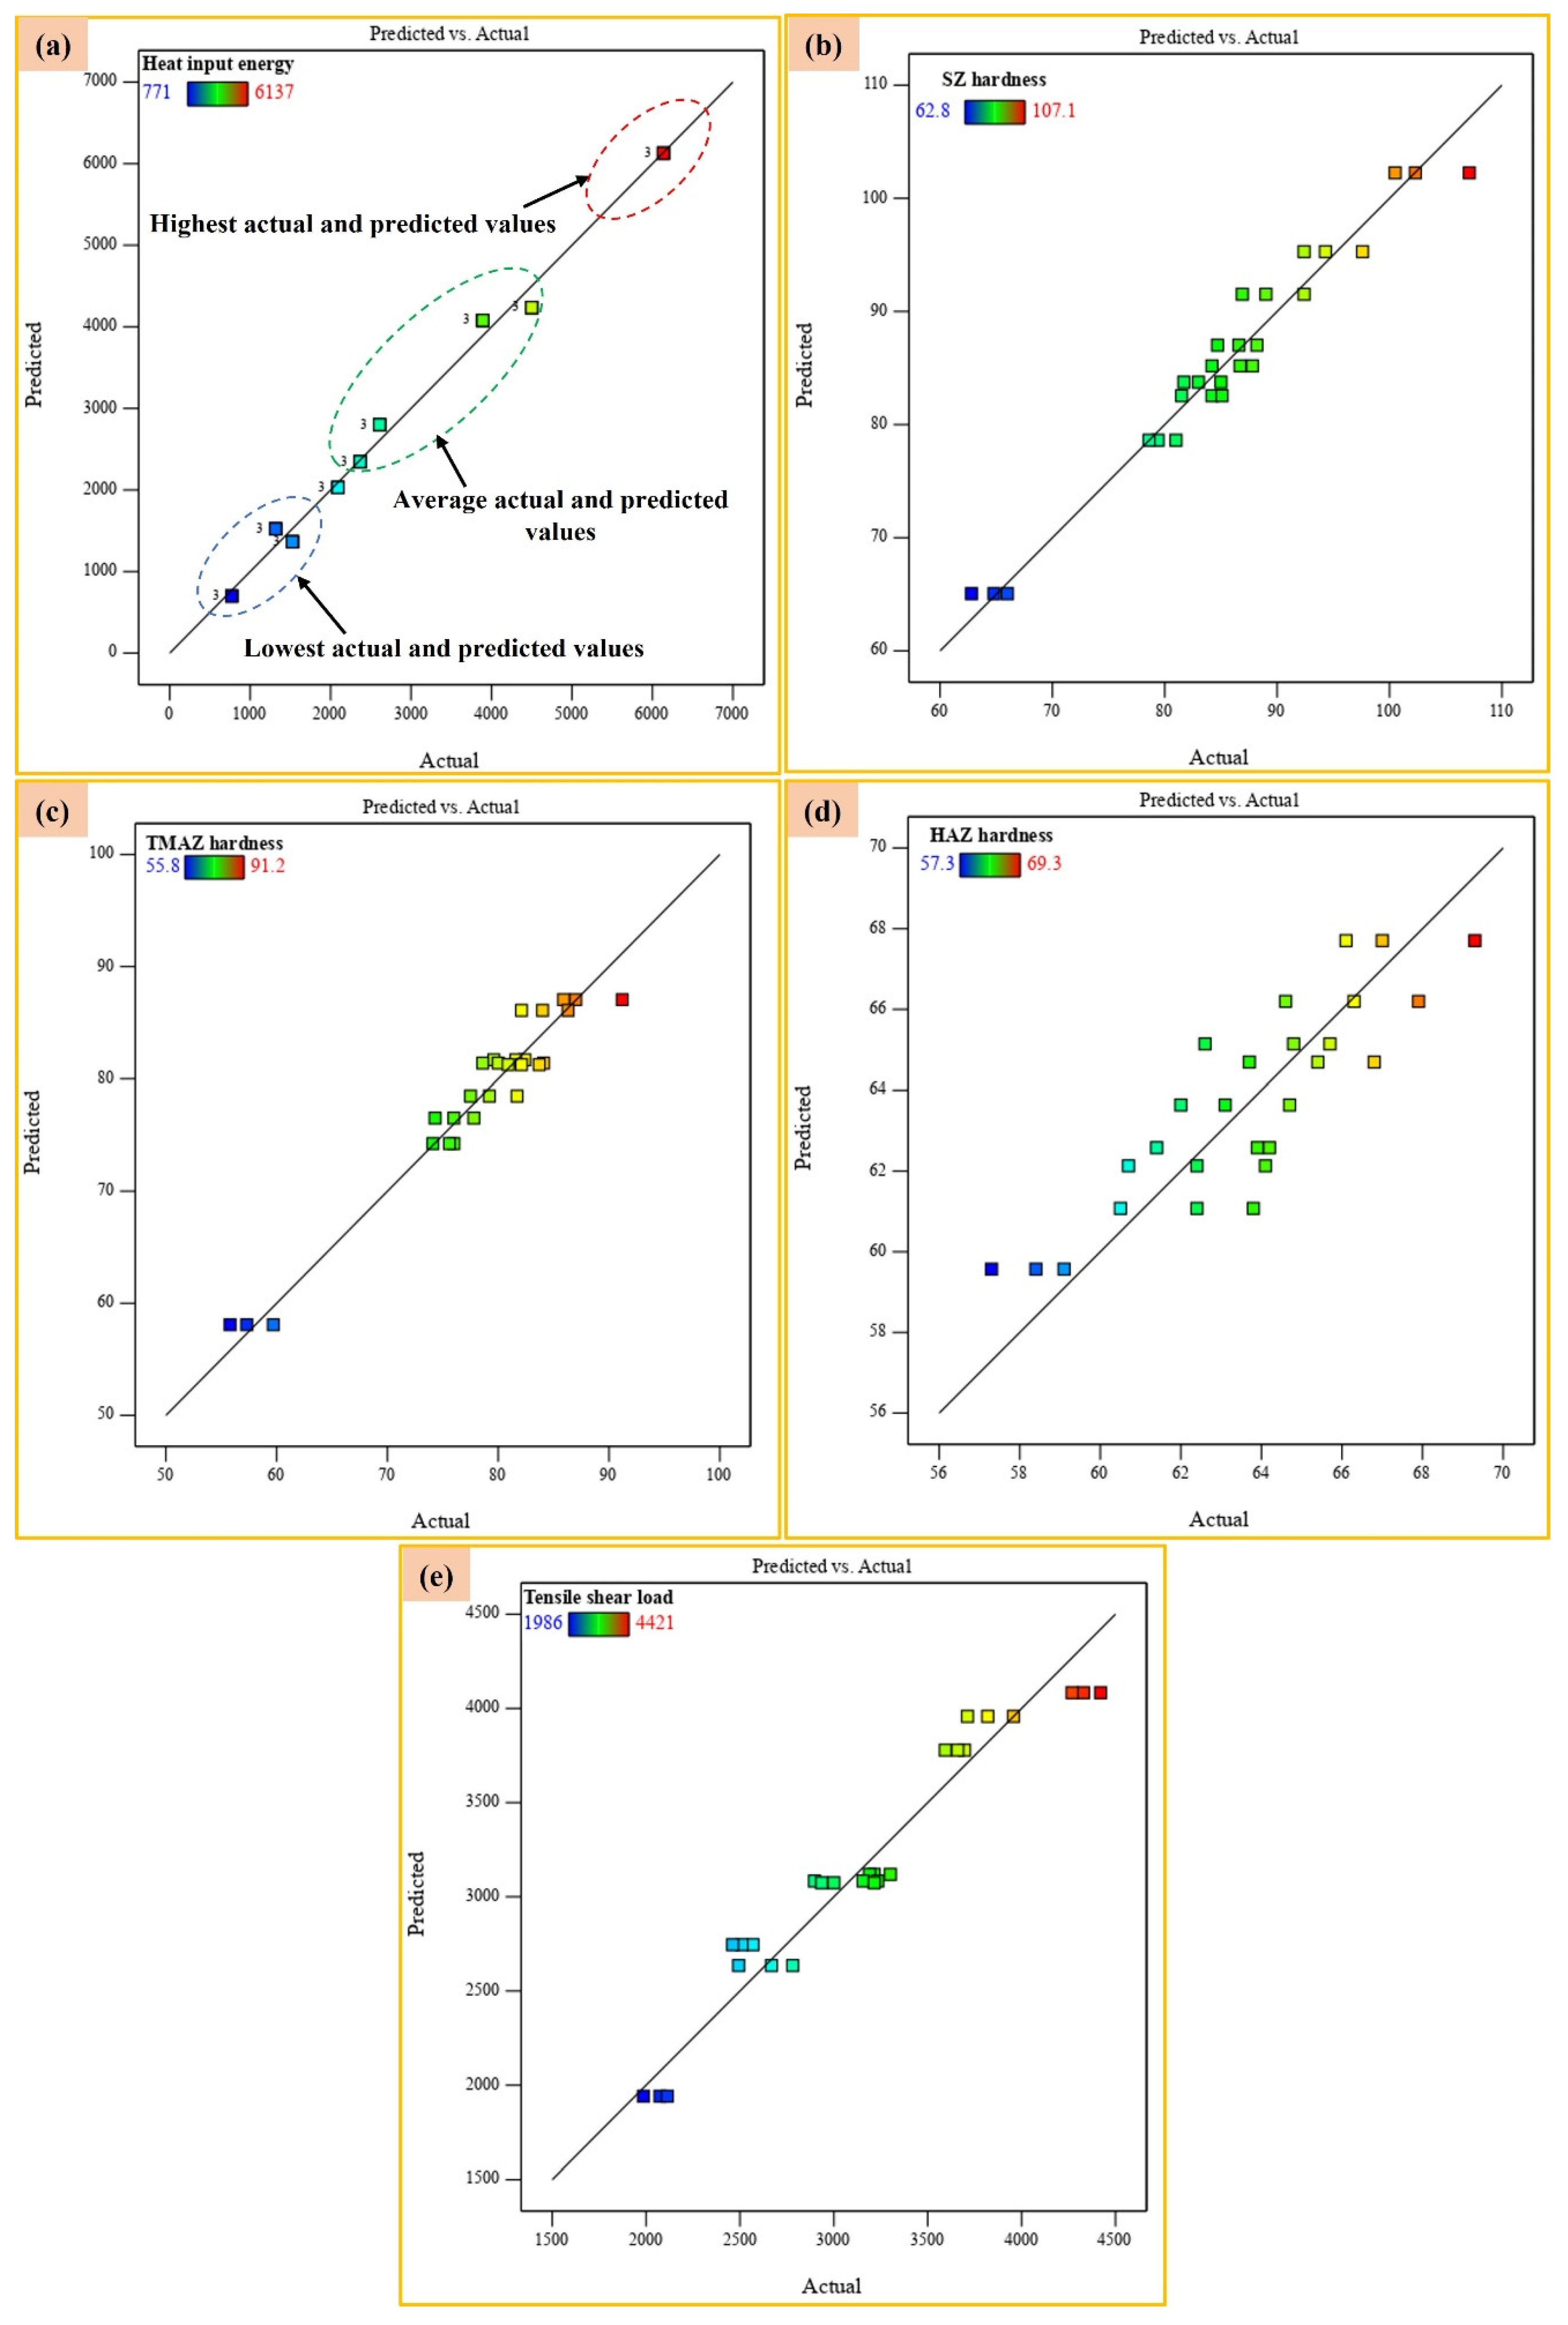
3.3. Development of RSM for AA 5052-H32 Specimens

The experimental results have undergone analysis of variance (ANOVA) to create a regression model and identify significant input parameters and interactions. The R2 value is used to analyze the fit between model-predicted values and experimentally acquired values and to determine the model’s suitability. The correlation between them is better when the R2 value is higher. These situations have high enough R2 values, which show a strong fit between the expected and measured data. As a result, appropriate response models are created using ANOVA analysis. The results of the ANOVA analysis are used to create the final models for heat input energy, SZ hardness, TMAZ hardness, HAZ hardness, and maximum shear load. Additionally, using the backward elimination procedure while considering the p-values, the insignificant terms from the ANOVA analysis are eliminated. When the p-values against each term of variables (linear, square, and interaction impact) decrease below 0.05 (i.e., in this example, the 99.08% confidence interval), larger p-values that signify the least significance are gradually eliminated. Table 5, Table 6, Table 7, Table 8 and Table 9 display the findings of the final ANOVA for heat input energy, SZ hardness, and maximum shear load, respectively. Thus, the R2 and R2-predicted values for heat input energy in Table 5 are 99.08% and 98.89%, respectively, indicating that the predictions are accurate, and the design space has been thoroughly examined. Additionally, p-values for both the rotational speed and dwell time model factors are <0.0001. They indicate that both factors have a significant effect on heat input energy. Furthermore, the R2 value indicates a good fit of the model with the data, and the low p-values confirm the statistical significance.
The R2 and R2-predicted values for the SZ hardness in Table 6 are 95.85% and 91.94%, respectively. These values, being close to 1, indicate the model’s adequacy. From Table 6, the p-values for both the rotational speed and dwell time factors are <0.0001 and 0.2070, respectively. These indicate that the rotational speed, as a model factor, has a significant effect on SZ hardness, but the dwell time does not have a significant effect on SZ hardness.
Table 7 shows that the R2 and R2-predicted values for TMAZ hardness are 94.71% and 89.54%, respectively. From this table, it can be noted that the p-values for both the rotational speed and dwell time factors are <0.0001 and 0.1556, respectively. These indicate that the rotational speed, as a model factor, has a significant effect on TMAZ hardness, but the dwell time does not have a significant effect on TMAZ hardness.
Moreover, the R2 and R2-predicted values for the HAZ hardness in Table 8 are 76.55% and 67.67%. Table 9 shows that the R2 and R2-predicted values for the maximum shear load are 93.8% and 89.25%, respectively. Furthermore, the p-values for both the rotational speed and dwell time factors are <0.0001 and 0.0105, respectively. It can be noted that these factors have a significant effect on the FSSW joint strength. These results are in agreement with other published data [32].
A mathematical second-order equation was formulated using regression analysis to describe the relationship between the input parameters of the FSSW process and the resulting output responses. Therefore, the regression model coefficients for the heat input energy, SZ hardness, TMAZ hardness, HAZ hardness, and maximum shear load were calculated with Design-Expert (version 10) software at a 99.08% confidence level. According to the summary of model statistics, the quadratic model is the most suitable for prediction and was therefore employed to predict the responses. Equations (2) to (6) represent the final regression models for the heat input energy, SZ hardness, TMAZ hardness, HAZ hardness, and tensile/shear load based on ANOVA analysis, respectively:
Heat   input   energy   ( KJ ) = 176.77778 + ( 0.421667 × A ) + ( 53 × B ) + ( 1.225 × A × B )
SZ   Hardness   ( Hv ) = + 54.44815 ( 0.023222 × A ) + ( 57.25556 × B ) ( 0.009617 × A × B ) + ( 0.000027 × A 2 ) ( 14.53889 × B 2 ) ( 0.000016 × A 2 × B ) + ( 0.006883 × A × B 2 )
TMAZ   Hardness   ( Hv ) = + 54.57407 ( 0.022911 × A ) + ( 31.19444 × B ) + ( 0.019367 × A × B ) + ( 0.000027 × A 2 ) ( 9.96111 × B 2 ) ( 0.000024 × A 2 × B ) + ( 0.003733 × A × B 2 )
HAZ   Hardness   ( Hv ) = + 69.03704 ( 0.002389 × A ) ( 0.138889 × B ) ( 0.001367 × A × B )
Maximum   shear   load   ( N ) = + 4204.96296 ( 3.10611 × A ) + ( 1214.27778 × B ) ( 0.476 × A × B ) + ( 0.001563 × A 2 ) ( 215.27778 × B 2 ) ( 0.000101 × A × B 2 )
Figure 7a–e compares the measured and predicted values for the heat input energy (Figure 7a), SZ hardness (Figure 7b), TMAZ hardness (Figure 7c), HAZ hardness (Figure 7d), and maximum shear load for AA5052-H32 joints (Figure 7e). All measured and predicted points lie close to the line, indicating that the error is normally distributed. As a result, the points are close to the measured values, indicating that the predicted values agree well with the actual values. Figure 7a depicts the heat input energy relationship between predicted and measured values, revealing a good agreement between the measured and predicted values. This result is in good agreement with the R2 value of 0.9908, which indicates the model’s adequacy.
Additionally, Figure 7b,c depicts comparison graphs between the predicted and measured SZ hardness and TMAZ hardness values. The predicted points and the actual points are close, indicating that the predicted values agree well with the actual values for both the SZ hardness and TMAZ hardness, and this confirms the model’s adequacy. These results are also in good agreement with the R2 values of 0.9585 for SZ hardness and 0.9471 for TMAZ hardness, which indicates the model’s good fitting and adequacy. While some discrepancies between the measured and predicted HAZ hardness values are observed in Figure 7b, these are primarily attributed to the complex thermal gradients and varying cooling rates inherent to the HAZ’s transitional position. Despite these localized variations, which make the HAZ response particularly sensitive, the hardness values remain within expected ranges for the alloy system and do not compromise the overall validity of our optimization approach.
The relationship between the predicted and actual maximum shear load values is given in Figure 7e. Furthermore, the predicted values from the maximum shear load model appear to be in good agreement with the actual values in this figure. In addition, this result is confirmed by an R2 value of 0.9380, which demonstrates the model’s good fit and adequacy.

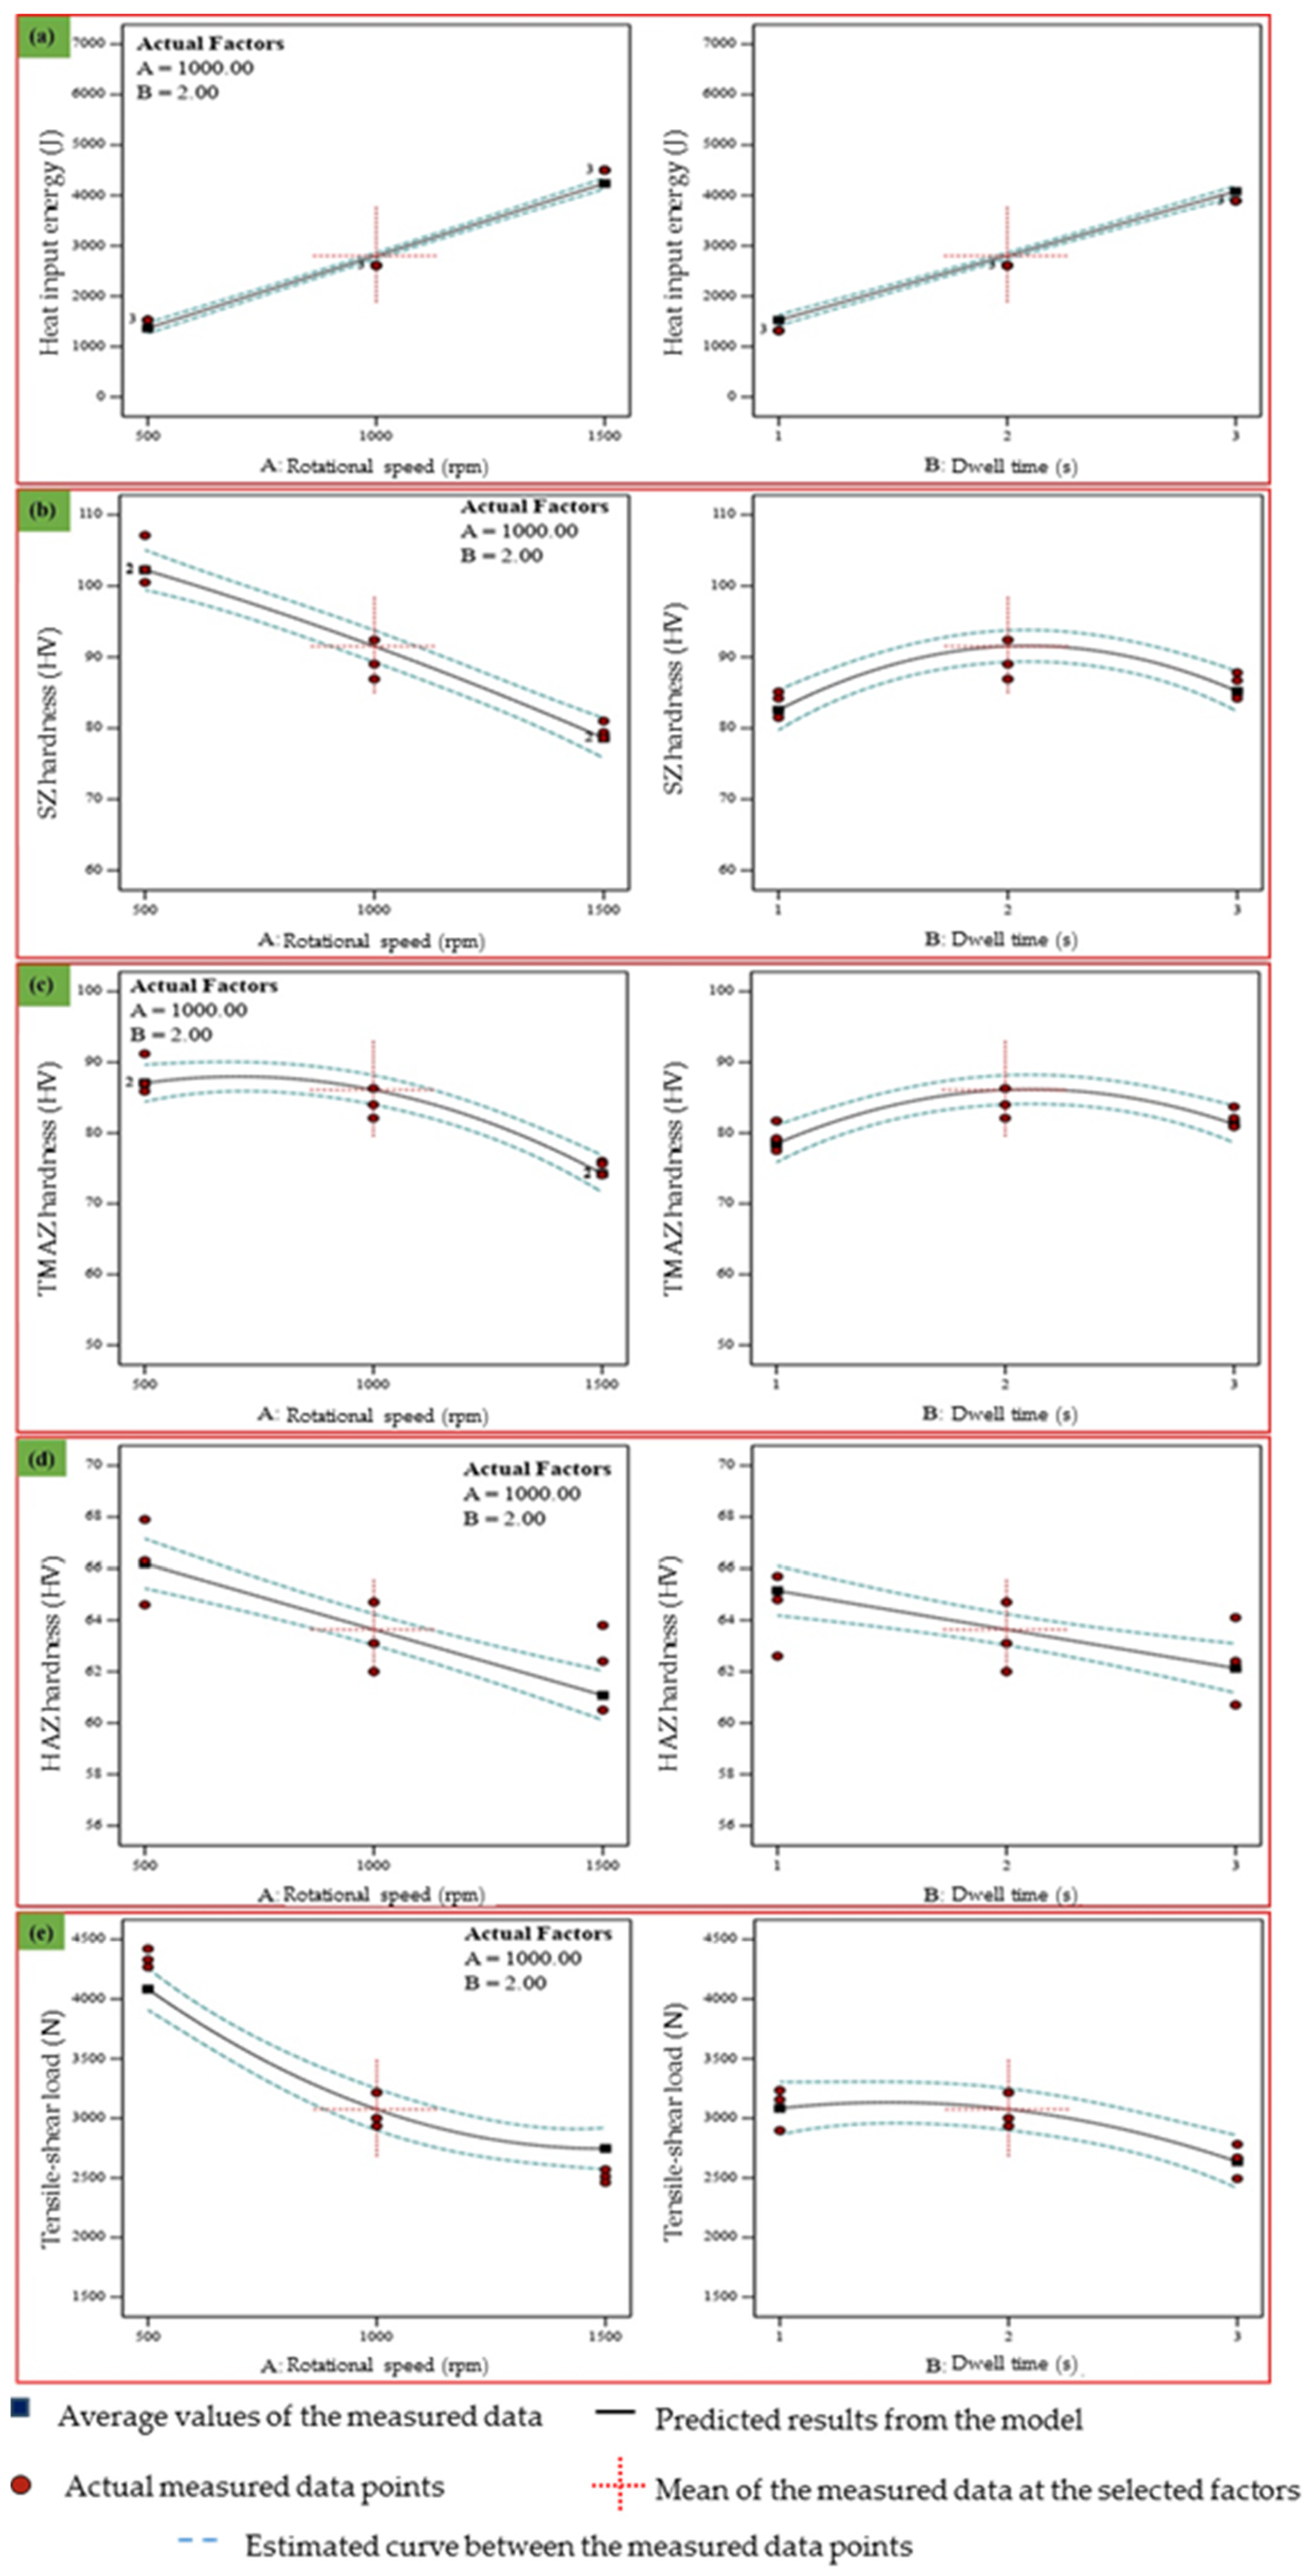
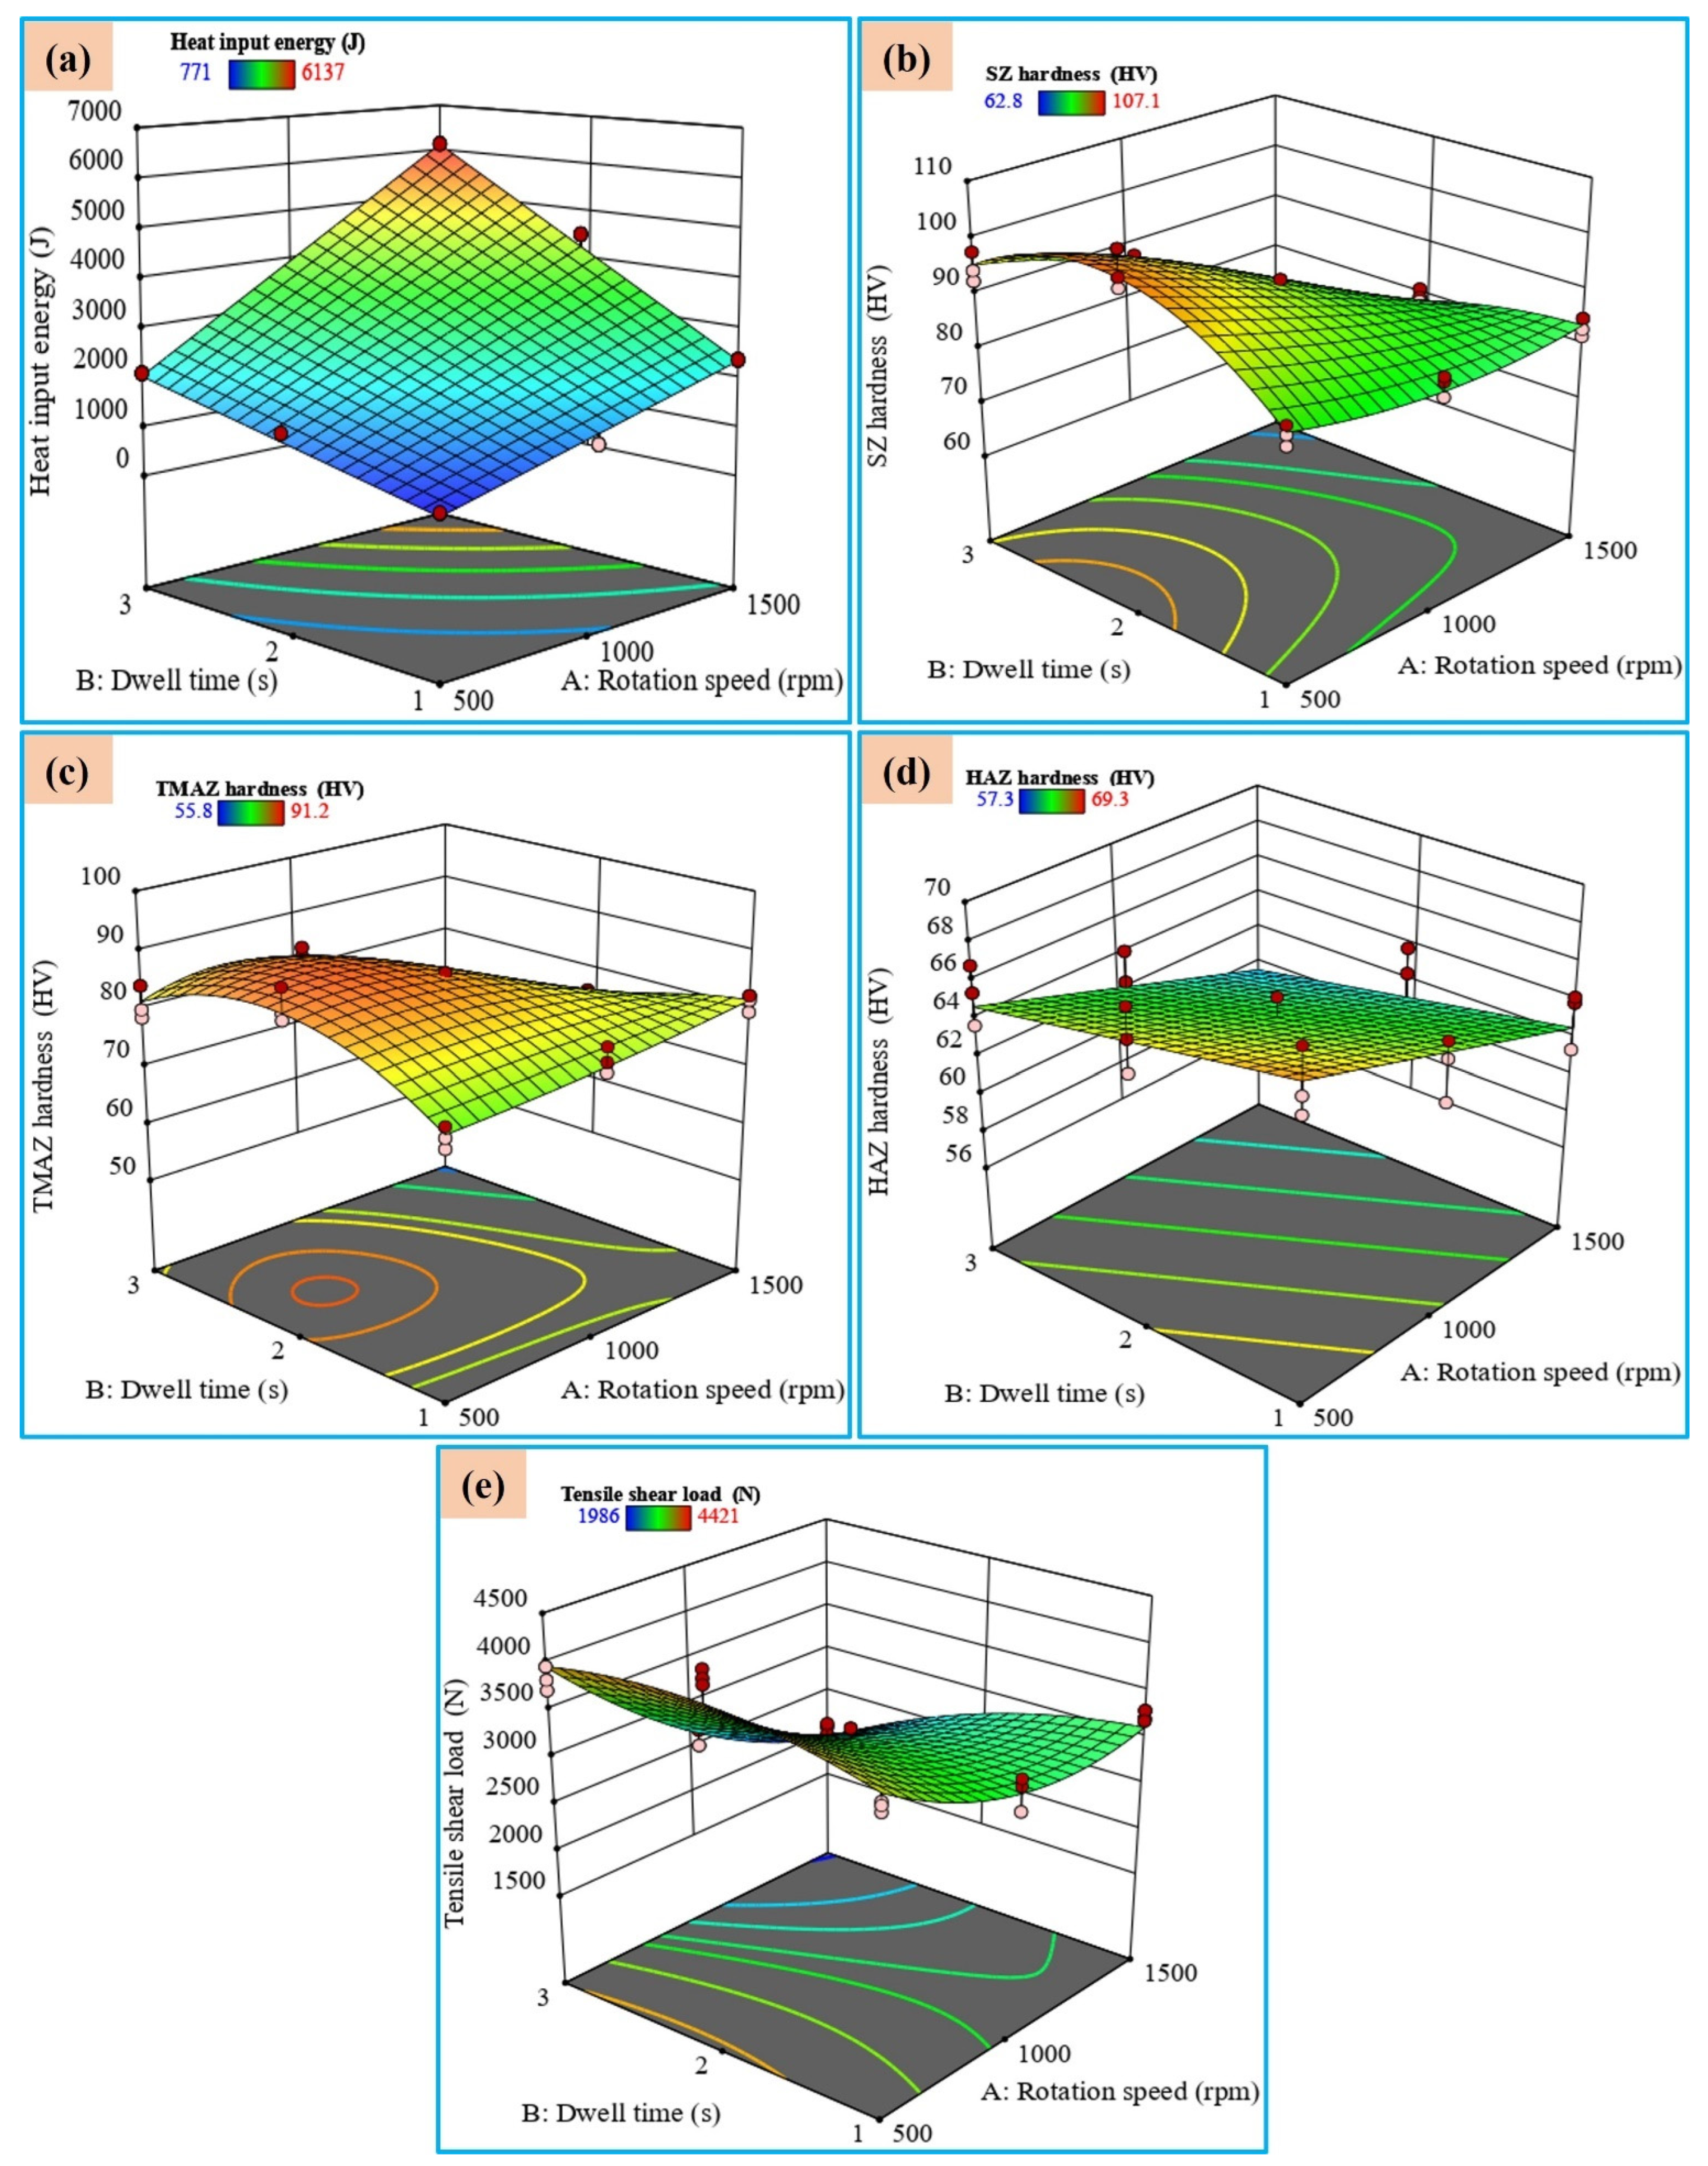
3.4. Effects of Variables on the Output Responses

The major effects of the heat input energy, SZ hardness, and maximum shear load are depicted in Figure 8, as are the individual effects of the rotational speed and dwell time. In this figure, the actual measured data points are represented by dots, while their average values are shown by square symbols. Dashed lines illustrate the estimated trend behavior between the measured data points, and continuous lines represent the predicted results derived from the model. A red cross specifically marks the mean of the measured data at the selected factors (rotational speed of 1000 rpm and dwell time of 2 s), which were chosen based on their representation of optimum measured data. Figure 8a shows that increasing the rotational speed and dwell time increases the heat input energy. As a result, the highest heat input energy was obtained at a 1500 rpm rotational speed and a 3 s dwell time. The hardness of the SZ, TMAZ, and HAZ decreases as the heat input energy increases, but increasing the dwell time increases the hardness, as shown in Figure 8b–d. The best results for SZ and TMAZ hardness are obtained at a rotational speed of 500 rpm and a dwell time of 2 s, while the lowest results are attained at a tool rotational speed of 1500 rpm and a spot-welding time of 1 s. On the other hand, the highest results for the HAZ hardness are found at 500 rpm and 1 s, while the lowest results are obtained at a tool rotational speed of 1500 rpm and a dwell time of 3 s. In Figure 8e, the maximum shear load decreases with an increase in the rotational speed from 500 to 1500 rpm and the dwell time from 1 s to 3 s.

3.5. Influences of Two-Factor Interaction on Heat Input Energy, SZ Hardness, and Maximum Tensile–Shear Load

The dual interaction of the rotational speed and spot-welding time governs the heat input energy, the SZ hardness and that of adjacent zones (TMAZ, HAZ), and the maximum tensile shear load of the FSSW joint. Figure 9 depicts a 3D response surface plot of the effect of the dwell time and rotational speed on the heat input energy, SZ hardness, TMAZ hardness, HAZ hardness, and maximum tensile shear load for the FSSW 5052-H32 aluminum alloy joints. The impact of the rotational speed and dwell time on the heat input energy is shown in Figure 9a. The heat input energy is minimized (771 J) at a low rotational speed of 500 rpm and a dwell time of 1 s. Conversely, it reaches its maximum value (up to 6137 J) at the highest rotational speed of 1500 rpm and a dwell time of 3 s. As a result, at all dwell times, the heat input energy increases as the rotational speed increases. Additionally, this figure demonstrates that the rotational speed and dwell time have a greater impact on the heat input. Figure 9b illustrates how the rotational speed and dwell duration influence the hardness within the SZ of the produced FSSW samples. It is worth noting that the SZ hardness reaches its lowest value of 81 Hv when the rotational speed is 1000 rpm and the dwell time is 1 s. With a rotational speed of 500 rpm and a dwell time of 2 s, the highest SZ hardness value of 110 Hv is obtained. As a result, as the rotational speed increases, the hardness of the SZ decreases. Hence, the rotational speed has a greater effect on the SZ hardness than the dwell time. The main focus of the maximum tensile shear load is to assess the strength and plasticity of FSSW materials and to investigate the effect of processing parameters on the performance of the produced specimens. As shown in Figure 9e, the higher shear load is obtained at the mean rotational speed of 500 rpm and a 2 s dwell time, whereas the lowest shear load is obtained at the rotational speed of 1500 rpm and dwell time of 3 s. The findings demonstrate that the duration of the dwell time significantly influences the maximum tensile shear load.

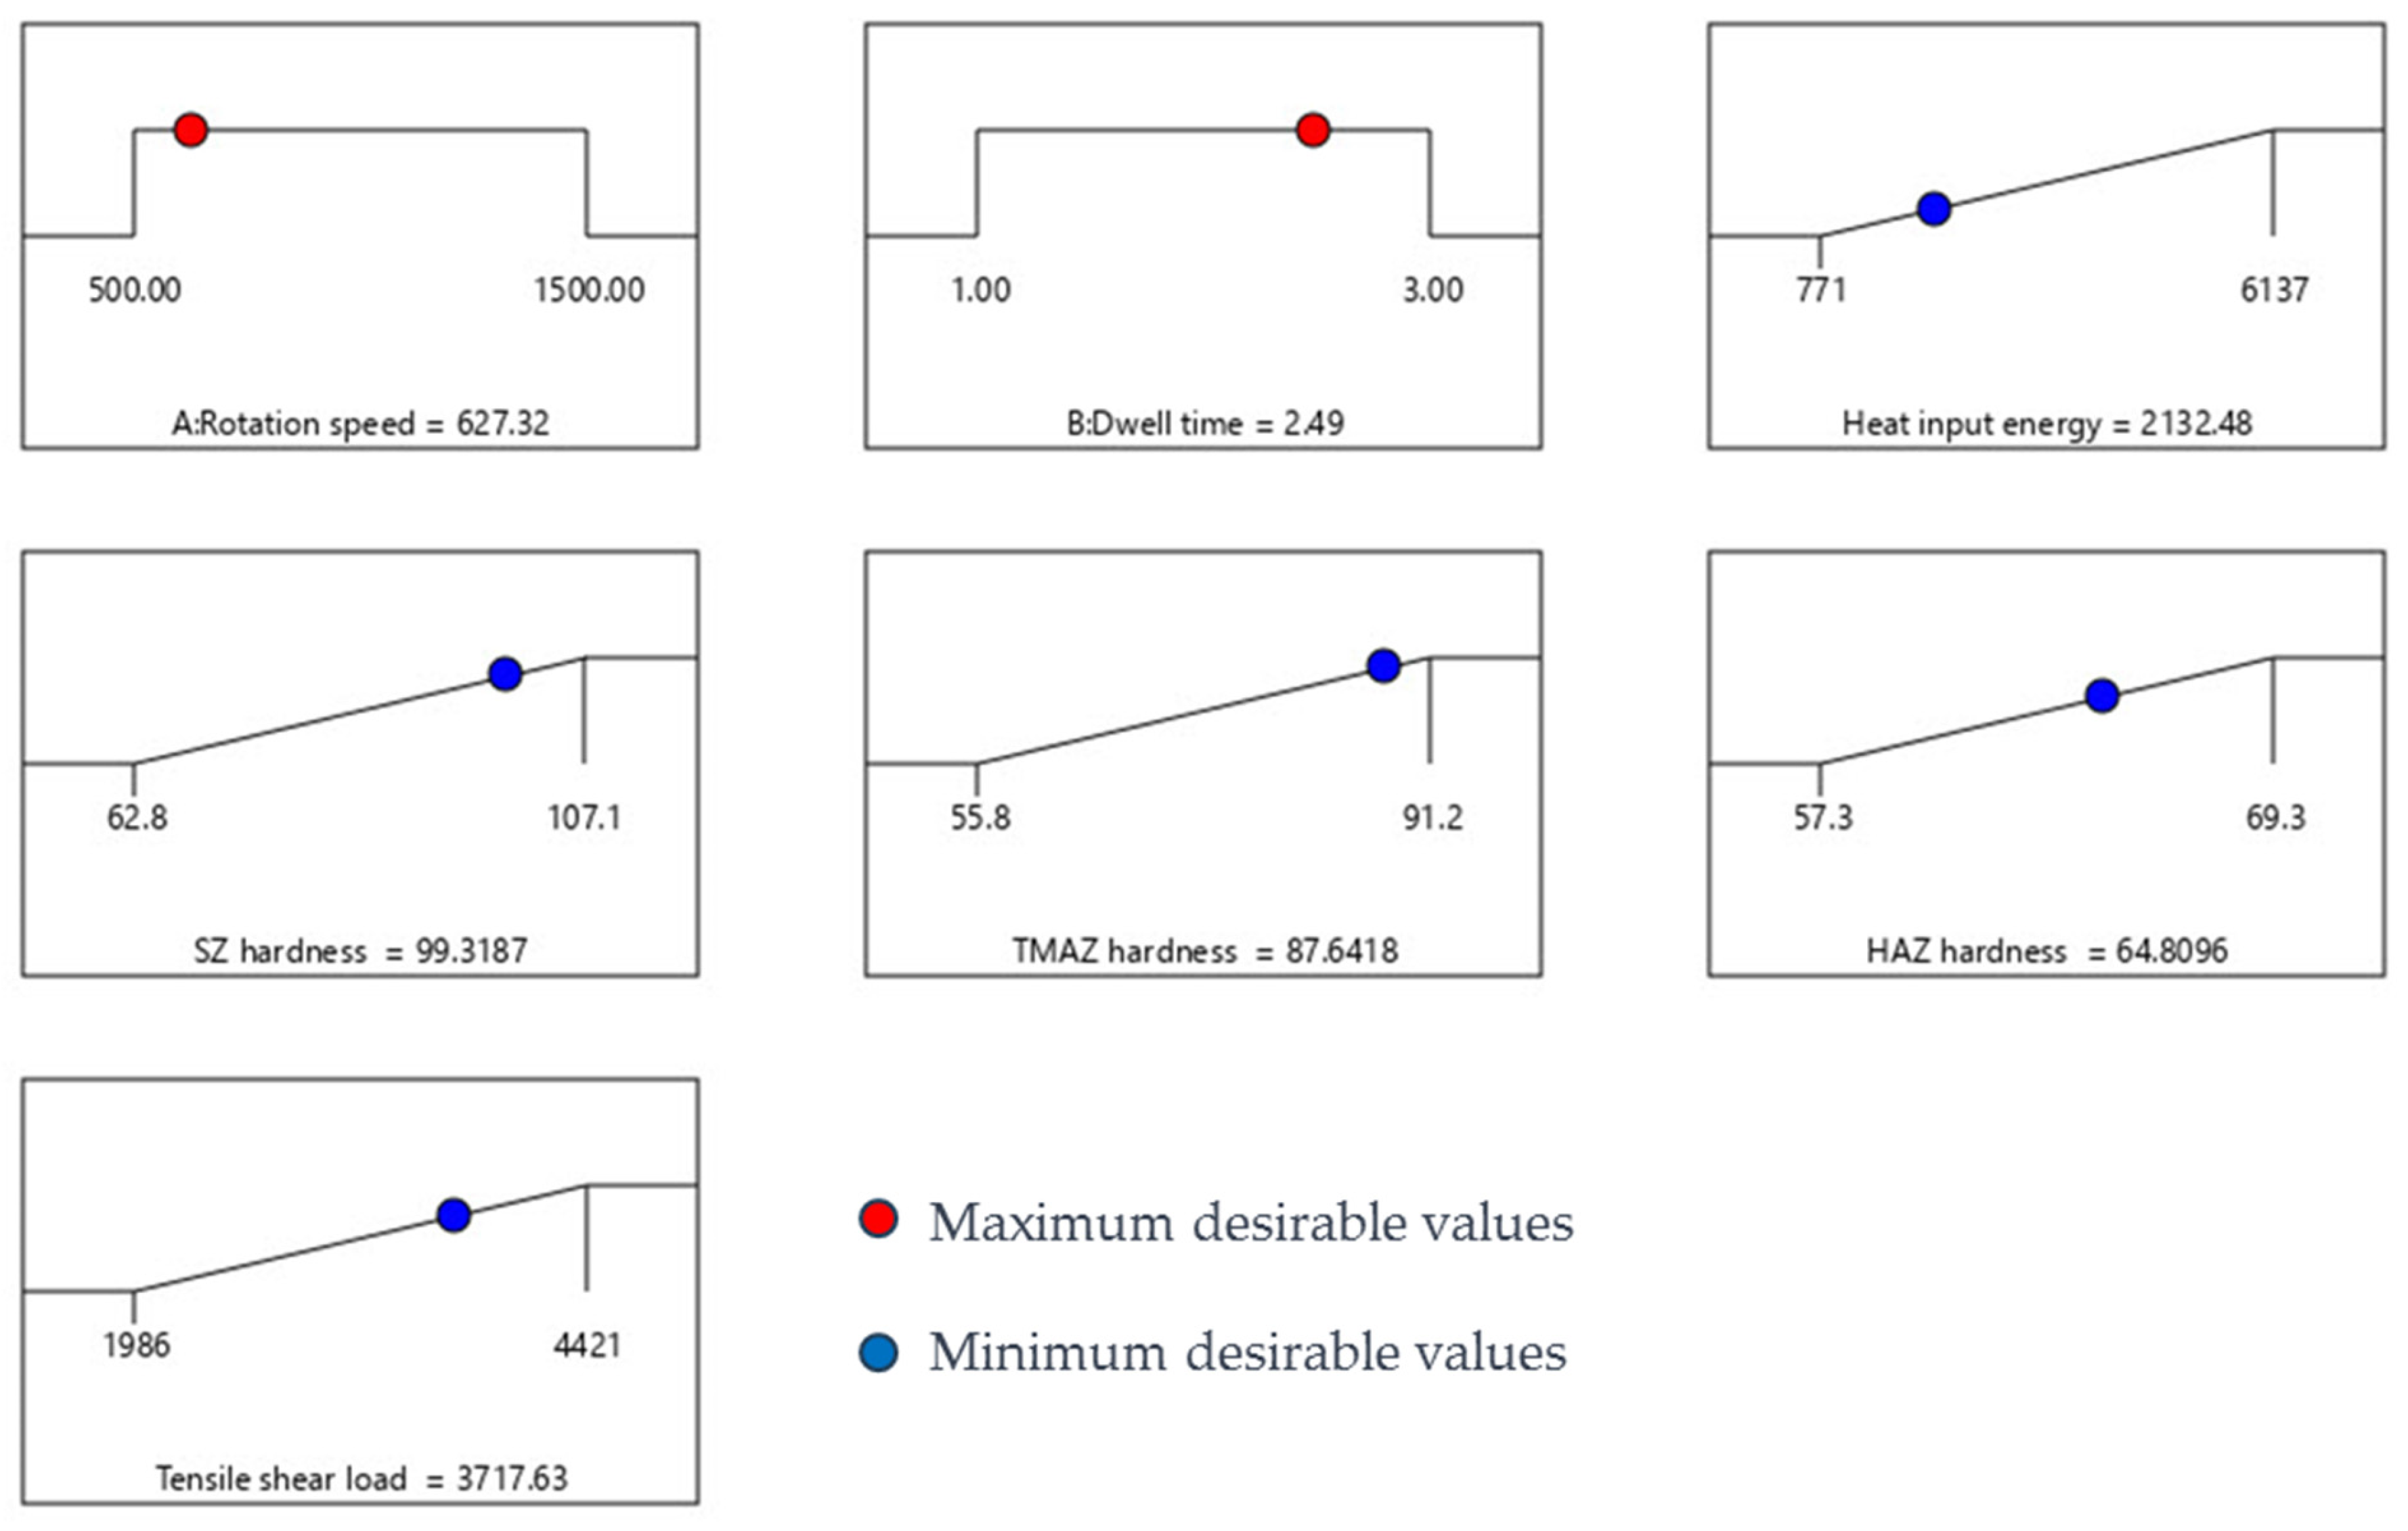
3.6. Optimization of FSSW Variables via the Desirability Approach

Many statistical strategies can be used to solve optimization problems, but due to their generality and software simplicity, the desirability method is often preferred. This method determines the best operating conditions to achieve the desired response values. The optimization of a desirability function involves three key stages: Initially, the desired outcomes for each measured variable, including the welding parameters, should be defined. Next, the acceptable range (minimum and maximum values) for each of these variables should be specified. Finally, the desired operating conditions should be inputted to see the model’s predicted outcomes. Table 10 depicts the optimization criteria utilized in the current study. All responses are converted to an individual degree of freedom on a scale of 0 to 1. The combination of FSSW variables with the greatest desirability is considered optimal. A maximum desirability of approximately 1.00 was accomplished using a rotational speed of 627.32 rpm and a dwell time of 2.49 s. The predicted heat input energy, SZ hardness, TMAZ hardness, HAZ hardness, and maximum shear load for the best combination are 2132.48 J, 99.3187 Hv, 87.6418 Hv, 64.8096 Hv, and 3717.63 N, respectively. The results are obtained by calculating the tensile–shear load of the weld lap joint using the ramp chart, as shown in Figure 10.

3.7. Confirmation Test of the Developed Mathematical Models

To validate the regression models, two confirmation tests were performed. The values used in the validation tests were all within the specified range. However, these validation points were distinct from the combinations used to build the initial model (the FCCD matrix). Hence, the percentage error was calculated by Equation (7). Table 11 presents the actual and model-predicted results for these validation tests. The observed difference between the experimental and predicted values was within the 95% confidence interval, indicating the model’s reliability and good agreement between predictions and experimental results. As a result, it can be concluded that the developed models are suitable and applicable to all values within the designed space. Additionally, the developed models yield nearly accurate results.
P e r c e n t a g e   e r r o r   ( E % ) = A c t u a l   v a l u e P r e d i c t e d   v a l u e P r e d i c t e d   v a l u e 100

4. Conclusions

  • A higher generated frictional heat input decreases the mechanical properties and increases the material softening of the produced FSSW joints.
  • RSM was proven to be a precise technique for optimizing the FSSW process to achieve optimal mechanical properties of the AA5052-H32 weldments. Based on FCCD, RSM can effectively model and predict the heat input energy, SZ hardness, and maximum shear load for friction stir spot welding technology.
  • The ANOVA values showed that the significant terms (F-values) used to build and develop the mathematical models were 829.33, 62.72, 48.58, 25.02, and 50.44 for the heat input energy, SZ hardness, TMAZ hardness, HAZ hardness, and maximum shear load, respectively, indicating that all models were statistically significant.
  • As a result of the mathematical model, the rotational speed has a significant influence on the SZ hardness values of AA5052-H32 welded joints. It was noticed that the dwell time of 1.5 s at rotational speeds of 750 rpm and 1250 rpm possesses the highest SZ hardness value of 92.7 Hv and 118.4 Hv, respectively.
  • The predominant fracture mode observed was ductile fracture, characterized by dimples of varying sizes and shapes. Additionally, the presence of fine dimples suggests a mixed fracture mechanism involving both shear and ductile modes.

Author Contributions

Conceptualization, M.M.E.-S.S., S.A., R.A.F., M.M.Z.A. and H.A.R.; methodology, S.A., R.A.F., M.M.E.-S.S. and H.A.R.; software, M.M.Z.A., S.A. and N.H.A.; investigation, N.H.A., S.A. and A.B.; resources, M.M.E.-S.S. and A.B.; data curation, H.A.R., A.B. and M.M.Z.A.; writing—original draft preparation, R.A.F., H.A.R., M.M.Z.A. and S.A.; writing—review and editing, R.A.F., N.H.A., M.M.E.-S.S., S.A. and M.M.Z.A.; visualization, H.A.R., A.B. and S.A.; supervision, M.M.E.-S.S., S.A., A.B., H.A.R. and M.M.Z.A.; project administration, N.H.A., S.A. and. M.M.E.-S.S.; funding acquisition, S.A. and N.H.A. All authors have read and agreed to the published version of the manuscript.

Funding

This work was supported and funded by the Deanship of Scientific Research at Imam Mohammad Ibn Saud Islamic University (IMSIU) (grant number IMSIU-DDRSP2503).

Data Availability Statement

The original contributions presented in this study are included in the article. Further inquiries can be directed to the corresponding author.

Conflicts of Interest

The authors declare no conflicts of interest.

References

  1. Zhang, Z.; Yang, X.; Zhang, J.; Zhou, G.; Xu, X.; Zou, B. Effect of Welding Parameters on Microstructure and Mechanical Properties of Friction Stir Spot Welded 5052 Aluminum Alloy. Mater. Des. 2011, 32, 4461–4470. [Google Scholar] [CrossRef]
  2. Mothilal, M.; Kumar, A. Optimization of Friction Stir Welding Process Parameter in the Joining of AA7075-T6/AA5083-O Dissimilar Aluminum Alloy Using Response Surface Methodology. Int. J. Press. Vessel. Pip. 2024, 211, 105282. [Google Scholar] [CrossRef]
  3. Piccini, J.M.; Svoboda, H.G. Effect of the Tool Penetration Depth in Friction Stir Spot Welding (FSSW) of Dissimilar Aluminum Alloys. Procedia Mater. Sci. 2015, 8, 868–877. [Google Scholar] [CrossRef]
  4. Ahmed, M.M.Z.; El-Sayed Seleman, M.M.; Sobih, A.M.E.S.; Bakkar, A.; Albaijan, I.; Touileb, K.; Abd El-Aty, A. Friction Stir-Spot Welding of AA5052-H32 Alloy Sheets: Effects of Dwell Time on Mechanical Properties and Microstructural Evolution. Materials 2023, 16, 2818. [Google Scholar] [CrossRef]
  5. Wang, B.; Xu, L.; Guo, B.; Zhang, H. Process and Performance Characteristics of an Improved Friction-Stir Riveting Process. J. Manuf. Process 2021, 62, 234–246. [Google Scholar] [CrossRef]
  6. Ragab, A.E.; Alsaty, A.; Alsamhan, A.; Al-Tamimi, A.A.; Dabwan, A.; Sayed, A.; Alghilan, W. Open-Source Real-Time Monitoring System of Temperature and Force during Friction Stir Spot Welding. J. Eng. Res. 2024, 13, 84–96. [Google Scholar] [CrossRef]
  7. Jambhale, S.; Kumar, S.; Kumar, S. Characterization and Optimization of Flat Friction Stir Spot Welding of Triple Sheet Dissimilar Aluminium Alloy Joints. Silicon 2022, 14, 815–830. [Google Scholar] [CrossRef]
  8. Ahmed, M.M.Z.; El-Sayed Seleman, M.M.; Albaijan, I.; Abd El-Aty, A. Microstructure, Texture, and Mechanical Properties of Friction Stir Spot-Welded AA5052-H32: Influence of Tool Rotation Rate. Materials 2023, 16, 3423. [Google Scholar] [CrossRef]
  9. Mubiayi, M.P. Current Developments in Friction Stir Welding (FSW) and Friction Stir Spot Welding (FSSW) of Aluminium and Titanium Alloys. Eng. Proc. 2023, 56, 184. [Google Scholar] [CrossRef]
  10. Kilic, S.; Ozturk, F.; Demirdogen, M.F. A Comprehensive Literature Review on Friction Stir Welding: Process Parameters, Joint Integrity, and Mechanical Properties. J. Eng. Res. 2024, 13, 122–130. [Google Scholar] [CrossRef]
  11. Anton Savio Lewise, K.; Edwin Raja Dhas, J.; Pandiyarajan, R.; Sabarish, S. Metallurgical and Mechanical Investigation on FSSWed Dissimilar Aluminum Alloy. J. Alloys Metall. Syst. 2023, 2, 100010. [Google Scholar] [CrossRef]
  12. Jo, D.S.; Kahhal, P.; Kim, J.H. Optimization of Friction Stir Spot Welding Process Using Bonding Criterion and Artificial Neural Network. Materials 2023, 16, 3757. [Google Scholar] [CrossRef] [PubMed]
  13. Fan, W.; Yang, X.; Chu, Q.; Li, W. An Efficient Synergistic Double-Sided Friction Stir Spot Welding Method: A Case Study on Process Optimization, Interfacial Characteristics and Mechanical Properties of 2198-T8 Aluminum-lithium Alloy Joints. J. Manuf. Process 2024, 131, 213–232. [Google Scholar] [CrossRef]
  14. Meng, T.; Yang, X.; Su, Y.; Ma, S.; Xu, H.; Guo, Z.; Ma, T.; Li, W. Formation Mechanism and Failure Behavior in Synergistic Double-Sided Probeless Friction Stir Spot Welded Joints of 6061 Aluminum Alloy. Mater. Charact. 2025, 219, 114631. [Google Scholar] [CrossRef]
  15. El-Sayed Seleman, M.M.; Alateyah, A.I.; Mahmoud, E.A.E.; Elsoeudy, R.I.; Ahmed, M.M.Z.; Hafez, K.M.; El-Garaihy, W.H.; A.S, A. Friction Stir Welding of 2507 Super-Duplex Stainless Steel: Feasibility of Butt Joint Groove Filling at Different Process Parameters. Adv. Mater. Process. Technol. 2024, 1–23. [Google Scholar] [CrossRef]
  16. Yang, X.W.; Fu, T.; Li, W.Y. Friction Stir Spot Welding: A Review on Joint Macro- and Microstructure, Property, and Process Modelling. Adv. Mater. Sci. Eng. 2014, 2014, 697170. [Google Scholar] [CrossRef]
  17. Shen, Z.; Ding, Y.; Gerlich, A.P. Advances in Friction Stir Spot Welding. Crit. Rev. Solid. State Mater. Sci. 2020, 45, 457–534. [Google Scholar] [CrossRef]
  18. Pan, T.Y. Friction Stir Spot Welding (FSSW)—A Literature Review; SAE Technical Paper 2007-01-1702; SAE International: Warrendale, PA, USA, 2007. [Google Scholar] [CrossRef]
  19. Badwelan, A.; Al-Samhan, A.M.; Anwar, S.; Hidri, L. Novel Technique for Enhancing the Strength of Friction Stir Spot Welds through Dynamic Welding Parameters. Metals 2021, 11, 280. [Google Scholar] [CrossRef]
  20. Suryanarayanan, R.; Sridhar, V.G. Influence of Welding Parameters on the Weld Properties in Friction Stir Spot Welding of Aluminium Alloys of Varying Thicknesses. Mater. Today Proc. 2021, 46, 8525–8531. [Google Scholar] [CrossRef]
  21. Guo, Y.; Zhao, H.; Ai, C.; Zhao, J.; Su, H.; Chen, J.; Zhao, G. Parameter Optimization of Friction Stir Spot Welded Al 6061 and CFRTP PA6 with Surface Treatment and Interfacial Adhesion. Thin-Walled Struct. 2024, 197, 111585. [Google Scholar] [CrossRef]
  22. Shekhawat, R.S.; Nadakuduru, V.N. Friction Stir Spot Welding and Characterization of Bulk Aluminum Alloy 6061 Synthesized Using Powder Metallurgical Route. Powder Metall. Met. Ceram. 2024, 63, 240–249. [Google Scholar] [CrossRef]
  23. Suryanarayanan, R.; Sridhar, V.G. Materials Today: Proceedings Studies on the Influence of Process Parameters in Friction Stir Spot Welded Joints—A Review. Mater. Today Proc. 2021, 37, 2695–2702. [Google Scholar] [CrossRef]
  24. Yöntemi, T.; Sürtünme, K.; Aisi, B. Optimization of Welding Parameters of AISI 431 and AISI 1020 Joints Joined by Friction Welding Using Taguchi Method. Bilecik Şeyh Edebali Üniv. Fen Bilim. Derg. 2022, 9, 453–470. [Google Scholar]
  25. Mitlin, D.; Radmilovic, V.; Pan, T.; Chen, J.; Feng, Z.; Santella, M.L. Structure-Properties Relations in Spot Friction Welded (Also Known as Friction Stir Spot Welded) 6111 Aluminum. Mater. Sci. Eng. A 2006, 441, 79–96. [Google Scholar] [CrossRef]
  26. Tiwan; Ilman, M.N.; Kusmono. Microstructure and Mechanical Properties of Friction Stir Spot Welded AA5052-H112 Aluminum Alloy. Heliyon 2021, 7, e06009. [Google Scholar] [CrossRef]
  27. Reji, M.; Kumar, R. Response Surface Methodology (RSM): An Overview to Analyze Multivariate Data. Indian J. Microbiol. Res. 2022, 9, 241–248. [Google Scholar]
  28. Chen, W.-H.; Carrera Uribe, M.; Kwon, E.E.; Lin, K.-Y.A.; Park, Y.-K.; Ding, L.; Saw, L.H. A Comprehensive Review of Thermoelectric Generation Optimization by Statistical Approach: Taguchi Method, Analysis of Variance (ANOVA), and Response Surface Methodology (RSM). Renew. Sustain. Energy Rev. 2022, 169, 112917. [Google Scholar] [CrossRef]
  29. Kumar, D.; Mandal, A. Response Surface Method-Based Optimisation of Advanced Mechanochemical Approach for Bead Minimisation in Bamboo Fiber Extraction, and Improving Hydrophobicity via Diisopropanolamine Treatment. Biomass Convers. Biorefinery 2024, 14, 23743–23759. [Google Scholar] [CrossRef]
  30. Ren, G.; Heo, S.; Kim, T.H.; Cheong, C. Response Surface Method-Based Optimization of the Shroud of an Axial Cooling Fan for High Performance and Low Noise. J. Mech. Sci. Technol. 2013, 27, 33–42. [Google Scholar] [CrossRef]
  31. Albaijan, I.; Ahmed, M.M.Z.; El-Sayed Seleman, M.M.; Touileb, K.; Habba, M.I.A.; Fouad, R.A. Optimization of Bobbin Tool Friction Stir Processing Parameters of AA1050 Using Response Surface Methodology. Materials 2022, 15, 6886. [Google Scholar] [CrossRef]
  32. Tutar, M.; Aydin, H.; Yuce, C.; Yavuz, N.; Bayram, A. The Optimisation of Process Parameters for Friction Stir Spot-Welded AA3003-H12 Aluminium Alloy Using a Taguchi Orthogonal Array. Mater. Des. 2014, 63, 789–797. [Google Scholar] [CrossRef]
  33. Al-Sabur, R. Tensile Strength Prediction of Aluminium Alloys Welded by FSW Using Response Surface Methodology–Comparative Review. Mater. Today Proc. 2021, 45, 4504–4510. [Google Scholar] [CrossRef]
  34. Kadaganchi, R.; Gankidi, M.R.; Gokhale, H. Optimization of Process Parameters of Aluminum Alloy AA 2014-T6 Friction Stir Welds by Response Surface Methodology. Def. Technol. 2015, 11, 209–219. [Google Scholar] [CrossRef]
  35. Rajendran, C.; Sonar, T.; Ivanov, M.; Kumar, P.S.; Amarnath, V.; Lokanadham, R. Optimization of Friction Stir Spot Welding Parameters for Joining Dissimilar AZ31B Magnesium Alloy and AA6061 Aluminium Alloy Using Response Surface Methodology. Int. J. Interact. Des. Manuf. (IJIDeM) 2025, 19, 115–126. [Google Scholar] [CrossRef]
  36. El-Sayed Seleman, M.M.; Elnaml, A.M.; Ataya, S.; Ahmed, M.M.Z.; Elnekhaily, S.A.; Hafez, K.M. A Hybrid Analytical-Numerical Model of Heat Generation and Distribution in Friction Stir Welded AA2024 Butt Joints. Int. J. Integr. Eng. 2024, 16, 140–161. [Google Scholar] [CrossRef]
  37. Chatterjee, S.; Mahapatra, S.S.; Bharadwaj, V.; Upadhyay, B.N.; Bindra, K.S.; Thomas, J. Parametric Appraisal of Mechanical and Metallurgical Behavior of Butt Welded Joints Using Pulsed Nd:YAG Laser on Thin Sheets of AISI 316. Opt. Laser Technol. 2019, 117, 186–199. [Google Scholar] [CrossRef]
  38. Zhao, Y.Q.; Liu, H.J.; Chen, S.X.; Lin, Z.; Hou, J.C. Effects of Sleeve Plunge Depth on Microstructures and Mechanical Properties of Friction Spot Welded Alclad 7B04-T74 Aluminum Alloy. Mater. Des. 2014, 62, 40–46. [Google Scholar] [CrossRef]
  39. Tozaki, Y.; Uematsu, Y.; Tokaji, K. Effect of Processing Parameters on Static Strength of Dissimilar Friction Stir Spot Welds between Different Aluminium Alloys. Fatigue Fract. Eng. Mater. Struct. 2007, 30, 143–148. [Google Scholar] [CrossRef]
  40. Ibrahim, I.J.; Yapici, G.G. Application of a Novel Friction Stir Spot Welding Process on Dissimilar Aluminum Joints. J. Manuf. Process 2018, 35, 282–288. [Google Scholar] [CrossRef]
Figure 1. (a) FSSW process and clamping system, (b) FSSW tool setup used, (c) FSSW specimens (all dimensions in mm) with two backing sheets, (d) side and (e) front view of AA5052-H32 FSSW specimen under tensile–shear testing.
Crystals 15 00571 g001
Figure 2. The average hardness values measured in SZ of the produced spot welds processed at various rotational speed (500, 1000, 1500 rpm) and dwell times.
Crystals 15 00571 g002
Figure 3. Provides a comparison of the maximum tensile/shear strength of the produced spot welds across a range of rotational speeds (500–1500 rpm) and dwell times (1, 2, and 3 s).
Crystals 15 00571 g003
Figure 4. The fracture surface for the BM (a) and spot-welded joints processed at various dwell times and rotational speeds: (b) 500 rpm and 1 s, (c) 500 rpm and 2 s, (d) 500 rpm and 3 s, (e) 1000 rpm and 1 s, (f) 1000 rpm and 2 s, (g) 1000 rpm and 3 s, (h) 1500 rpm and 1 s, (i) 1500 rpm and 2 s, and (j) 1500 rpm and 3 s.
Crystals 15 00571 g004
Figure 5. IPF-colored maps and grain size analysis of the BM and SZ microstructures of friction stir welded samples at different tool rotational speeds and a fixed dwell time of 2 s: (a,b) BM, (c,d) 500 rpm, (e,f) 1000 rpm, and (g,h) 1500 rpm.
Crystals 15 00571 g005
Figure 6. Represented grain boundary maps and misorientation angle analysis of the BM and SZ microstructures of friction stir welded samples at different rotational speeds and a fixed dwell time of 2 s: (a,b) BM, (c,d) 500 rpm, (e,f) 1000 rpm, and (g,h) 1500 rpm.
Crystals 15 00571 g006
Figure 7. The scatter graph of the (a) heat input energy, (b) SZ hardness, (c) TMAZ hardness, (d) HAZ hardness, and (e) tensile/shear load.
Crystals 15 00571 g007
Figure 8. Effect of FSSW factors on (a) heat input energy, (b) SZ hardness, (c) TMAZ hardness, (d) HAZ hardness, and (e) tensile/shear load.
Crystals 15 00571 g008
Figure 9. 3D surface plots for the (a) heat input energy, (b) SZ hardness, (c) TMAZ hardness, (d) HAZ hardness, and (e) tensile/shear load.
Crystals 15 00571 g009
Figure 10. Ramp chart with optimized FSSW variables for maximizing heat input energy, SZ hardness, TMAZ hardness, HAZ hardness, and maximum shear load.
Crystals 15 00571 g010
Table 1. Chemical composition of the AA5052-H32 alloy.
Chemical Composition
ElementMnSiMgZnFeCuCrAl
Wt.%0.0420.0802.210.0290.2180.00370.152Bal.
Table 2. Mechanical characteristics of the AA5052-H32 alloy.
Mechanical Properties
PropertyUTS (MPa)Yield Strength (MPa)Elongation (%)Shear Strength (MPa)Hardness (Hv)
AA5052-H32228 ± 21931213868 ± 2
Table 3. The processing variables for the experimental design.
FSSW ParametersUnitsCodes
−101
Rotational speedrpm50010001500
Dwell timeS123
Table 4. Input FSSW parameters against the response of mechanical properties for AA5052-H32.
Exp. RunInput FSSW VariablesResponse of Mechanical Properties
A: Rotational Speed, RpmB: Dwell Time, SHeat Input Energy, JSZ Hardness, HvTMAZ Hardness, HvHAZ Hardness, HvMaximum Shear Load, N
111613762.855.859.11986
210450078.674.162.42461
3−1−177188.277.866.13696
4104500817663.82569
51−123668582.461.43301
601389284.280.964.12493
71−123668381.664.23190
80−1131681.577.565.72897
9−1−177186.676673660
10−11209297.684.163.73957
1100260986.982.164.72935
12−101525107.191.264.64421
13002609898463.13000
141−1236681.779.663.93215
15−11209294.38065.43820
1610450079.475.660.52511
1700260992.486.3623215
18−1−177184.774.369.33594
191161376659.757.32113
20−101525102.38766.34330
2101389286.782.162.42668
2201389287.883.760.72781
230−1131684.279.264.83156
2411613764.857.358.42074
250−1131685.181.762.63234
26−101525100.585.967.94269
27−11209292.478.666.83712
Table 5. ANOVA for heat input energy.
SourceSum of SquaresDfMean SquaresF-Valuep-Value
Model7.101 × 10732.367 × 107829.33<0.0001Significant
A-Rotational Speed3.711 × 10713.711 × 1071300.20<0.0001
B-Dwell Time2.940 × 10712.940 × 1071030.06<0.0001
AB4.502 × 10614.502 × 106157.73<0.0001
Residual6.564 × 1052328,541.18
Lack of Fit6.564 × 10551.313 × 105
Pure Error0.0000180.0000
Cor Total7.167 × 10726
Std. Dev.168.94R20.9908
Mean2800.89Adjusted R20.9896
CV%6.03Predicted R20.9889
Adeq Precision83.4697
Table 6. ANOVA for SZ hardness.
SourceSum of SquaresDfMean SquaresF-Valuep-Value
Model2675.697382.2462.72<0.0001Significant
A-Rotational Speed837.801837.80137.47<0.0001
B-Dwell Time10.40110.401.710.2070
AB545.401545.4089.49<0.0001
A27.1117.111.170.2935
B2351.651351.6557.70<0.0001
A2B61.62161.6210.110.0049
AB247.38147.387.770.0117
Residual115.80196.09
Lack of Fit29.56129.566.170.0231Significant
Pure Error86.24184.79
Cor Total2791.4926
Std. Dev.2.47R20.9585
Mean85.70Adjusted R20.9432
CV%2.88Predicted R20.9194
Adeq Precision27.6805
Table 7. ANOVA for TMAZ hardness.
SourceSum of SquaresDfMean SquaresF-Valuep-Value
Model1785.387255.0548.58<0.0001Significant
A-Rotational Speed245.761245.7646.81<0.0001
B-Dwell Time11.48111.482.190.1556
AB607.761607.76115.77<0.0001
A2177.851177.8533.88<0.0001
B2232.711232.7144.33<0.0001
A2B147.221147.2228.04<0.0001
AB213.94113.942.650.1197
Residual99.75195.25
Lack of Fit26.01126.016.350.0214Significant
Pure Error73.74184.10
Cor Total1885.1326
Std. Dev.2.29R20.9471
Mean78.31Adjusted R20.9276
CV%2.93Predicted R20.8954
Adeq Precision23.2206
Table 8. ANOVA for HAZ hardness.
SourceSum of SquaresDfMean SquaresF-Valuep-Value
Model164.47354.8225.02<0.0001Significant
A-Rotational Speed118.071118.0753.89<0.0001
B-Dwell Time40.80140.8018.620.0003
AB5.6015.602.560.1234
Residual50.39232.19
Lack of Fit8.2751.650.70630.6262Not significant
Pure Error42.13182.34
Cor Total214.8626
Std. Dev.1.48R20.7655
Mean63.64Adjusted R20.7349
CV%2.33Predicted R20.6767
Adeq Precision14.2759
Table 9. ANOVA for a maximum shear load.
SourceSum of SquaresDfMean SquaresF-Valuep-Value
Model1.145 × 10761.909 × 10650.44<0.0001Significant
A-Rotational Speed8.052 × 10618.052 × 106212.75<0.0001
B-Dwell Time3.015 × 10513.015 × 1057.970.0105
AB1.382 × 10611.382 × 10636.51<0.0001
A26.938 × 10516.938 × 10518.330.0004
B22.781 × 10512.781 × 1057.350.0135
A2B2567.1112567.110.06780.7972
Residual7.569 × 1052037,847.44
Lack of Fit5.413 × 10522.707 × 10522.60<0.0001Significant
Pure Error2.156 × 1051811,977.89
Cor Total1.221 × 10726
Std. Dev.194.54R20.9380
Mean3157.70Adjusted R20.9194
CV%6.16Predicted R20.8925
Adeq Precision21.6217
Table 10. FSSW optimization criteria.
Constraint NameUnitsGoalLimitsWeightsImportance
LowerUpperLowerUpper
Tool rotational speedrpmin range5001500113
Dwell timesin range13113
Heat input energyKJmaximize7716137113
SZ hardnessHvmaximize62.8107.1113
TMAZHvmaximize55.891.2113
HAZHvmaximize57.369.3113
Maximum shear loadNmaximize19864421113
Table 11. Confirmation of test results for mathematical models.
Exp. No.Rotational Speed, RpmDwell Time,
S
Heat Input Energy, JSZ Hardness, HvTMAZ Hardness, HvHAZ Hardness, HvMaximum Shear Load, N
750 Actual1653.3294.0981.7666.664037.22
1.1.5Predicted1597.192.778.564.03960
|Error|, %3.521.513.674.151.95
Actual2660.5186.6881.7365,734260.39
2.2.5Predicted2568.884.678.462.34150
|Error|, %3.572.463.775.502.66
1250 Actual2815.32120.6485.5562.922446.17
1.1.5Predicted2726.7118.483.160.52390
|Error|, %3.251.892.954.002.35
Actual4460.0683.1782.6861.432342.55
2.2.5Predicted4310.981.179.859.12300
|Error|, %3.462.553.613.951.85
Disclaimer/Publisher’s Note: The statements, opinions and data contained in all publications are solely those of the individual author(s) and contributor(s) and not of MDPI and/or the editor(s). MDPI and/or the editor(s) disclaim responsibility for any injury to people or property resulting from any ideas, methods, instructions or products referred to in the content.

