Article

Hyaluronic Acid Dipeptide Gels Studied by Raman Spectroscopy

by
Vlasta Mohaček-Grošev
1,* and
Jože Grdadolnik
2
1
Center of Excellence for Advanced Materials and Sensing Devices, Research Unit New Functional Materials, Ruđer Bošković Institute, Bijenička cesta 54, 10000 Zagreb, Croatia
2
National Institute of Chemistry, Hajdrihova 19, 1000 Ljubljana, Slovenia
*
Author to whom correspondence should be addressed.
Crystals 2025, 15(6), 559; https://doi.org/10.3390/cryst15060559
Submission received: 8 May 2025 / Revised: 3 June 2025 / Accepted: 8 June 2025 / Published: 13 June 2025
(This article belongs to the Section Biomolecular Crystals)

Abstract

:
This study presents a detailed Raman spectroscopic investigation of hydrogels composed of sodium hyaluronate and two N-terminally blocked dipeptides: N-acetyl-L-alanine-methyl-amide (NAcAlaNHMA) and N-acetyl-L-tyrosine-methyl-amide (NAcTyrNHMA). Vibrational spectra of the dipeptides in both crystalline and aqueous forms were analyzed and supported by density functional theory (DFT) calculations. Spectral features of the hyaluronan component were elucidated by simulating the vibrational modes of its two principal disaccharide building blocks. Gels were prepared with varying dipeptide-to-hyaluronan ratios, and their structural characteristics were examined using Raman spectroscopy and atomic force microscopy. The results showed that while NAcAlaNHMA exhibited no significant interaction with the HA matrix, NAcTyrNHMA demonstrated specific binding behavior, as evidenced by notable shifts in its N–H and C–O–H vibrational bands. These findings indicate that NAcTyrNHMA binds to hyaluronic acid via hydrogen bonding, likely involving carboxyl and hydroxyl functional groups. This study highlights the potential for selective tuning of HA-based hydrogels using dipeptides, with implications for biomedical applications such as drug delivery, antimicrobial gels and biomaterial design.

1. Introduction

Peptide gels have recently found applications in tissue replacement, controlled drug release, the formation of nanostructures and biosensing [1,2,3,4]. The existence of naturally occurring secondary structures in polypeptides, such as helices, β-pleated sheets or coils, makes them attractive for creating a desired three-dimensional network, suitable to replace an extracellular matrix [5]. Polymeric gels containing water (hydrogels) can be divided into physical hydrogels, in which structure is stabilized by Coulombic interaction and hydrogen bonding, besides other interactions, and chemical hydrogels, in which cross-linking produces new chemical bonds [5,6,7]. Peptide gels designed for wound-healing purposes can include dipeptides such as carnosine or oligopeptides with several dozens of amino acids [8] and can have an N-terminus modified by a gelling group when used in drug-release applications, e.g., N-terminally protected phenylalanine and tyrosine [3,5].
We chose two small dipeptides with methyl-blocked termini in order to compare their binding properties with hyaluronic acid when they form a gel. A gel is essentially a metastable state existing in a balance of thermodynamical and kinetical processes, and its structure is sensitive to temperature, pH and the concentrations of the solvent and solute, among other things. Since the crystalline state of a molecular solid is the most stable state it can achieve, it is always possible that a crystallization process starts and proceeds within a gel [6,9,10]. The research on biocompatible materials suitable for pharmaceutical applications has witnessed a significant increase in interest in hyaluronic acid (HA) and its derivatives in past decades [11,12,13,14,15,16,17,18,19]. HA, which is a copolymer of the [-A-B-]n type, where A is D-glucuronic acid and B is N-Acetyl-D-glucosamine, can appear in a number of crystal modifications, depending on its cation content and the amount of water present [20,21,22,23,24,25,26,27,28].
Here we present a Raman spectroscopic study of several physical gels of two dipeptides, N-acetyl-L-alanine-methyl-amide (NAcAlaNHMA) and N-acetyl-L-tyrosine-methyl-amide (NAcTyrNHMA), with sodium hyaluronate, accompanied by atomic force microscopy imaging of the dried gels. These dipeptides were chosen because, although chemically simple compounds, they display different types of bonding when forming crystal lattices. While NAcAlaNHMA molecules form independent tubular structures, NAcTyrNHMA molecules use their hydroxyl group to form a full three-dimensional network. A vibrational analysis of NAcAlaNHMA in the crystal form and of an NAcTyrNHMA molecule facilitated the assignment of dipeptide bands. Theoretically calculated spectra of two disaccharides forming the repeating unit of HA, N-acetyl-β-D-glucosamine-β-(1→4)-D-glucuronic acid sodium salt and β-D-glucuronic acid-β-(1→3)-N-acetyl-β-D-glucosamine sodium salt, gave us some important clues as to the origin of the bands observed for the HA gel. Both dipeptides showed good miscibility with HA, and most of the observed bands clearly belonged either to a dipeptide molecule or to HA. For one specific NAcTyrNHMA-HA gel, however, we observed a spectrum that could be assigned to the form the molecule takes when bound to HA. Hence, this gel could be a chemical gel, while all NAcAlaNHMA-HA gels are physical gels.

2. Experiments

2.1. Measurements on Pure Dipeptide Samples, Powder and in Solution

Polycrystalline dipeptide samples were purchased from Bachem and used as received. The Raman spectra of the dipeptide powders were measured with three instruments: a Horiba JobinYvon T64000, spectral range 14–3500 cm−1 (green line of a 514.5 nm Ar laser serving as the excitation source, power on the sample being 50 mW, exposure time 10 s and repetition rate 10×, operating in triple subtractive mode with gratings of 1800 grooves/mm); the FT-Raman module of a Perkin-Elmer GX, range 150–3500 cm−1 (excitation line of a 1064 nm Nd:YAG laser operating at a power of 300 mW, with a 500-scan repetition rate and InGaAs detector); and a WiTec alpha 300 RA in the range 100–4000 cm−1 with a 532 nm laser and a single grating with 600 grooves/mm.
The Raman spectra of 0.1 molal water solutions were obtained with the T64000 in single mode (one grating), using the same laser and a power of 50 mW. The averaged time of accumulation was 300 s, and the spectral resolution was 6 cm−1. The attenuated total reflection (ATR) infrared spectra of 0.1 molal water solutions were measured with a Bruker Vertex-80 infrared spectrometer. Typically, 256 scans were averaged and apodized with a triangular function. The spectra of the dipeptides were recorded with a resolution of 2 cm−1 at 25 °C using a diamond ATR cell equipped with KRS-5 lenses.

2.2. Measurements of Dipeptide–Hyaluronic Acid Gels

The sodium salt of bacterial HA in the form of powder having a molecular mass of 0.7 MDa was kindly provided by Novozymes Biopolymer A/S, Krogshoejvej 36, DK-2880 Bagsvaerd, Denmark. Its preparation and properties have been described previously [29]. Pure 3.3 wt% HA gel was prepared by dissolving 33 mg of HA sodium salt in 1 g of MQ water (Stakpure OmniaLab DS 60 instrument). Stock solutions of 0.1 M of NAcAlaNHMA and NAcTyrNHMA were mixed with HA in different ratios, and the spectra of the gels on microscopic slides were recorded by a WiTec alpha 300 RA instrument with a 532 nm laser after one week of drying. Atomic force microscopy (AFM) images of the dried gels were acquired with the same Raman-AFM instrument, a WiTec alpha 300 RA, using AC mode and 75 kHz and 275 kHz tips. Surfaces of size 5 μm by 5 μm were scanned with 512 lines in each of two rectangle directions.

2.3. Computational Methods

2.3.1. Dipeptides

Density functional theory, which is implemented in the CRYSTAL09 program [30] in the form of the correlation functional of Lee, Yang and Parr [31] with generalized gradient approximation and the exchange functional of Becke [32], commonly known as the B3LYP functional, was used for the calculation of phonons of NAcAlaNHMA with a basis set from Gatti [33]. The starting point of the partial optimization of the atomic positions of NAcAlaNHMA was taken from the refined crystal structure data of Harada and Itaka [34], to which hydrogen atoms were added (file LAANMA_H.cif is part of the Supplementary Materials). NAcAlaNHMA crystallizes in the space group P212121 with Z = 8. Two molecules form the motif, and the parameters of the unit cell are a = 13.87(7) Å, b = 6.98(4) Å, c = 16.29(8) Å and α = β = γ = 90° [34]. The positions of the atoms within the unit cell were optimized using the keyword OPTGEOM, with the old wave function mixed 30% with the new experimental function. In total, 22 atoms form each molecule of NAcAlaNHMA; thus, we expect 176 atoms in the unit cell and 525 optical phonons:
Γ = 132   A 131   B 1   131   B 2   131   B 3
All modes are active in Raman spectra, while B modes are active in infrared spectra. A list of all calculated modes is provided together with the observed Raman and infrared band positions in Supplementary Table S1. The symmetry of the calculated modes is given in another file provided in the Supplementary Materials.
For NAcTYrNHMA we did not calculate phonons using CRYSTAL09; instead, vibrational modes were calculated using the Gaussian 16 program suite with the B3LYP functional using the 6-31++G(d,p) basis set [35]. We first optimized the conformational parameters and then calculated the frequencies of normal modes, which were scaled by factor of 0.9497 using the observed stretching OH frequency from a matrix isolation study of tyrosine [36]. A list of observed modes of NAcTyrNHMA is presented in Supplementary Table S2.

2.3.2. Disaccharides

HA is a copolymer, and its building blocks were carefully optimized by Pogány and Kovács [37]. For the two most stable disaccharide units—N-acetyl-β-D-glucosamine-β-(1→4)-D-glucuronic acid sodium salt, GN-GANa1, and β-D-glucuronic acid-β-(1→3)-N-acetyl-β-D-glucosamine sodium salt, GANa-GN1—normal modes were calculated using Gaussian16 with the B3LYP functional and the 6-31++G(d,p) basis set. A scaling factor of 0.96 was applied to all calculated values for the sake of comparison with the experimental spectrum of sodium hyaluronate powder.

3. Results

We first discuss the vibrational spectra of the dipeptides and disaccharide bases of HA in order to establish the assignment and identify which bands shift most when the molecules bind to their neighbors in the gel. Later we present AFM images of xerogels (gels dried in air). In the next section our results are compared with those of previous Raman studies of hyaluronic acid and dipeptide gels.

3.1. Dipeptides

A comparison of the vibrational spectra of the dipeptides in polycrystalline form with the spectra of their water solutions reveals which modes are affected most by hydration (Figure 1A,B). Different conformations of dipeptides can coexist in water solution, their vibrational bands having similar wavenumbers. Determining their populations requires a detailed inspection of the vibrational spectra and understanding how they manifest through 1H coupling constants in nuclear magnetic resonance studies [38,39,40,41,42]. The analysis of the bands of amide III [39], as well as the analysis of amide I [40] recorded by NMR, infrared and Raman spectroscopy, showed that three conformations are present in water. These studies showed that the population of the α-conformation was low in both dipeptides (11% in NAcAlaNHMA and 7% in NAcTyrNHMA). Most conformations were distributed among polyproline and β-conformations in the Ramachandran plot (polyproline: 60% in NAcAlaNHMA and 46% in NAcTyrNHMA; β: 0.29% in NAcAlaNHMA and 47% in NAcTyrNHMA).
NacAlaNHMA dipeptide conformers exhibiting intramolecular hydrogen bonding—C5 and C7—were observed in FT-IR matrix isolation experiments [43] and characterized by their amide A, amide I and amide II bands. While the bands at 1704, 1688, 1515 and 1495 cm−1 were assigned to C5, the bands at 1704, 1680, 1549 and 1508 cm−1 were attributed to the C7 conformer [43]. Several bands belonging to the third conformer, which had no internal H-bonds, were identified at 1726 (L-form), 1714 (D-form), 1523 and 1483 cm−1 (both for L-form).
In the crystal, two molecules form a motif, and their conformation is described with Ramachandran’s torsional angles of φ1 = −84.250, ψ1 = 159.040, φ2 = −87.510 and ψ2 = 154.770, which are closest to the PII or polyproline conformation. There are no intramolecular hydrogen bonds, only intermolecular ones (Figure 2a), having O···N distances of 2.725 Å 2.732 Å, 2.804 Å and 2.926 Å. Molecules form columns extended as helices along axis c with methyl groups dominating in the space between the columns (Figure 2a). The vibrational bands most closely related to these hydrogen bonds are listed in Table 1 (a complete list of observed and calculated bands is provided in Supplementary Table S1).
The crystal structure of N-acetyl-tyrosine-methyl-amide is depicted in Figure 2b. Intermolecular hydrogen bonds connect neighboring molecules in such a way that a three-dimensional network is formed, the basic building block being the molecule itself. These hydrogen bonds have lengths of 2.837 Å (between carbonyl oxygen closer to the N-terminus and tyrosine oxygen), 2.675 Å (between carbonyl oxygen at the carbon terminus and tyrosine oxygen) and 3.037 Å (between nitrogen at the carbon terminus and tyrosine oxygen).
In NAcAlaNHMA one finds methyl groups protruding outside of columns extended along the c axis (Figure 2a), thus indicating predominant Van der Waals interaction between the columns. On the other hand, hydrogen bonds are formed through hydroxyl groups of tyrosine rings directed approximately along a ± b, connecting NAcTyrNHMA molecules more tightly. This causes the blue shift of the amide III, δ(O=C-N) and δ(N-C-C) modes in NAcTyrNHMA compared to NAcAlaNHMA (Table 1, printed bold). In general, the three regions mentioned above C=O stretching, N–H deformation and C–N stretching are commonly referred to in peptide spectra as amide I, amide II and amide III, respectively, due to their mixed character and strong coupling. This is especially true for the amide III mode. Whereas amide III, δ(O=C-N) and δ(N-C-C) are assigned to the 1262 cm−1, 597 cm−1 and 369 cm−1 bands in NacAlaNHMA, in NAcTyrNHMA they are attributed to bands at 1237 cm−1, 541 cm−1 and 347 cm−1. Koyama et al. [46] studied the vibrational spectra of N-Acetyl-L-alanine-methyl-amide in polycrystalline form. When pressed between KBr plates, the sample transformed into the second crystal structure [46]. The far-infrared bands, which were reported for the first structure at 399 and 366 cm−1, we assign to δ(O=C-N) + δ(N-C-C), while the band at 337 cm−1 we assign to the skeletal column mode. The corresponding bands reported in [46] for the second crystal structure appeared at 410, 366 and 322 cm−1 in the far-infrared spectra. The lowest lattice mode theoretically predicted for NAcAlaNHMA is at 16 cm−1 and corresponds to column translation along the b axis. NAcTyrNHMA forms a three-dimensional network, predominantly through the tyrosine phenol rings. The δ(C-O-H) in tyrosine dipeptide was not assigned previously [47], and we assign it to the bands at 1121 cm−1 in the Raman spectrum and 1120 cm−1 in the infrared spectrum.

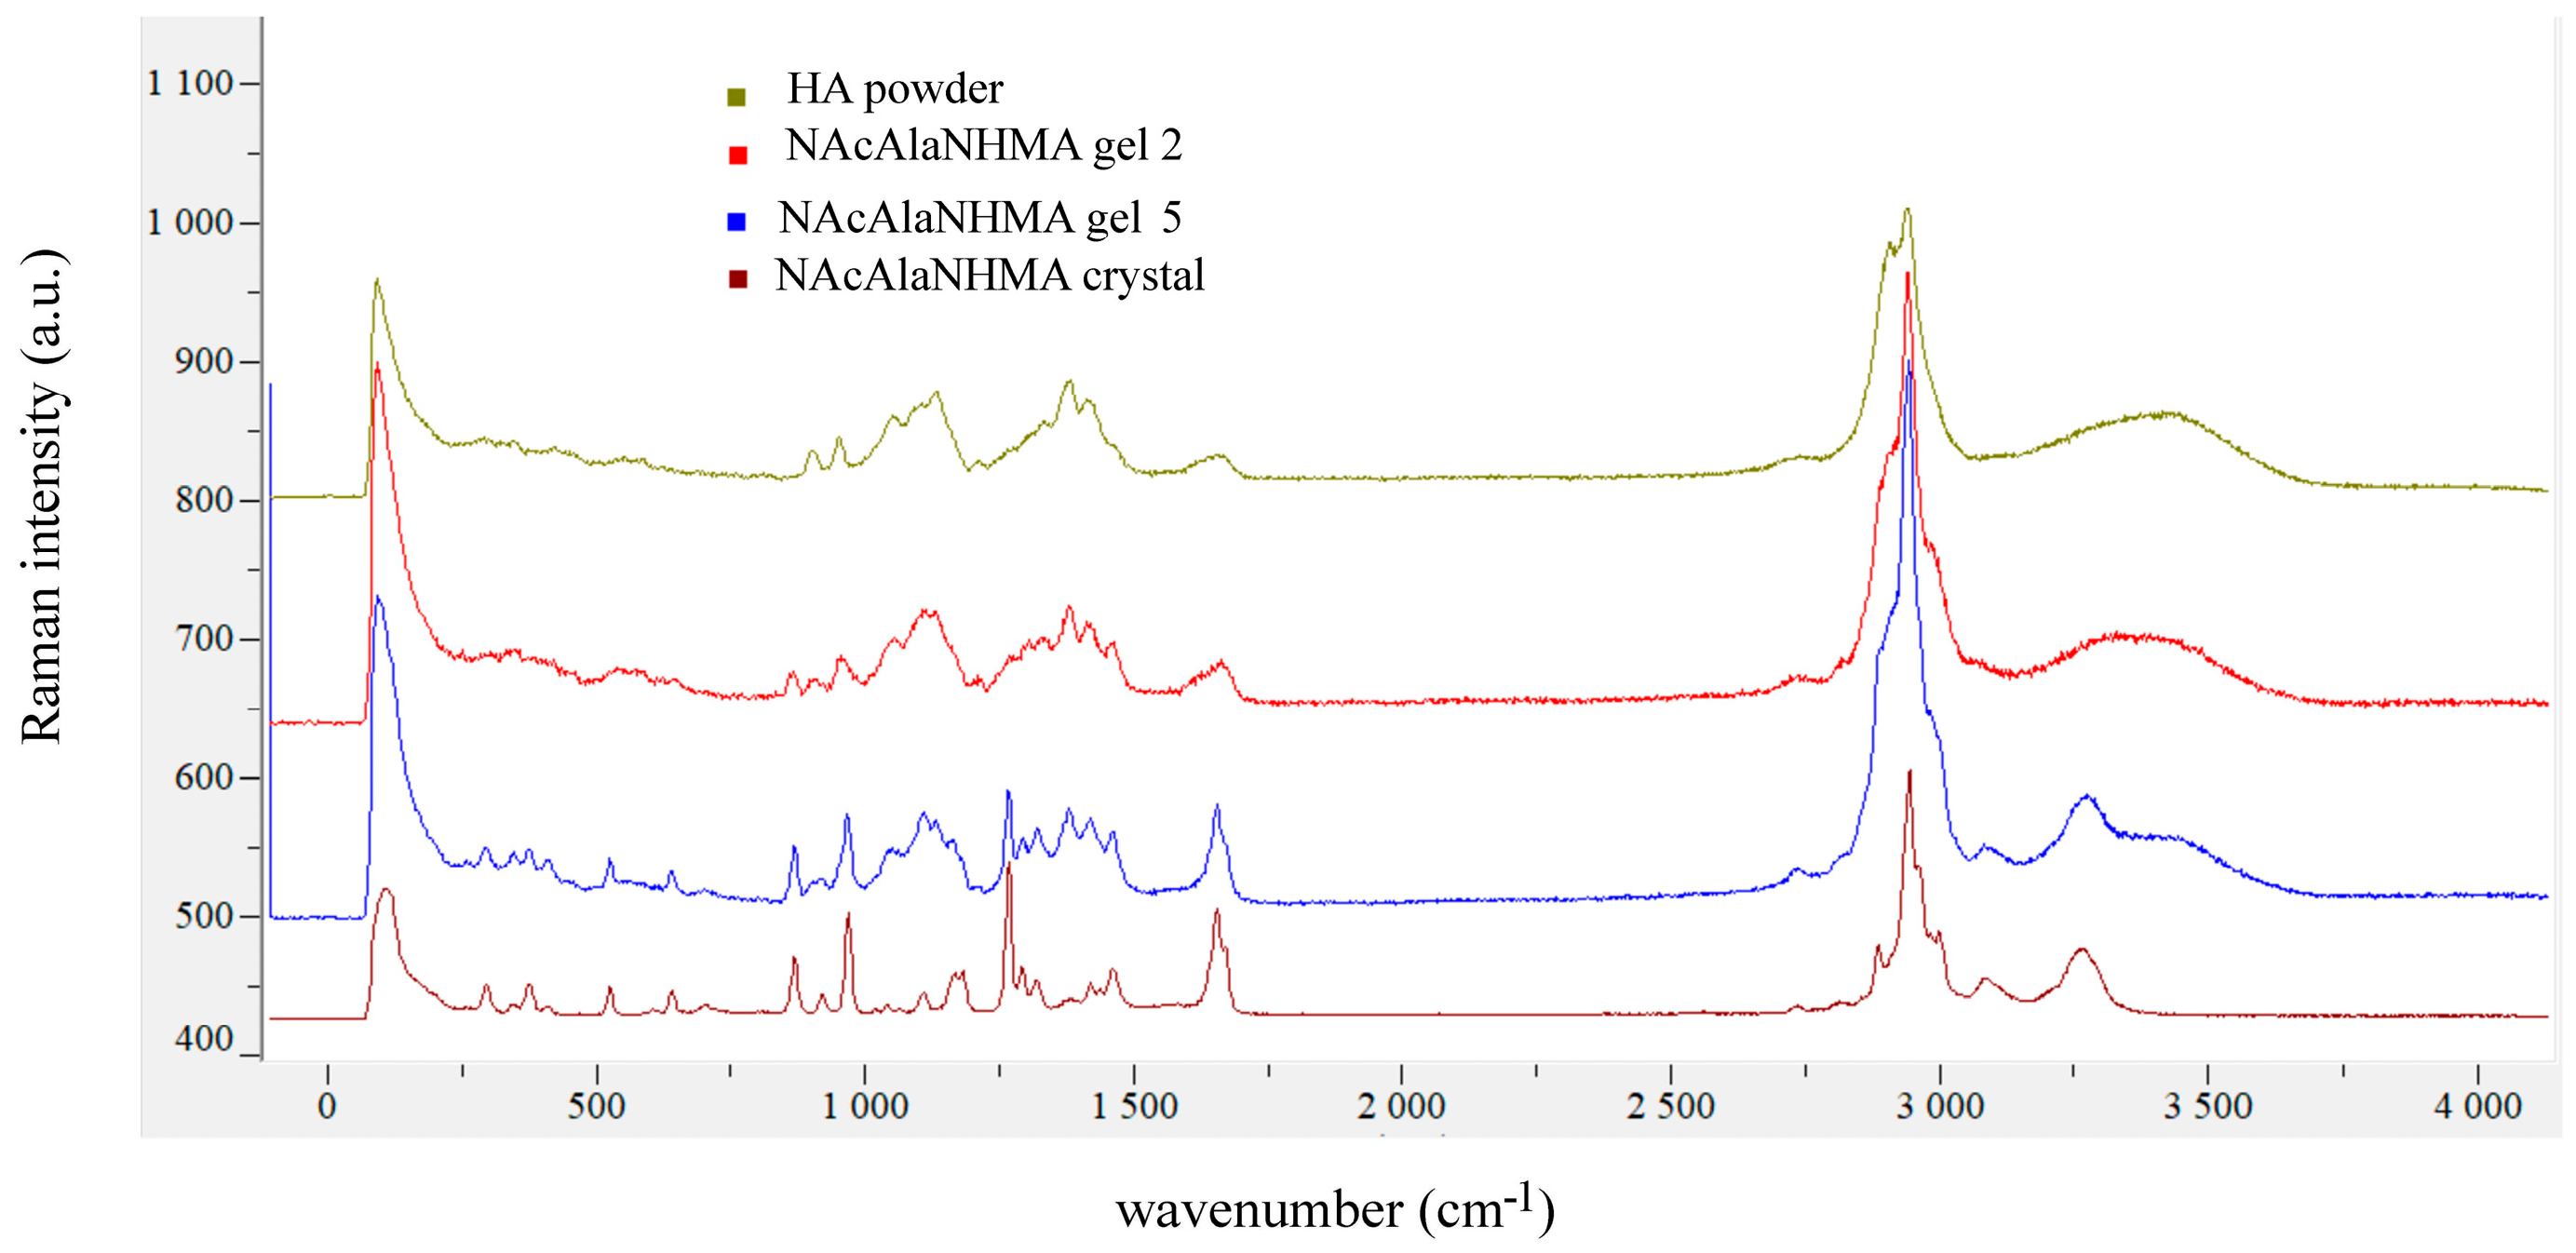
3.2. HA Dipeptide Gels

Vibrational studies of HA have been conducted continuously, with an emphasis on the effects of hydration [46,47,48,49,50,51,52,53,54,55,56]. An illustration of the sodium hyaluronate crystal structure determined by Guss et al. [26] is shown in Figure 5. The space group is tetragonal, P43212, with a = b = 9.89(2) Å, c = 33.94(9) Å and α = β = γ = 900. There are two helices within the unit cell, and sodium atoms bind to the carboxylic groups of glucuronic acid.
Hydrated HA contains three types of water molecules: bound water, freezing bound water and free water [57]. Bound water never freezes, while the other two types participate in the glass transition [57]. On dilution of solid HA, at a water content of 34 wt%, nonequilibrium crystallization of HA occurs; upon further dilution, at 50 wt% water, the HA crystallites dissolve and a solution is formed [28].
Since HA is a polymer of the [-A-B-]n type, where A is D-glucuronic acid and B is N-Acetyl-D-glucosamine, there are two types of glycosidic bonds: one connecting A to B, which is represented in the N-acetyl-β-D-glucosamine-β-(1→4)-D-glucuronic acid sodium salt, GN-GANa1, and the other between B and A, represented by the β-D-glucuronic acid-β-(1→3)-N-acetyl-β-D-glucosamine sodium salt, GANa-GN1 (see Figure 6). The geometric parameters for both disaccharide units were taken from the work of Pogány and Kovács [37], and their vibrations were calculated. The resulting scaled Raman spectra are compared with the Raman spectrum of 3.3 wt% HA gel in Figure 7.
One observes from Figure 7 a broad band at approx. 1650 cm−1 in the experimental spectrum of the gel, which is due to the overlap of the water bending vibration with the amide I and amide II vibrations of the N-acetyl group of the glucosamine bound to water (the highest calculated vibrations displayed in Figure 7).
Several HA–dipeptide gels were prepared; their compositions are given in Table 2, and the numbers of molecules of dipeptides and water per disaccharide HA unit are given in Table 3. There were 1741 disaccharide units per HA chain, having a molecular mass of 0.7 MDa.
Gels 1 and 4 were pure HA gels. Gels 2 and 3 were obtained by adding 0.5 mL of 0.1 M solution of each dipeptide to gel 1, while gels 5 and 6 were obtained by adding 40 mg of dipeptides to 0.5 mL of gel 4. Gels 7 and 8 were prepared by adding 20 mg of HA to 0.5 mL of 0.1 M dipeptide solution. All gels contained more than 90 wt% water. Gels with more than 3.3 wt% HA are solid and do not flow.
AFM and optical images of the gels are shown in Figure 8.

4. Discussion

Tailoring dipeptide gels for a desired application requires choosing between those with open or terminated N- and C-termini, such as dipeptides that have fluorenylmethoxycarbonyl (Fmoc) bound to the N-terminus [58], or tetrapeptides with both ends open [59]. The existence of amphiphilic groups in dipeptides induces secondary structures such as fibers, β-sheets or α-helices upon dissolution in water [58]. Our chosen dipeptides have both ends terminated with methyl groups; therefore, their ability to form hydrogen bonds with neighboring molecules (water or HA) is reduced to carbonyl and amide groups forming peptide bonds and, in the case of NAcTyrNHMA, a hydroxyl group attached to the benzene ring. This difference in functional groups causes the packing of NAcAlaNHMA molecules into columns in the crystalline phase (Figure 2a), while NAcTyrNHMA binds via –OH to the carbonyl oxygen of its neighboring molecule, thus extending the structure in all three spatial directions (Figure 2b). We identified the 1262 and 597 cm−1 Raman bands of crystal NAcAlaNHMa as the most sensitive to hydrogen bonding, while in the Raman spectrum of NAcTyrNHMA, such bands were observed at 1237, 1121, 580 and 541 cm−1 (Table 1).
In order to study how hydrogen bonds form between HA and these dipeptides, we prepared gels which had (1) the same molar ratios of NAcAlaNHMA and NAcTyrNHMA dipeptides to HA (gels 2 and 3), (2) the same wt% ratios of each dipeptide to HA (gels 5 and 6) and (3) the same ratios of the numbers of dipeptide molecules and disaccharide units of HA (gels 7 and 8) (Table 2 and Table 3).
Previous vibrational studies on N-acetyl glucosamine and glucuronic acid, which form the disaccharide units of HA, established that ν(C=O) of protonated glucuronic acid corresponds to the Raman band observed at 1707 cm−1 in the crystal, while ν(C=O) and δ(NH) of N-acetyl glucosamine were assigned to the 1632 and 1556 cm−1 Raman bands [48,54]. As shown in Figure 7, a very broad band at 1654 cm−1 is observed in the Raman spectrum of HA gel, covering the spectral interval in which many superimposed bands originating from the carbonyl stretching and amide bending of N-acetyl glucosamine appear. Glucuronic acid in HA is not protonated, since the pH of HA in water solution is weakly basic; therefore, one expects the ν(CO2) asymmetric stretching vibration to be 1595 cm−1 or 1612 cm−1 for GN-GaNa1 and GANa-GN1 disaccharide units (unscaled values).
Atomic force microscopy allows for studying the morphology of soft samples in air, at room temperature, without the need for a vacuum, which is obligatory for scanning and transmission electron microscopy. When applied to diluted peptide solutions (0.1% wt) [60], or to hyaluronic acid solutions (100 μg/mL with MgCl2 added to reduce entanglement) [61], it can provide images of individual fibers. For the concentration ranges we studied, we observed homogeneous surfaces on the air-dried gels (xerogels) (Figure 8).
There were no significant differences in the Raman spectra of gels 2, 5 and 7 of NAcAlaNHMA (Figure 9, Supplementary Figure S1), whereas for NAcTyrNHMa gel 3 we found that the bands observed in the crystal at 1127 cm−1 (corresponding to δ(C-OH)) and at 3337 cm−1 (corresponding to ν(N-H)) shifted in the Raman spectrum to 1098 cm−1 and 3317 cm−1 (Figure 10). For gels 6 and 8 no significant changes in the Raman spectra of NAcTyrNHMA were observed (Supplementary Figure S2).
Giménez-Hernández et al. studied the self-assembly of 17 kDa HA gel made with L-proline-L-valine dodecylamide (PVD) [62] with molar ratios of dipeptides per disaccharide HA unit from 1 to 100, and they obtained solid gels for ratios of 1 and 5. The basis of their proposed aggregation mechanism is the linking of PVD molecules among themselves and then to HA chains. In this work, it was not expected that the NAcAlaNHMA and NAcTyrNHMA dipeptides, having methylated ends, would form aggregates among themselves. Rather, they are prone to binding to the carboxylate groups of hyaluronan.
From the magnitudes of the shifted N-H stretching and C-O-H bending vibrations, we concluded that NAcTyrNHMA was bound to HA, since most of the water evaporated from the film. These two hydrogen bonds could be of the N-H···O=C and CO2···H-O-C types. Since, in gel 3, there were two NAcTyrNHMA molecules per disaccharide unit of HA (Table 3), it is possible that one dipeptide molecule bound to the glucosamine carboxyl group and the other to the glucuronic acid carboxylate group.

5. Conclusions

In this work, we conducted a comprehensive vibrational spectroscopic study—primarily through Raman spectroscopy and supported by infrared measurements and atomic force microscopy—of hydrogel systems composed of sodium hyaluronate and two chemically blocked dipeptides: N-acetyl-L-alanine-methyl-amide (NAcAlaNHMA) and N-acetyl-L-tyrosine-methyl-amide (NAcTyrNHMA). Our objective was to assess whether these dipeptides interact specifically with the hyaluronan matrix or whether they coexist as separate, non-interacting components within the gel structure. Our results show that both dipeptides are readily miscible with hyaluronic acid, and their presence within the hydrogel matrix does not inhibit the formation or stability of the gel, even at relatively low concentrations of HA (~1–3.8 wt%). The Raman spectra of gels containing NAcAlaNHMA revealed that its vibrational signature remained largely additive to that of pure hyaluronan, indicating minimal-to-no specific interaction at the molecular level. In contrast, the behavior of NAcTyrNHMA was markedly different.
Gels with a dipeptide-to-disaccharide molar ratio of 2:1 (specifically gel 3) exhibited distinct shifts in key vibrational modes, most notably in the N–H stretching and C–O–H bending regions of the spectrum, suggesting the formation of hydrogen bonds between the dipeptide and the HA matrix. These spectral shifts were consistent with the hypothesis that NAcTyrNHMA engages in specific binding interactions with the carboxyl and hydroxyl groups present on the HA backbone. The data support a model where one dipeptide molecule binds to the glucosamine carboxyl group and another to the glucuronic acid carboxylate group, forming a stabilized complex within the gel network. This behavior was not observed for NAcAlaNHMA, likely due to its simpler, less polar side chain, which lacks the phenolic hydroxyl group of tyrosine that facilitates hydrogen bonding.
The theoretical vibrational analyses of disaccharide units forming the repeating structure of HA provided valuable insight for spectral assignments and enhanced our ability to discern overlapping bands. These computational results, when compared to the experimental spectra, allowed us to disentangle complex vibrational features and confidently assign shifts to specific interactions.
Atomic force microscopy further complemented these findings by revealing morphological differences in the microstructure of gels containing NAcTyrNHMA versus those with NAcAlaNHMA or pure HA. The increased surface roughness and nanoscale patterning in the NAcTyrNHMA gels may be attributable to the interaction-induced restructuring of the HA network.
This study has several implications. First, it highlights the critical role of dipeptide side chains in determining the interaction dynamics within hydrogel matrices. The phenolic hydroxyl group in tyrosine appears to be a key functional element for promoting HA–dipeptide binding, whereas the alanine-based dipeptide does not exhibit such interactions. Second, this work underscores the utility of Raman spectroscopy as a non-destructive, sensitive technique for probing weak molecular interactions in complex soft matter systems. Lastly, the specific binding behavior observed with NAcTyrNHMA suggests that such dipeptides may serve as tunable modifiers of HA hydrogels, offering a potential route toward functionalization for targeted drug delivery, antibacterial coatings or tissue engineering scaffolds.
In conclusion, while both dipeptides form physically stable gels with HA, only NAcTyrNHMA demonstrates spectroscopically evident binding to the polysaccharide matrix. This binding likely involves hydrogen bonding via hydroxyl and amide groups, providing a molecular basis for further studies on functionalizing HA-based materials with bioactive or responsive peptides. Future work could expand upon these findings by examining other dipeptides or peptides with varied side chain functionalities and by evaluating the biological and mechanical consequences of such interactions in applied settings.

Supplementary Materials

The following supporting information can be downloaded at https://www.mdpi.com/article/10.3390/cryst15060559/s1, Table S1: Comparison of observed bands of polycrystalline powder of N-acetyl-L-alanine-methyl-amide with vibrations calculated by CRYSTAL09; Table S2: Comparison of observed bands of polycrystalline powder of N-acetyl-L-tyrosine-methyl-amide and vibrations calculated using Gaussian16, scaled by factor 0.9497; Figure S1: Raman spectra of NAcAlaNHMA gel 7 compared with spectrum of powder; Figure S2: Raman spectra of NAcTyrNHMA gel 8 compared with powder spectrum; Supplementary Material—List of calculated phonons of N-acetyl-L-alanine-methyl-amide, crystal structure with hydrogens of NAcAlaNHMA in file LAANMA_H.cif.

Author Contributions

Conceptualization, V.M.-G. and J.G.; methodology, V.M.-G. and J.G.; software, V.M.-G.; investigation, V.M.-G. and J.G.; resources, J.G. and V.M.-G.; writing—original draft preparation, V.M.-G.; writing—review and editing, J.G. and V.M.-G. All authors have read and agreed to the published version of the manuscript.

Funding

This research was funded by the Centre for Advanced Materials and Sensing Devices, project number EK-EFRR-KK.01.1.1.01.0001 and EK-EFRR-PK.1.1.10.0002.

Data Availability Statement

Data are available upon request.

Acknowledgments

We acknowledge the help of Krešimir Molčanov, who refined the crystal structure of N-acetyl-alanine-methyl-amide from ref. [13] and determined the positions of hydrogen atoms, and Ozren Gamulin, who provided the FT-Raman spectra of the powders.

Conflicts of Interest

The authors declare no conflicts of interest.

References

  1. Estroff, L.A.; Hamilton, A.D. Water Gelation by Small Organic Molecules. Chem. Rev. 2004, 104, 1201–1217. [Google Scholar] [CrossRef] [PubMed]
  2. Duduković, N.A. The Principles of Molecular Gel Formation. Ph.D. Thesis, University of Illinois at Urbana-Champaign, Champaign, IL, USA, 2015. Available online: https://core.ac.uk/download/pdf/158311229.pdf (accessed on 7 June 2025).
  3. Ruan, L.; Zhang, H.; Luo, H.; Liu, J.; Tang, F.; Shi, Y.-K.; Zhao, X. Designed amphiphilic peptide forms stable nanoweb, slowly releases encapsulated hydrophobic drug, and accelerates animal hemostasis. Proc. Natl. Acad. Sci. USA 2009, 106, 5105–5110. [Google Scholar] [CrossRef]
  4. Sutton, S.; Campbell, N.L.; Cooper, A.I.; Kirkland, M.; Frith, W.J.; Adams, D.J. Controlled Release from Modified Amino Acid Hydrogels Governed by Molecular Size or Network Dynamics. Langmuir 2009, 25, 10285–10291. [Google Scholar] [CrossRef]
  5. Dasgupta, A.; Mondal, J.H.; Das, D. Peptide Hydrogels. RSC Adv. 2013, 3, 9117–9149. [Google Scholar] [CrossRef]
  6. Wang, J.; Liu, K.; Xing, R.; Yan, X. Peptide self-assembly: Thermodynamics and kinetics. Chem. Soc. Rev. 2016, 45, 5589–5604. [Google Scholar] [CrossRef]
  7. Nayah, K.; Das, B. Introductions to Polymeric Gels. In Polymeric Gels; Pal, K., Banerjee, I., Eds.; Elsevier: Amsterdam, The Netherlands, 2018; pp. 3–27. [Google Scholar] [CrossRef]
  8. Gomes, A.; Teixeira, C.; Ferraz, R.; Prudêncio, C.; Gomes, P. Wound-Healing Peptides for Treatment of Chronic Diabetic Foot Ulcers and Other Infected Skin Injuries. Molecules 2017, 22, 1743. [Google Scholar] [CrossRef]
  9. Velásquez-González, O.; Campos-Escamilla, C.; Flores-Ibarra, A.; Esturau-Escofet, N.; Arreguin-Espinosa, R.; Stojanoff, V.; Cuéllar-Cruz, M.; Moreno, A. Crystal Growth in Gels from the Mechanisms of Crystal Growth to Control of Polymorphism: New Trends on Theoretical and Experimental Aspects. Crystals 2019, 9, 443. [Google Scholar] [CrossRef]
  10. Martin, A.D.; Wojciechowski, J.P.; Bhadbhade, M.M.; Thordarson, P.A. Capped Dipeptide Which Simultaneously Exhibits Gelation and Crystallization Behavior. Langmuir 2016, 32, 2245–2250. [Google Scholar] [CrossRef] [PubMed]
  11. Wu, Y.; Zhao, S.; Wang, J.; Chen, Y.; Li, H.; Li, J.-P.; Kan, Y.; Zhank, T. Methods for Determining the Structure and Physicochemical Propertiesof Hyaluronic Acid and its Derivatives: A Review. Int. J. Biol. Macromol. 2024, 282, 137603. [Google Scholar] [CrossRef]
  12. Snetkov, P.; Zakharova, K.; Morozkina, S.; Oleknovich, R.; Uspenskaya, M. Hyaluronic Acid: The Influenceof Molecular Weight on Structural, Physical, Physico-Chemical, and Degradable Properties of Biopolymer. Polymers 2020, 12, 1800. [Google Scholar] [CrossRef]
  13. Cowman, M.K. Hyaluronan and Hyaluronan Fragments. Adv. Carb. Chem. Biochem. 2017, 74, 1–59. [Google Scholar] [CrossRef]
  14. Khan, S.; Mahendhiran, B.; Aroulmoji, V. Chemistry of Hyaluronic Acid and its Significance in Drug Delivery Strategies: A Review. Int. J. Pharm. Sci. Res. 2013, 4, 3699–3710. [Google Scholar] [CrossRef]
  15. Dicker, K.T.; Gurski, L.A.; Pradhan-Bhatt, S.; Witt, R.L.; Farach-Carson, M.C.; Jia, X. Hyaluronan: A Simple Polysaccharide with Diverse Biological Functions. Acta Biomater. 2014, 10, 1558–1570. [Google Scholar] [CrossRef] [PubMed]
  16. Stridh, S.; Palm, F.; Hansell, P. Renal Interstitial Hyaluronan: Functional Aspects During Normal and Pathological Conditions. Ann. J. Physiol. Regul. Integr. Comp. Physiol. 2012, 302, R1235–R1249. [Google Scholar] [CrossRef]
  17. Bettenhausen, C.A. Hyaluronic Acid, the Everywhere Biopolymer. C&EN 2021, 99, 26–31. [Google Scholar] [CrossRef]
  18. Nesměrak, K.; Pospichal, R. Spectrometric Methods in Pharmaceutical Analysis of Glycosaminoglycans: The State of the Art. Monatsh. Chem. 2020, 151, 1185–1192. [Google Scholar] [CrossRef]
  19. Borzacchiello, A.; Russo, L.; Malle, B.M.; Schwach-Abdellaoui, K.; Ambrosio, L. Hyaluronic Acid Based Hydrogels for Regenerative Medicine Applications. Bio. Med. Res. Int. 2015, 2015, 871218. [Google Scholar] [CrossRef]
  20. Winter, W.T.; Cael, J.J.; Smith, P.J.C.; Arnott, S. Hyaluronic Acid Conformations and Interactions. In Cellulose Chemistry and Technology; Arthur, J., Ed.; ACS Symposium Series ACS: Washington, DC, USA, 1977; pp. 91–104. [Google Scholar] [CrossRef]
  21. Hargittai, I.; Hargittai, M. Molecular Structure of Hyaluronan: An Introduction. Struct. Chem. 2008, 19, 697–717. [Google Scholar] [CrossRef]
  22. Arnott, S.; Mitra, A.K.; Raghunathan, S. Hyaluronic Acid Double Helix. J. Mol. Biol. 1983, 169, 861–872. [Google Scholar] [CrossRef]
  23. Tratar Pirc, E.; Zidar, J.; Bukovec, P. A Computational Study of Calcium(II) and Copper(II) Ion Binding to the Hyaluronate Molecule. Int. J. Mol. Sci. 2012, 13, 12036–12045. [Google Scholar] [CrossRef]
  24. Cowman, M.C.; Hittner, D.M.; Feder-Davis, J. 13C-NMR Studies of hyaluronan: Conformational Sensitivity to Varied Environments. Macromolecules 1996, 29, 2894–2902. [Google Scholar] [CrossRef]
  25. Winter, W.T.; Arnott, S. Hyaluronic Acid: The Role of Divalent Cations in Conformation and Packing. J. Mol. Biol. 1977, 117, 761–784. [Google Scholar] [CrossRef]
  26. Guss, J.M.; Hukins, D.W.L.; Smith, P.J.C.; Winter, W.T.; Arnott, S.; Moorhouse, R.; Rees, D.A. Hyaluronic Acid: Molecular Conformations and interactions in Two Sodium Salts. J. Mol. Biol. 1975, 95, 359–384. [Google Scholar] [CrossRef]
  27. Winter, W.T.; Smith, P.J.C.; Arnott, S. Hyaluronic Acid: Structure o a Fully Extended 3-fold Helical Sodium Salt and Comparison with the Less Extended 4-fold Helical Forms. J. Mol. Biol. 1975, 99, 219–235. [Google Scholar] [CrossRef] [PubMed]
  28. Albèr, C.; Engblom, J.; Falkman, P.; Kocherbitov, V. Hydration of Hyaluronan: Effects on Structural and Thermodynamic Properties. J. Phys. Chem. B 2015, 119, 4211–4219. [Google Scholar] [CrossRef]
  29. Guillaumie, F.; Furrer, P.; Felt-Baeyens, O.; Fuhlendorff, B.L.; Nymand, S.; Westh, P.; Gurny, R.; Schwach-Abdellaoui, K. Comparative studies of various hyaluronic acids produced by microbial fermentation for potential topical ophthalmic applications. J. Biomed. Mater. Res. Part A 2010, 92, 1421–1430. [Google Scholar] [CrossRef]
  30. Dovesi, R.; Orlando, R.; Civalleri, B.; Roetti, C.; Saunders, V.R.; Zicovich-Wilson, C.M. CRYSTAL: A computational tool for the ab initio study of the electronic properties of crystals. Z. Krist. 2005, 220, 571–573. [Google Scholar] [CrossRef]
  31. Lee, C.; Yang, W.; Parr, R.G. Development of the Colle-Salvetti Correlation-Energy Formula into a Functional of the Electron Density. Phys. Rev. B 1988, 37, 785–789. Available online: https://journals.aps.org/prb/abstract/10.1103/PhysRevB.37.785 (accessed on 7 June 2025). [CrossRef]
  32. Becke, A.D. Density-Functional Exchange-Energy Approximation with Correct Asymptotic Behavior. Phys. Rev. A 1988, 38, 3098–3100. Available online: https://journals.aps.org/pra/abstract/10.1103/PhysRevA.38.3098 (accessed on 7 June 2025). [CrossRef]
  33. Gatti, C.; Saunders, V.R.; Roetti, C. Crystal field effects on the topological properties of the electron density in molecular crystals: The case of urea. J. Chem. Phys. 1994, 101, 10686–10696. [Google Scholar] [CrossRef]
  34. Harada, Y.; Itaka, Y. The Crystal and Molecular Structures of N-Acetyl-DL-alanine-N-methylamide and N-Acetyl-L-alanine-N-methylamide. Acta Cryst. B 1974, 30, 1452–1459. [Google Scholar] [CrossRef]
  35. Frisch, M.J.; Trucks, G.W.; Schlegel, H.B.; Scuseria, G.E.; Robb, M.A.; Cheeseman, J.R.; Scalmani, G.; Barone, V.; Petersson, G.A.; Nakatsuji, H.; et al. Gaussian 16; Revision C.01; Gaussian, Inc.: Wallingford, CT, USA, 2019. [Google Scholar]
  36. Ramaekers, R.; Pajak, J.; Rospenk, M.; Maes, G. Matrix-Isolation FT-IR Spectroscopic Study and Theoretical DFT(B3LYP)/6–31 ++ G** Calculations of the Vibrational and Conformational Properties of Tyrosine. Spectrochim. Acta A 2005, 61, 1347–1356. Available online: https://www.sciencedirect.com/science/article/abs/pii/S1386142504004950?via%3Dihub (accessed on 7 June 2025). [CrossRef]
  37. Pogány, P.; Kovács, A. Conformation and propertiesof the disaccharide building units of hyaluronan. Carbohydr. Res. 2009, 344, 1745–1752. [Google Scholar] [CrossRef]
  38. Hermans, J. The amino acid dipeptide: Small but still influential after 50 years. Proc. Natl. Acad. Sci. USA 2011, 108, 3095–3096. [Google Scholar] [CrossRef]
  39. Grdadolnik, J.; Mohacek-Grosev, V.; Baldwin, R.L.; Avbelj, F. Populations of the three major backbone conformations in 19 amino acid dipeptides. Proc. Natl. Acad. Sci. USA 2011, 108, 1794–1798. [Google Scholar] [CrossRef] [PubMed]
  40. Avbelj, F.; Golič-Grdadolnik, S.; Grdadolnik, J.; Baldwin, R.L. Intrinsic backbone preferences are fully present in blocked amino acids. Proc. Natl. Acad. Sci. USA 2006, 103, 1272–1277. [Google Scholar] [CrossRef]
  41. Jalkanen, K.; Degtyarenko, I.M.; Nieminen, R.M.; Cao, X.; Nafie, L.A.; Zhu, F.; Barron, L.D. Role of hydration in determining the structure and vibrational spectra of L-alanine and N-acetyl L-alanine N′-methylamide in aqueous solution: A combined theoretical and experimental approach. Theor. Chem. Acc. 2008, 119, 191–210. [Google Scholar] [CrossRef]
  42. Cheam, T.C. Normal mode analysis of alanine dipeptide in the crystal conformation using a scaled ab initio force field. J. Mol. Struct. 1993, 295, 259–271. [Google Scholar] [CrossRef]
  43. Pohl, G.; Perczel, A.; Vass, E.; Magyarfalvi, G.; Tarczay, G. A matrix isolation study on Ac-Gly–NHMe and Ac-L-Ala–NHMe, the simplest chiral and achiral building blocks of peptides and proteins. Phys. Chem. Chem. Phys. 2007, 9, 4698–4708. [Google Scholar] [CrossRef]
  44. Cotrait, M.; Bideau, J.-P. Structures Cristallines de Dipeptides Aromatiques. II. Derives de la Tyrosine. Acta Cryst. B 1974, 30, 1024–1028. [Google Scholar] [CrossRef]
  45. Mercury Program. Available online: https://www.ccdc.cam.ac.uk/solutions/software/mercury (accessed on 23 September 2024).
  46. Koyama, Y.; Shimanouchi, T.; Sato, M.; Tatsuno, T. Conformations of Model Compounds of Proteins II. Infrared Spectra of N-Acetyl-amino Acid Methylamides. Biopolymers 1971, 10, 1059–1074. [Google Scholar] [CrossRef] [PubMed]
  47. Matsuura, H.; Hasegawa, K.; Miyazawa, T. Infrared and Raman spectra of N-acetyl-L-amino acid methylamides with aromatic side groups. Spectrochim. Acta A 1986, 42, 1181–1192. [Google Scholar] [CrossRef]
  48. She, C.Y.; Dinh, N.D.; Tu, T. L Laser Raman scattering of glucosamine, N-acetylglucosamine and glucuronic acid. Biochim. Biophys. Acta 1974, 372, 345–357. [Google Scholar] [CrossRef]
  49. Barrett, T.W.; Peticolas, W.L. Laser Raman Inelastic Light Scattering Investigations of Hyaluronic Acid Primary and Secondary Structure. J. Raman Spectrosc. 1979, 8, 35–38. [Google Scholar] [CrossRef]
  50. Lee, S.C.; Myers, L.C.; Powell, J.W.; Suleski, T.J.; Rupprecht, A. Raman and Infrared Studies of Wet-Spun Films of Na-Hyaluronate. J. Biomol.Struct. Dyn. 1993, 11, 191–201. [Google Scholar] [CrossRef]
  51. Gilli, R.; Kacuráková, M.; Mathlouthi, M.; Navarini, L.; Paoletti, S. FTIR studies of sodium hyaluronate and its oligomers in the amorphous solid phase and in aqueous solution. Carbohydr. Res. 1994, 263, 315–326. [Google Scholar] [CrossRef] [PubMed]
  52. Servaty, R.; Schiller, J.; Binder, H.; Arnold, K. Hydration of polymeric components of cartilage—An infrared spectroscopic study on hyaluronic acid and chondroitin sulfate. Int. J. Biol. Macromol. 2001, 28, 121–127. [Google Scholar] [CrossRef]
  53. Haxaire, K.; Marechal, Y.; Milas, M.; Rinaudo, M. Hydration of Polysaccharide Hyaluronan Observed by Infrared Spectrometry. I Preliminary Experiments and Band Assignments. Biopolymers 2003, 72, 10–20. [Google Scholar] [CrossRef]
  54. Kovács, A.; Nyerges, B.; Izvekov, V. Vibrational analysis of N-acetyl-α-D-glucosamine and β-D-glucuronic acid. J. Phys. Chem. B 2008, 112, 5728–5735. [Google Scholar] [CrossRef]
  55. Ellis, R.; Green, E.; Winlove, C.P. Structural Analysis of Glycosaminoglycans and Proteoglycans by Means of Raman Microspectrometry. Connect. Tissue Res. 2009, 50, 29–36. [Google Scholar] [CrossRef]
  56. Mainreck, N.; Brézillon, S.; Sockalingum, G.D.; Maquart, F.-X.; Manfait, M.; Wegrowski, Y. Rapid Characterization of Glycosaminoglycans Using a Combined Approach by Infrared and Raman Microspectroscopies. J. Pharm. Sci. 2011, 100, 441–450. [Google Scholar] [CrossRef]
  57. Hatekayama, H.; Hatekayama, T. Interaction between water and hydrophilic polymers. Thermochim. Acta 1998, 308, 3–22. [Google Scholar] [CrossRef]
  58. Draper, E.R.; Adams, D.J. Controlling the Assembly and Properties of Low-Molecular-Weight Hydrogelators. Langmuir 2019, 35, 6506–6521. [Google Scholar] [CrossRef] [PubMed]
  59. Fichman, G.; Gazit, E. Self-assembly of short peptides to form hydrogels: Design of building blocks, physical properties and technological applications. Acta Biomat. 2014, 10, 1671–1682. [Google Scholar] [CrossRef]
  60. Bull, S.R.; Palmer, L.C.; Fry, N.J.; Greenfield, M.A.; Messmer, B.W.; Meade, T.J.; Strupp, S.I. A Templating Approach for Monodisperse Self-Assembled Organic Nanostructures. J. Am. Chem. Soc. 2008, 130, 2742–2743. [Google Scholar] [CrossRef] [PubMed]
  61. Cowman, M.K.; Li, M.; Balasz, E.A. Tapping Mode AFM of Hyaluronan: Extended and Intramolecularly Interacting Chains. Biophys. J. 1998, 75, 2030–2037. [Google Scholar] [CrossRef]
  62. Giménez-Hernández, B.; Falomir, E.; Escuder, B. Effect of Hyaluronic Acid on the Self-Assembly of a Dipeptide-Based Supramolecular Gel. Chem. Bio. Chem. 2023, 24, e202300438. [Google Scholar] [CrossRef]
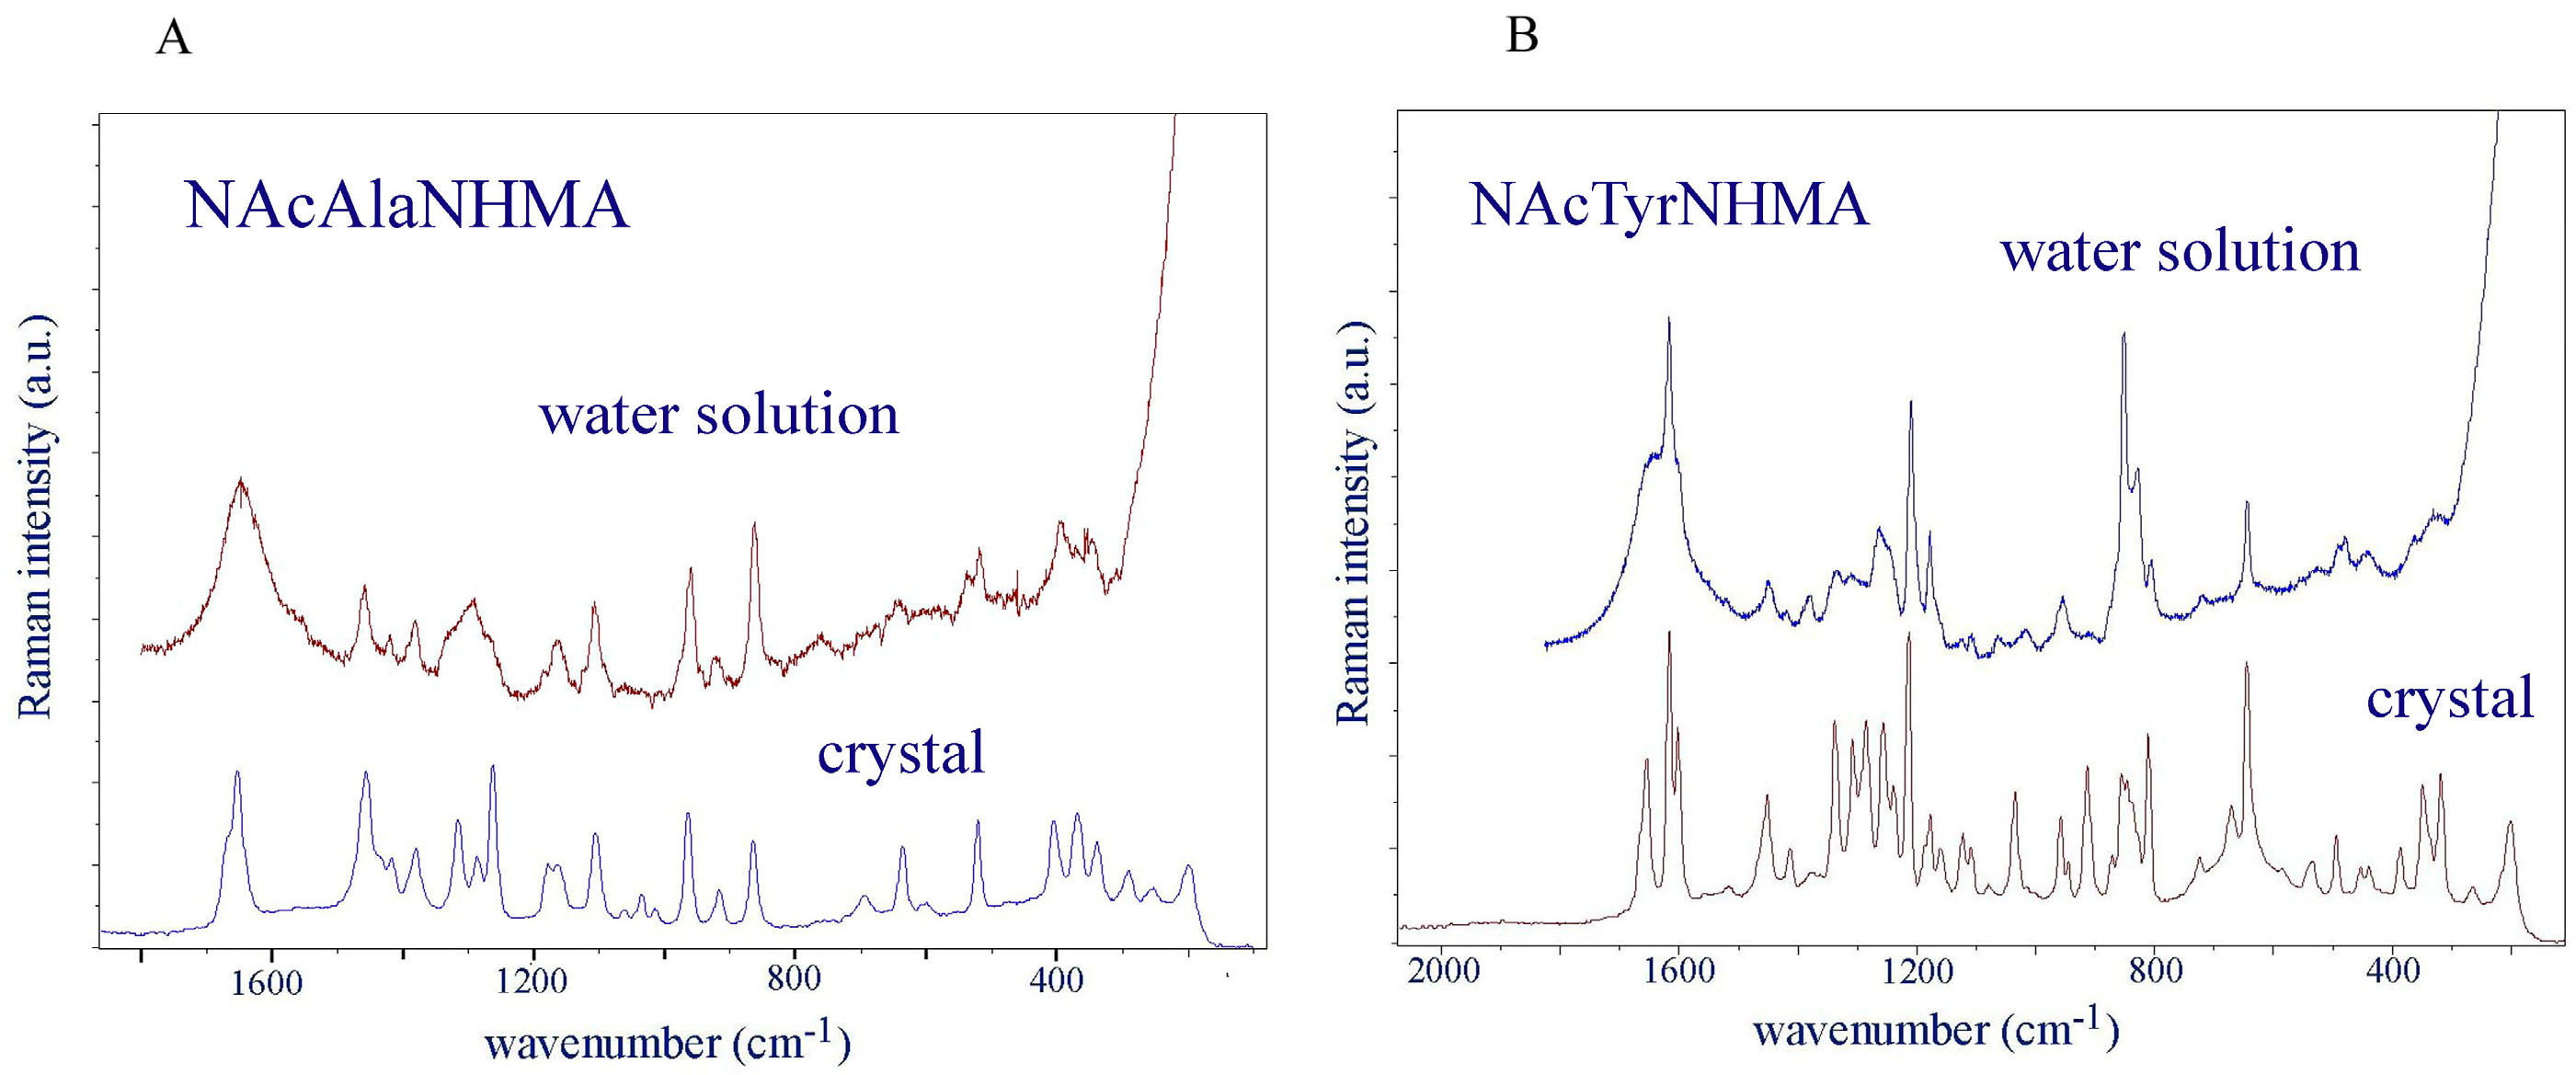
Figure 1. (A) The Raman spectrum of NAcAlaNHMA in 0.1 molal water solution compared with the FT-Raman spectrum of the polycrystalline powder. (B) The Raman spectrum of NAcTyrNHMA in 0.1 molal water solution compared with the FT-Raman spectrum of the polycrystalline powder. Low-frequency spectra were recorded and tabulated in Supplementary Tables S1 and S2.
Crystals 15 00559 g001
Figure 2. Crystal structure P212121 of NAcAlaNHMA viewed along c axis [34]. Axis a points towards right; axis b points down. (a) Crystal structure P41 of NAcTyrNHMA viewed along c axis [44]. Axis a points towards right; axis b points down. (b) Dotted green lines indicate intermolecular H-bonds. Figures prepared using Mercury program [45].
Crystals 15 00559 g002
Figure 3. Observed and calculated Raman spectra of N-acetyl-L-alanine-methyl-amide in polycrystalline form.
Crystals 15 00559 g003
Figure 4. Observed ATR infrared and calculated IR spectra of N-acetyl-L-alanine-methyl-amide in polycrystalline form.
Crystals 15 00559 g004
Figure 5. Illustration of sodium hyaluronate crystal structure created from data determined by Guss [26]: (a) view down c axis; (b) view along a axis. Figure prepared using Mercury program [45].
Crystals 15 00559 g005
Figure 6. N-acetyl-β-D-glucosamine-β-(1→4)-D-glucuronic acid sodium salt, GN-GANa1, on the left and β-D-glucuronic acid-β-(1→3)-N-acetyl-β-D-glucosamine sodium salt, GANa-GN1, on the right.
Crystals 15 00559 g006
Figure 7. The Raman spectrum of HA gel (3.3 wt%) compared with the calculated Raman spectra of the two disaccharide units shown in Figure 6. The scaling factor was 0.96.
Crystals 15 00559 g007
Figure 8. Atomic force microscopy images (gels 1, 2, 3, 5, 6, 8) and optical images (gels 4, 7) of HA–dipeptide gels. Compositions are given in Table 2. Bar is 1 μm in AFM images and 20 μm in optical images.
Crystals 15 00559 g008
Figure 9. Comparison of Raman spectra of HA powder, NAcAlaNHMA gels 2 and 5, and NAcAlaNHMA powder.
Crystals 15 00559 g009
Figure 10. Comparison of Raman spectra of NAcTyrNHMA powder, gel 3 and HA gel.
Crystals 15 00559 g010
Table 1. A comparison of the most important observed Raman (R) (Figure 3) and infrared (IR) (Figure 4) bands exhibiting intermolecular hydrogen bonding in NAcAlaNHMA and NAcTyrNHMA crystals, with assignations.
NAcAlaNHMANAcTyrNHMAAssignment
1667 R, 1664 IR Amide I
1651 R1649, 1636 IRAmide I
1639 R, 1636 IR Amide I
1578 R Amide II
1567 R, 1553 IR1556 RAmide II
1533 R1532, 1514 RAmide II
1462 RAmide II
1262 R, 1259 IR1237 R, 1235 IRAmide III
1121 R, 1120 IRδ(C-OH)
1106 R, 1103 IR ν(C-N) + δ(CH3)
1033 R, 1034 IRν(C-N)
635 R, 634 IR δ(O=C-N)
597 R, 594 IR580 R, 581 IRδ(O=C-N)
541 R, 561 IRγ(C-N)
403 R, 399 1 IR δ(O=C-N) + δ(N-C-C)
369 R, 366 1 IR δ(O=C-N) + δ(N-C-C)
347 R, 348 IR 2δ(N-C-C)
338 R, 337 1 IR Skeletal column mode
153 R τ(C-N)
1 From ref. [46]; 2 from ref. [47].
Table 2. Mass-weighted compositions of studied gels.
GelWt% HAWt%NAcAlaNHMaWt% NAcTyrNHMAWt% Water
110099
20.510.71098.78
30.5101.1698.3
420098
51.857.27090.88
61.8507.2790.88
73.81.4094.8
83.802.2294.02
Table 3. Numbers of molecules of dipeptides and water per disaccharide unit of HA.
GelUnit HAN Molecules
NAcAlaNHMA
N Molecules
NAcTyrNHMA
N Molecules
Water
11002150
21404300
31024300
41001096
511101096
61071096
7110558
8101558
Disclaimer/Publisher’s Note: The statements, opinions and data contained in all publications are solely those of the individual author(s) and contributor(s) and not of MDPI and/or the editor(s). MDPI and/or the editor(s) disclaim responsibility for any injury to people or property resulting from any ideas, methods, instructions or products referred to in the content.

