
Tribo-Mechanical Characteristics of Modified Cu-Cr-Zr Resistance Spot Welding Electrode with Nickel


Abstract
1. Introduction
2. Materials and Methods
2.1. Materials and Sample Preparation
2.2. Methods
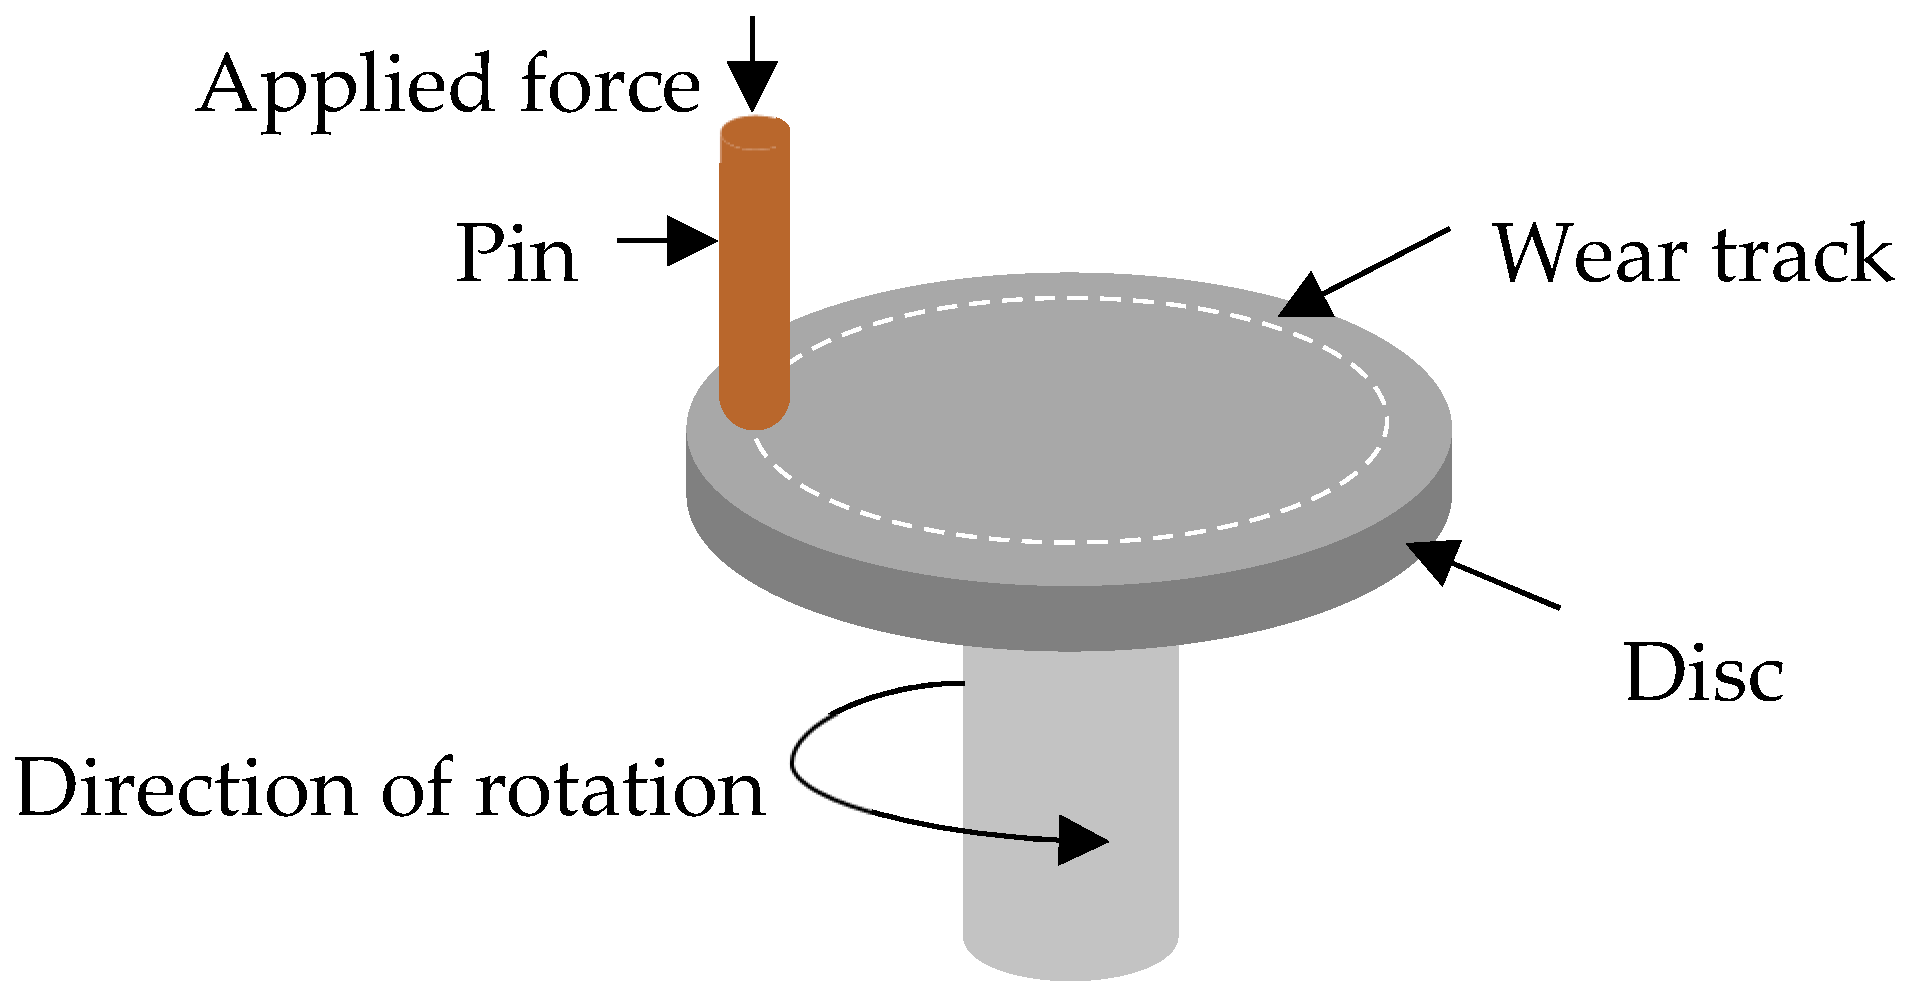
2.3. Pin-on-Disc Wear Test
2.4. Full Factorial Design of Experiments (DOE)
3. Results and Discussion
3.1. Microstructure Analysis
3.2. Phase Analysis
3.3. Microhardness Analysis
3.4. Wear Behavior
3.5. Surface Roughness
3.6. Design of Experiment Analysis
4. Conclusions
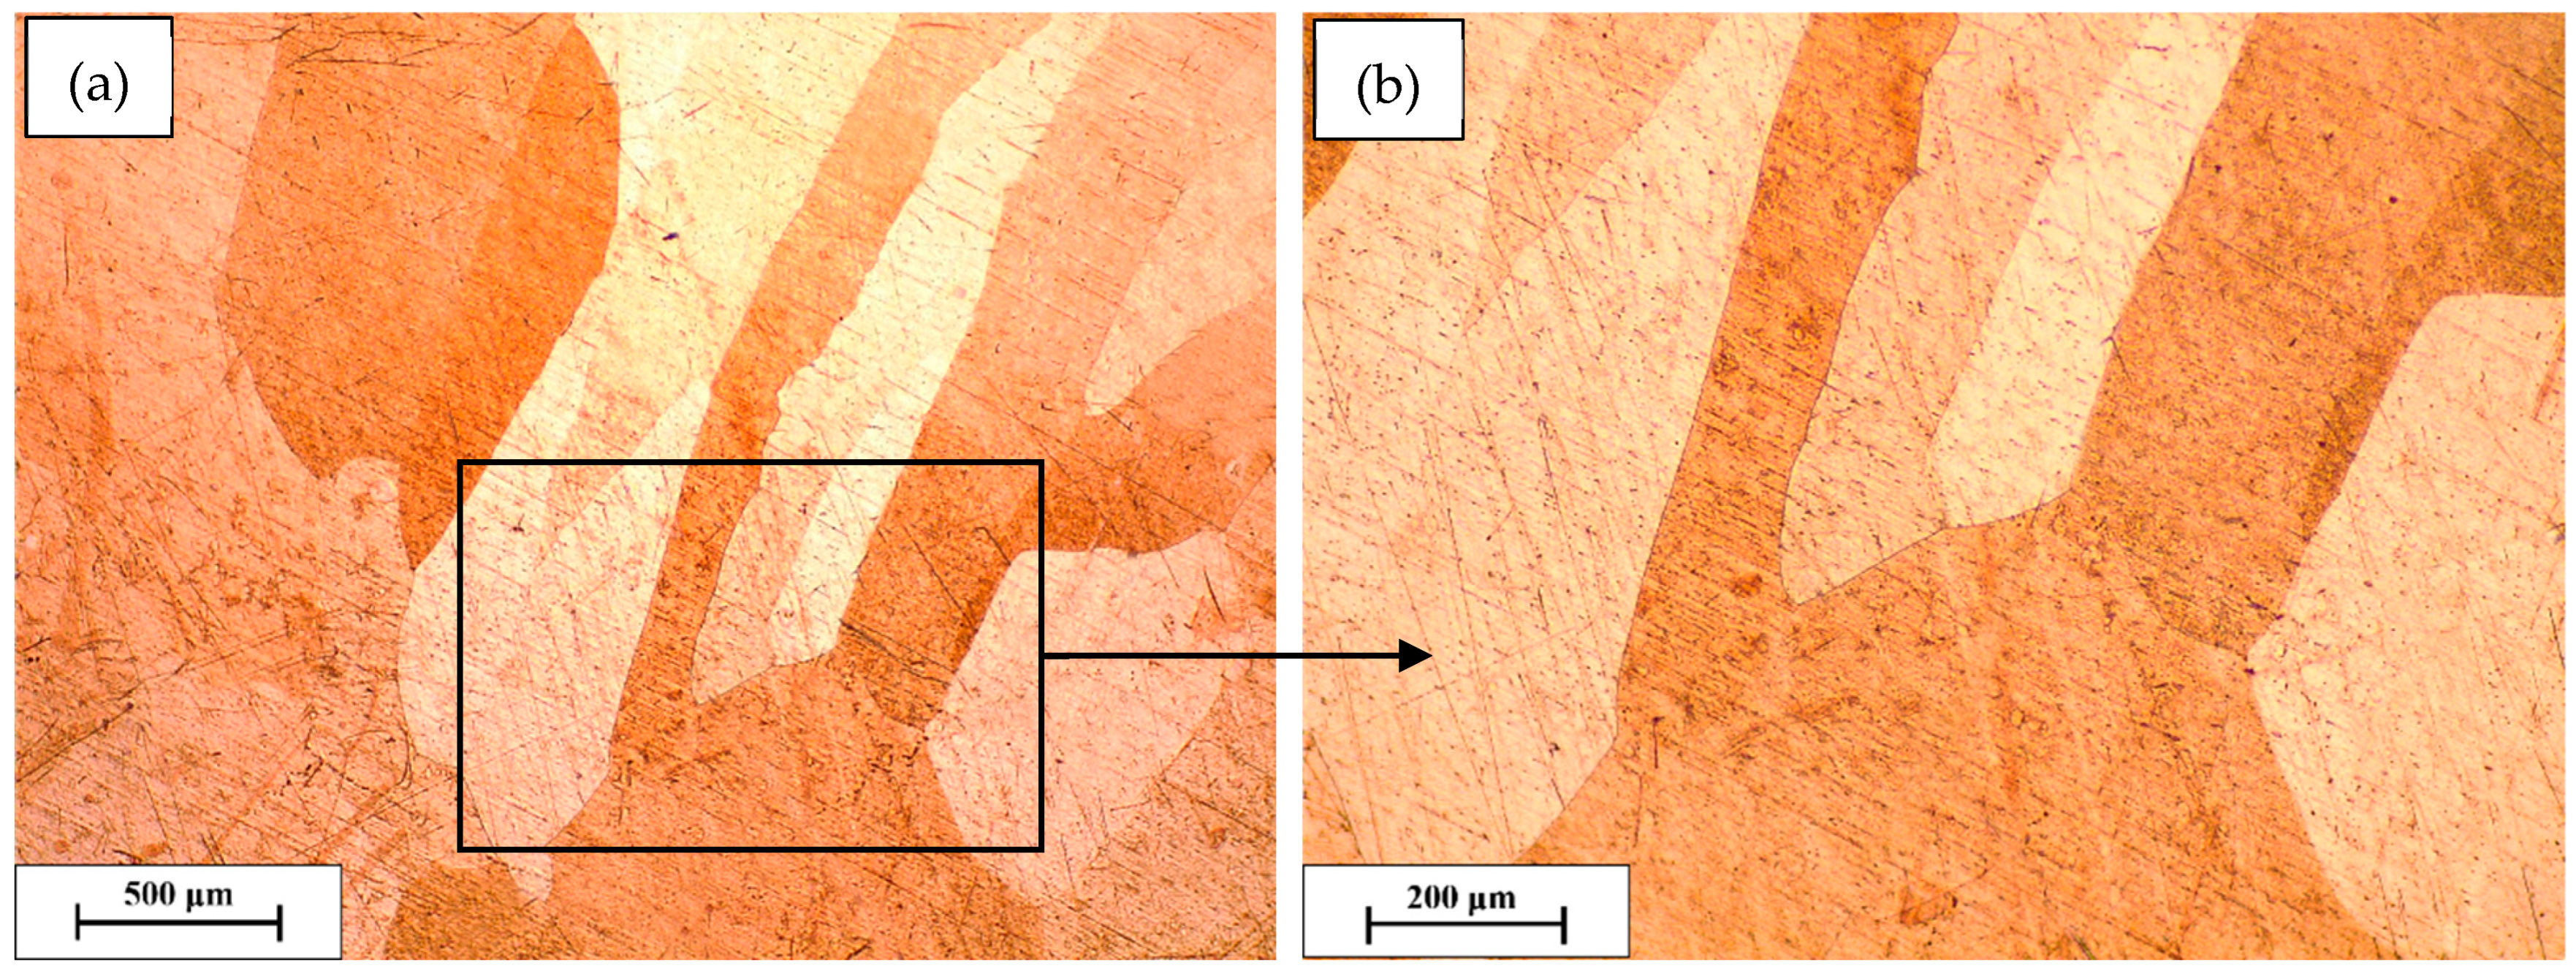
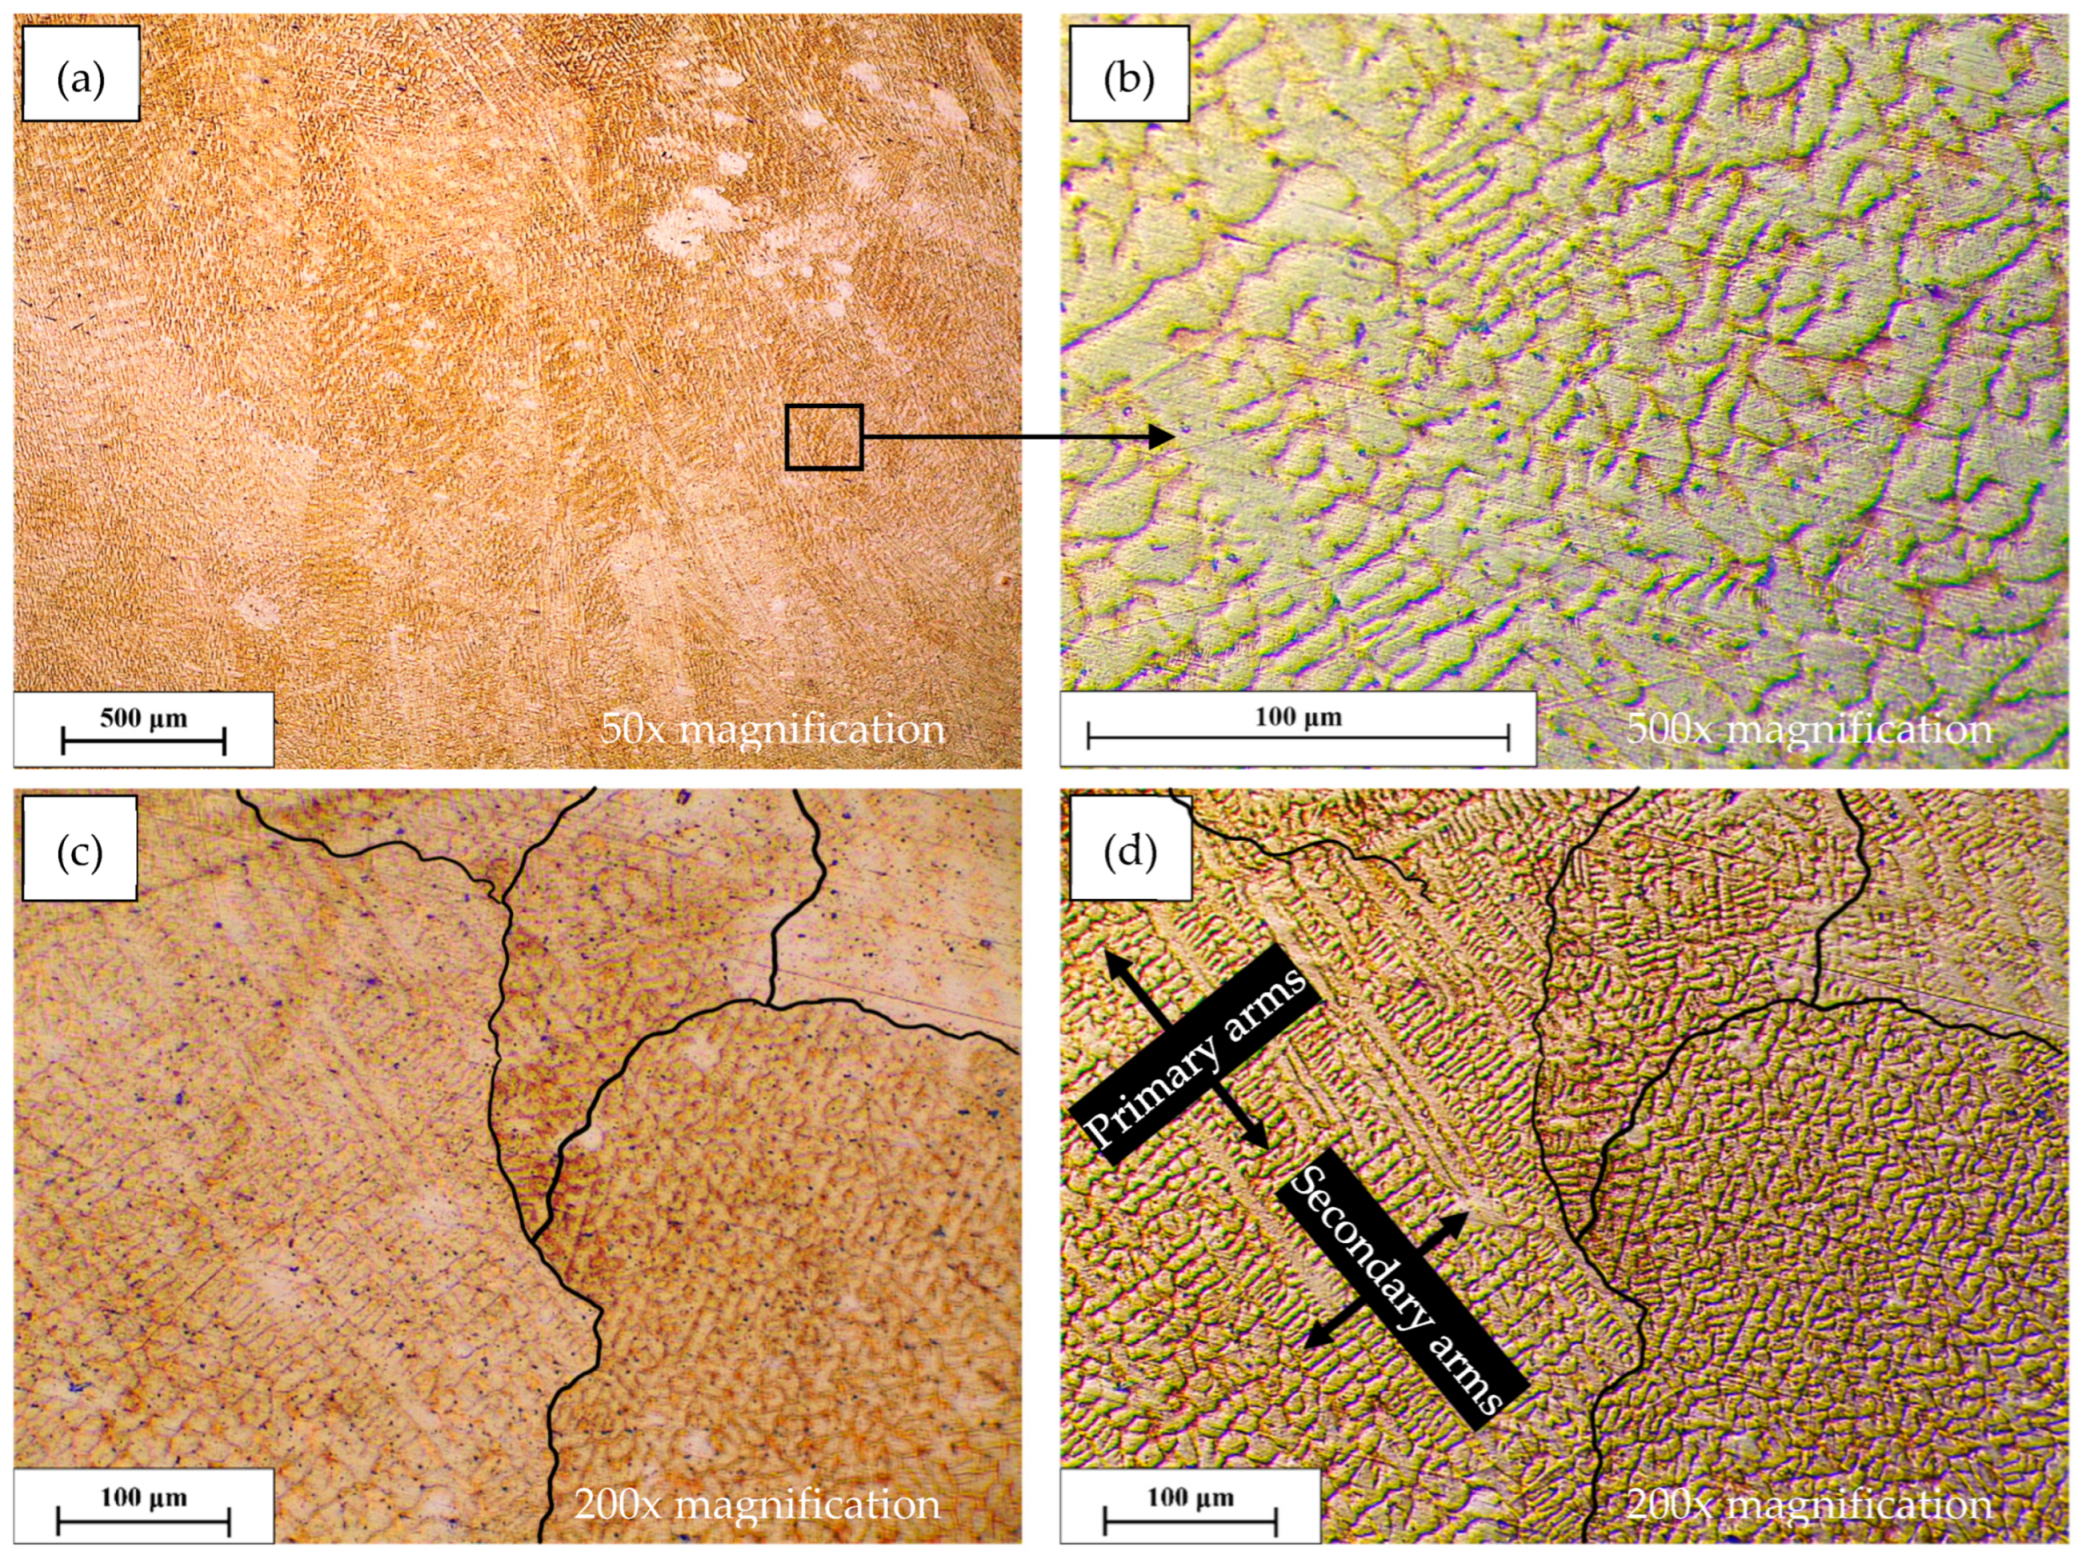
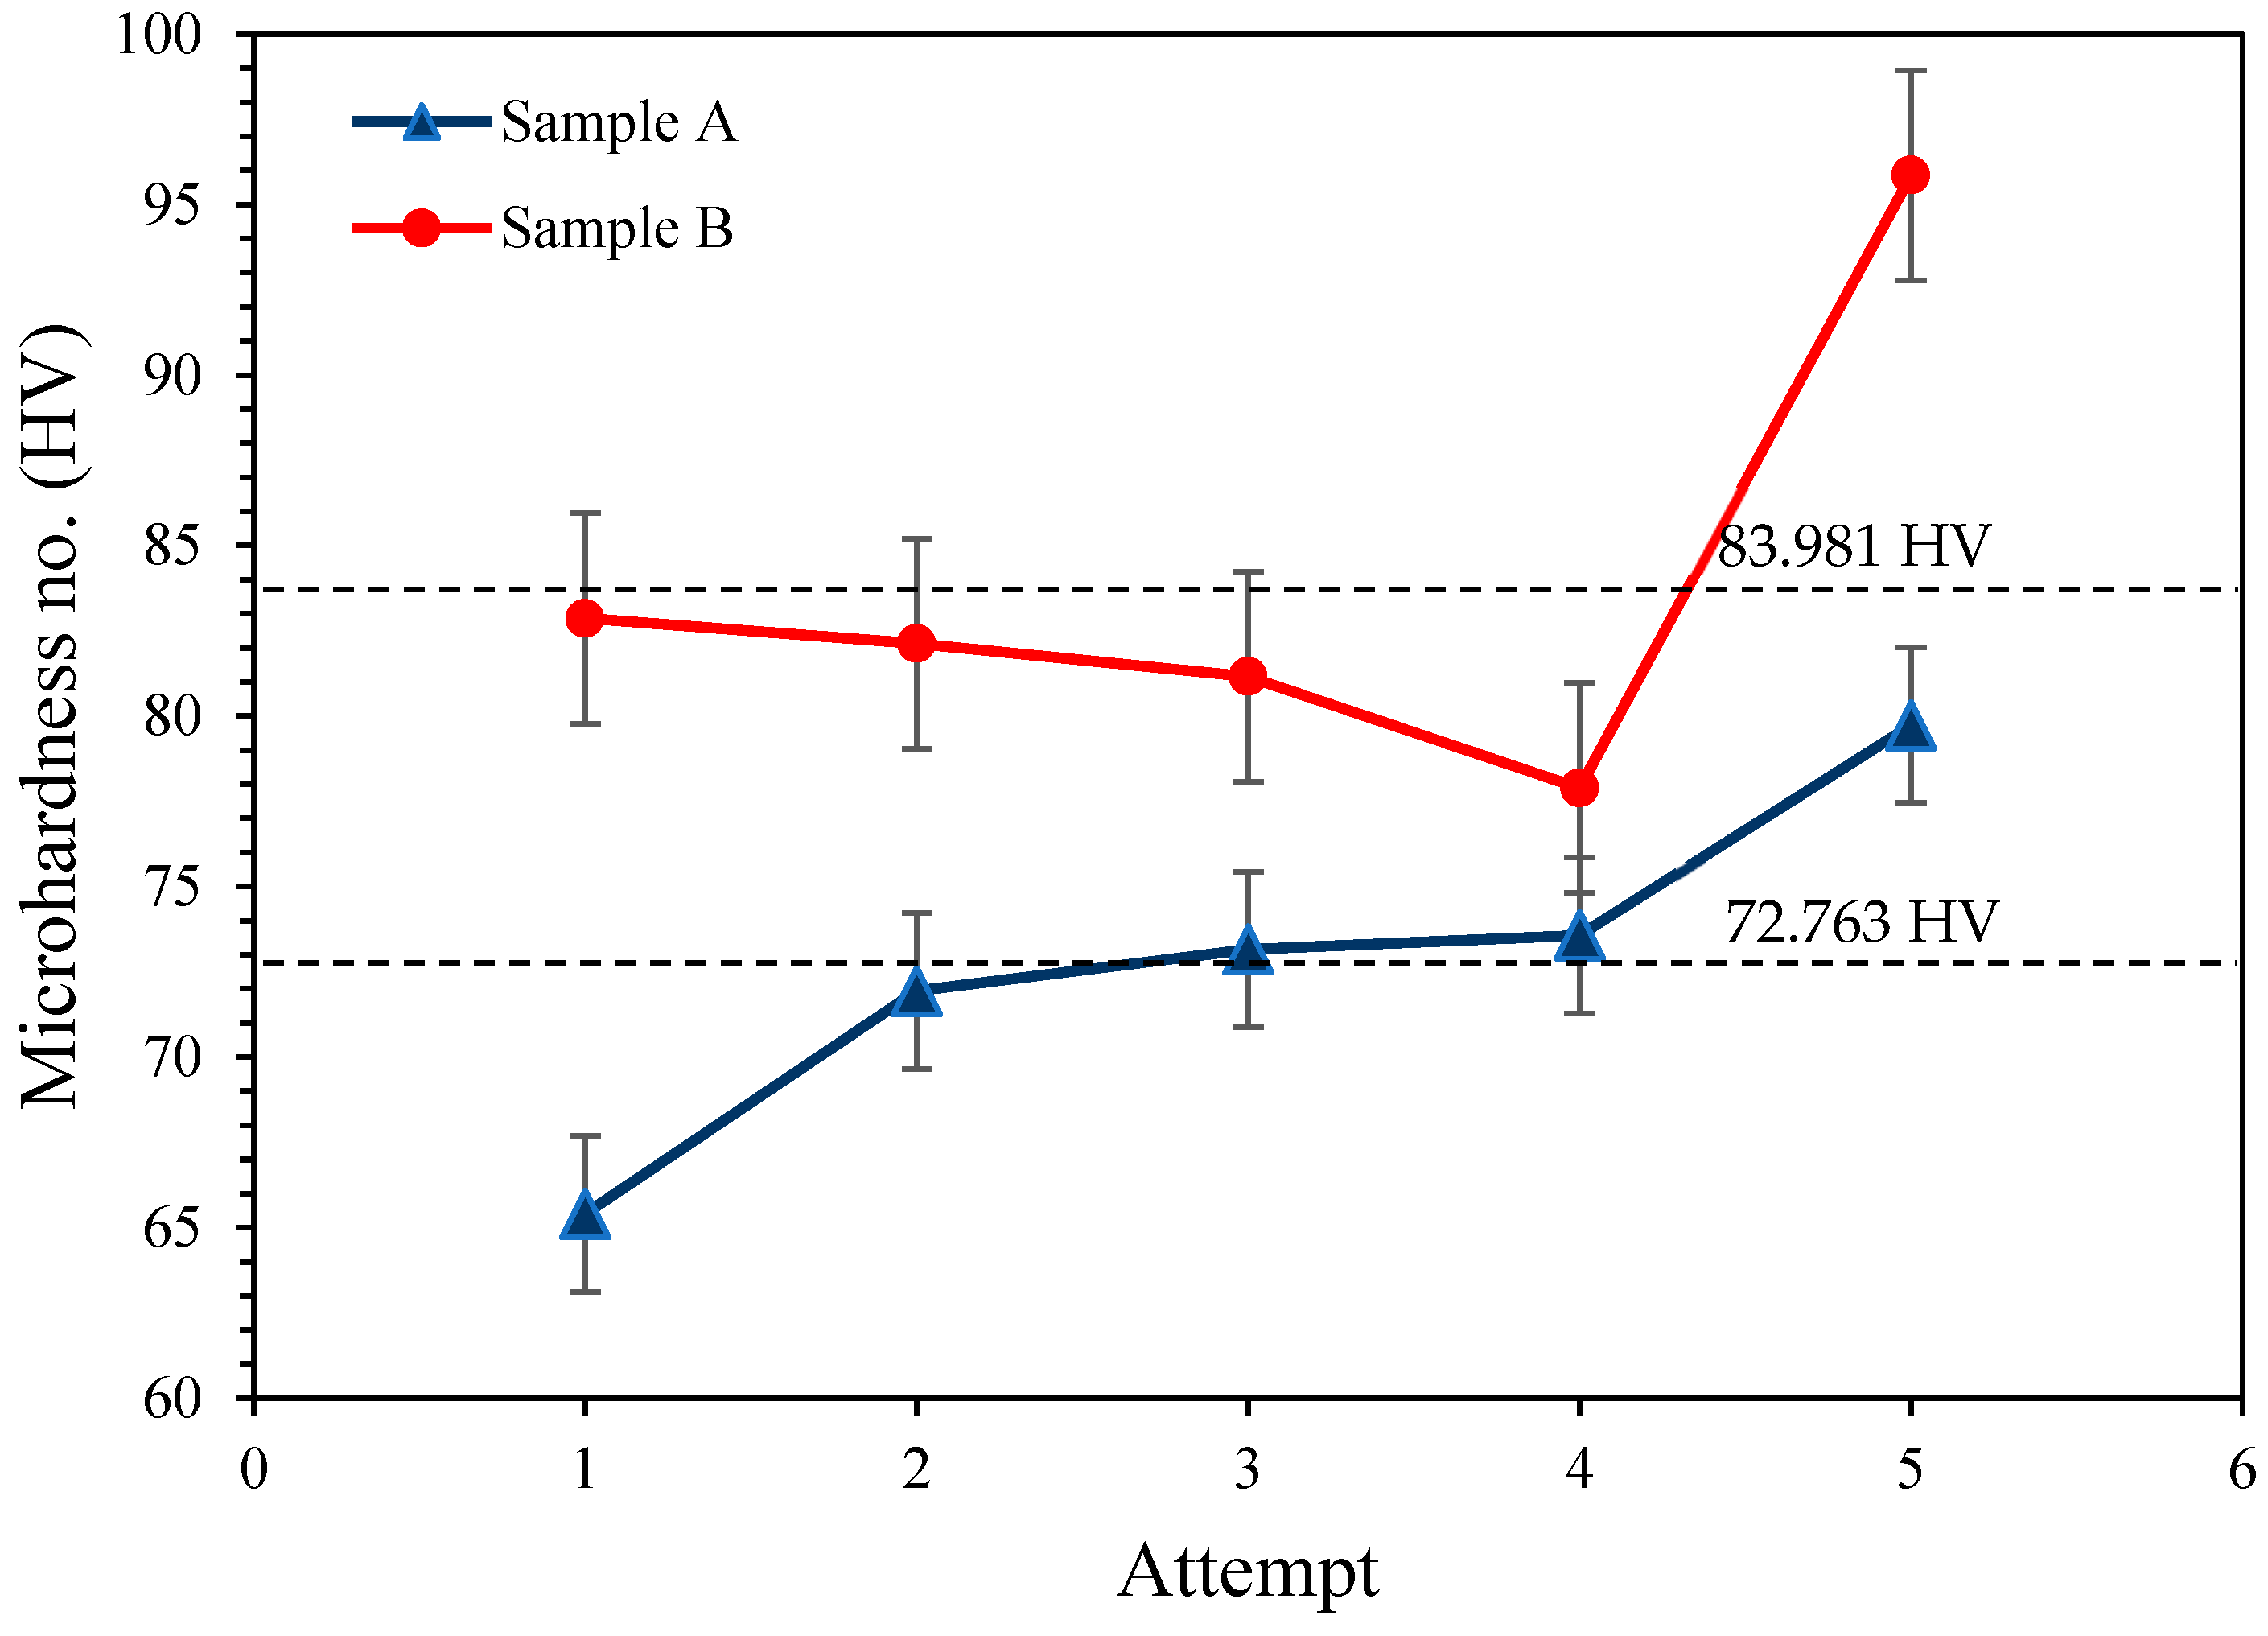
- Microstructural analysis revealed that Sample A, the unmodified alloy, exhibits a coarse equiaxed–columnar grain structure with an average equiaxed grain size of 132 μm and a length-to-width ratio of 5.3:1 for columnar grains, while Sample B, with 8.94 wt.% nickel, develops a refined dendritic morphology with a primary dendrite arm spacing (PDAS) of about 50 μm. This refinement contributes to improved hardness (83.981 HV in Sample B vs. 72.763 HV in Sample A) due to precipitate enrichment.
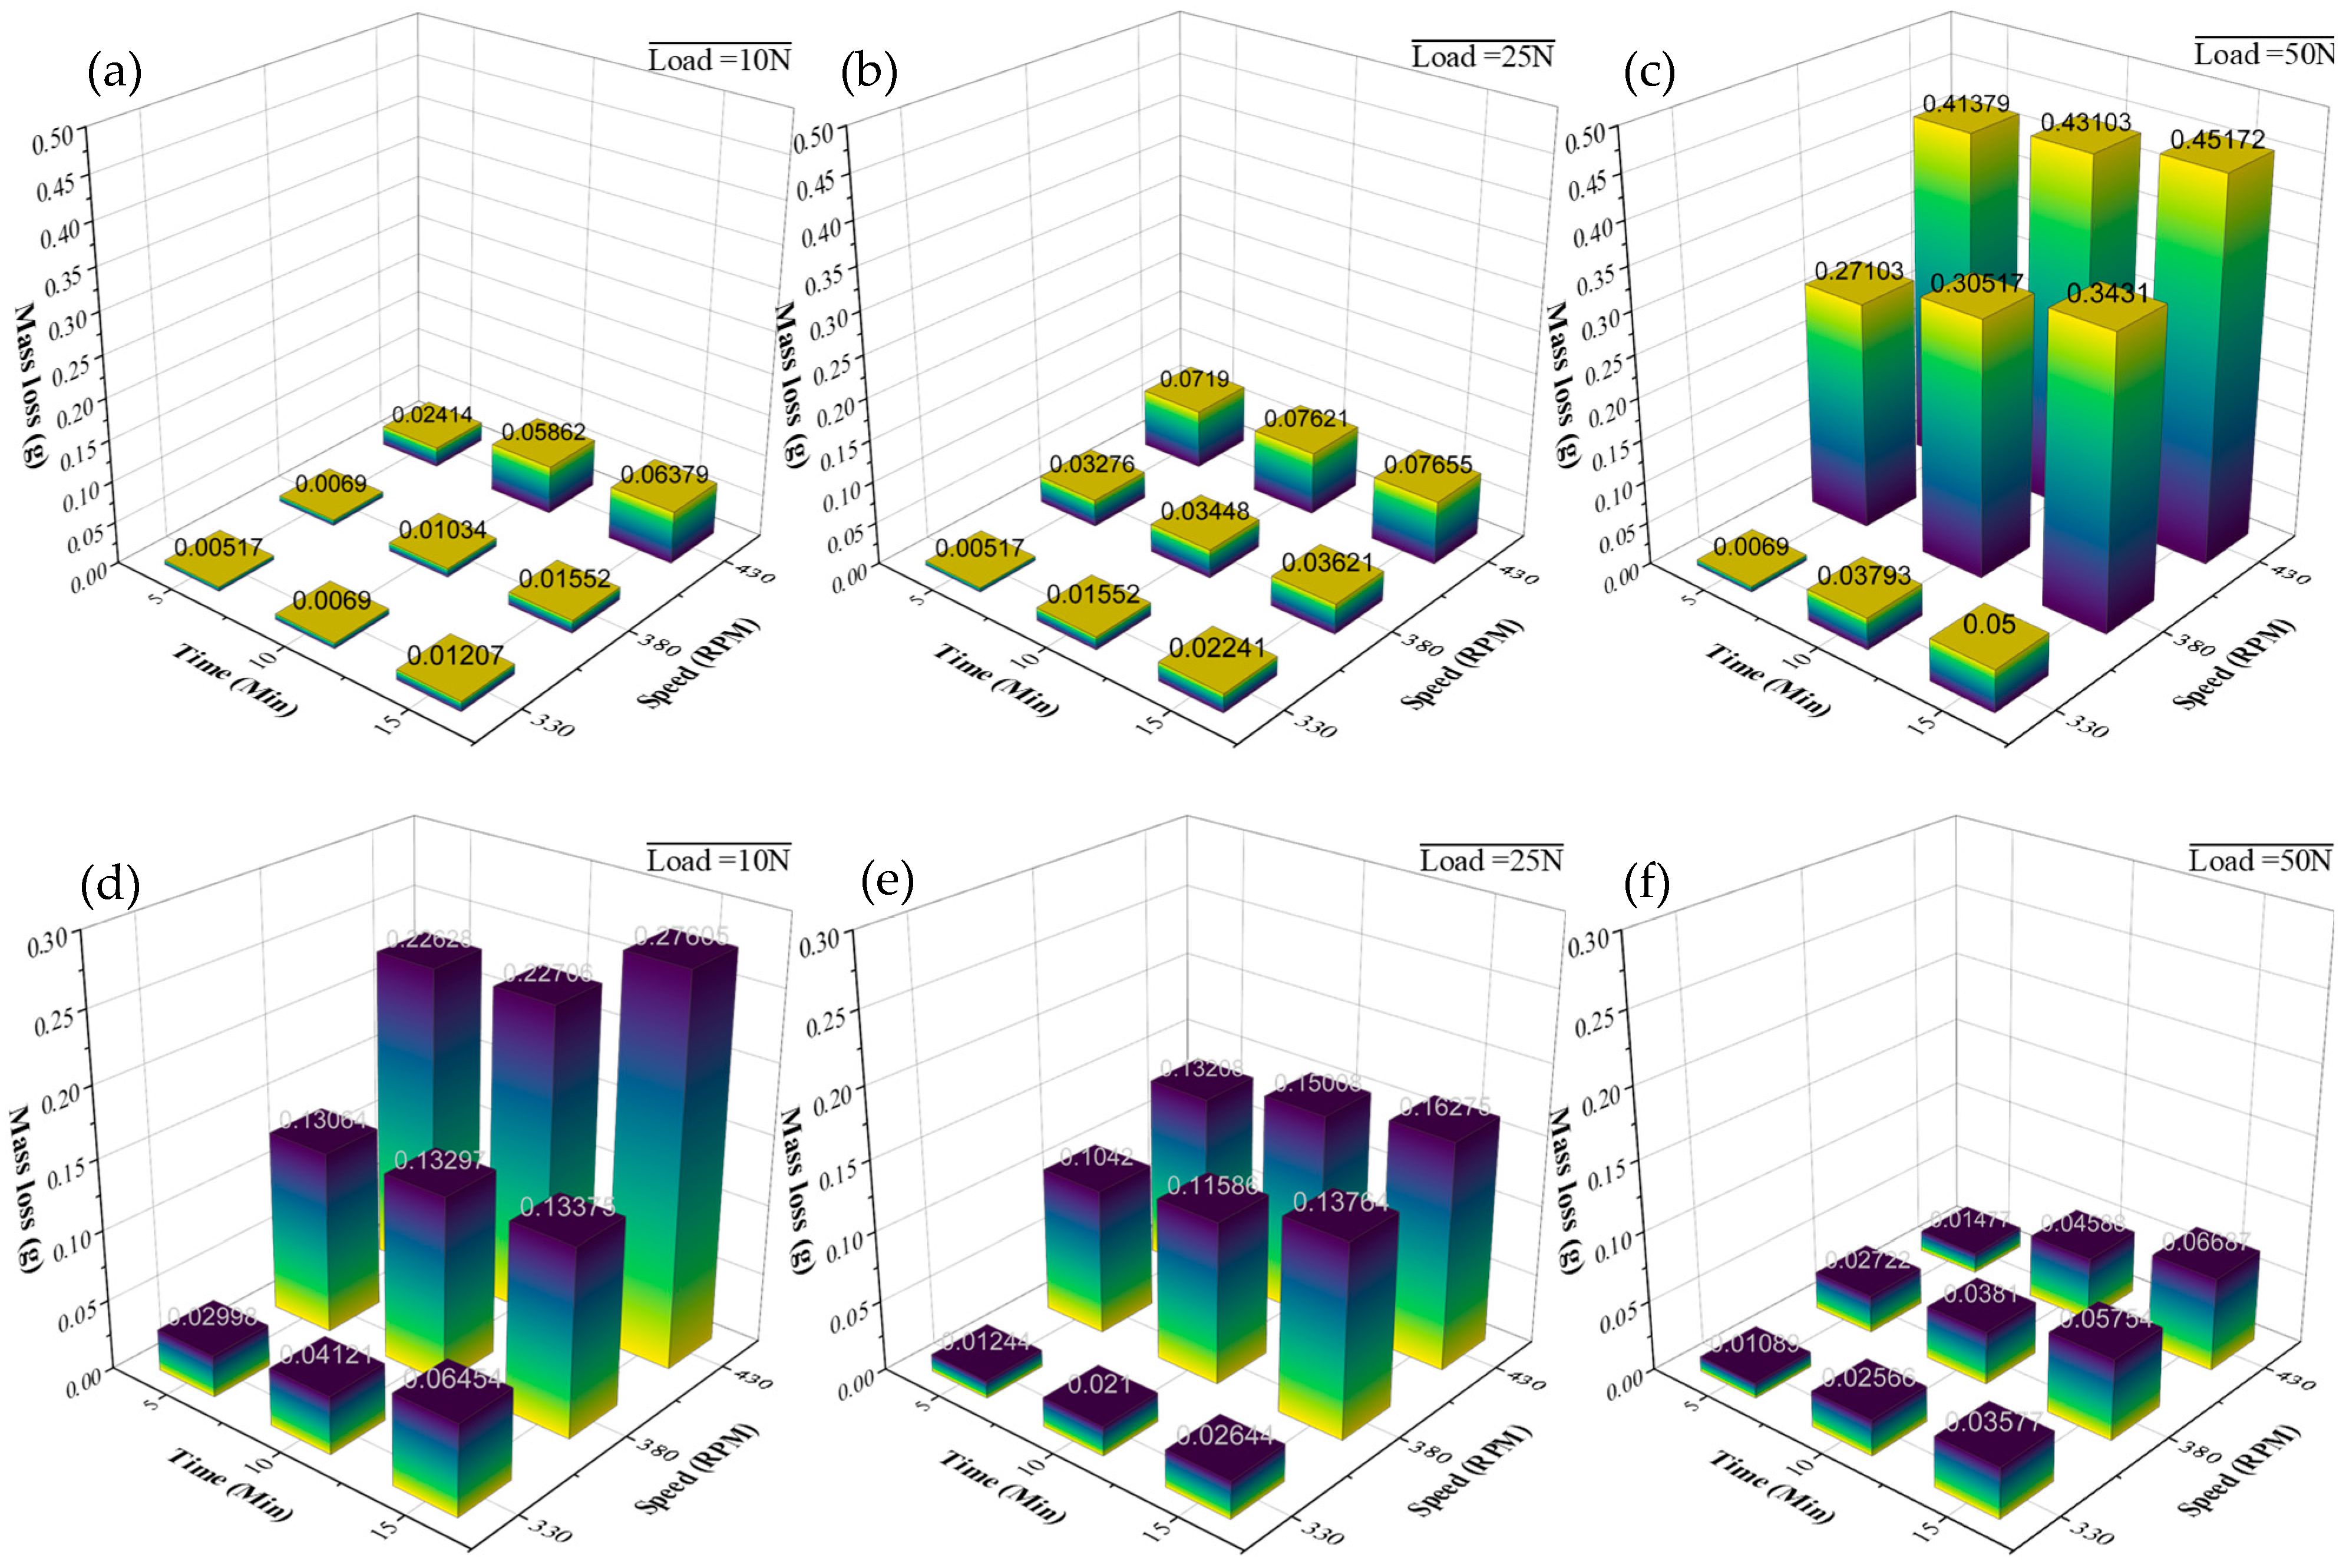
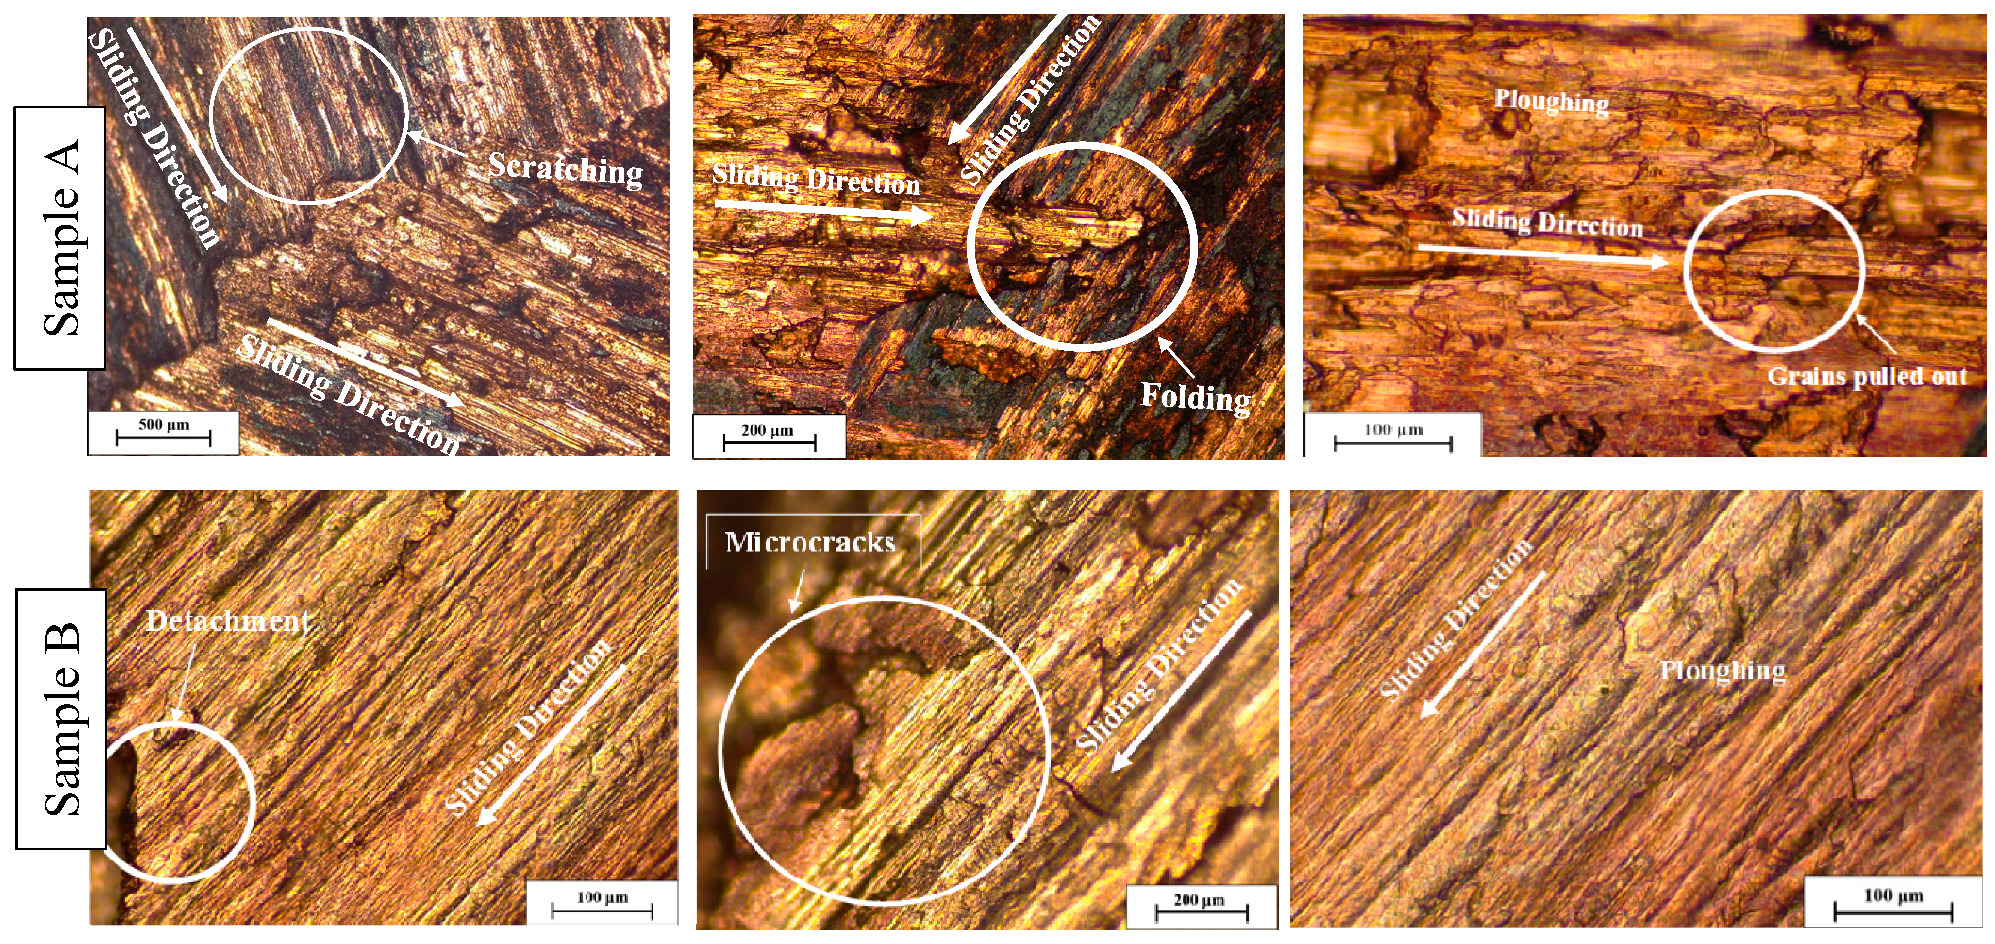
- Wear behavior, evaluated through a full factorial design of experiments, showed distinct responses: Sample A experienced increased mass loss and surface roughness with higher loads and rotational speeds, driven by ploughing wear and grain pull-out, while Sample B exhibited a reduction in both responses under higher loads, attributed to plastic deformation and a polishing effect.
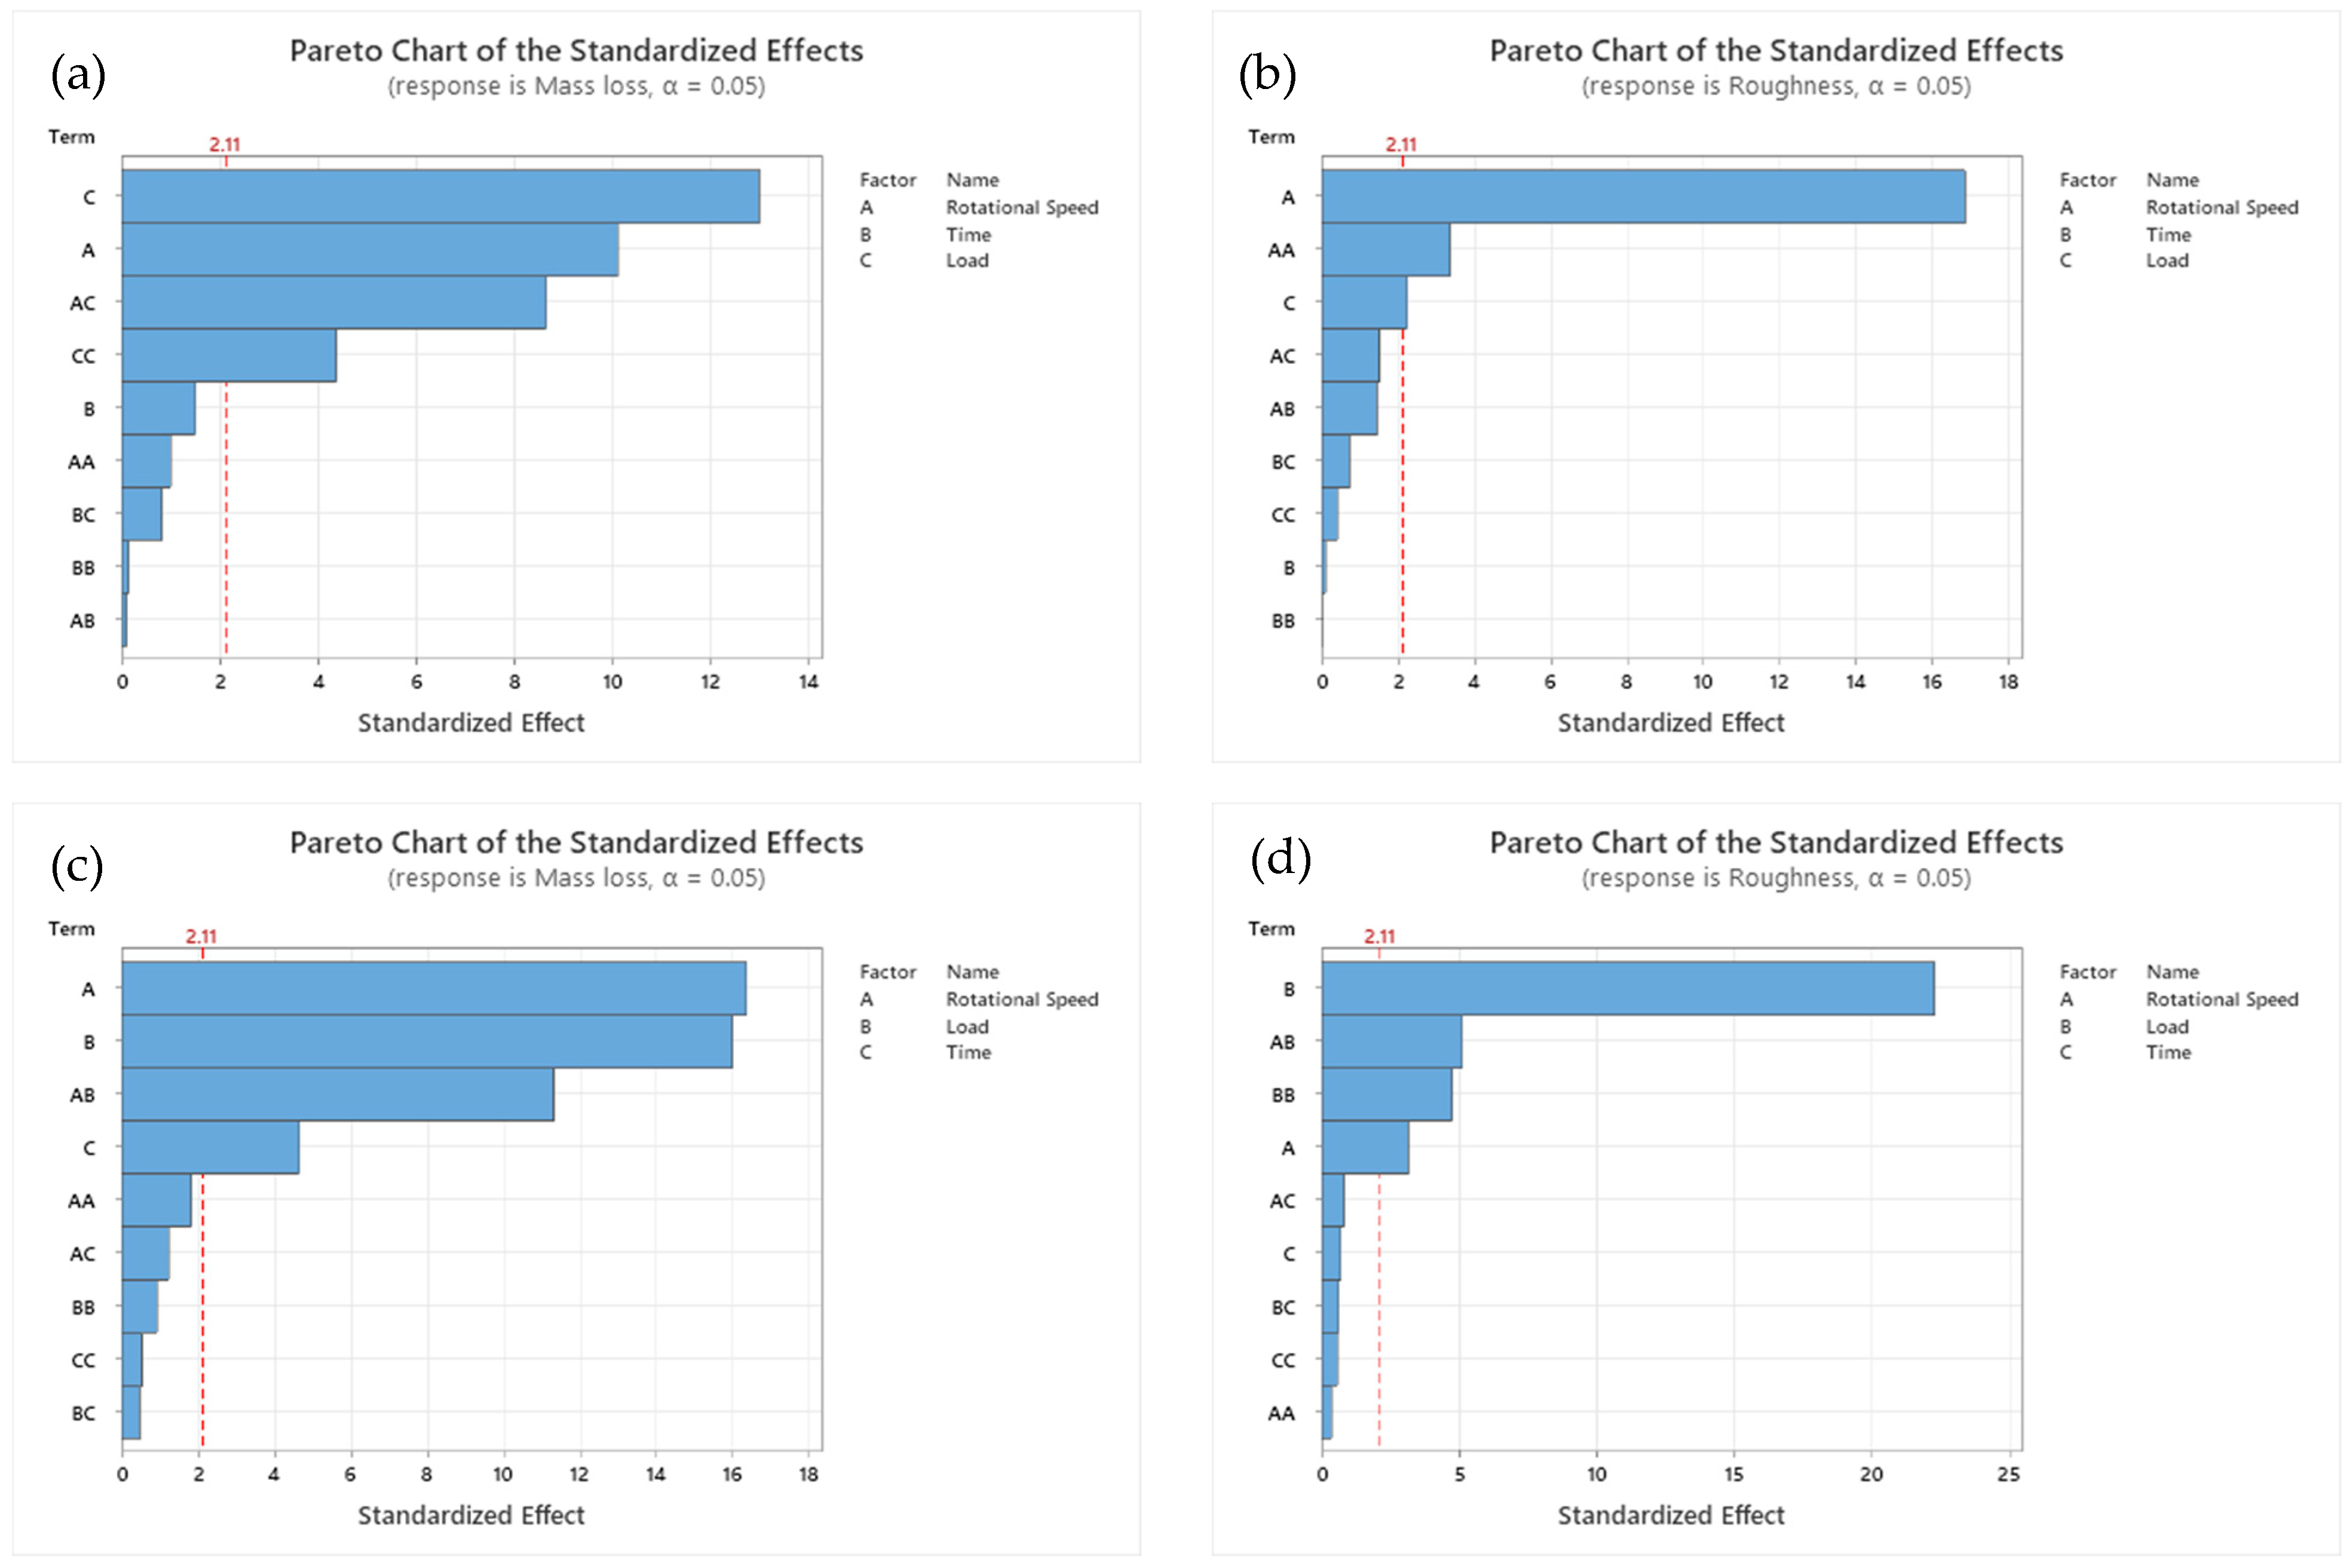
- The design of experiments analysis highlighted load as the primary factor influencing mass loss in Sample A, with rotational speed dominating roughness, whereas in Sample B, load negatively affected both mass loss and roughness, with significant speed–time interactions. These findings suggest that the Ni-modified Cu-Cr-Zr-Ni alloy offers superior wear resistance and surface integrity, particularly under high-load conditions, supporting its potential as an advanced RSW electrode material.
- Future research should investigate the applicability of Ni-modified Cu-Cr-Zr alloys in other high-wear industrial contexts, such as electrical connectors or high-temperature sliding contacts, to assess their versatility beyond RSW electrodes. Additionally, exploring a wider range of alloying elements and their synergistic effects with nickel could provide a broader framework for optimizing Cu-based alloys for tribo-mechanical applications.
- To enhance the current findings, future studies should conduct wear tests with controlled temperature conditions to simulate RSW electrode operation using a pin-on-disc setup with integrated thermocouples.
Author Contributions
Funding
Data Availability Statement
Conflicts of Interest
References
- Spišák, E.; Kaščák, Ľ.; Viňáš, J. Application of resistance spot welding in car body production. Acta Mech. Slovaca 2015, 19, 28–34. [Google Scholar] [CrossRef]
- Zhou, X.; Jiang, J.; Hu, Z.; Hua, L. Lightweight Materials in Electric Vehicles. Int. J. Automot. Manuf. Mater. 2022, 1, 3. [Google Scholar] [CrossRef]
- Spišák, E.; Kaščák, Ľ. Joining Car Body Steel Sheets Using the Clinching Method. Acta Mech. Slovaca 2011, 15, 28–35. [Google Scholar] [CrossRef]
- Viňáš, J.; Kaščák, Ľ.; Ábel, M. Analysis of Materials for Resistance Spot Welding Electrodes. Strojarstvo 2012, 54, 393–397. [Google Scholar]
- Gupta, A.K.; Maddukuri, T.S.; Singh, S.K. Constrained groove pressing for sheet metal processing. Prog. Mater. Sci. 2016, 84, 403–462. [Google Scholar] [CrossRef]
- Bachchhav, B.D.; Chaitanya, S.V.; Salunkhe, S.; Chandrakumar, P.; Pagáč, M.; Nasr, E.A. Wear Performance of Cu–Cd, Cu–Be and Cu–Cr–Zr Spot Welding Electrode Materials. Lubricants 2023, 11, 291. [Google Scholar] [CrossRef]
- Helenius, A. Copper Alloy to be Used as Resistance Welding Electrode. 1989, pp. 1–9. Available online: https://patents.google.com/patent/EP0397061A1/en (accessed on 3 June 2025).
- Zhao, D.; Vdonin, N.; Slobodyan, M.; Butsykin, S.; Kiselev, A.; Gordynets, A. Assessing Electrode Characteristics in Continuous Resistance Spot Welding of BH 340 Steel Based on Dynamic Resistance. J. Manuf. Mater. Process. 2023, 7, 218. [Google Scholar] [CrossRef]
- Bachchhav, B.; Kumbhare, A.; Hoonur, C.; Kulkarni, S.; Kalankar, J. Grading of Spot Welding Electrode Material Properties Using AHP. J. Mod. Mech. Eng. Technol. 2020, 7, 59–65. [Google Scholar] [CrossRef]
- Çelik, G.A.; Atapek, Ş.H.; Polat, Ş. Tribological behavior of heat treated CuCrZr alloy. MATEC Web Conf. 2018, 188, 02002. [Google Scholar] [CrossRef]
- Davis, J.; Kalinin, G. Material properties and design requirements for copper alloys used in ITER. J. Nucl. Mater. 1998, 258–263, 323–328. [Google Scholar] [CrossRef]
- Wang, T.; Li, L.; Pallaka, M.R.; Das, H.; Whalen, S.; Soulami, A.; Upadhyay, P.; Kappagantula, K.S. Mechanical and microstructural characterization of AZ31 magnesium-carbon fiber reinforced polymer joint obtained by friction stir interlocking technique. Mater. Des. 2021, 198, 109305. [Google Scholar] [CrossRef]
- Li, J.; Chang, L.; Li, S.; Zhu, X.; An, Z. Microstructure and properties of as-cast Cu-Cr-Zr alloys with lanthanum addition. J. Rare Earths 2018, 36, 424–429. [Google Scholar] [CrossRef]
- Sirsath, K.G.; Bachchhav, B.D. Tribo-mechanical characterization of Cu-Cr-Zr ternary alloy aimed at fin-tube resistance welding electrode material. Ind. Lubr. Tribol. 2023, 75, 942–949. [Google Scholar] [CrossRef]
- Shen, Z.; Lin, Z.; Shi, P.; Zhu, J.; Zheng, T.; Ding, B.; Guo, Y.; Zhong, Y. Enhanced electrical, mechanical and tribological properties of Cu-Cr-Zr alloys by continuous extrusion forming and subsequent aging treatment. J. Mater. Sci. Technol. 2022, 110, 187–197. [Google Scholar] [CrossRef]
- Purcek, G.; Yanar, H.; Demirtas, M.; Shangina, D.V.; Bochvar, N.R.; Dobatkin, S.V. Microstructural, mechanical and tribological properties of ultrafine-grained Cu–Cr–Zr alloy processed by high pressure torsion. J. Alloys Compd. 2020, 816, 152675. [Google Scholar] [CrossRef]
- Ahaki, E.; Mahdavi, S.; Rezayat, M. Enhancing tribological performance of Cu-1Cr-0.15Zr alloy through optimized processing routes. J. Mater. Res. Technol. 2024, 33, 8530–8544. [Google Scholar] [CrossRef]
- Zhilyaev, A.P.; Morozova, A.; Cabrera, J.M.; Kaibyshev, R.; Langdon, T.G. Wear resistance and electroconductivity in a Cu–0.3Cr–0.5Zr alloy processed by ECAP. J. Mater. Sci. 2017, 52, 305–313. [Google Scholar] [CrossRef]
- Aksenov, D.A.; Raab, G.I.; Asfandiyarov, R.N.; Semenov, V.I.; Shuster, L.S. Effect of Cd and SPD on structure, physical, mechanical, and operational properties of alloy of Cu-Cr-Zr. Rev. Adv. Mater. Sci. 2020, 59, 506–513. [Google Scholar] [CrossRef]
- Krishna, S.C.; Rao, G.S.; Jha, A.K.; Pant, B.; Venkitakrishnan, P.V. Strengthening in high strength Cu-Cr-Zr-Ti alloy plates produced by hot rolling. Mater. Sci. Eng. A 2016, 674, 164–170. [Google Scholar] [CrossRef]
- Wang, W.; Zhang, Y.; Yang, H.; Su, L.; Wang, C.; Tong, C.; Zhou, J.; Chen, J.; Wang, B. Effects of Si addition on properties and microstructure of CuCrZr alloy. J. Alloys Compd. 2022, 906, 164277. [Google Scholar] [CrossRef]
- Su, J.; Dong, Q.; Liu, P.; Li, H.; Kang, B. Research on aging precipitation in a Cu–Cr–Zr–Mg alloy. Mater. Sci. Eng. A 2005, 392, 422–426. [Google Scholar] [CrossRef]
- Pang, Y.; Xia, C.; Wang, M.; Li, Z.; Xiao, Z.; Wei, H.; Sheng, X.; Jia, Y.; Chen, C. Effects of Zr and (Ni, Si) additions on properties and microstructure of Cu–Cr alloy. J. Alloys Compd. 2014, 582, 786–792. [Google Scholar] [CrossRef]
- Zhou, H.T.; Zhong, J.W.; Zhou, X.; Zhao, Z.K.; Li, Q.B. Microstructure and properties of Cu–1.0Cr–0.2Zr–0.03Fe alloy. Mater. Sci. Eng. A 2008, 498, 225–230. [Google Scholar] [CrossRef]
- Callister, W.; Rethwisch, D. Materials Science and Engineering: An Introduction; Wiley: Hoboken, NJ, USA, 2007; Volume 94, ISBN 9780471736967. [Google Scholar]
- Schell, J.; Heilmann, P.; Rigney, D.A. Friction and wear of Cu-Ni alloys. Wear 1982, 75, 205–220. [Google Scholar] [CrossRef]
- Archard, J.F. Contact and Rubbing of Flat Surfaces. J. Appl. Phys. 1953, 24, 981–988. [Google Scholar] [CrossRef]
- Liu, C.; Dong, Y.; Lin, Y.; Yan, H.; Zhang, W.; Bao, Y.; Ma, J. Enhanced mechanical and tribological properties of graphene/bismaleimide composites by using reduced graphene oxide with non-covalent functionalization. Compos. Part B Eng. 2019, 165, 491–499. [Google Scholar] [CrossRef]
- ISO 13565-2; Geometrical Product Specifications (GPS)—Surface Texture: Profile Method; Surfaces Having Stratified Functional Properties—Part 2: Height Characterization Using the Linear Material Ratio Curve. International Organization for Standardization: Geneva, Switzerland, 1996.
- ASTM G99; Standard Test Method for Wear Testing with a Pin-on-Disk Apparatus. ASTM International: West Conshohocken, PA, USA, 2016.
- Narayana Samy, V.P.; Schäfle, M.; Brasche, F.; Krupp, U.; Haase, C. Understanding the mechanism of columnar–to-equiaxed transition and grain refinement in additively manufactured steel during laser powder bed fusion. Addit. Manuf. 2023, 73, 103702. [Google Scholar] [CrossRef]
- Prasad, A.; Yuan, L.; Lee, P.; Patel, M.; Qiu, D.; Easton, M.; StJohn, D. Towards understanding grain nucleation under Additive Manufacturing solidification conditions. Acta Mater. 2020, 195, 392–403. [Google Scholar] [CrossRef]
- Doherty, R.D.; Feest, E.A.; Holm, K. Dendritic solidification of Cu-Ni alloys: Part I. Initial growth of dendrite structure. Metall. Trans. 1973, 4, 115–124. [Google Scholar] [CrossRef]
- Zeng, H.; Ai, X.; Chen, M.; Guan, R.; Chao, Y.; Zhang, J. Phase-field simulation study on dendritic growth behavior during bilateral directional solidification. Mater. Today Commun. 2024, 40, 109618. [Google Scholar] [CrossRef]
- Algoso, P.; Hofmeister, W.; Bayuzick, R. Solidification velocity of undercooled Ni–Cu alloys. Acta Mater. 2003, 51, 4307–4318. [Google Scholar] [CrossRef]
- Chen, C.; Sun, J.; Yang, Y.; Li, J.; Zhou, Y. Effect of dendrite arrays near grain boundary on the competitive growth of converging Ni-based bi-crystal superalloys. Mater. Lett. 2023, 344, 134477. [Google Scholar] [CrossRef]
- Li, H.; Xie, S.; Mi, X.; Wu, P. Phase and Microstructure Analysis of Cu-Cr-Zr Alloys. J. Mater. Sci. Technol. 2007, 23, 795–800. [Google Scholar]
- Wang, Y.; Lan, X.; Shi, Y.; Hu, B.; Sheng, S.; Zhang, C. Phase equilibria of the Cr−Zr−Ni and Cu−Cr−Zr−Ni systems supported by key experiment and thermodynamic calculation. Mater. Today Commun. 2025, 42, 111484. [Google Scholar] [CrossRef]
- Liu, Y.; Zhou, P.; Liu, S.; Du, Y. Experimental investigation and thermodynamic description of the Cu-Cr-Zr system. Calphad 2017, 59, 1–11. [Google Scholar] [CrossRef]
- Hermana, G.N.; Huang, T.-T.; Chen, C.-M.; Lin, C.-H.; Iikubo, S.; Yen, Y.-W. Phase equilibria of the Cu-Ni-Zr ternary systems at 800 °C and thermodynamic assessment and metallic glass region prediction for the Cu-Ni-Zr ternary system. J. Non-Cryst. Solids 2018, 481, 612–621. [Google Scholar] [CrossRef]
- Singh, K.P.; Patel, A.; Bhope, K.; Khirwadkar, S.S.; Mehta, M. Optimization of the diffusion bonding parameters for SS316L/CuCrZr with and without Nickel interlayer. Fusion Eng. Des. 2016, 112, 274–282. [Google Scholar] [CrossRef]
- Al-Qawabah, S.M.A.; Shaban, N.A.; Al-Aboshi, A. Investigation of Roller Burnishing Process on the Mechanical Characteristics, and Micro-hardness of Al-4 wt% Cu Under Hot Work Conditions. In International Conference on Engineering, Project, and Product Management; Springer: Berlin/Heidelberg, Germany, 2018; pp. 209–214. [Google Scholar]
- Mostafa, A.O. Mechanical Properties and Wear Behavior of Aluminum Grain Refined by Ti and Ti+B. Int. J. Surf. Eng. Interdiscip. Mater. Sci. 2019, 7, 1–19. [Google Scholar] [CrossRef]


| Designation | Nominal Composition (wt.%) | Actual Composition (wt.%) | ||||||
|---|---|---|---|---|---|---|---|---|
| Cr | Zr | Ni | Cu | Cr | Zr | Ni | Cu | |
| Sample A | 1.0 | 0.15 | - | Balance | 0.871 | 0.156 | - | Balance |
| Sample B | 0.903 | 0.135 | 9.662 | Balance | 0.760 | 0.123 | 8.94 | Balance |
| Factors | Values | ||
|---|---|---|---|
| Sliding diameter (mm) | 50 | ||
| Rotational speed (rpm) | 330 | 380 | 430 |
| Load (N) | 10 | 25 | 50 |
| Time (min) | 5 | 10 | 15 |
| Point | Sample A wt.% | Sample B wt.% | |||||
|---|---|---|---|---|---|---|---|
| Cu | Cr | Zr | Cu | Cr | Ni | Zr | |
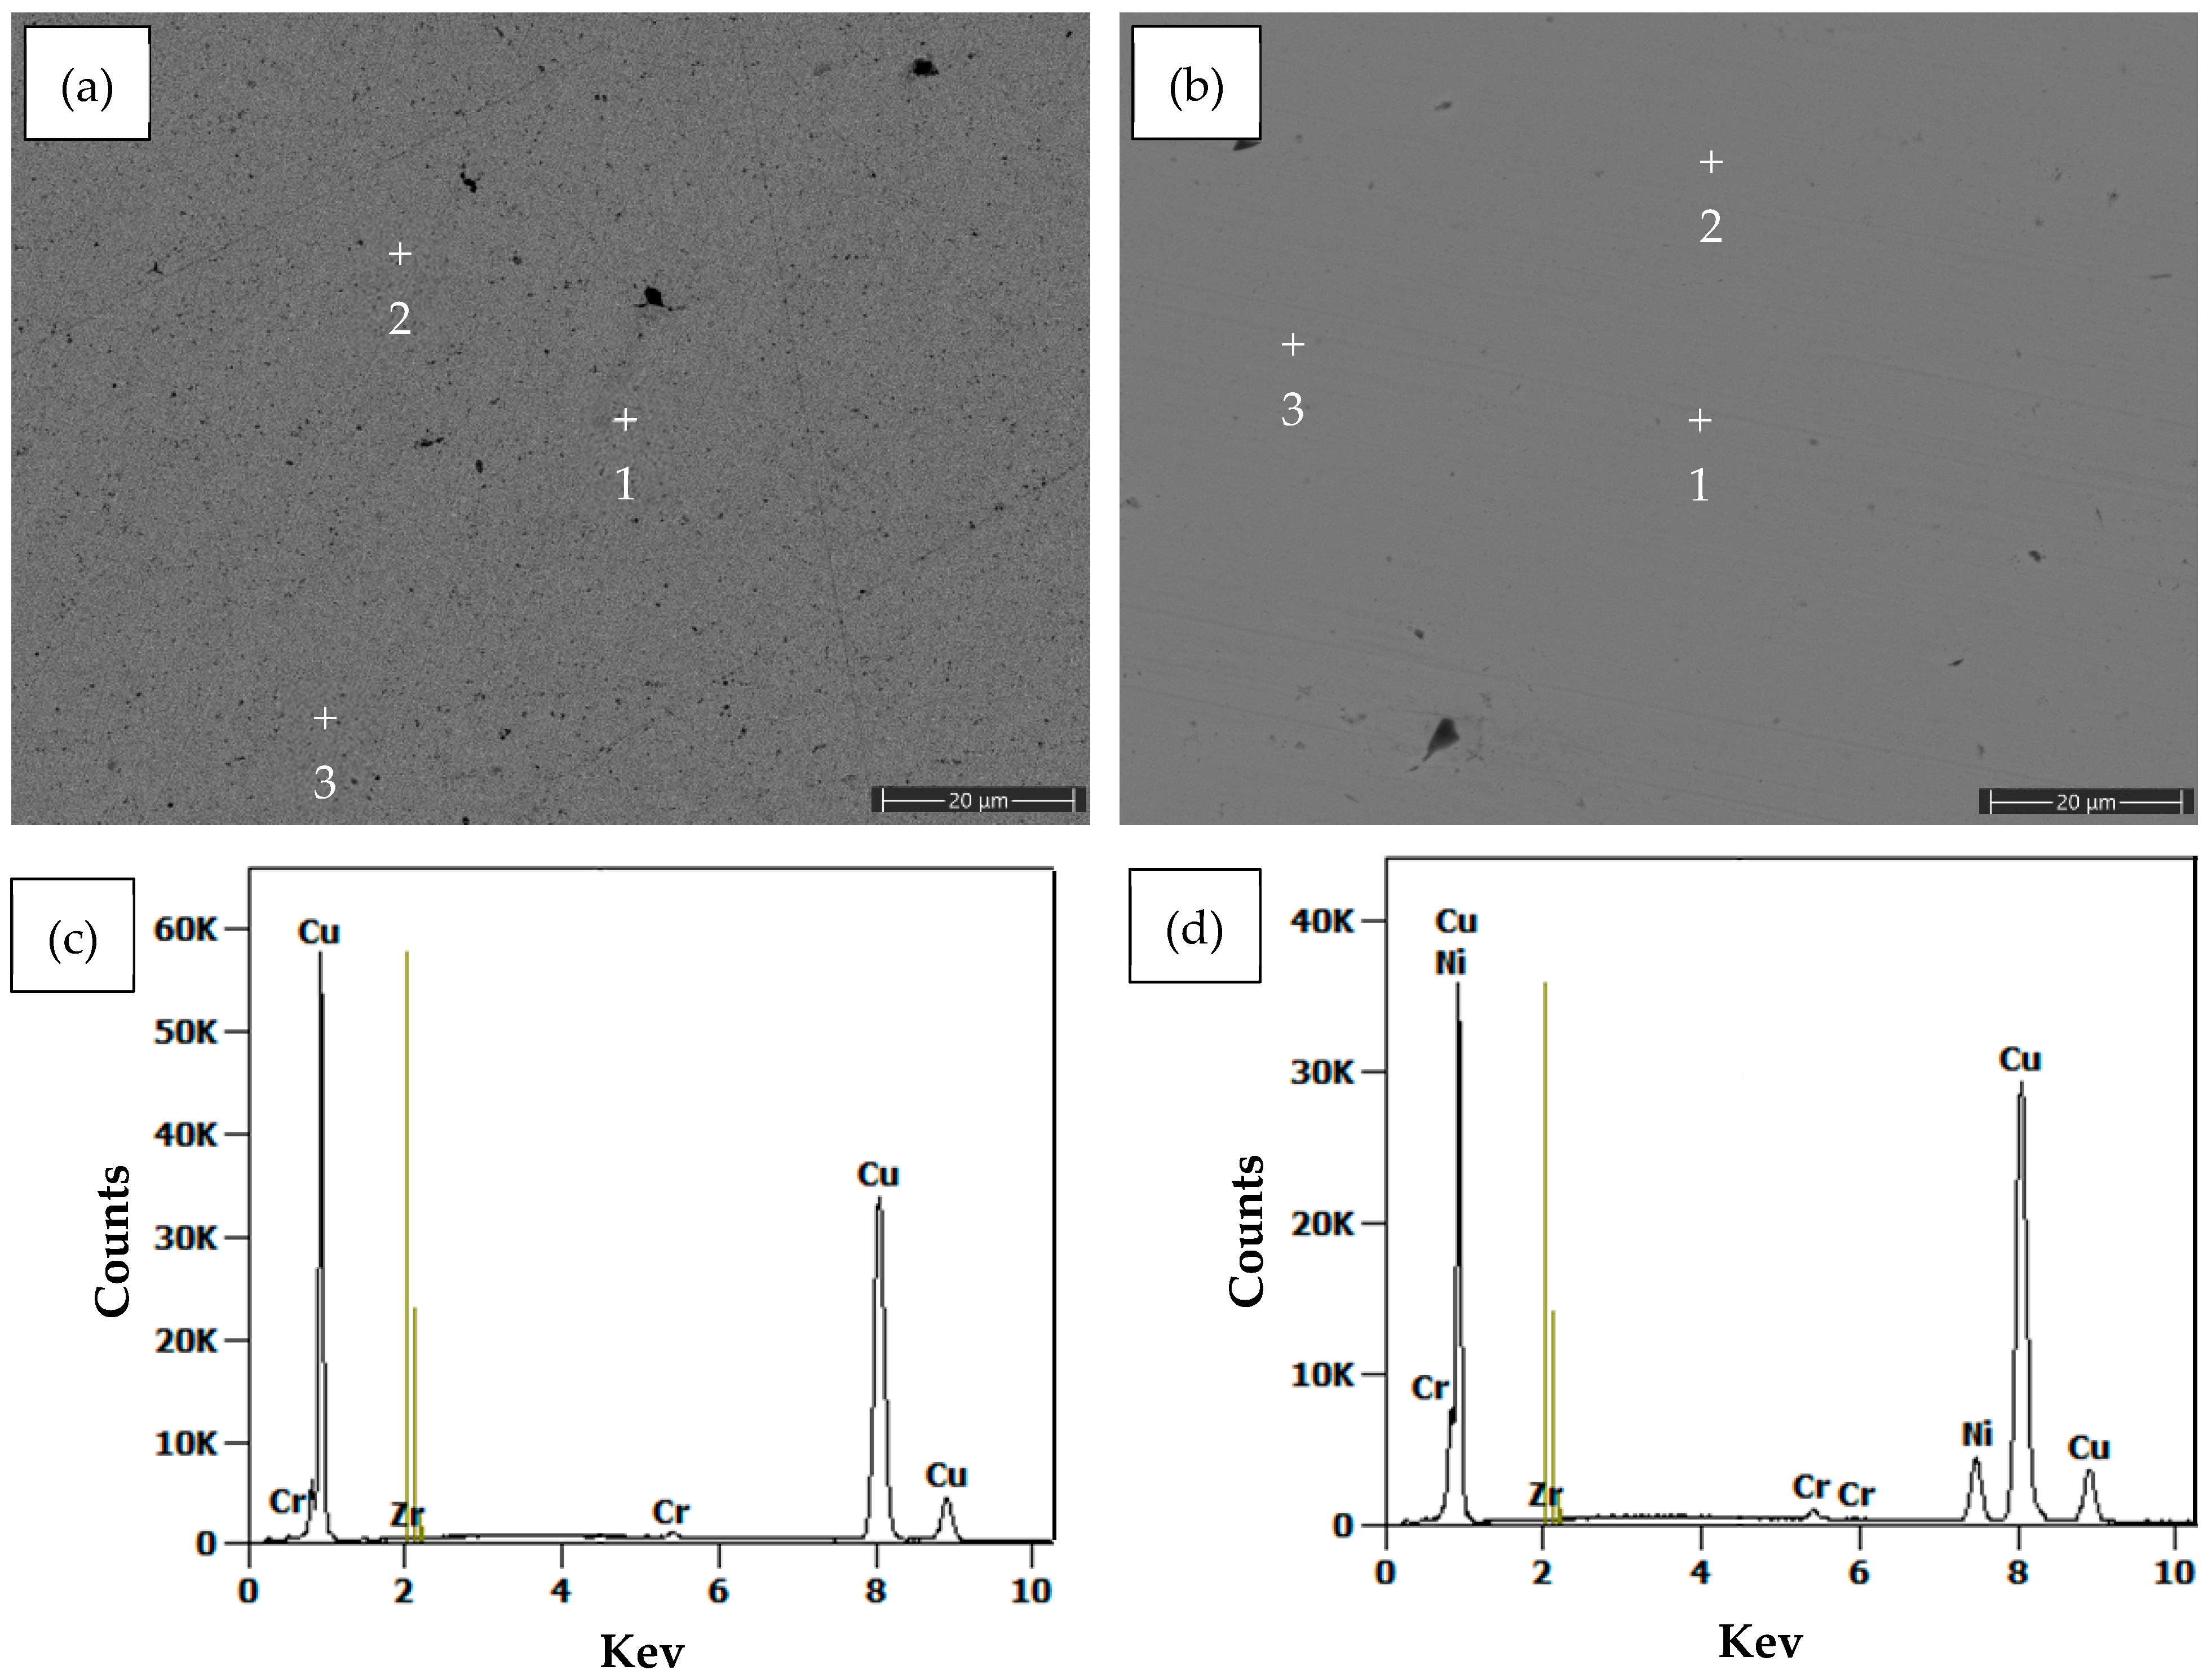
| 1 | 99.47 | 0.29 | 0.24 | 89.31 | 0.90 | 9.66 | 0.13 |
| 2 | 99.41 | 0.45 | 0.14 | 91.11 | 0.63 | 8.16 | 0.10 |
| 3 | 99.54 | 0.37 | 0.09 | 90.36 | 0.45 | 9.05 | 0.14 |
| Error wt.% | ±0.26 | ±0.03 | ±0.24 | ±0.26 | ±0.03 | ±0.10 | ±0.24 |
| Mass Loss (g) | |||||||
|---|---|---|---|---|---|---|---|
| 10 N | 25 N | 50 N | |||||
| Speed (rpm) | Time (min) | Sample A | Sample B | Sample A | Sample B | Sample A | Sample B |
| 330 | 5 | 0.0052 | 0.0299 | 0.00517 | 0.0124 | 0.0069 | 0.0109 |
| 10 | 0.0069 | 0.0412 | 0.01552 | 0.0210 | 0.0379 | 0.0257 | |
| 15 | 0.0121 | 0.0645 | 0.02241 | 0.0264 | 0.0500 | 0.0358 | |
| 380 | 5 | 0.0069 | 0.1306 | 0.03276 | 0.1042 | 0.2710 | 0.0272 |
| 10 | 0.0103 | 0.1330 | 0.03448 | 0.1159 | 0.3052 | 0.0381 | |
| 15 | 0.0155 | 0.1338 | 0.03621 | 0.1376 | 0.3431 | 0.0575 | |
| 430 | 5 | 0.0241 | 0.2263 | 0.0719 | 0.1321 | 0.4138 | 0.0148 |
| 10 | 0.0586 | 0.2271 | 0.07621 | 0.1501 | 0.4310 | 0.0459 | |
| 15 | 0.0638 | 0.2761 | 0.07655 | 0.1628 | 0.4517 | 0.0669 | |
Disclaimer/Publisher’s Note: The statements, opinions and data contained in all publications are solely those of the individual author(s) and contributor(s) and not of MDPI and/or the editor(s). MDPI and/or the editor(s) disclaim responsibility for any injury to people or property resulting from any ideas, methods, instructions or products referred to in the content. |
© 2025 by the authors. Licensee MDPI, Basel, Switzerland. This article is an open access article distributed under the terms and conditions of the Creative Commons Attribution (CC BY) license (https://creativecommons.org/licenses/by/4.0/).
Share and Cite
Mostafa, A.; Alhdayat, R.; Abdullah, R. Tribo-Mechanical Characteristics of Modified Cu-Cr-Zr Resistance Spot Welding Electrode with Nickel. Crystals 2025, 15, 560. https://doi.org/10.3390/cryst15060560
Mostafa A, Alhdayat R, Abdullah R. Tribo-Mechanical Characteristics of Modified Cu-Cr-Zr Resistance Spot Welding Electrode with Nickel. Crystals. 2025; 15(6):560. https://doi.org/10.3390/cryst15060560
Chicago/Turabian StyleMostafa, Ahmad, Reham Alhdayat, and Rasheed Abdullah. 2025. "Tribo-Mechanical Characteristics of Modified Cu-Cr-Zr Resistance Spot Welding Electrode with Nickel" Crystals 15, no. 6: 560. https://doi.org/10.3390/cryst15060560
APA StyleMostafa, A., Alhdayat, R., & Abdullah, R. (2025). Tribo-Mechanical Characteristics of Modified Cu-Cr-Zr Resistance Spot Welding Electrode with Nickel. Crystals, 15(6), 560. https://doi.org/10.3390/cryst15060560