Article

The Effect of Powder-to-Flux Ratio and Heating Duration on the Microstructure and Corrosion Resistance of WO3 Nanoparticle-Reinforced Sn–20Bi Coatings on Low-Carbon Steel

by
Naglaa Fathy
1,*,
Mohamed Ramadan
2,3,*,
Shereen Mohammad Al-Shomar
1,
Khalid M. Hafez
3,
El-Sayed M. Sherif
4,
Alhulw H. Alshammari
5 and
K. S. Abdel Halim
2,3
1
Department of Physics, College of Science, University of Ha’il, Ha’il P.O. Box 2440, Saudi Arabia
2
Mechanical/Chemical Engineering Department, College of Engineering, University of Ha’il, Hail P.O. Box 2440, Saudi Arabia
3
Central Metallurgical Research and Development Institute (CMRDI), Helwan P.O. Box 87, Egypt
4
Center of Excellence for Research in Engineering Materials (CEREM), College of Engineering, King Saud University, Riyadh P.O. Box 800, Saudi Arabia
5
Physics Department, College of Science, Jouf University, Sakaka P.O. Box 2014, Saudi Arabia
*
Authors to whom correspondence should be addressed.
Crystals 2025, 15(6), 551; https://doi.org/10.3390/cryst15060551
Submission received: 14 May 2025 / Revised: 4 June 2025 / Accepted: 5 June 2025 / Published: 10 June 2025

Abstract

The current research introduces a cost-effective thermal coating process using a tinning surfacing technique to synthesize WO3 nanoparticle-reinforced Sn-20Bi (S20B) alloy coating on low-carbon steel (LCS). A ball-milling machine was used for mechanical mixing and blending of Sn and Bi powders together with 0.25 wt.% WO3 nanoparticles. The produced powders were mixed with a prefabricated flux in two different ratios to optimize the best surface coating morphology. The synthesized coatings were spread out on the surface of the LCS in a layer of 0.25 g cm−2 and were heated for 3, 4, and 5 min at 370 °C. A series of corrosion tests was carried out to understand the effect of the different S20B and S20B-WO3 coatings on the corrosion passivation of the LCS samples in 3.5% NaCl solution. The coating surface layer thickness increased by decreasing the percentage of flux in the synthesized coating. Increasing the heating time (from 3 min to 5 min) increases surface coating uniformity and slightly boosts the average Fe−Sn intermetallic (IMC) layer thickness (from 1.7 ± 0.3 µm to 3.3 ± 0.3 µm). By incorporating 0.25 wt.% WO3 nanoparticles into the S20B coating surface layer, a uniform microstructure was achieved and the thickness of the Fe–Sn IMC layer was reduced to 2.6 ± 0.3 µm. This study found that the presence of WO3 nanoparticles significantly improved the corrosion resistance of S20B-coated LCS. These results demonstrate that adding a small of WO3 nanoparticles significantly enhances the microstructural integrity and corrosion resistance of S20B coatings on LCS.

1. Introduction

Surface coating of metallic components is essential for enhancing the performance, durability, and efficiency of industrial engineering systems [1,2,3]. A range of coating techniques have been developed, including hot-dip metal baths, electrochemical deposition, thermal spraying, aluminizing, and diffusion-based processes [4,5,6,7,8,9,10,11,12,13,14]. Among these, thermoreactive diffusion stands out as a promising approach for producing robust and adherent coatings on metallic substrates. Hot-dip processes such as aluminizing, galvanizing, and chromizing are widely employed to improve the corrosion and oxidation resistance of steels, relying on the formation of protective surface layers [15,16]. Further enhancements in corrosion resistance can be achieved through alloying with specific metals [17]. However, each coating method has distinct advantages and limitations; some require stringent surface pre-treatments or involve costly, multi-step procedures. Selection criteria for coatings often depend on the intended application—whether for corrosion resistance, wear resistance, or a combination of both.
The tinning process involves depositing a thin layer of tin onto a metal or alloy surface to improve corrosion resistance and solderability. However, pure tin coatings on steel are prone to the formation of tin whiskers, which can compromise coating performance and surface integrity, potentially leading to critical failures [18]. To address this issue, tin-based alloy coatings have been investigated for their enhanced resistance to whisker growth [19]. In this study, a Sn–Bi alloy was selected to coat steel substrates due to its promising anti-whisker characteristics.
Recently, nanoparticles have been incorporated into coating layers to enhance their performance and extend their service life [20,21]. Although the addition of nanoparticles to metallic alloy coatings imparts improved corrosion, wear, and thermal resistance, challenges remain in achieving uniform dispersion within the matrix and reducing production and processing costs. Nevertheless, coating processes that utilize advanced composite materials reinforced with nanoparticles represent a promising strategy for modifying the surface properties of metallic alloys, enabling them to better withstand harsh operating environments and extending their functional lifespan. It was reported that the adhesion strength and corrosion resistance of steel could be improved through coating with CeO2 nanoparticle-reinforced epoxy/polysulfide coatings [22].
The incorporation of nanoparticles into coatings significantly enhances the surface and interfacial properties of metallic alloys compared to traditional coatings. Owing to their unique spatial structure, nanomaterials exhibit distinct optical, thermal, mechanical, and magnetic properties not observed in conventional materials. When added to coating matrices, nanoparticles can improve thermal stability, wear resistance, corrosion resistance, and overall mechanical performance. Even at low concentrations, nanoparticles demonstrate notable effects due to their nano-architecture, superior mechanical properties, and excellent tribological behavior. As a result, metallic nanocomposite coatings (MNCCs) have attracted considerable research attention and are regarded as promising materials for various engineering applications. MNCCs represent a cutting-edge field in materials science, offering a new class of coatings with enhanced corrosion protection for metallic substrates.
In the present study, a fixed constant load of 0.25 wt.% WO3 nanoparticles was added into all S20B alloy coatings. This choice was guided by previous research [23], which demonstrated that the addition of 0.25 wt.% WO3 to Sn–Bi solders resulted in the formation of a uniform, crack-free, and micro-void-free interfacial layer. Furthermore, low WO3 concentrations showed enhanced wettability and improved bonding strength of S20B solders with Cu substrates.
Based on the above background, the present work is designed to develop a novel surface WO3 nanoparticle-reinforced S20B coating for high-performance corrosion-resistant LCS. A direct tinning thermal coating technique for synthesizing composite S20Bi with minor addition of WO3 nanoparticles is optimized.

2. Materials and Methods

2.1. Substrate Preparation

Low-carbon steel (LCS) samples with dimensions of 6 × 45 × 45 mm3 were sectioned from a rod with a square cross-section of 45 × 45 mm2. The chemical composition of the LCS is listed in Table 1. After sectioning, the samples were ground sequentially using emery papers of up to 800 grit to achieve a uniform surface finish.

2.2. Coating Preparation

Two types of coatings were applied: (1) an S20B alloy, and (2) a composite consisting of S20B alloy reinforced with 0.25 wt.% WO3 nanoparticles. For powder fabrication, Sn and Bi powders with a purity of 99.9% were mixed with spherical WO3 nanoparticles. WO3 nanoparticles of a purity of 99.98% and an average particle size of 50 nm were used in the current study. The WO3 nanoparticles were confirmed using SEM and TEM microscopes (Figure 1). The WO3 nanoparticle phase analysis used in the current work was presented in a previous work [23]. The mixture of S20B powder and an amount of 0.25 wt.% WO3 nanoparticles was mechanically mixed for 45 min in a planetary ball-milling machine with a rotating speed of 80 rpm and a ball/powder ratio of 2:1.
The definitions and designations of the bare and coated samples are summarized in Table 2. To prepare the coatings, S20B alloy powders—both with and without WO3 nanoparticles—were mixed with a pre-prepared flux. Flux constituents of 24 g ZnCl2, 6 g NaCl, 3 g NH4Cl, 1 mL HCl, and 1 mL H2O were mixed. Flux was used for surface oxide removal of LCS and for wettability improvement of the coating/steel interface [24,25,26].
The groups of fabricated samples were divided into the following:
Group 0 (Sample #1, uncoated CS samples): Bare low-carbon steel (LCS) substrates.
Group 1 (Sample #2): A total of 1 g of S20B powder and 8 g of flux.
Group 2 (Samples #3–5): A total of 1 g of S20B powder and 6 g of flux.
Group 3 (Samples #6–7): A total of 1 g of S20B powder, 6 g of flux, and 0.25 wt.% WO3 nanoparticles. These parameters were optimized based on prior studies [23,24,25,26].

2.3. Coating Application and Post-Treatment

The flux and S20B alloy (with and without WO3 nanoparticle addition) were spread out on the surface of the LCS substrates in layers of 0.25 g cm−2. Thereafter, the coated CS samples were heated using a hotplate for 3, 4, and 5 min at 370 °C. The coated CS samples were moved away carefully and rinsed off in hot water to remove the remaining flux on the coated surface. All experiments were conducted twice to ensure reproducibility.

2.4. Sample Characterization

For microstructural and SEM analysis, the cross-sectional surfaces of the coated samples were ground using 1000-grit emery paper and etched with a 4% nital solution (HNO3 in ethanol). The microstructures of the Sn–Bi and Sn–Bi–WO3 composite coatings, along with the interfaces between the coatings and the low-carbon steel (LCS) substrate, were examined using optical microscopy. A scanning electron microscope (SEM -FEI Quanta 250 SEM, Eindhoven, The Netherlands) using energy-dispersive X-ray spectroscopy (EDAX-AMETEK, Mahwah, NJ, USA) was used to investigate surface morphology and elemental distribution. Optical micrographs and coating thicknesses were measured at several points in the micrographs using image acquisition and analysis essentials software (Olympus Stream essentials software, version 1.9, Olympus GX51, Tokyo, Japan) and the average thickness was calculated for each sample.

2.5. Corrosion Testing

NaCl salt with a purity of 99.9% (purchased from Merck, Darmstadt, Germany) was used in the current study. A total of 1 L of 3.5% NaCl solution was prepared by dissolving 35 g of NaCl salt in distilled water. The uncoated and coated samples were tested in the 3.5% NaCl solution that simulates the percentage of chloride in seawater. An electrochemical cell with configurations of three electrodes was employed for the cyclic potentiodynamic polarization (CPP) and electrochemical impedance spectroscopy (EIS) measurements. The different uncoated and coated LCS samples were prepared to be used as the working electrodes. The counter and reference electrodes were a platinum sheet and silver/silver chloride (Ag/AgCl), respectively. An Autolab Model PGSTAT302N (Amsterdam, The Netherlands) was used for performing the CPP and EIS experiments. The CPP data were obtained by scanning the potential from the more negative values in the forward direction up to −100 mV and again in the backward direction to react the intersection of the backward potential with the forward one. The scan rate used in both directions was the same (0.1667 mV/s). The EIS plots were collected at a frequency range starting at 100 kHz and ending at 100 mHz. All EIS spectra were determined from the open-circuit potential value after exposing the different LCS electrode samples to the test solutions for 60 min before measurements. Powersine software, which is installed in the Autolab, was employed at a rate of 10 points for every decade variation in the scanned frequency and was run to collect these EIS data. Each run of the CPP and EIS experiments was performed in triplicate using a new part of the solution and a new surface of the tested sample to confirm the reproducibility of all measurements.

3. Results and Discussion

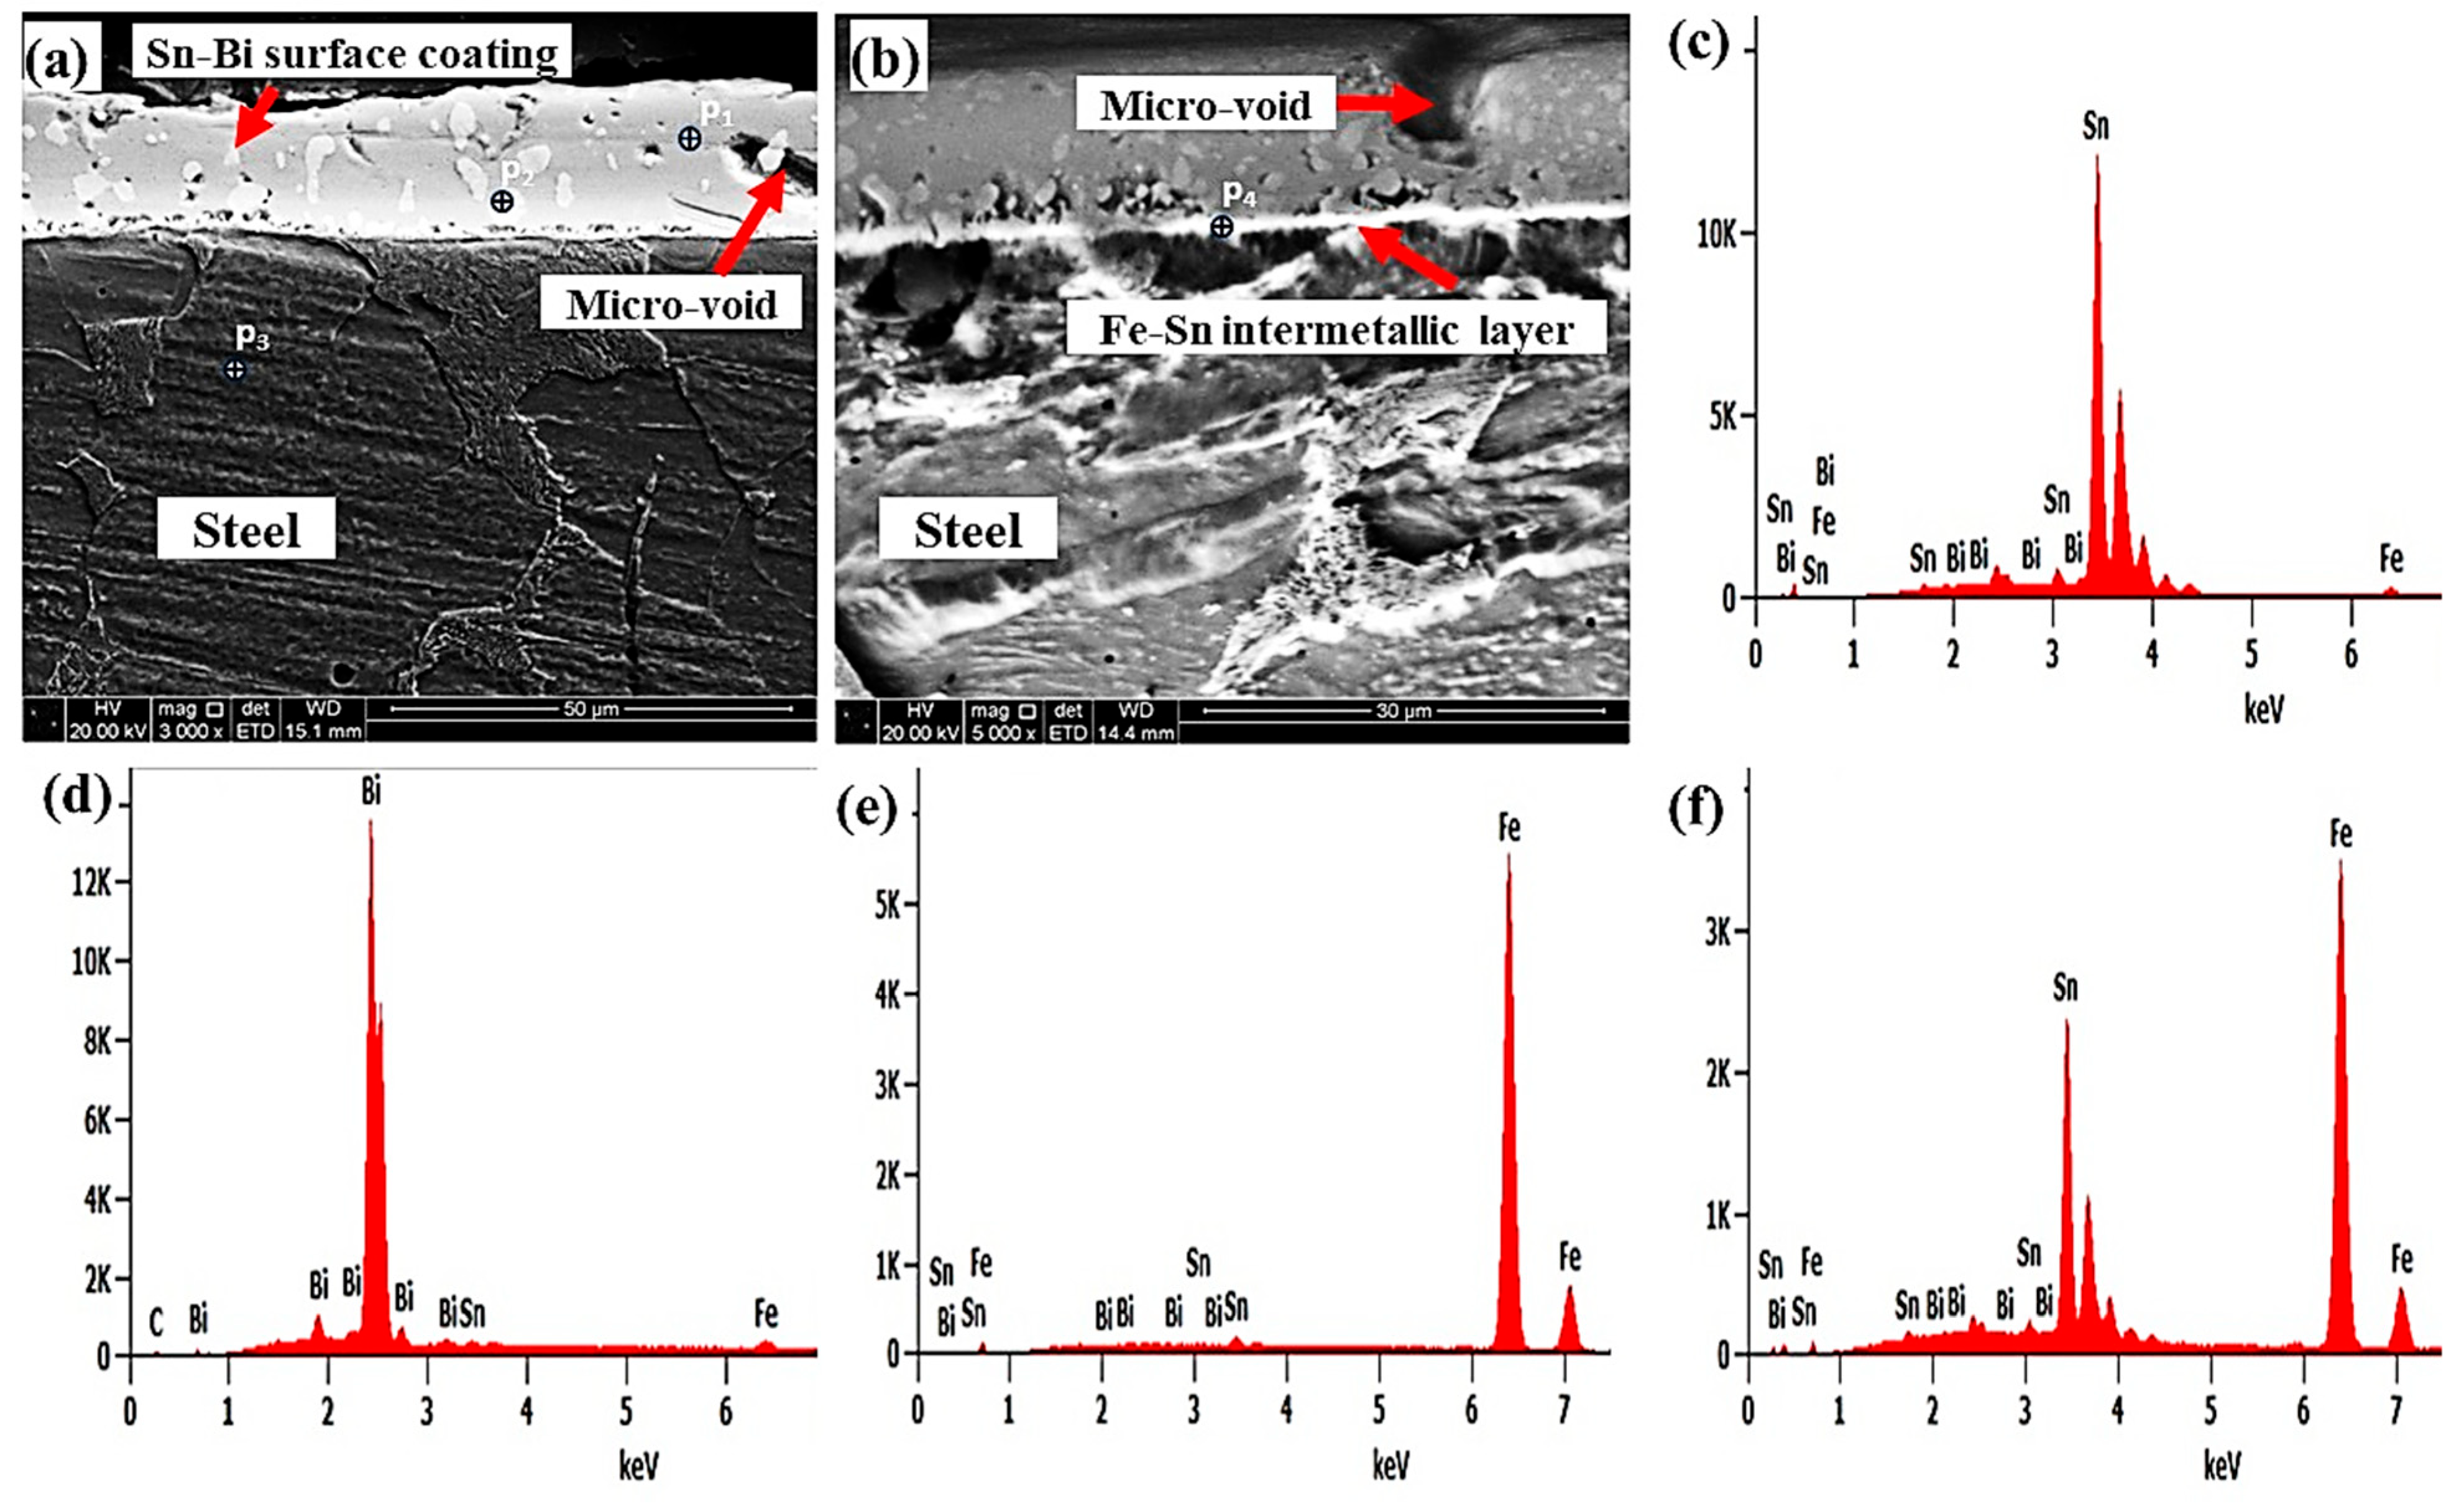
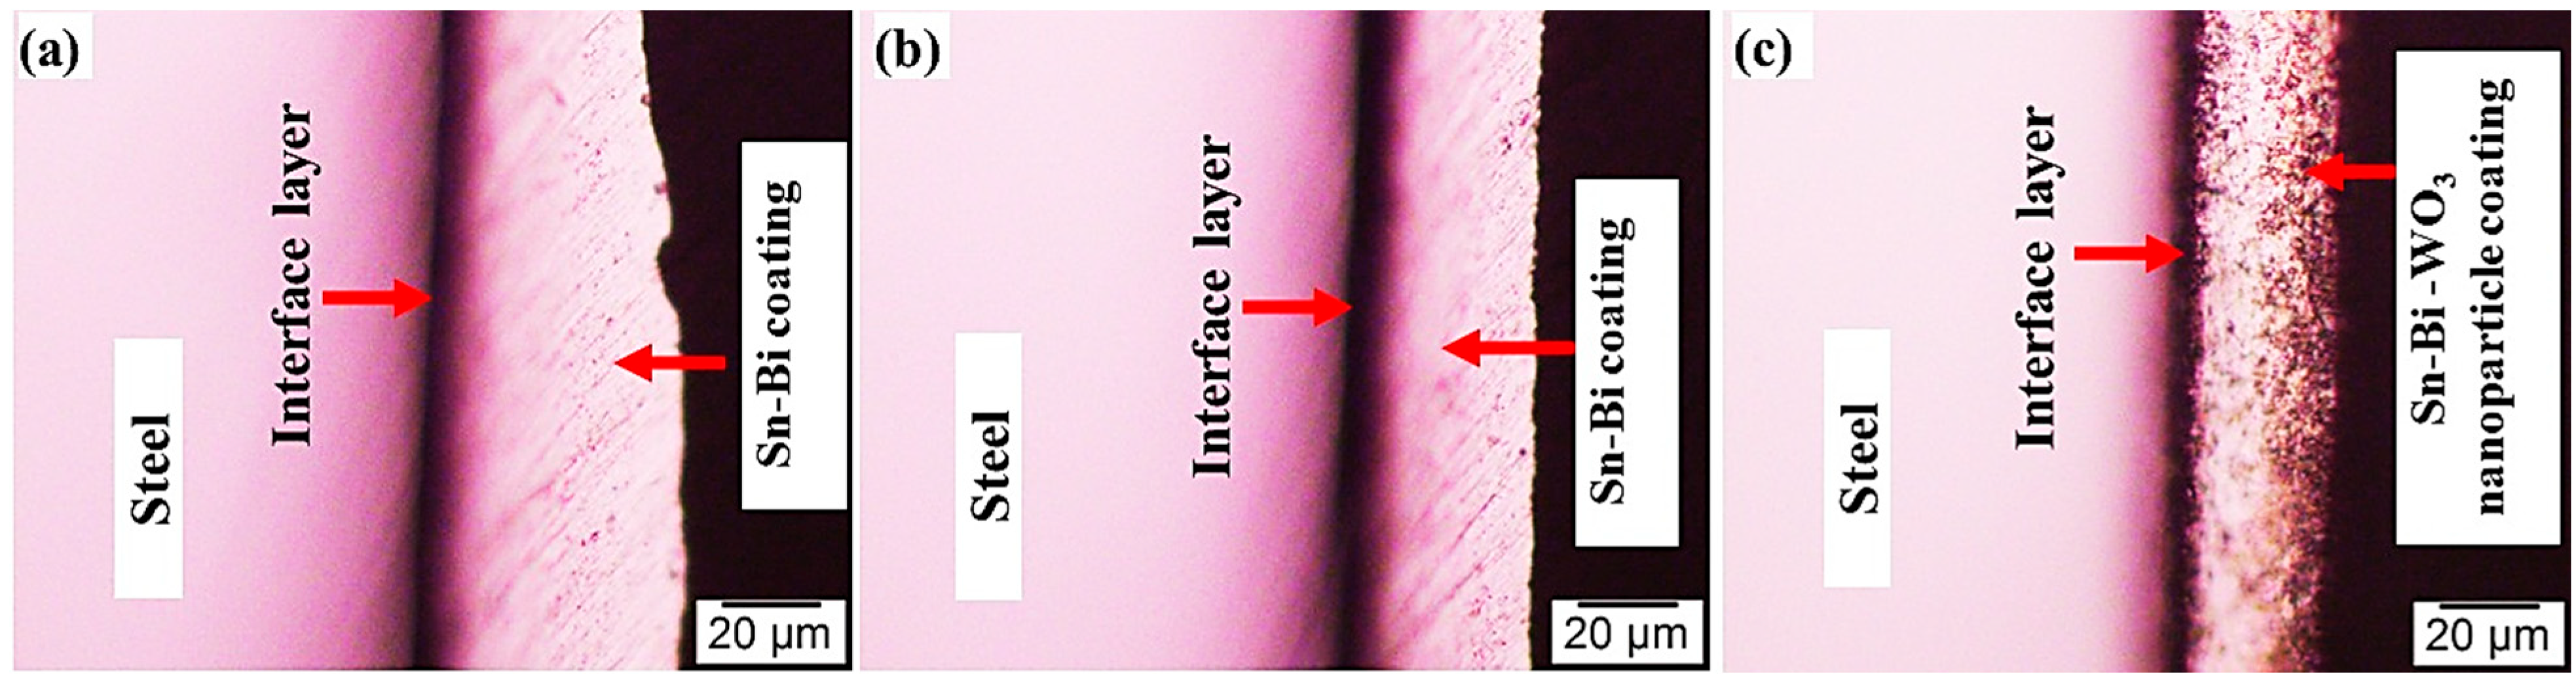
3.1. Microstructures of the Coating Surface and Coating/LCS Interface

Figure 2 shows the SEM microstructure of the S20B solder alloy powder after mechanical mixing, along with corresponding elemental mapping and EDS analysis. The powder exhibits a homogeneous microstructure, consisting of uniformly distributed Sn and Bi particles with regular morphology. Elemental mapping (Figure 2b,c) confirms the effective blending of Sn and Bi, indicating the successful formation of the S20B solder alloy.
Figure 3 displays the optical microscope image microstructure of the low-carbon steel (LCS) substrate. The microstructure reveals the typical ferritic–pearlitic morphology of LCS, characterized by a predominantly ferritic matrix with minor pearlite regions, consistent with its carbon content.
The microstructures of the S20B coating layer and its interface with the LCS substrate, following heating at 370 °C for 3 min with different powder-to-flux (P:F) ratios (1:8 and 1:6), are presented in Figure 4. The results indicate that reducing the flux content (i.e., increasing the powder-to-flux ratio) leads to an increase in coating thickness; specifically, the P:F = 1:6 condition yields a thicker coating than the P:F = 1:8 condition. Despite the increased thickness observed at the lower flux ratio, both conditions result in non-uniform coating morphologies. This non-uniformity suggests that a 3 min heating duration is insufficient to achieve a consistent and well-bonded S20B coating on the LCS substrate. These findings are further supported by the SEM surface morphology analysis shown in Figure 5, which reveals discontinuities and surface irregularities in the coating layers.
Point spectrum analysis was conducted to investigate the elemental composition of the coating surface layers and the intermetallic region. A typical microstructure consisting of bismuth (Bi) phases dispersed within a tin (Sn) matrix was observed and confirmed by point spectra (Figure 5c,d). Additionally, an Fe–Sn intermetallic layer was identified at the interface between the S20B coating and the LCS substrate (Figure 5f). The application of different powder-to-flux (P:F) ratios revealed the presence of micro-voids within the coating layers. These subsurface voids are likely a result of the short heating duration (3 min), which may have hindered adequate interdiffusion and densification during the coating process.
To address the previously observed issues, S20B coatings with a powder-to-flux (P:F) ratio of 1:6 were subjected to extended heating durations of 4 and 5 min (Figure 6a and Figure 6b, respectively). The sample heated for 4 min exhibited improved surface morphology compared to the 3 min sample (Figure 5b), while the sample heated for 5 min demonstrated a fully uniform and continuous coating surface (Figure 6b). Increasing the heating duration from 3 to 5 min resulted in notable enhancements in both coating uniformity and thickness. Furthermore, the average thickness of the Fe–Sn IMC layer of approximately 1.7 ± 0.3 μm increases to approximately 3.3 ± 0.3 μm by increasing the heating duration from 3 to 5 min.
Previous studies [27,28] have reported that molten Sn-based alloys react with Fe to form brittle Fe–Sn IMCs at the interface, which significantly influence the mechanical integrity and reliability of solder joints. Prolonged heating facilitates the growth of a continuous IMC layer, but once a critical thickness is exceeded, the IMC becomes detrimental, leading to embrittlement and reduced service life of the joint. Conversely, insufficient IMC formation due to short heating durations may result in inadequate metallurgical bonding at the interface [29,30,31,32].
The incorporation of 0.25 wt.% WO3 nanoparticles into the S20B coating markedly influenced both the coating morphology and the interfacial microstructure. As illustrated in Figure 6c, the WO3-reinforced S20B coating (heated at 370 °C for 5 min with a P:F ratio of 1:6) demonstrated superior surface uniformity and a thinner Fe–Sn intermetallic layer compared to the unreinforced counterpart.
The addition of WO3 nanoparticles refined the microstructure of the solder matrix by altering the morphology of the Bi phase. SEM images (Figure 7) show that in the unrein-forced coating (Figure 7a), the Bi phase appears as large, interconnected agglomerates. After the incorporation of WO3 nanoparticles (Figure 7b), the Bi phase transitions into smaller, more uniformly distributed particles. This change suggests that the WO3 nanoparticles acted as heterogeneous nucleation sites, improving phase dispersion and microstructure uniformity. The bright regions in the images correspond to the Bi phase, while the matrix primarily consists of Sn and Bi.
The impact of extended heating durations and the incorporation of WO3 nanoparticles into the S20B solder on the Fe−Sn intermetallic compound (IMC) layer is evident in Figure 8. This figure examines the interfacial microstructures of three coated steel samples subjected to heating times of 4 and 5 min, both with and without WO3 nanoparticles, alongside elemental line-scan analysis across the coating–substrate interface.
Figure 8a depicts a thin IMC layer in the S20B coating heated for 4 min, with Figure 8b confirming the presence of Fe-Sn IMC phases formed via Sn-Fe interdiffusion. EDS and line-scan analyses validate the elemental composition gradient at the S20B/steel interface. Figure 8c illustrates a thicker IMC layer in the coating heated for 5 min (see Figure 8d), demonstrating the direct relationship between heating time and IMC growth. Figure 8e highlights the WO3-reinforced S20B composite coating after 5 min of heating, where the Fe-Sn IMC layer remains notably thinner compared to its non-reinforced counterpart (Figure 8d). Figure 8f confirms the presence of Fe-Sn IMC phases but emphasizes their reduced thickness due to WO3 addition.
These findings underscore that while prolonged heating promotes IMC growth, the inclusion of 0.25 wt.% WO3 nanoparticles effectively suppresses excessive thickening, enhancing solder joint reliability by mitigating brittleness associated with thick IMC layers [27,28,29,30,31,32].
Figure 9 illustrates the effect of heating duration and the incorporation of 0.25 wt.% WO3 nanoparticles into the S20B composite coating on the thickness of the Fe–Sn intermetallic compound (IMC) layer. Based on SEM photos and corresponding EDS line-scan analysis, the S20B coating/steel IMC layer thicknesses were measured. The average thickness of five zones of IMC layer measurements for each sample was measured with error limits of ±0.3 mm. In previous studies [33,34,35,36], the introduction of oxide nanoparticles (e.g., Fe2O3, Al2O3, Cr, Si, Zn) or metallic elements could significantly influence the microstructure and thickness of IMC layers formed on mild steel substrates. These additives induce morphological modifications that improve the durability and mechanical integrity of the coating.
Importantly, the addition of small numbers of nanoparticles (≤0.5 wt.%) has been shown to enhance corrosion resistance, extend service life, and reduce coating defects in mild steel systems. For example, incorporating 0.50 wt.% Al2O3 nanoparticles—either individually or in combination with NiO—has demonstrated effectiveness in refining interfacial morphology and suppressing excessive IMC growth, thereby improving the corrosion performance of coated surfaces [20,21].

3.2. Corrosion Measurements

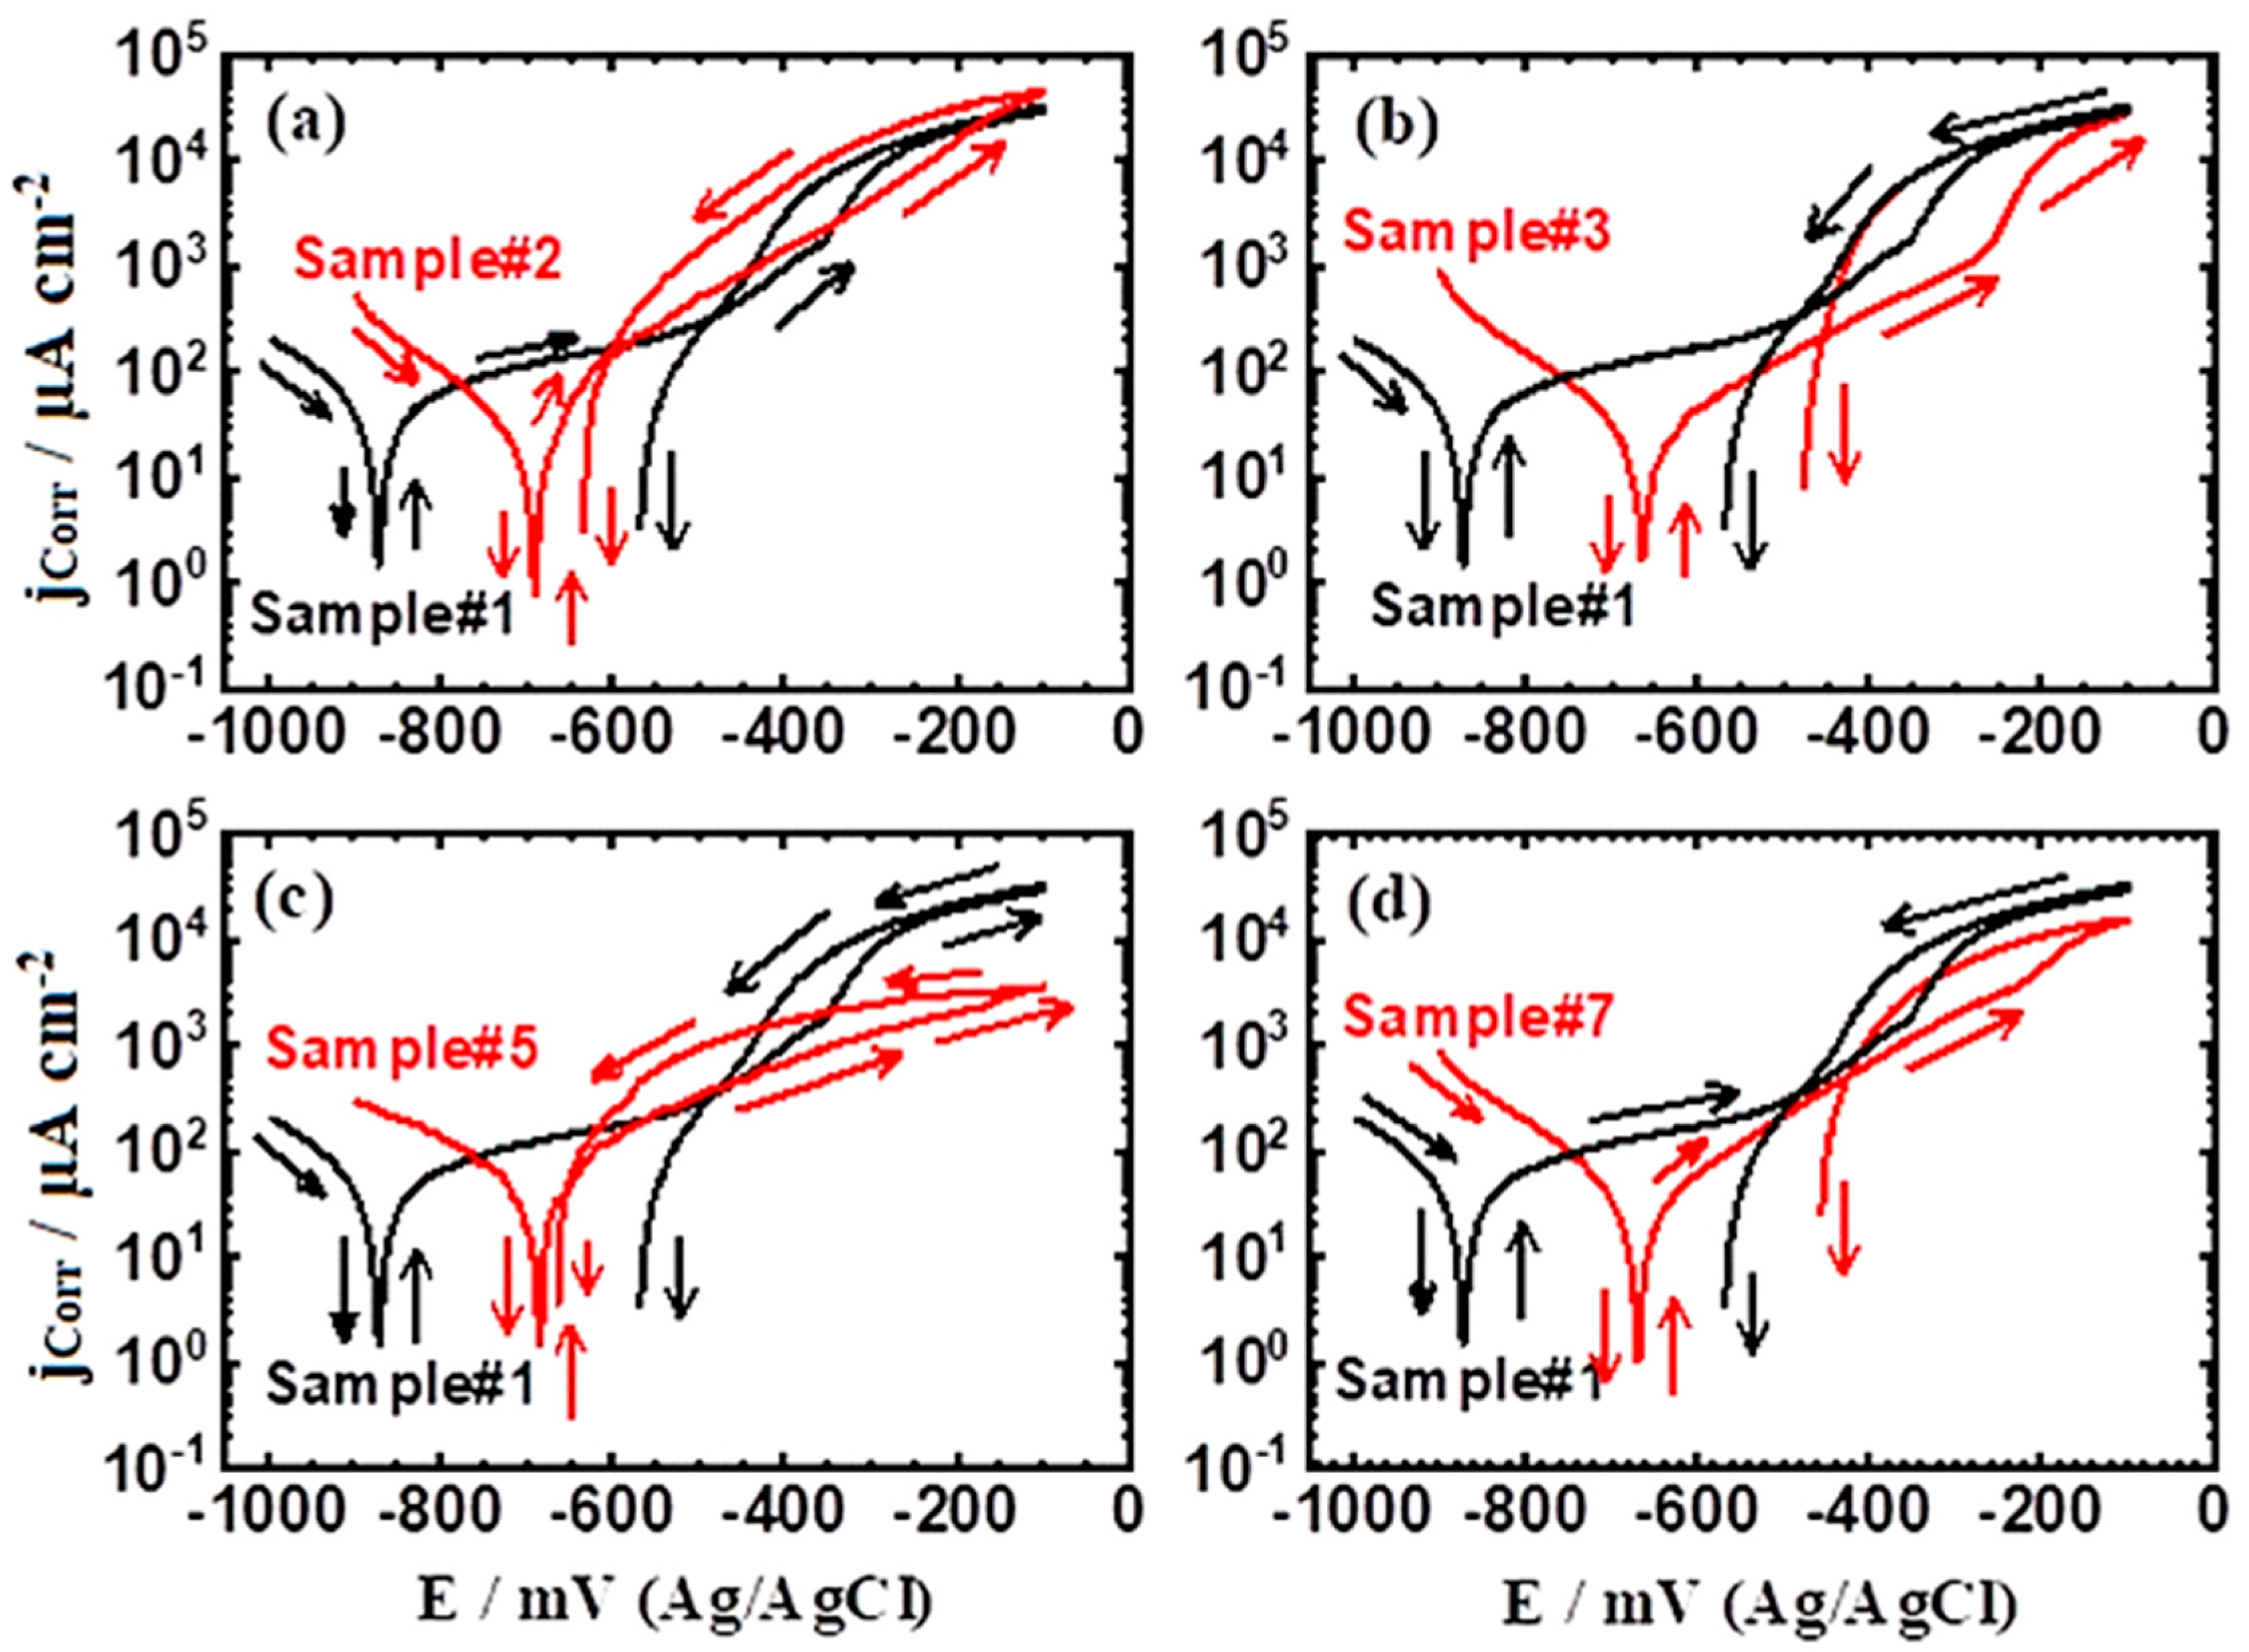
3.2.1. CPP Measurements

The CPP measurements were carried out to understand the effect of the different Sn-Bi, and Sn-Bi-WO3 coatings on the corrosion passivation of the LCS sample in 3.5% NaCl solution. The collected CPP curves for (a) Sample #1 (LCS) and Sample #2, (b) Sample #1 and Sample #3, (c) Sample #1 and Sample #5, and (d) Sample #1 and Sample #7 after their immersion in 3.5% NaCl solution for 60 min before measurements are displayed in Figure 10. To quantify the effect of the coatings on the passivation of LCS corrosion in the chloride solution, the corrosion parameters listed in Table 3 were obtained from the CPP curves depicted in Figure 10. These parameters can be defined as follows: βc is the cathodic Tafel slope, ECorr is the corrosion potential, βa is the anodic Tafel slope, jCorr is the corrosion current density, RP is the polarization resistance, and RCorr is the corrosion rate. The values of βc, ECorr, βa, and jCorr were obtained as reported in previous studies [20,21,37], while the values of both RP and RCorr were calculated as per the following equations, respectively [20,21].
R P = 1 j C o r r β c . β a 2.3 β c + β a
R C o r r = j C o r r k . E W d . A
The elements of the two equations can be defined as follows: k is a constant to define the corrosion rate unit (equals 3272 mm), EW is the equivalent weight (equals 28.25 g equivalent for carbon steel), d is the density (equals 7.85 g cm−3 for carbon steel), and A is the area (equals 1 cm−2 for the surface of the test sample).
The curves in Figure 10 depict that the current decreases for all tested samples when scanning the potential towards the less negative direction. This is due to the reduction that occurs in the oxygen on the surface of the different samples, as follows [20,21,37,38].
2 H 2 O + O 2 + 4 e = 4 O H
The current continues decreasing until it reaches the value of jCorr, which is the minimum obtained current for each run. After reaching the value of jCorr, the current rapidly increases with further scanning of the potential in the forward direction. This increase in the current values results from the dissolution of iron from the surface of the sample according to the following reactions [37,38,39,40]:
Fe = Fe2+ + 2e
At a certain applied potential, the current shows a plateau, where the increase in current slows down, showing a small passive region by the formation of an oxide film on the surface of the sample. This is due to the reaction of the iron present on the surface of the sample with the oxygen from the solution forming iron oxide, as follows [37].
Fe + ½ O2 + H2O = Fe (OH)2
3Fe (OH)2 + ½ O2 = Fe3O4 + 3H2O
Further increasing the scanned potential leads to an abrupt increase in the currents in the anodic branch due to the occurrence of pitting corrosion. The pitting corrosion occurs because of the chloride ions attacking the iron that is present in the tested samples, as per this set of reactions [21,37,38]:
Fe (s) + 2Cl (aq) = FeCl2 (s) + 2e
FeCl2 (s) = FeCl2 (interface) → FeCl2 (aq)
FeCl2 (s) + Cl (aq) = FeCl3 (s) + e
FeCl3 (s) = FeC13 (interface) = FeCl3 (aq)
Reversing the scanned potential from −100 mV towards the more negative values increases the values of the obtained current for all samples, indicating that all samples show pitting corrosion. The addition of S20B (1:8, Sample #2 and 1:6, Sample #3) processed at 3 min heating time is seen to reduce the anodic currents and the obtained currents in the backward direction, resulting in a decrease in the area of the hysteresis loop, which was much bigger for LCS (Sample #1). This effect of S20B coating decreases the values of jCorr and RCorr and increases the value of RP, indicating that the presence of S20B decreases the corrosion of the LCS sample, as also confirmed by the data listed in Table 3. It is worth mentioning that there was no big difference between adding Sn and 20% Bi from 1:8 (Sample #2) and 1:6 (Sample #3), where the passivation of LCS corrosion was improved slightly for Sample #3. Increasing the heating time to 5 min for LCS that is coated with S20B (Sample #5) increased the passivation of the LCS corrosion as compared to the samples that were processed for 3 min heating time. The highest corrosion resistance and lowest corrosion rate and corrosion current were recorded for Sample #7, which was coated with an S20B −0.25% WO3 layer. This is indicated by the curves depicted in Figure 10, which show the lowest anodic current and the smallest hysteresis loop. Further confirmation is also indicated by the lowest values recorded in Table 3 for jCorr and RCorr and the highest value for RP. Moreover, the passivation efficiency (PE%) reached its highest value in Sample #7. The PE% values were calculated using the following equation:
P E % = ( ( R C o r r ) u n c o a t e d ( R C o r r ) c o a t e d ) / ( R C o r r ) u n c o a t e d
where ( R C o r r ) u n c o a t e d and ( R C o r r ) c o a t e d represent the corrosion rates of the uncoated and coated samples, respectively.
According to Popoola et al. and Feng et al. [41,42], WO3 and Y2O3/Al2O3 coatings improve the corrosion resistance by forming a physical barrier to the corrosion process that can fill the flawed areas on the surface of the sample. The CPP results confirmed that coating the LCS sample with S20B and S20B −0.25% WO3 decreases both uniform corrosion and pitting attacks in the test chloride solution.

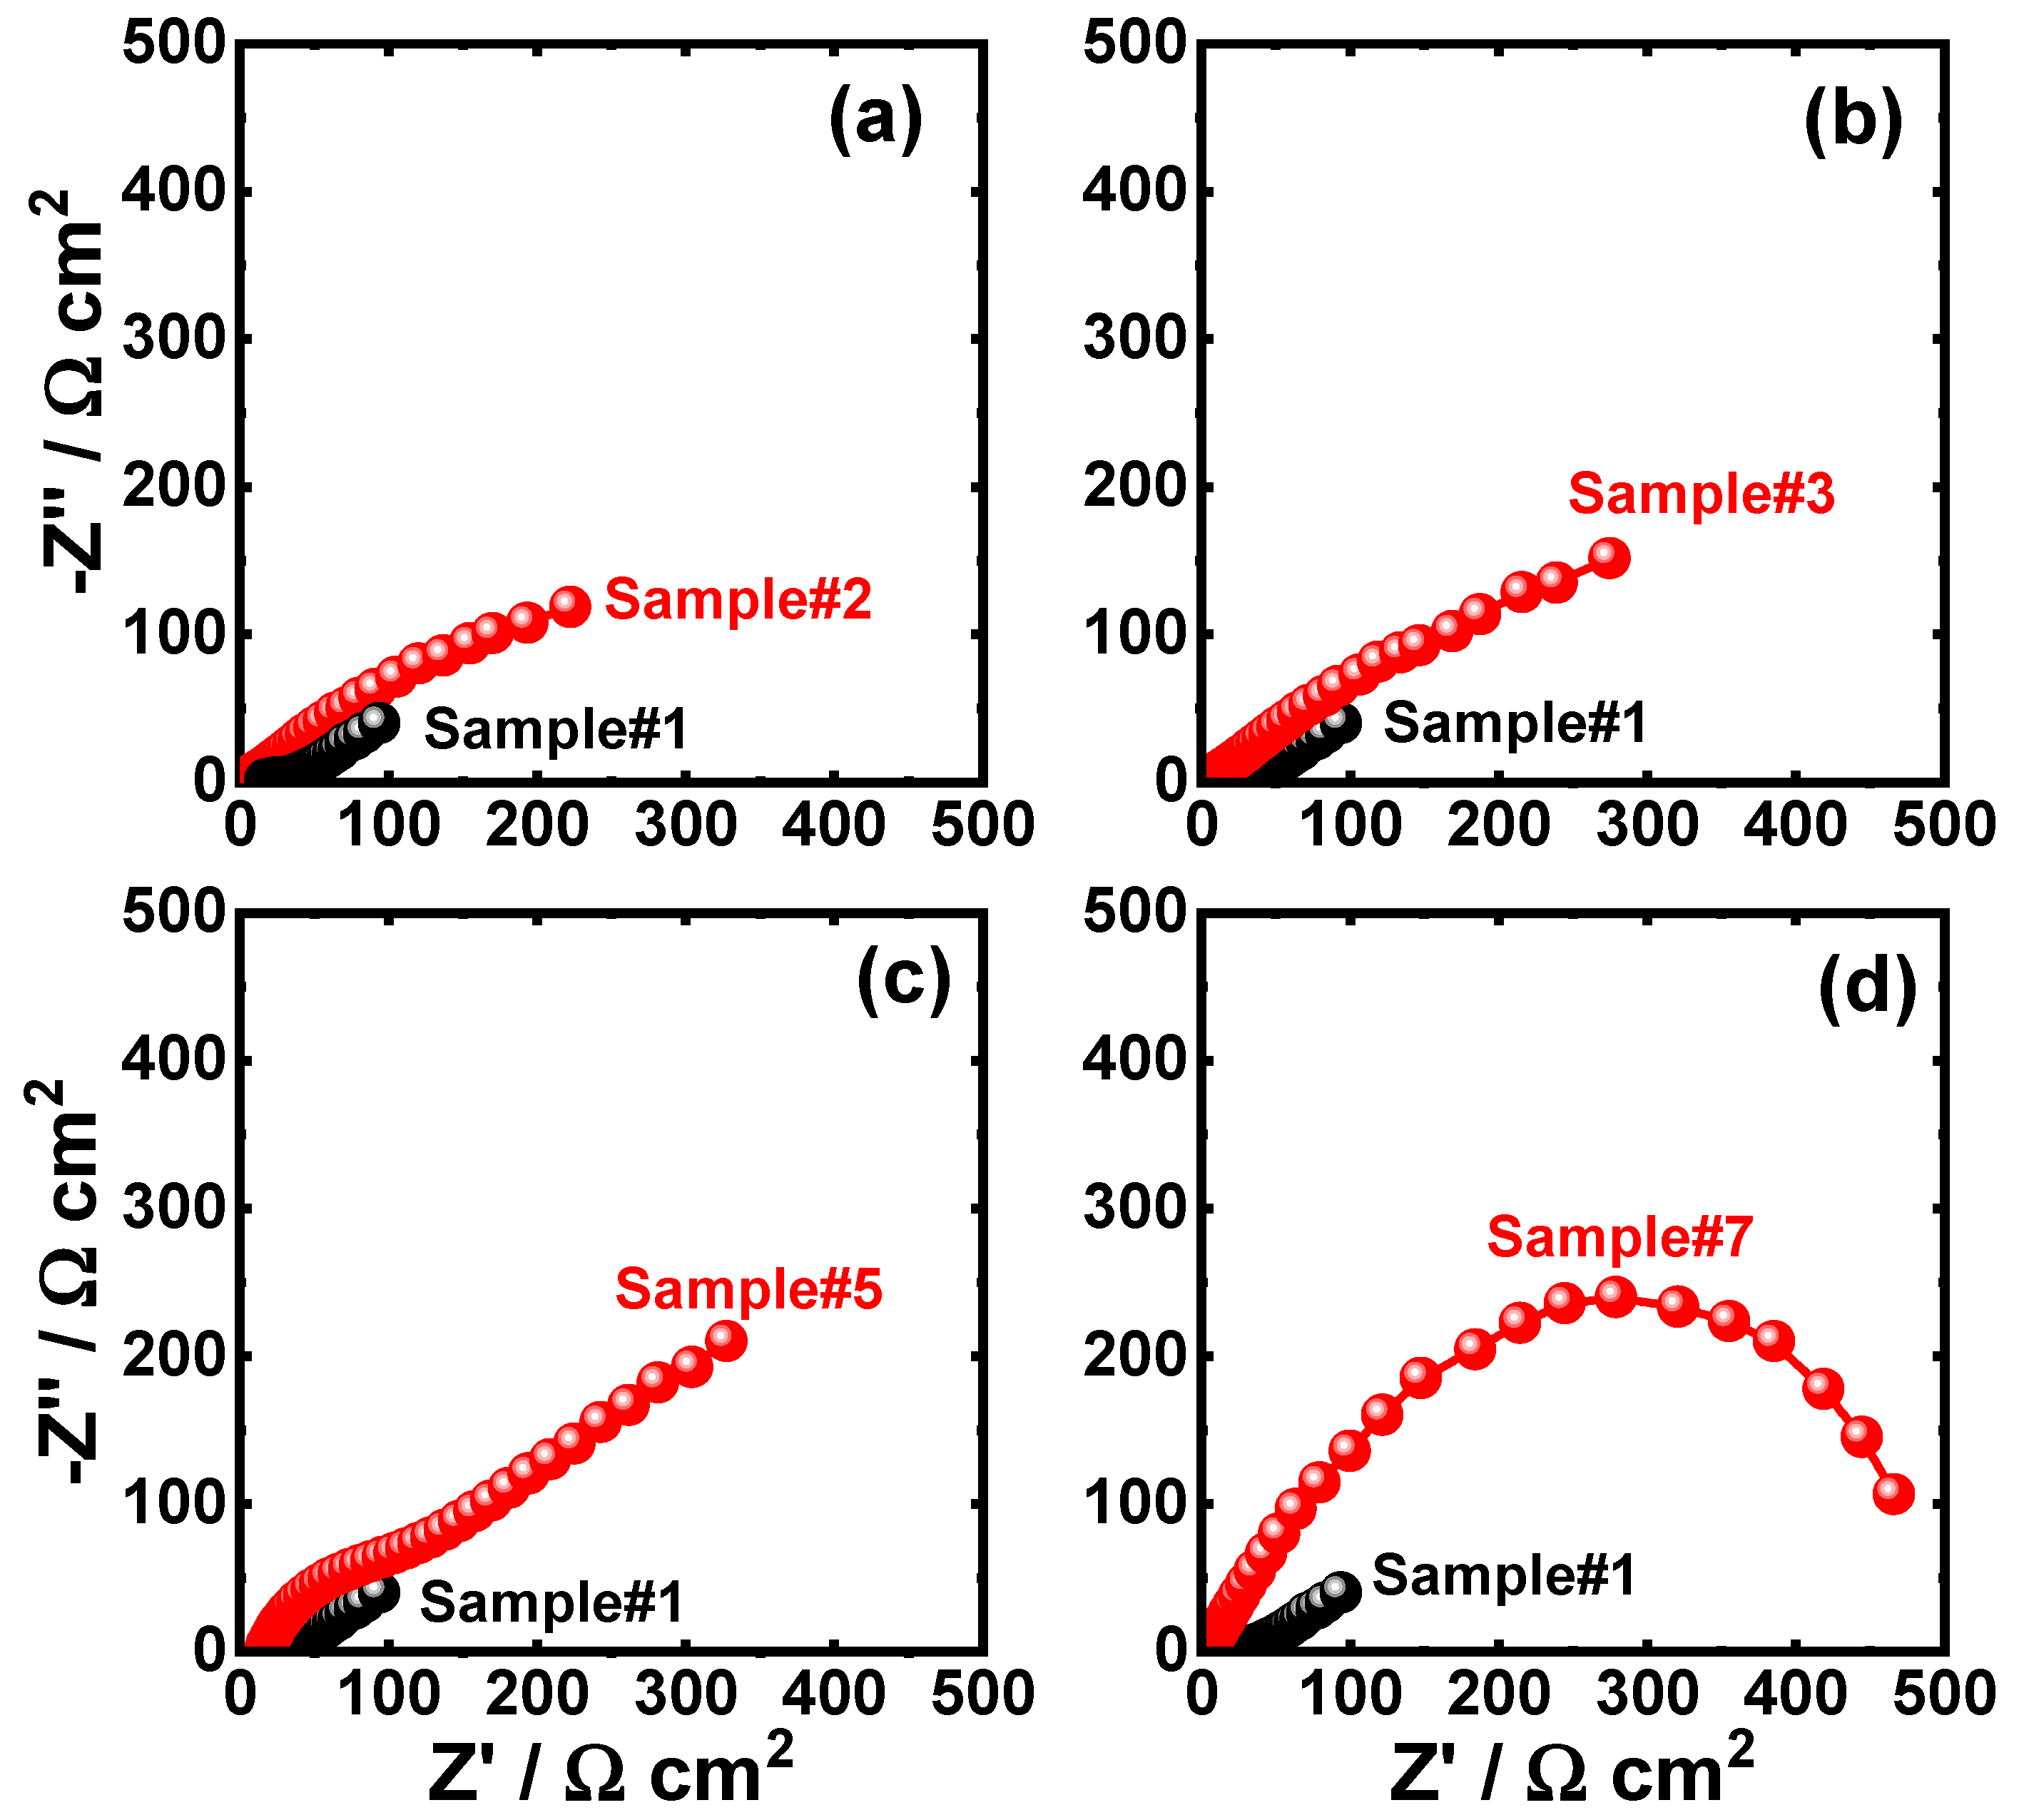
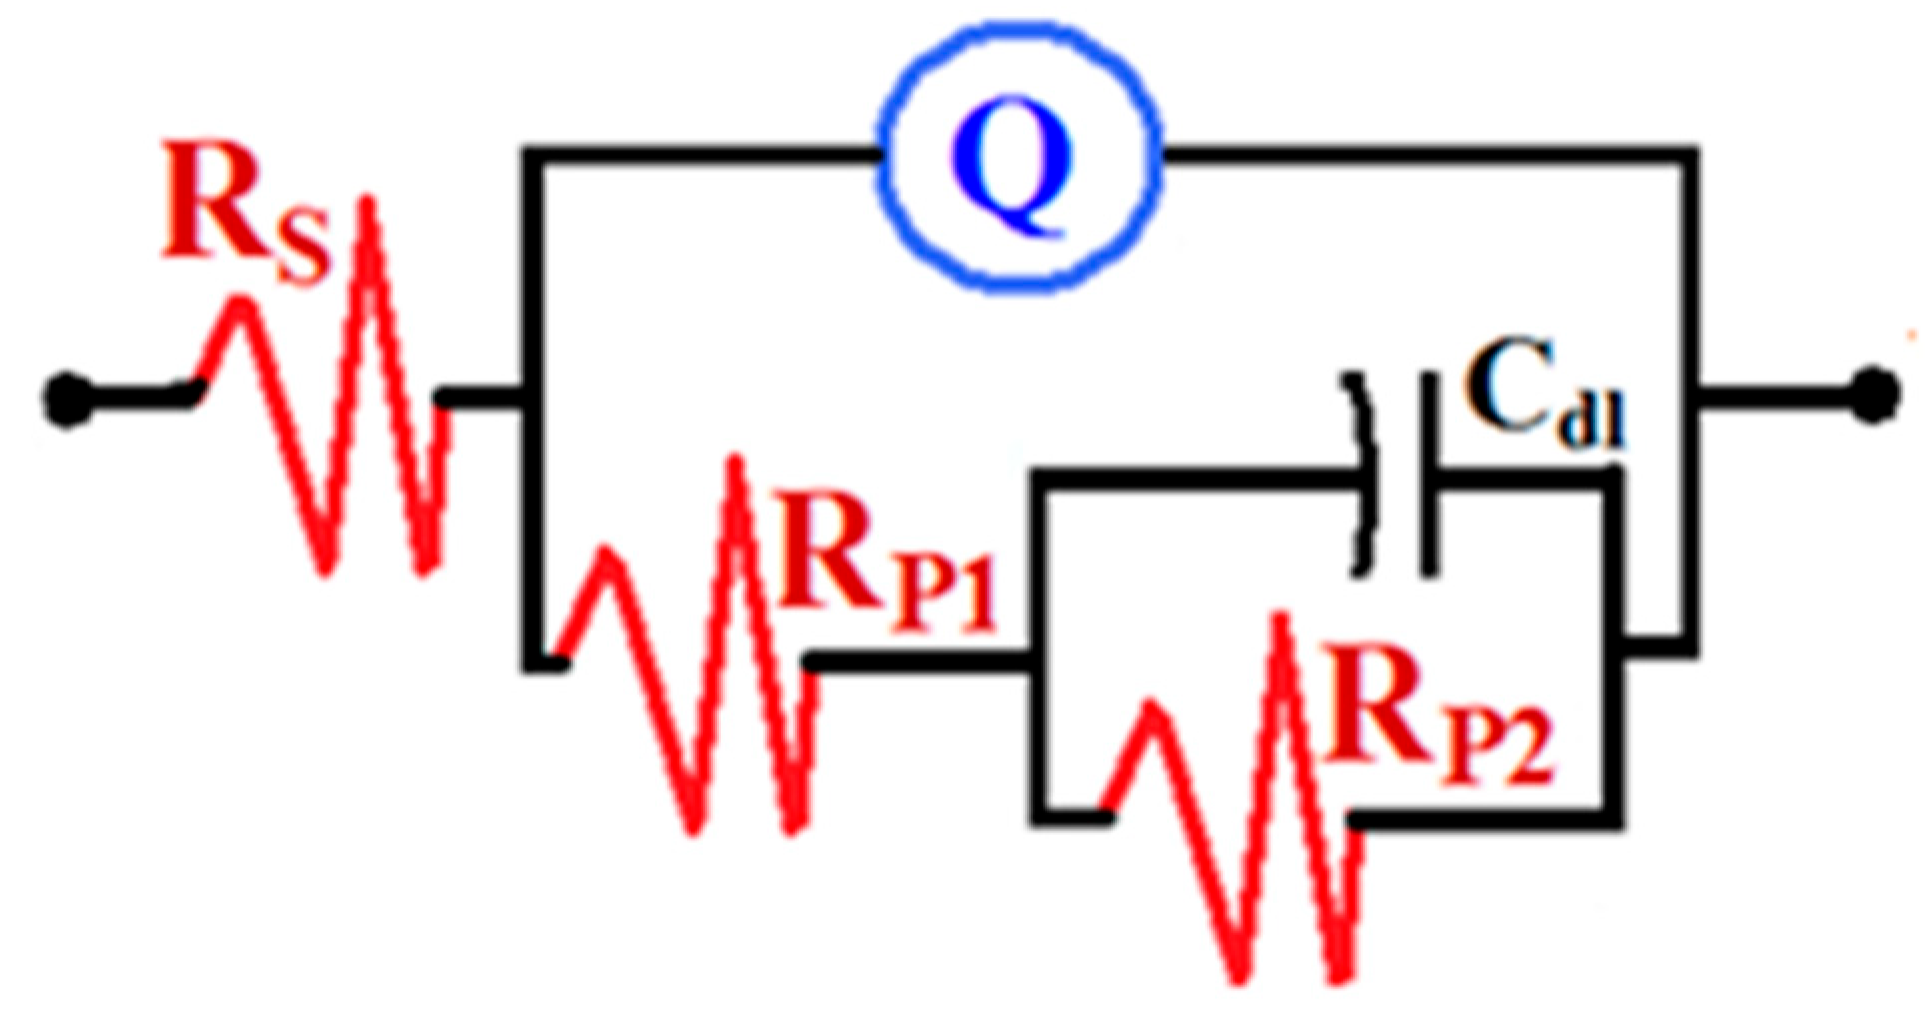
3.2.2. EIS Measurements

The Nyquist plots for (a) Sample #1 (LCS) and Sample #2, (b) Sample #1 and Sample #3, (c) Sample #1 and Sample #5, and (d) Sample #1 and Sample #7 after their immersions in 3.5% NaCl solution for 60 min before measurements are presented in Figure 11. The EIS data obtained for the different samples were best fitted to an equivalent circuit that is displayed in Figure 12. This circuit has a solution resistance (RS), a constant phase element (Q), a polarization resistance (RP1), a double layer capacitance (Cdl), and another polarization resistance (RP2). The impedance parameters of the circuit were collected using ZSimpWin v3.1, and the collected values are listed in Table 4. The Nyquist plots for all samples show one semicircle, whose diameter was the smallest for the uncoated sample (LCS, Figure 12 (spectrum 1)). Coating LCS with S20B (1:8, heated for 3 min, Sample #2) led to increasing the diameter of the semicircle, indicating that the corrosion resistance of LCS increases. Coating LCS with S20B (1:6, heated for 3 min, Sample #3) slightly increased the diameter of the semicircle when compared to Sample #2, meaning that the corrosion resistance of Sample #3 is a slightly higher. Increasing the heating time to 5 min when applying the S20B (1:6) coating (Sample #5) increased the diameter of the obtained semicircle (Figure 11c, spectrum 2), indicating increased corrosion resistance caused by increasing the heating time from 3 min to 5 min. The widest diameter for a semicircle was plotted for the sample that has an S20B −0.25% WO3 (Sample #7 shown in Figure 11d, spectrum 2) coating, revealing that it has the highest corrosion resistance.
The values of RS, RP1, and RP2 recorded in Table 4 for Sample #2 and Sample #3 were almost similar but were higher than those obtained for the uncoated LCS surface. Increasing the heating time to 5 min, as in the case of Sample #5, increases the values of all these resistances. This may be due to the increased compactness of the surface with the application of S20B. The addition of 0.25% WO3 and processing the sample for a 5 min heating time highly increased the resistance to corrosion, as indicated by the highest values of RS, RP1, and RP2 as listed in Table 4. The values of the constant phase elements, CPEs, are given by Q, represented by YQ, and its “n” value equals “1”, indicating the presence of a double layer capacitor within the circuit. The value of YQ is the highest for the pure LCS surface and decreases in the presence of S20B, and the lowest value was recorded for S20B −0.25% WO3. The presence of Cdl and the decrease in its value in the presence of the different coatings confirm that coating the LCS with S20B decreases the corrosion of the LCS, and this effect increases with increasing the heat time from 3 min to 5 min. Furthermore, the presence of 0.25% WO3 within the coating provided the lowest corrosion via increasing the values of the solution and polarization resistances while decreasing the values of Q and Cdl.
There are many different methods of metal coating, but the biggest challenge facing researchers is to find a method that achieves the best protection rate for metal surfaces, and at the same time is inexpensive and suitable for all metal surfaces in all their shapes, types, and sizes. In current research, the direct tinning method was used to fabricate WO3 nanoparticle-reinforced S20B composite solder coating for carbon steel. This process is a low-cost technique that can be applied to all flat horizontal surfaces for the whole surface or for part of the surface in case of maintenance. The nanoparticles that are added to the coated surface alloys can be optimized and controlled easily as desired. This research also presents an easy, simple, and inexpensive method to convert molten alloys, especially tin-based alloys, from the liquid state to the solid state in the form of powder, which is mainly used in the tinning process after mixing it with certain types of flux. To quantify the passivation efficiency (PE%), the total resistance (RPT) was calculated using the relation RPT = RP1 + RP2. The corresponding RPT values are listed in Table 4. The PE% values were then determined using the following equation:
IE% = ((RPT)coated − (RPT)uncoated)/(RPT)coated
where (RPT)uncoated and (RPT)coated are the total resistance values of the uncoated and coated samples, respectively.
From the above results, the mixture of powder S20B alloy and flux should be kept at the percentage (1:6) that results in a considerable coating layer thickness. The heating time at 370 ° C of 5 min is enough to obtain a regular morphology for the S20B coating layer. The addition of 0.25 wt.% WO3 nanoparticles to S20B alloy is crucial in regulating and improving the structure of the surface coating as well as the Fe-Sn IMC interface layer. The growth of Fe–Sn IMCs at the Fe/Sn interface is suppressed due to WO3 nanoparticle addition. Through this research, it has become clear that adding 0.25 wt.% of WO3 nanoparticles to S20B alloy coatings significantly improves corrosion resistance. However, to maximize the benefits of adding nanoparticles and to obtain the ideal morphology for the coating layer and a thin Fe-Sn IMC interface layer as well as a remarkable level of resistance to corrosion, the heating conditions should be kept as 370 °C for 5 min.

4. Conclusions

The influence of S20B coatings reinforced with WO3 nanoparticles on the surface morphology, interface structure, and corrosion behavior of carbon steel (CS) was systematically investigated. S20B–WO3 nanocomposite coatings were successfully fabricated using a direct tinning process, demonstrating enhanced surface quality and protective performance against corrosion.
Reducing the flux content in the powder-to-flux (P:F) mixture from 1:8 to 1:6 resulted in thicker coating layers. Extending the heating time from 3 to 5 min improved coating uniformity and slightly increased the average thickness of the Fe–Sn intermetallic compound (IMC) layer from 1.7 ± 0.3 µm to 3.3 ± 0.3 µm.
Importantly, the incorporation of 0.25 wt.% WO3 nanoparticles led to a thinner Fe–Sn IMC layer compared to unreinforced coatings subjected to the same 5 min heating duration. Furthermore, the WO3-reinforced S20B coatings exhibited significantly improved corrosion resistance.
For optimal corrosion protection and coating uniformity on carbon steel, the use of S20B coatings containing 0.25 wt.% WO3 nanoparticles and processed at 370 °C for 5 min (P:F = 1:6) is strongly recommended.
These results demonstrate the efficacy of nanoparticle-reinforced coatings in balancing IMC layer control and corrosion protection, offering a promising strategy for durable carbon steel surface engineering in aggressive environments.

Author Contributions

N.F.: project administration, conceptualization, methodology, validation, data curation, writing—review and editing. M.R.: conceptualization, methodology, validation, formal analysis, investigation, writing—original draft, writing—review and editing. S.M.A.-S.: investigation, writing—original draft, writing—review and editing. K.M.H.: investigation, data curation, writing—review and editing. E.-S.M.S.: methodology, validation, formal analysis, investigation, writing—original draft. A.H.A.: validation, investigation, writing—review and editing. K.S.A.H.: validation, writing—review and editing. All authors have read and agreed to the published version of the manuscript.

Funding

This research was funded by Scientific Research Deanship at University of Ha’il-Saudi Arabia through project number <<RG-23 185>>.

Data Availability Statement

The original contributions presented in the study are included in the article material, further inquiries can be directed to the corresponding author/s.

Conflicts of Interest

The authors declare no conflicts of interest. The funders had no role in the design of the study; in the collection, analyses, or interpretation of data; in the writing of the manuscript; or in the decision to publish the results.

References

  1. Bozza, F.; Bolelli, G.; Giolli, C.; Giorgetti, A.; Lusvarghi, L.; Sassatelli, P.; Scrivani, A.; Candeli, A.; Thoma, M. Diffusion mechanisms and microstructure development in pack aluminizing of Ni-based alloys. Surf. Coat. Technol. 2014, 239, 147–159. [Google Scholar] [CrossRef]
  2. Chintada, V.B.; Koona, R.; Bahubalendruni, M.V.A.R. State of Art Review on Nickel Based Electroless Coatings and Materials. J. Bio-Tribo-Corros. 2021, 7, 134. [Google Scholar] [CrossRef]
  3. Amaya, A.; Piamba, O.; Olaya, J. Improvement of Corrosion Resistance for Gray Cast Iron in Palm Biodiesel Application Using Thermoreactive Diffusion Niobium Carbide (NbC) Coating. Coatings 2018, 8, 216. [Google Scholar] [CrossRef]
  4. Guan, Z.; Qian, J.; Qin, H.; Hou, J.; Zhou, Y.; Xie, Z.; Yu, F.; Chen, Y.; Wan, G.; Zeng, H. Osteogenerative and corrosion-decelerating teriparatide-mediated strontium–zinc phosphate hybrid coating on biodegradable zinc–copper alloy for orthopaedic applications. Mater. Today Commun. 2024, 39, 109010. [Google Scholar] [CrossRef]
  5. Feng, Z.; Li, Q.; Zhang, J.; Yang, P.; An, M. Studies on the enhanced properties of nanocrystalline Zn–Ni coatings from a new alkaline bath due to electrolyte additives. RSC Adv. 2015, 5, 58199–58210. [Google Scholar] [CrossRef]
  6. Anwar, S.; Zhang, Y.; Khan, F. Electrochemical behaviour and analysis of Zn and Zn–Ni alloy anti-corrosive coatings deposited from citrate baths. RSC Adv. 2018, 8, 28861–28873. [Google Scholar] [CrossRef]
  7. Li, Y.J.; Liang, T.Q.; Ao, R.; Zhao, H.; Chen, X.; Zeng, J. Oxidation resistance of iron-based coatings by supersonic arc spraying at high temperature. Surf. Coat. Technol. 2018, 347, 99–112. [Google Scholar] [CrossRef]
  8. Zhong, C.; Liu, F.; Wu, Y.; Le, J.; Liu, L.; He, M.; Zhu, J.; Hu, W. Protective diffusion coatings on magnesium alloys: A review of recent developments. J. Alloy. Compd. 2012, 520, 11–21. [Google Scholar] [CrossRef]
  9. Yu, L.; Xiao, C.; Jiang, W.; Li, W.; Ni, S.; Song, M. Effects of aluminizing on the microstructure and wear resistance of AISI 321 steel. Surf. Coat. Technol. 2024, 483, 130753. [Google Scholar] [CrossRef]
  10. Tian, H.; Zhou, K.; Zou, Y.C.; Cai, H.; Wang, Y.M.; Ouyang, J.H.; Li, X.W. Microstructure and high temperature oxidation resistance property of packing Al cementation on Ti–Al–Zr alloy. Surf. Coat. Technol. 2019, 374, 1051–1058. [Google Scholar] [CrossRef]
  11. Wei, C.-Y.; Chen, F.-S. Thermoreactive deposition/diffusion coating of chromium carbide by contact-free method. Mater. Chem. Phys. 2005, 91, 192–199. [Google Scholar] [CrossRef]
  12. Biesuz, M.; Sglavo, V.M. Chromium and vanadium carbide and nitride coatings obtained by TRD techniques on UNI 42CrMoS4 (AISI 4140) steel. Surf. Coat. Technol. 2016, 286, 319–326. [Google Scholar] [CrossRef]
  13. Fan, X.S.; Yang, Z.G.; Xia, Z.X.; Zhang, C.; Che, H.Q. The microstructure evolution of VC coatings on AISI H13 and 9Cr18 steel by thermo-reactive deposition process. J. Alloys Compd. 2010, 505, 15–18. [Google Scholar] [CrossRef]
  14. Castillejo, F.E.; Marulanda, D.M.; Olaya, J.J.; Alfonso, J.E. Wear and corrosion resistance of niobium–chromium carbide coatings on AISI D2 produced through TRD. Surf. Coat. Technol. 2014, 254, 104–111. [Google Scholar] [CrossRef]
  15. Ros-Yañez, T.; Houbaert, Y.; Gómez Rodríguez, V. High-silicon steel produced by hot dipping and diffusion annealing. J. Appl. Phys. 2002, 91, 7857–7859. [Google Scholar] [CrossRef]
  16. Sun, J.; Yu, H. Microstructure development and mechanical properties of quenching and partitioning (Q&P) steel and an incorporation of hot-dipping galvanization during Q&P process. Mater. Sci. Eng. A 2013, 586, 100–107. [Google Scholar] [CrossRef]
  17. Lou, D.C.; Akselsen, O.M.; Onsqien, M.I.; Solberg, J.K.; Berget, J. Surface modification of steel and cast iron to improve corrosion resistance in molten aluminium. Surf. Coat. Technol. 2006, 200, 5282–5288. [Google Scholar] [CrossRef]
  18. Galyon, G.T. A History of Tin Whisker Theory: 1946 to 2004. In Proceedings of the SMTAI International Conference 2004, Chicago, IL, USA, 26–28 September 2024. Technical Report from IBM eSG Group to iNEMI. [Google Scholar]
  19. Baated, A.; Hamasaki, K.; Kim, S.S.; Kim, K.S.; Suganuma, K. Whisker Growth Behavior of Sn and Sn Alloy Lead-Free Finishes. J. Electron. Mater. 2011, 40, 2278–2289. [Google Scholar] [CrossRef]
  20. Singh, A.K.; Drunka, R.; Smits, K.; Vanags, M.; Iesalnieks, M.; Joksa, A.A.; Blumbergs, I.; Steins, I. Nanomechanical and Electrochemical Corrosion Testing of Nanocomposite Coating Obtained on AZ31 via Plasma Electrolytic Oxidation Containing TiN and SiC Nanoparticles. Crystals 2023, 13, 508. [Google Scholar] [CrossRef]
  21. Abdel Halim, K.S.; Ramadan, M.; Sherif, E.-S.M.; Hafez, K.M.; Subhani, T.; Fathy, N.; Alghamdi, A.S.; Khedr, M.H. Enhancement of Surface and Interface Properties of Low Carbon Steel by Hybrid ZnO and NiO Nanoparticles Reinforced Tin Coating. Crystals 2022, 12, 332. [Google Scholar] [CrossRef]
  22. Davoodi, F.; Akbari-Kharaji, E.; Danaee, I.; Zaarei, D.; Shishesaz, M. Corrosion Behavior of Epoxy/Polysulfide Coatings Incorporated with Nano-CeO2 Particles on Low Carbon Steel Substrate. Corrosion 2022, 78, 785–798. [Google Scholar] [CrossRef] [PubMed]
  23. Fathy, N.; Hafez, K.M.; Abdulaziz, F.; Abdelraouf, R.E.; Ramadan, M. Development of Hypoeutectic SnBi Alloy Solder Reinforced with WO3 Nanoparticles for Connecting Cu Substrates via Thermal Bonding. Sci. Rep. 2025, 15, 6849. [Google Scholar] [CrossRef] [PubMed]
  24. Ramadan, M.; Khaliq, A.; Hafez, K.M.; Alghamdi, A.S.; Fathy, N.; Harraz, F.A.; Ayadi, B.; Abdel Halim, K.S. Super Bonding Strength of Al2O3 Nanoparticles Reinforced Sn Interlayer Steel/Aluminum Bimetal Casting. Crystals 2022, 12, 324. [Google Scholar] [CrossRef]
  25. Diouf, P.; Jones, A. Investigation of Bond Strength in Centrifugal Lining of Babbitt on Cast Iron. Metall. Mater. Trans. A 2010, 41, 603–609. [Google Scholar] [CrossRef]
  26. Ramadan, M.; Hafez, K.M.; Alghamdi, A.S.; Ayadi, B.; Abdel Halim, K.S. Novel Approach for Using Ductile Iron as Substrate in Bimetallic Materials for Higher Interfacial Bonding Bearings. Int. Met. Cast. 2021, 11, 145. [Google Scholar]
  27. Horvath, B.; Illes, B.; Shinohara, T. Growth of Intermetallics between Sn/Ni/Cu, Sn/Ag/Cu and Sn/Cu Layered Structures. Thin Solid Films 2014, 556, 345–353. [Google Scholar] [CrossRef]
  28. Wang, X.; Li, D.; Li, N.; Wang, R. Growth Behavior of Intermetallic Compounds in Fe/Sn Diffusion Couples. J. Mater. Sci. Mater. Electron. 2019, 30, 12639–12646. [Google Scholar] [CrossRef]
  29. Vaynman, S.; McKeown, S.A. Energy-Based Methodology for the Fatigue Life Prediction of Solder Materials. IEEE Trans. Compon. Hybrids Manuf. Technol. 1993, 16, 317–322. [Google Scholar] [CrossRef]
  30. Tang, Y.; Luo, S.M.; Li, Z.H.; Hou, C.J.; Li, G.Y. Morphological Evolution and Growth Kinetics of Interfacial Cu6Sn5 and Cu3Sn Layers in Low-Ag Sn–0.3Ag–0.7Cu–xMn/Cu Solder Joints During Isothermal Ageing. J. Electron. Mater. 2018, 47, 5913–5929. [Google Scholar] [CrossRef]
  31. Tanaka, Y.; Kajihara, M. Kinetics of Isothermal Reactive Diffusion Between Solid Fe and Liquid Al. J. Mater. Sci. 2010, 45, 5676–5684. [Google Scholar] [CrossRef]
  32. Suzuki, T.; Kajihara, M. Kinetics of Isothermal Reactive Diffusion Between Solid Cu and Liquid Sn. J. Electron. Mater. 2018, 47, 18–26. [Google Scholar] [CrossRef]
  33. Zhao, X.; Wen, Y.; Li, Y.; Liu, Y.; Wang, Y. Effect of Fe2O3 Nanoparticles Size on the Properties of Sn–1.0Ag–0.5Cu Nano-Composite Solders and Joints. J. Alloy. Compd. 2016, 662, 272–282. [Google Scholar] [CrossRef]
  34. Mohammadnejad, M.; Habibolahzadeh, A.; Yousefpour, M. Effect of Nano-Oxide Addition on Corrosion Performance of Hot Dip Zinc Coating. Prot. Met. Phys. Chem. Surf. 2016, 52, 100–103. [Google Scholar] [CrossRef]
  35. Jiang, Z.H.; Han, J.P.; Li, Y. Effect of Tin on Corrosion Resistance and Formability of Tin Bearing Ferritic Stainless Steel. Mater. Res. Innov. 2014, 18, 9–11. [Google Scholar] [CrossRef]
  36. Springer, H.; Kostka, A.; Payton, E.J.; Raabe, D.; Kaysser-Pyzalla, A.; Eggeler, G. On the Formation and Growth of Intermetallic Phases during Interdiffusion between Low Carbon Steel and Aluminum Alloys. Acta Mater. 2011, 59, 1586–1600. [Google Scholar] [CrossRef]
  37. Sherif, E.-S.M.; Erasmus, R.M.; Comins, J.D. In Situ Raman Spectroscopy and Electrochemical Techniques for Studying Corrosion and Corrosion Inhibition of Iron in Sodium Chloride Solutions. Electrochim. Acta 2010, 55, 3657–3663. [Google Scholar] [CrossRef]
  38. Sherif, E.-S.M.; Ahmed, A.H. Alleviation of Iron Corrosion in Chloride Solution by N,N′-bis[2-Methoxynaphthylidene]amino]oxamide as a Corrosion Inhibitor. Crystals 2021, 11, 1516. [Google Scholar] [CrossRef]
  39. Yao, J.L.; Ren, B.; Huang, Z.F.; Cao, P.G.; Gu, R.A.; Tian, Z.-Q. Extending Surface Raman Spectroscopy to Transition Metals for Practical Applications IV. A Study on Corrosion Inhibition of Benzotriazole on Bare Fe Electrodes. Electrochim. Acta 2003, 48, 1263–1271. [Google Scholar] [CrossRef]
  40. Sliem, M.H.; Radwan, A.B.; Mohamed, F.S.; Alnuaimi, N.A.; Abdullah, A.M. An Efficient Green Ionic Liquid for the Corrosion Inhibition of Reinforcement Steel in Neutral and Alkaline Highly Saline Simulated Concrete Pore Solutions. Sci. Rep. 2020, 10, 14565. [Google Scholar] [CrossRef]
  41. Popoola, A.P.I.; Daniyan, A.A.; Umoru, L.E.; Fayomi, O.S.I. Effect of WO3 Nanoparticle Loading on the Microstructural, Mechanical and Corrosion Resistance of Zn Matrix/TiO2–WO3 Nanocomposite Coatings for Marine Application. J. Mar. Sci. Appl. 2017, 16, 8. [Google Scholar] [CrossRef]
  42. Feng, X.; Qiu, F. Study on the Corrosion Resistance and Application of Nano-Y2O3/Al2O3-Modified Anchor Rod Coatings Based on Electrodeposition Method. Electrochem 2025, 6, 14. [Google Scholar] [CrossRef]
Figure 1. (a) SEM and (b) TEM images of the WO3 nanoparticles.
Crystals 15 00551 g001
Figure 2. (a) SEM micrograph of mechanically mixed S20B powder, (b,c) EDS elemental mapping showing the distribution of Sn and Bi, and (d) corresponding EDS spectrum of the S20B powder.
Crystals 15 00551 g002
Figure 3. Optical microscope image of the low-carbon steel substrate microstructure before coating.
Crystals 15 00551 g003
Figure 4. Cross-sectional microstructures of the S20B coating/low-carbon steel (LCS) substrate interface after heating at 370 °C for 3 min: (a) P:F = 1:8 and (b) P:F = 1:6.
Crystals 15 00551 g004
Figure 5. SEM microstructures of the S20B coating/low-carbon steel (LCS) interface after heating at 370 °C for 3 min with varying powder-to-flux (P:F) ratios: (a) P:F = 1:8, (b) P:F = 1:6. Point spectrum analysis of selected regions: (c,d) coating surface layer at points P1 and P2; (e) steel substrate at point P3; and (f) Fe–Sn intermetallic layer at point P4.
Crystals 15 00551 g005
Figure 6. Cross-sectional microstructures of Sn–Bi coating layers heated at 370 °C with a constant powder-to-flux (P:F) ratio of 1:6: (a) after 4 min, (b) after 5 min, and (c) Sn–Bi coating reinforced with 0.25 wt.% WO3 nanoparticles on the steel substrate after 5 min.
Crystals 15 00551 g006
Figure 7. SEM micrographs of S20B coating surfaces on low-carbon steel (LCS) substrates: (a) unmodified S20B coating and (b) S20B coating reinforced with 0.25 wt.% WO3 nanoparticles (P:F = 1:6, 370 °C, 5 min).
Crystals 15 00551 g007
Figure 8. SEM micrographs and corresponding EDS analyses with line-scan results across the S20B coating/steel interface: (a,b) S20B coating after 4 min of heating; (c,d) S20B coating after 5 min of heating; (e,f) WO3-reinforced S20B coating (0.25 wt.%) after 5 min of heating. SEM images are shown in (a,c,e); EDS line-scan profiles are presented in (b,d,f).
Crystals 15 00551 g008
Figure 9. Fe–Sn IMC layer thickness of the of S20B/steel coatings without WO3 addition (Samples #4 and #5) and with 0.25 wt.% WO3 addition (Sample #7).
Crystals 15 00551 g009
Figure 10. CPP curves obtained for (a) Sample #1 (LCS) and Sample #2, (b) Sample #1 and Sample #3, (c) Sample #1 and Sample #5, and (d) Sample #1 and Sample #7 after their immersion in 3.5% NaCl solution for 60 min before measurements.
Crystals 15 00551 g010
Figure 11. Nyquist plots for (a) Sample #1 (LCS) and Sample #2, (b) Sample #1 and Sample #3, (c) Sample #1 and Sample #5, and (d) Sample #1 and Sample #7 after their immersion in 3.5% NaCl solution for 60 min.
Crystals 15 00551 g011
Figure 12. Equivalent circuit model that was used to fit the EIS data.
Crystals 15 00551 g012
Table 1. Chemical composition of LCS substrate, wt.%.
ElementsCSiMnCuCrNiAlFe
Low-carbon steel substrate (LCS)0.180.080.350.030.020.050.05Bal.
Table 2. Definitions of the (S20B)-coated LCS samples, processing conditions, and composition.
Sample NumberCoating Powder/Flux
P:F
Heating Time, minSample Composition
Sample #100Uncoated (LCS)
Sample #21:83LCS + S20B alloy coating
Sample #31:63LCS + S20B alloy coating
Sample #41:64LCS + S20B alloy coating
Sample #51:65LCS + S20B alloy coating
Sample #61:64LCS + S20B + 0.25% WO3
nanoparticle alloy coating
Sample #71:65LCS + S20B + 0.25% WO3
nanoparticle alloy coating
The P:F ratio represents the mass ratio of coating powder to flux.
Table 3. Corrosion parameters obtained from polarization curves for the different samples.
Sampleβc
(mV/dec)
ECorr
(mV)
βa
(mV/dec)
jCorr
(μA/cm2)
EPit
(mV)
EProt
(mV)
RP
(Ω cm2)
RCorr
(mmy−1)
PE
(%)
Sample #1110−62510036−360−4956330.424--
Sample #2105−6959518−540−60012050.21250
Sample #3100−6559017−260−45512110.20053
Sample #580−6909012−540−65515350.14167
Sample #775−6659510−420−22518220.11872
Table 4. Parameters were determined by fitting the EIS data for the various samples.
SampleImpedance Data
RS/
Ω cm2
Q1RP1/
Ω cm2
Q2RP2/
Ω cm2
RPT
Ω cm2
PE
%
YQ1/µF cm−2 n YQ2/F cm−2 n
Sample #19.810.00721.011.10.00160.80682693.1--
Sample #210.980.06951.013.730.003180.71730743.736.8
Sample #311.340.03590.817.570.005980.76785802.5713.6
Sample #513.320.00621.018.980.00120.8914001418.9851.2
Sample #714.290.00551.023.440.00140.7843634386.4484.2
Disclaimer/Publisher’s Note: The statements, opinions and data contained in all publications are solely those of the individual author(s) and contributor(s) and not of MDPI and/or the editor(s). MDPI and/or the editor(s) disclaim responsibility for any injury to people or property resulting from any ideas, methods, instructions or products referred to in the content.

