Article

Preparation of GRCop-42 Cu Alloy by Laser-Directed Energy Deposition: Role of Laser Power on Densification, Microstructure, and Mechanical Properties

Jiangsu Automation Research Institute, Lianyungang 222006, China
*
Author to whom correspondence should be addressed.
Crystals 2025, 15(6), 547; https://doi.org/10.3390/cryst15060547 (registering DOI)
Submission received: 19 May 2025 / Revised: 2 June 2025 / Accepted: 3 June 2025 / Published: 7 June 2025
(This article belongs to the Special Issue Design, Microstructure and Mechanical Properties of Cu-Based Alloys)

Abstract

:
This study addresses critical challenges in manufacturing GRCop-42 Cu alloy (Cu-4Cr-2Nb) components via laser-directed energy deposition (LDED). We systematically establish process–microstructure–property correlation for this alloy, demonstrating that laser power critically governs defect formation and mechanical performance. The alloy exhibited optimal microstructure and properties at a laser power of 2000 W, with a room temperature tensile strength of 319 ± 6.5 MPa and an elongation of 25.42 ± 1.9%. The tensile strength in the high-temperature tensile test at 600 °C was measured at 98 ± 3.1 MPa, with an elongation of 15.83 ± 1.5%. The comprehensive performance reaches the optimal value of the processing window. Through cross-scale characterization techniques, the differences in fracture mechanisms at different temperatures are clarified for the first time: at room temperature, a microporous aggregation-type ductile fracture is observed, with plastic deformation primarily dominated by dislocation slip; in a high-temperature environment, due to the weakening of grain boundary strength, the fracture mode shifts to intergranular fracture, and the deformation mechanism evolves into a synergistic effect of dislocation slip and twinning. The findings of this study not only provide valuable insights into optimizing the LDED process parameters for the GRCop-42 alloy but also shed light on the relationship between its microstructure and mechanical properties under different temperature conditions, offering a solid foundation for the further application of this alloy in complex aerospace components.

1. Introduction

Laser-directed energy deposition (LDED) is a significant branch of metal additive manufacturing (AM) that utilizes a high-energy laser beam to simultaneously melt metal powder or wire feedstock, enabling the layer-by-layer construction of complex structures [1,2,3]. Compared to other additive manufacturing techniques, such as Laser Powder Bed Fusion (LPBF), LDED offers considerably higher deposition rates (up to the kilogram-per-hour level) and the capability to produce larger components [4,5,6]. Currently, due to its high efficiency, flexibility, and potential for large-scale manufacturing, LDED has emerged as a critical technology in the aerospace and high-end equipment manufacturing sectors. With its extensive application prospects, LDED is anticipated to drive transformative changes in the manufacturing industry [7].
GRCop-42 (Cu-4Cr-2Nb at%) is a high-strength, high-thermal-conductivity copper alloy developed by NASA in the 1980s [8]. It is primarily utilized in the combustion devices of liquid rocket engines, such as combustion chambers and nozzles, to achieve efficient cooling [9,10,11]. However, the high alloying characteristics of GRCop-42 make it susceptible to element segregation during traditional casting and forging processes, adversely affecting its high-temperature service performance [12]. Additionally, the complex post-welding processes result in a low finished-product yield for components. LDED technology presents a novel solution, as it can directly produce complex-structured components, integrating manufacturing and welding without the need for post-welding treatment [13]. Nonetheless, copper exhibits varying levels of reflectivity for different laser wavelengths, reflecting only 34% of the laser at a wavelength of 450 nm and 96% of the laser at wavelengths between 900 and 1100 nm, which leads to poor fusion [14]. This results in low strength and high porosity in components fabricated using LDED. Therefore, there is an urgent need to optimize the LDED process for GRCop-42 to produce high-performance, high-thermal-conductivity components.
In recent studies, Scott Landes et al. successfully fabricated highly dense GRCop-42 alloy using LDED, achieving a tensile strength of 300 MPa at room temperature [15]. Nonetheless, their research is confined to mechanical properties and deformation mechanisms under ambient service conditions, with a critical need for exploring elevated-temperature performance. Gabriel Demeneghi et al. investigated the characteristics and dimensional effects of GRCop-42 copper alloy fabricated via LDED [9]. The results indicate that surface morphology, porosity, microstructure, and hardness are independent of wall thickness [9]. However, a comprehensive correlation of the ‘process–structure–performance’ relationship has not been established with respect to microstructure and mechanical properties. Anoop R Kini et al. prepared a Cu-3.4Cr-0.6Nb (at%) alloy in situ by LDED with a Vickers hardness of 146 at room temperature and a conductivity of 68% IACS [16]. This in situ synthesis technology breaks through the limitations of traditional copper-poor alloys that rely on heat treatment, but its high-temperature application potential, large-scale manufacturing processes, and multi-component alloy design still require further exploration.
Although existing studies have successfully fabricated GRCop-series alloys using LDED technology, systematic and in-depth investigations into the regulatory mechanisms of core process parameters—particularly the influence of laser power on the density of these alloys—remain lacking [10,17]. As a critical parameter determining the forming quality in LDED, laser power directly affects melt pool metallurgical behavior and solidification microstructure evolution through energy input patterns. However, current research lacks quantitative analysis of the intrinsic correlation between this parameter and alloy density. Moreover, despite the fact that GRCop alloys are primarily applied in high-temperature service environments, existing studies predominantly focus on performance characterization at room temperature, with only preliminary exploration of their high-temperature deformation behaviors and mechanisms [9,10,18,19,20,21,22].
Therefore, this study establishes the relationship between “process–structure–performance” by taking laser power as a key variable and analyzes the impact of laser power on the LDED forming quality of GRCop-42 alloy, including density, microstructure, and defect distribution. In response to the requirements for the alloy’s use in high-temperature environments, we provide corresponding supplements to the research gap regarding the high-temperature deformation mechanisms of this alloy. The findings not only provide a theoretical basis for optimizing LDED process parameters for GRCop alloys but also lay a foundation for revealing the physical essence of their high-temperature service behaviors, thereby offering important theoretical references for the engineering applications of such alloys and subsequent in-depth research.

2. Materials and Methods
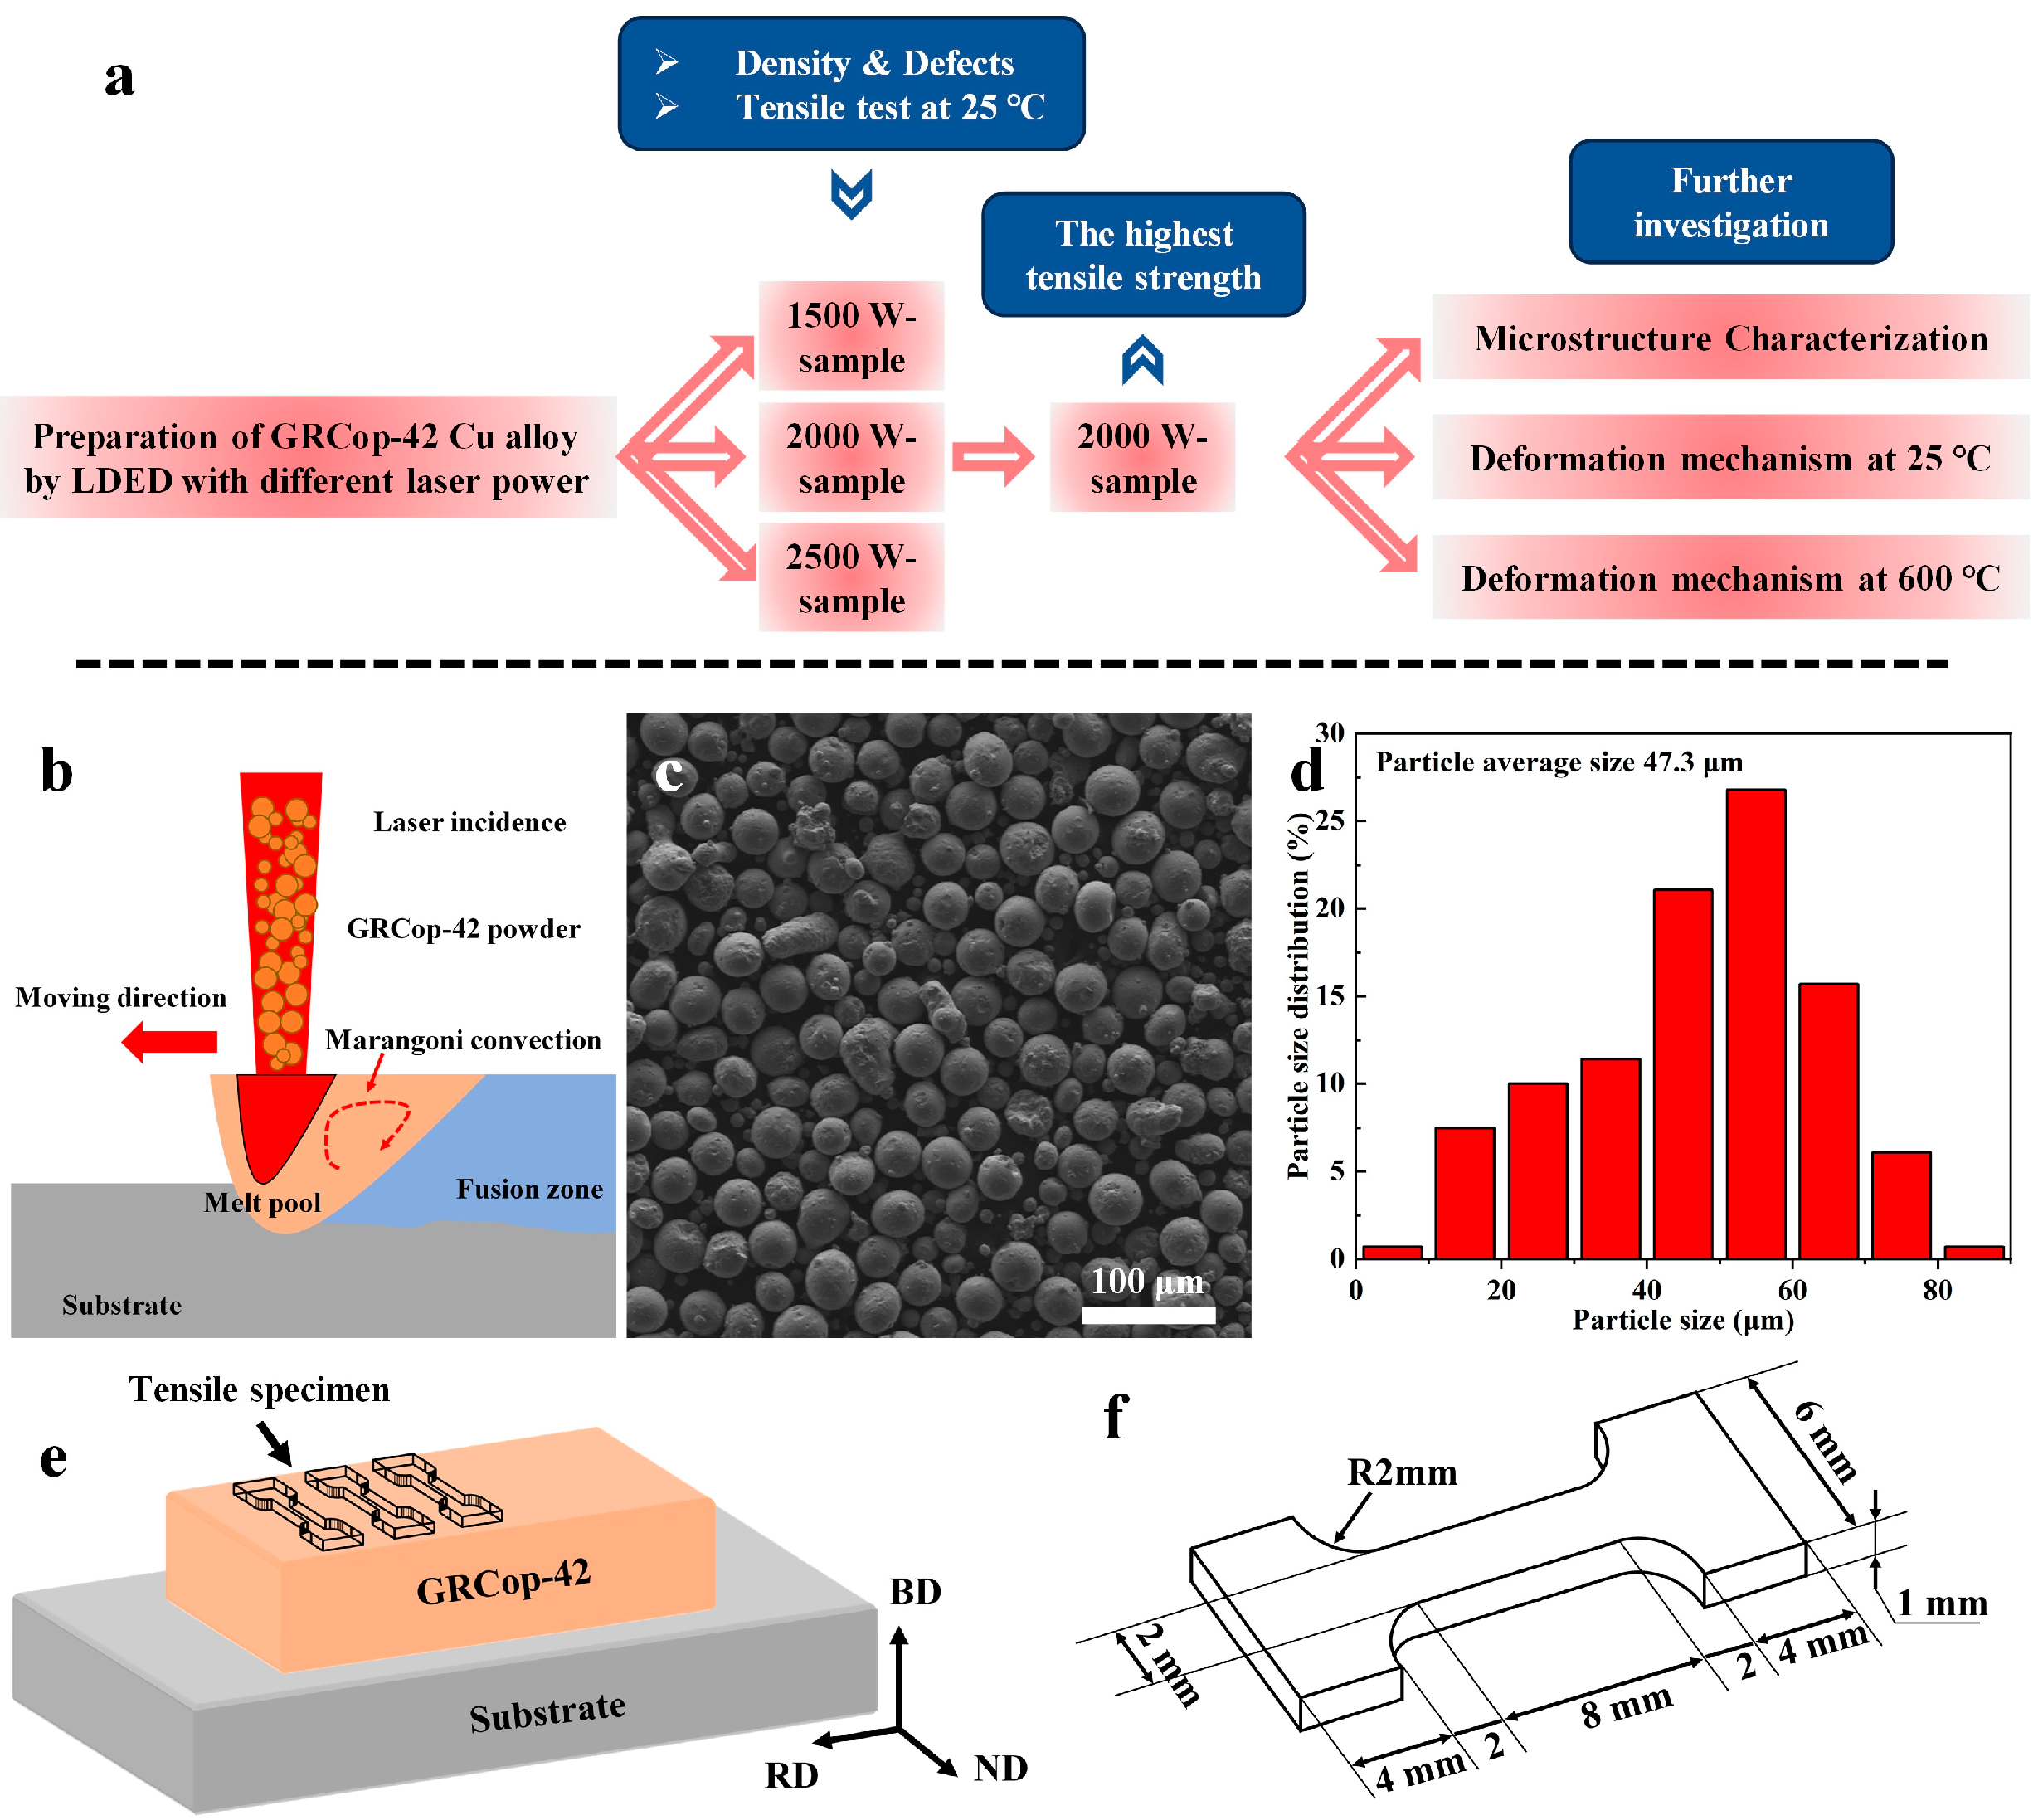
2.1. Materials

Feedstock powder of GRCop-42 was sourced from Shaanxi Sirui Fufeng Advanced Copper Alloys Co., Ltd. (Xi’an, China). The chemical compositional information of GRCop-42 powder was determined using an inductively coupled plasma optical emission spectrometer (ICP-OES, iCAP 7000 Series, Thermo Fisher Scientific, Tianjin, China) in Table 1 [23]. The powder, shown in Figure 1c, exhibited a high degree of sphericity with minimal agglomerates. The particle size distribution of the powder in Figure 1c was analyzed, with a sample size of approximately 300. The results are shown in Figure 1d. Analysis of Figure 1d indicates that the spherical powder exhibits a roughly normal distribution with an average particle size of 47.3 μm. A 304 stainless steel substrate with dimensions of 100 mm × 100 mm × 20 mm was used as the base material.

2.2. Experimental Procedure

Figure 1a illustrates the main experimental process and a simple plan of this study. Under the condition of keeping other variables constant, three samples were printed by controlling the laser power as variables of 1500 W, 2000 W, and 2500 W, respectively. Among these, the sample that exhibited the best performance in terms of defects and room temperature tensile properties underwent a high-temperature tensile test at 600 °C, and the deformation mechanisms at room and high temperatures were analyzed. Figure 1b presents the dynamic formation of the melt pool during additive manufacturing. LDED cladding experiments were conducted using a self-built LDED setup. During the cladding process, the powder and laser were coaxially delivered under high-purity argon gas protection, ensuring precise deposition and melting on the substrate surface to form the GRCop-42 alloy. The scanning rotations between adjacent layers of 90° were applied. Based on our previous work [24], we provide the relevant process parameters for the deposition equipment in Table 2. Three groups of LDED cladding experiments were conducted with power as the sole variable, while maintaining consistent ambient conditions. To emphasize, due to the high reflectivity of Cu alloys to infrared lasers, the laser head was intentionally tilted 10–15° off the vertical during cladding to protect the laser emitter.

2.3. Experimental Characterization

Microstructural characterization was carried out using optical microscopy (OM, GX51, Olympus Corporation, Tianjin, China). A scanning electron microscope (SEM, S-4800 Hitachi High-Technologies Corporation, Tianjin, China) with an energy-dispersive X-ray spectroscopy (EDS, Oxford Instruments plc, Tianjin, China) detector was used to analyze the morphology of the GRCop-42 powders and alloy at 15 kV. Inverse pole figure (IPF) maps were obtained using a ZEISS Sigma 300 microscope (Carl Zeiss AG, Tianjin, China) equipped with an electron backscattered diffraction (EBSD, Bruker Corporation, Billerica, Tianjin, China) system at 20 kV. Transmission electron microscopy (TEM) was performed on a JEOL JEM-F200 microscope (JEOL Ltd., Tianjin, China) operated at 200 kV. Samples were prepared by cutting, grinding, mechanical polishing, and chemical etching with a solution of 5 g FeCl3 + 15 mL HCl + 100 mL H2O for 15–20 s. EBSD samples were mechanically polished to 2.5 μm and subjected to broad-beam Ar ion milling. Tensile samples of GRCop-42 had a gauge length of 8 mm and a thickness of 1 mm. Figure 1e clearly shows the morphology of the samples after additive manufacturing. All tensile samples mentioned are strictly taken perpendicular to the build direction (BD) to ensure the accuracy and scientific nature of the sample characterization tensile tests were performed on an MTS-SANS CMT5105 universal testing machine equipped with a video extensometer, at a strain rate of 1 × 10⁻³ s−1, both at room temperature and high temperatures. Compositions were determined by inductively coupled plasma optical emission spectroscopy (ICP-OES, iCAP 7000 Series, Thermo Fisher Scientific, Tianjin, China).

3. Result

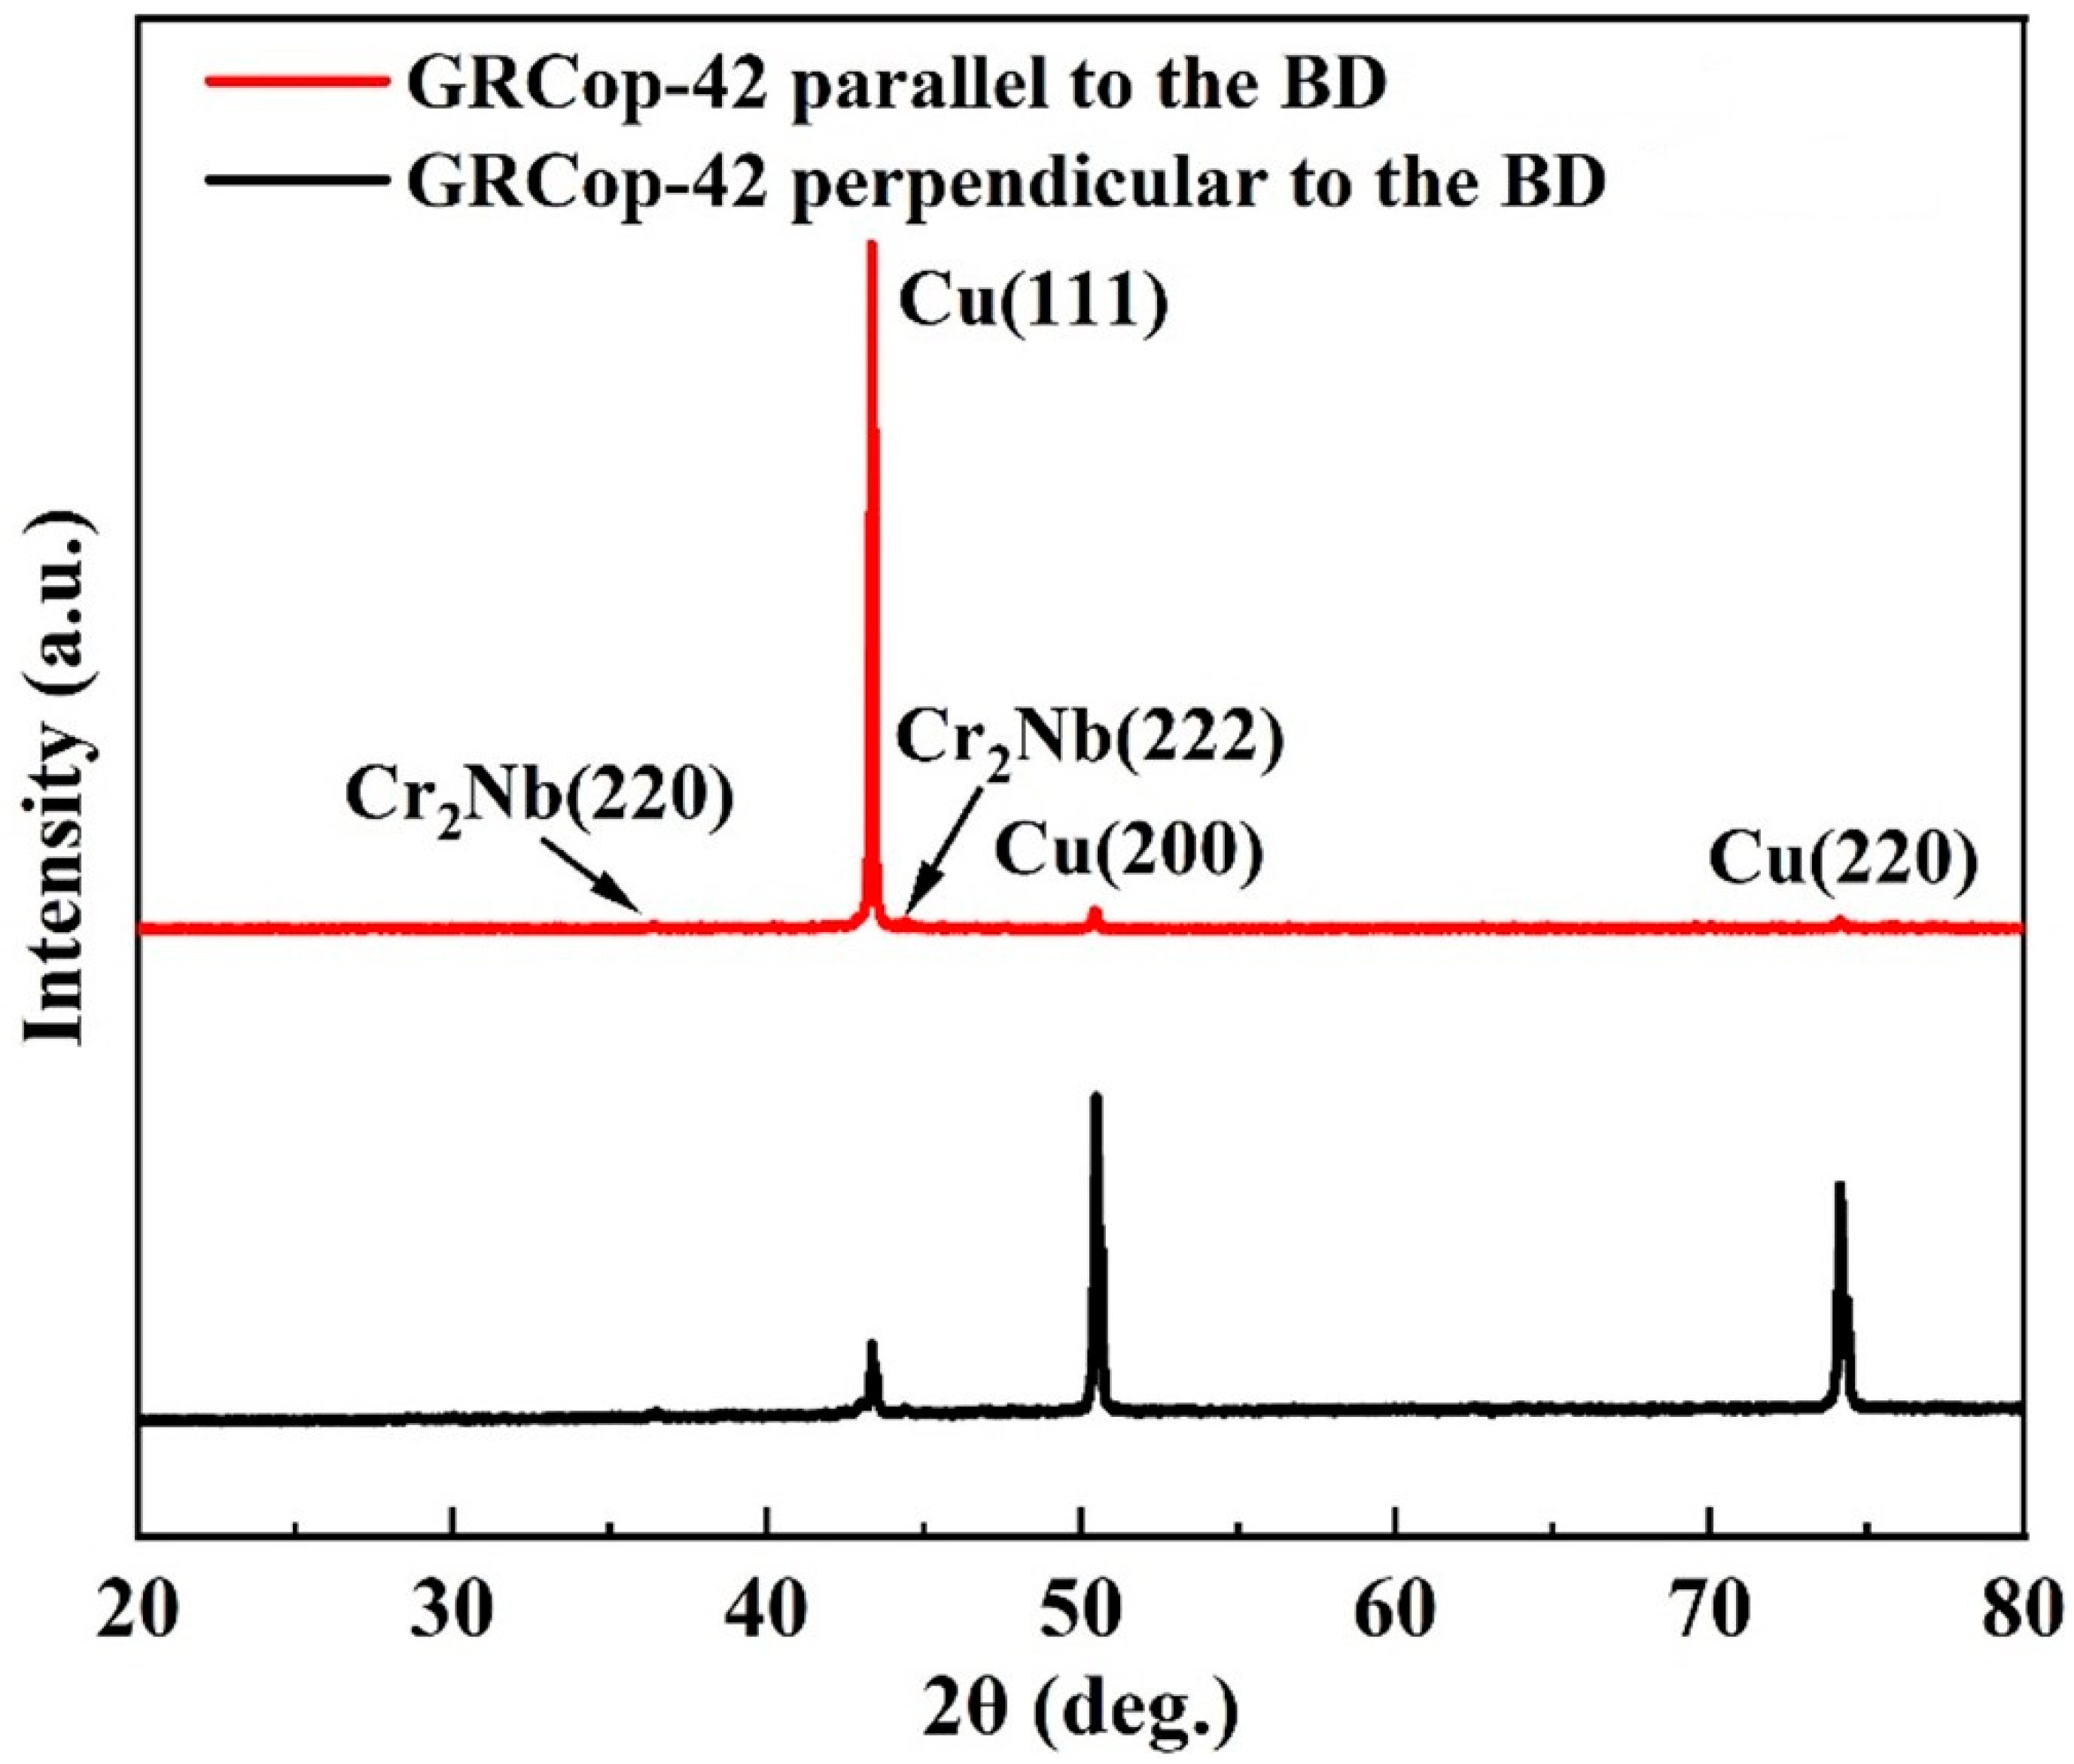
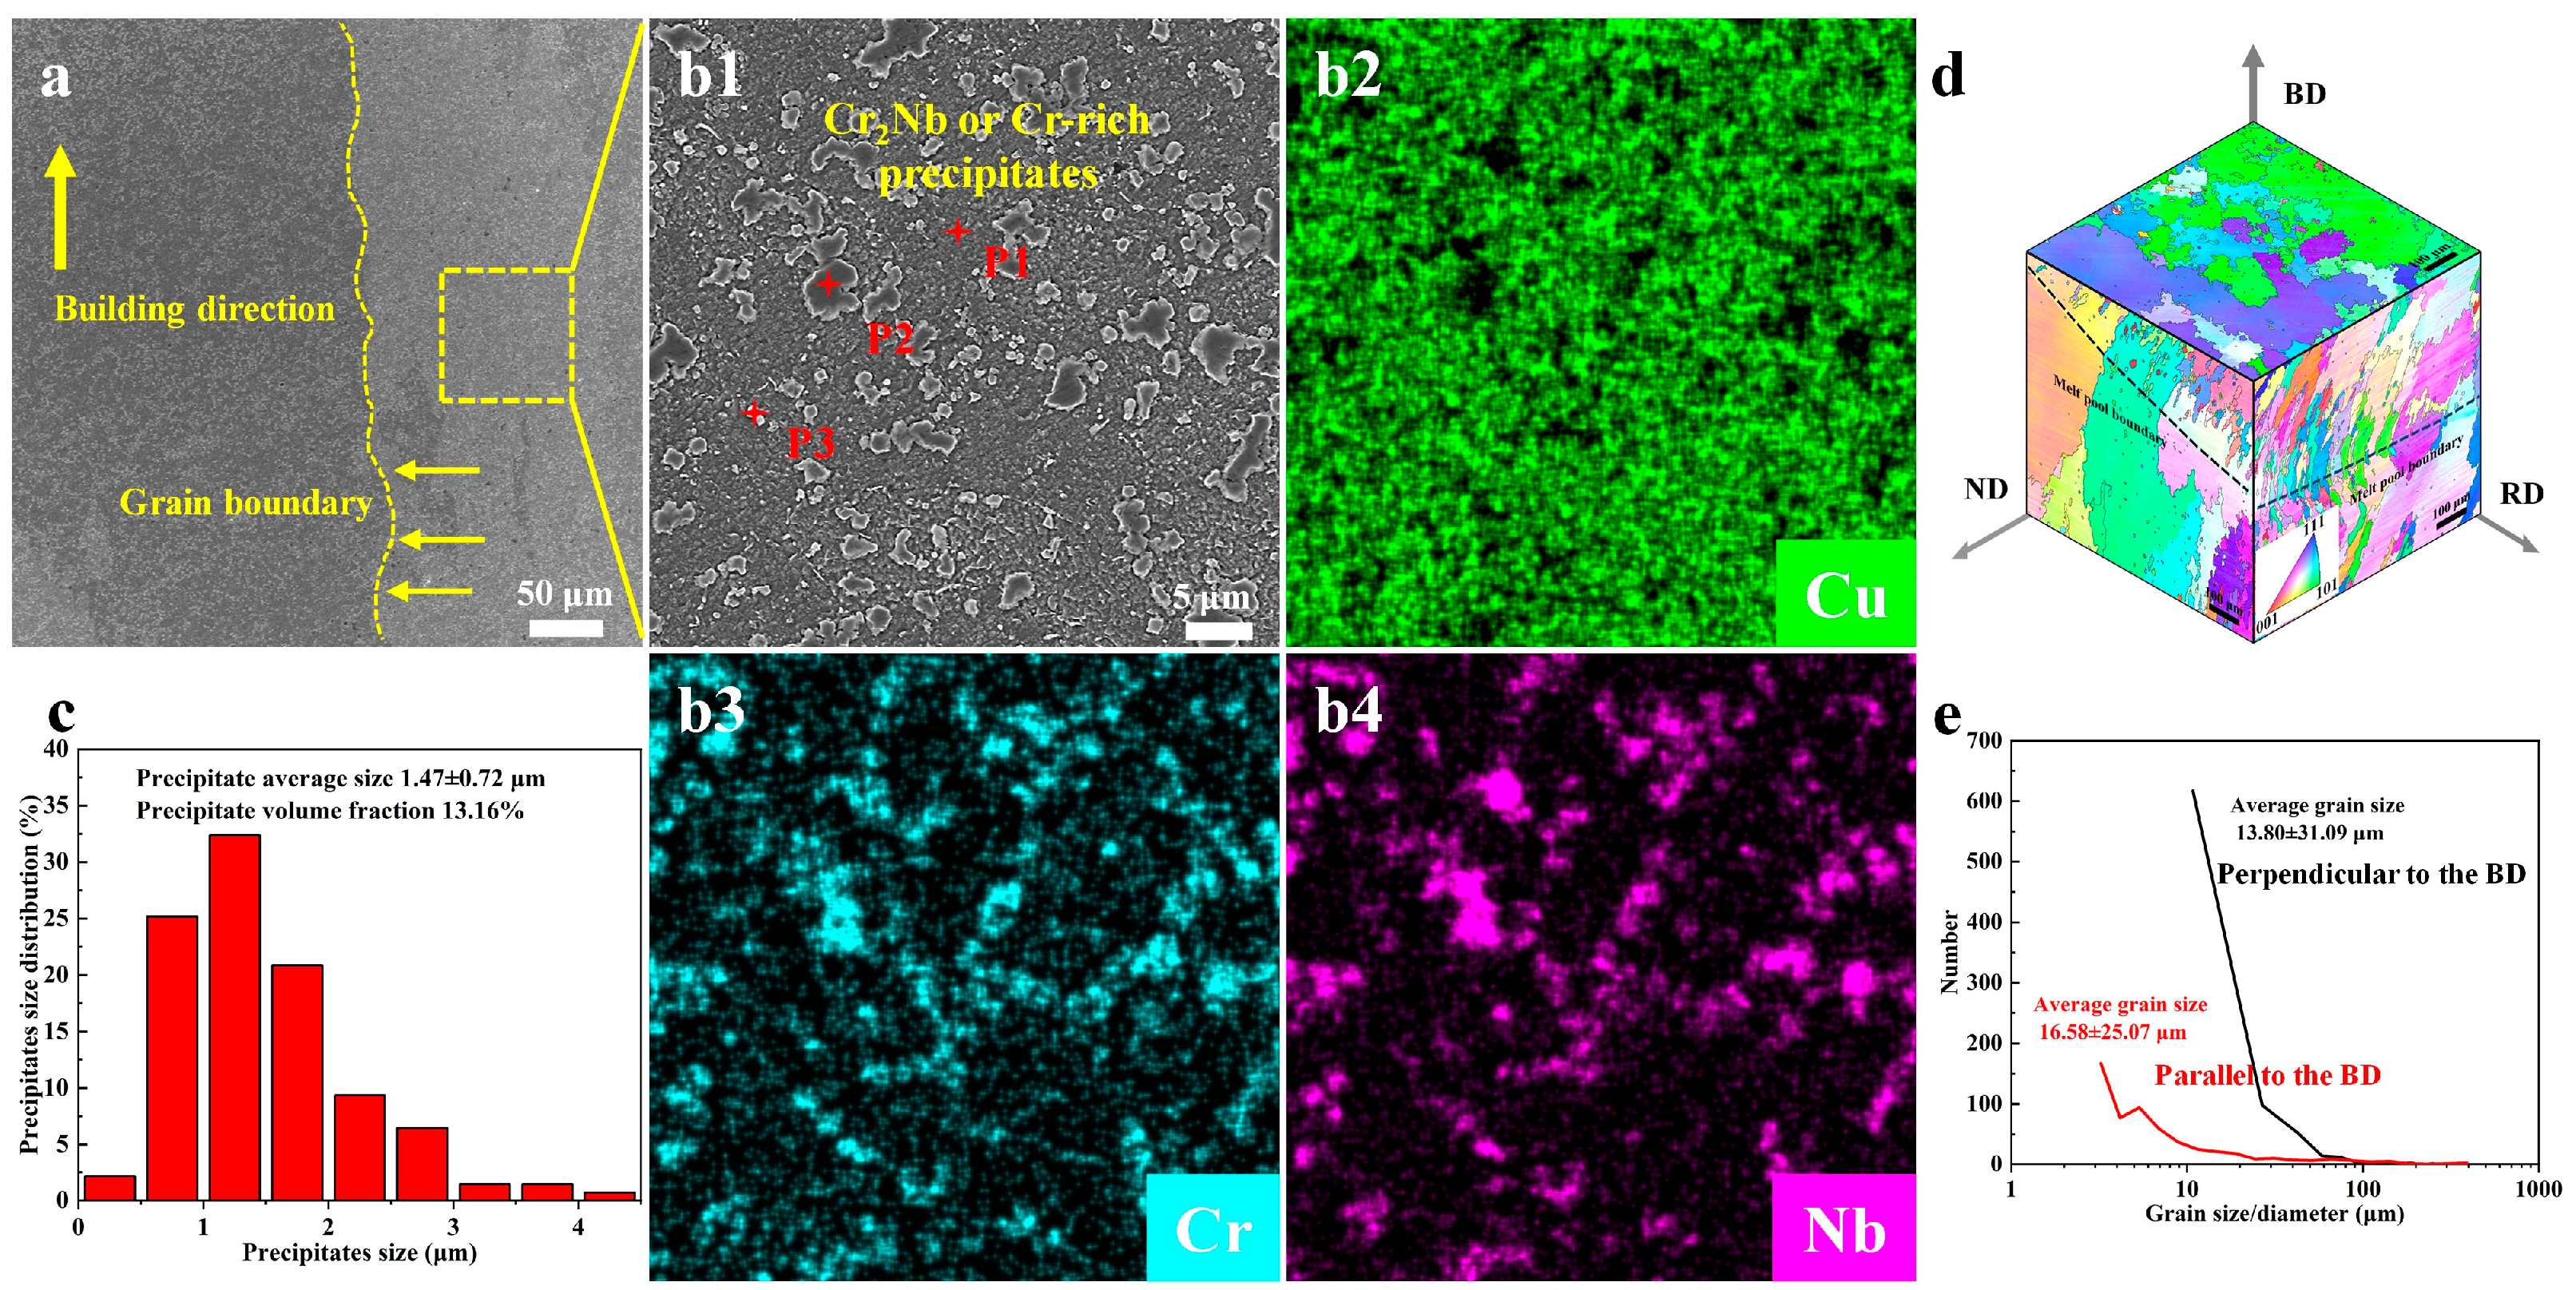
3.1. Effects of Laser Powers on Microstructure

Figure 2 presents the OM images of the GRCop-42 alloy deposited at various laser power settings. From Figure 2a–c, it is evident that the number of porosity defects initially increases and then decreases with rising laser power. Relative density analysis conducted using IPP6 (Image-Pro Plus 6.0) software reveals values of 98.53%, 99.71%, and 96.15% for Figure 2a–c, respectively. Interlayer cracks are observed due to incomplete fusion between layers. The alloy deposited at 2000 W exhibits the highest relative density with minimal porosity. However, at 2500 W, despite the absence of defects at the melt pool boundary, there is a significant increase in intracrystalline pores. A comprehensive comparison of Figure 2a–c clearly demonstrates that a laser power of 2000 W yields the most optimal relative density with fewer defects.
Figure 3 shows the XRD patterns of the GRCop-42 Cu alloy prepared at 2000 W. The primary phase in these samples is the FCC α-Cu. The Cr2Nb peaks can hardly be detected due to the low concentration. There are significant changes in the main diffraction peaks of the samples in different planes. In the plane parallel to the build direction (BD), the main diffraction peak is (111), while in the plane perpendicular to the BD, the main diffraction peaks are (200) and a relatively weaker (220). The crystal texture of the samples exhibits anisotropy in both the horizontal and vertical planes.
Figure 4a shows the SEM image of the GRCop-42 alloy deposited at a laser power of 2000 W, aligned parallel to the BD. Analysis of Figure 4(b1) reveals that the grains exhibit a characteristic outward extension along the direction of laser incidence. Numerous precipitates are observed both at the grain boundaries and within the grains. Figure 4(b1) provides a magnified view of the region enclosed by the yellow dashed rectangular box in Figure 4a, clearly illustrating that the as-deposited GRCop-42 alloy possesses a copper matrix interspersed with micron-sized strengthening phases. Figure 4(b2–b4) present the elemental distribution maps corresponding to region Figure 4(b1), while Table 3 lists the point-scan elemental composition results for the corresponding positions in Figure 4(b1). A combined analysis of the elemental distribution maps and point-scan results indicates that the precipitates in the alloy are predominantly Cr2Nb, with only trace amounts of Cr-rich phases present. Given the negligible quantity of Cr-rich phases, they will be collectively referred to as Cr2Nb precipitates in subsequent discussions unless otherwise specified. Integrating the results from Table 3 and Figure 4(b1), it is clear that positions P1, P2, and P3 in Figure 4(b1) correspond to the pure Cu matrix, Cr2Nb, and Cr-rich precipitates, respectively. Quantitative analysis of the precipitates in Figure 4(b1), performed using IPP6 software, is presented in Figure 4c. As shown in Figure 4c, the average size of the precipitates in the as-deposited GRCop-42 alloy is 1.47 ± 0.72 μm, with a volume fraction of up to 13.16%. The impact of these precipitates on the alloy’s mechanical properties will be thoroughly discussed in the subsequent sections. Figure 4d shows the 3D EBSD-IPF image of GRCop-42 alloy prepared by LDED at 2000 W laser power. As shown in Figure 4d, a coarse columnar dendritic structure is observed in the plane parallel to the BD. The long axis of the dendritic grains and the BD are approximately aligned, which is a common microstructural feature observed in additive manufacturing. Melt pool boundaries formed by the overlap between melt pools are clearly visible. These boundaries exhibit slight deviations in grain growth direction, attributed to the 10–15° tilt of the laser head from the vertical during cladding [14]. In the plane perpendicular to the BD, coarse near-equiaxed grains are distributed. Figure 4e provides the grain size statistics for Figure 4d, where grain diameter-based measurement was adopted. The data reveals an average grain size of 16.58 ± 25.07 μm parallel to the BD, and 13.80 ± 31.09 μm perpendicular to the BD. Whether parallel to the BD or perpendicular to the BD, the presence of significantly smaller grains alongside the coarse columnar grains leads to a larger standard deviation in the statistical results. However, this does not change the fact that the microstructure of this alloy predominantly consists of coarse columnar grains.
Copper alloys exhibit high reflectivity toward infrared lasers at room temperature, significantly hindering their effective absorption of laser energy during laser cladding processes. Additionally, copper possesses an extremely high thermal conductivity of 401 W/(m·K), which is 1.7 times higher than that of aluminum alloys and 5 times higher than that of steel [8,25]. This exceptional thermal conductivity causes rapid dissipation of laser energy within the material, complicating the maintenance of a stable melt pool and the achievement of the desired penetration depth. Collectively, these factors result in a critical dependence on laser power as a key parameter in the additive manufacturing of copper alloys. In this study, at a laser power of 1500 W, the molten layer exhibited numerous defects (Figure 2a). This was primarily attributed to the low power level, coupled with the high reflectivity of copper alloys to light, which resulted in a shallow molten pool. During the printing process, the current molten layer could not effectively achieve metallurgical bonding with the previous layer, leading to defects concentrated at the boundaries of the molten pool. Conversely, at a laser power of 2500 W, the higher power input leads to an increase in the temperature of the melt pool. Compared to samples prepared with a laser power of 2000 W, those prepared with a laser power of 2500 W show a significant increase in the number of pores and a lower density (Figure 2b,c). This is due to copper’s extremely high thermal conductivity, and the temperature gradient within the molten pool increased sharply, greatly intensifying the Marangoni convection within the molten pool. This caused deep keyholes to become indented and collapsed, potentially leading to the entrapment of inert gas and air within the molten pool before solidification [26]. These pores were relatively uniformly distributed across the sample surface and were roughly circular in shape, as shown in Figure 2c. As shown in Figure 2b, a laser power of 2000 W strikes a good balance between melt pool depth and stability. At this setting, the Marangoni convection within the melt pool is fully utilized, effectively promoting gas expulsion. Most pores migrate to the pool surface and escape before solidification due to convection, resulting in a dense, defect-free cladding layer. This demonstrates that a laser power of 2000 W can overcome the challenges posed by the high reflectivity and thermal conductivity of copper alloys, achieving high-quality additive manufacturing.

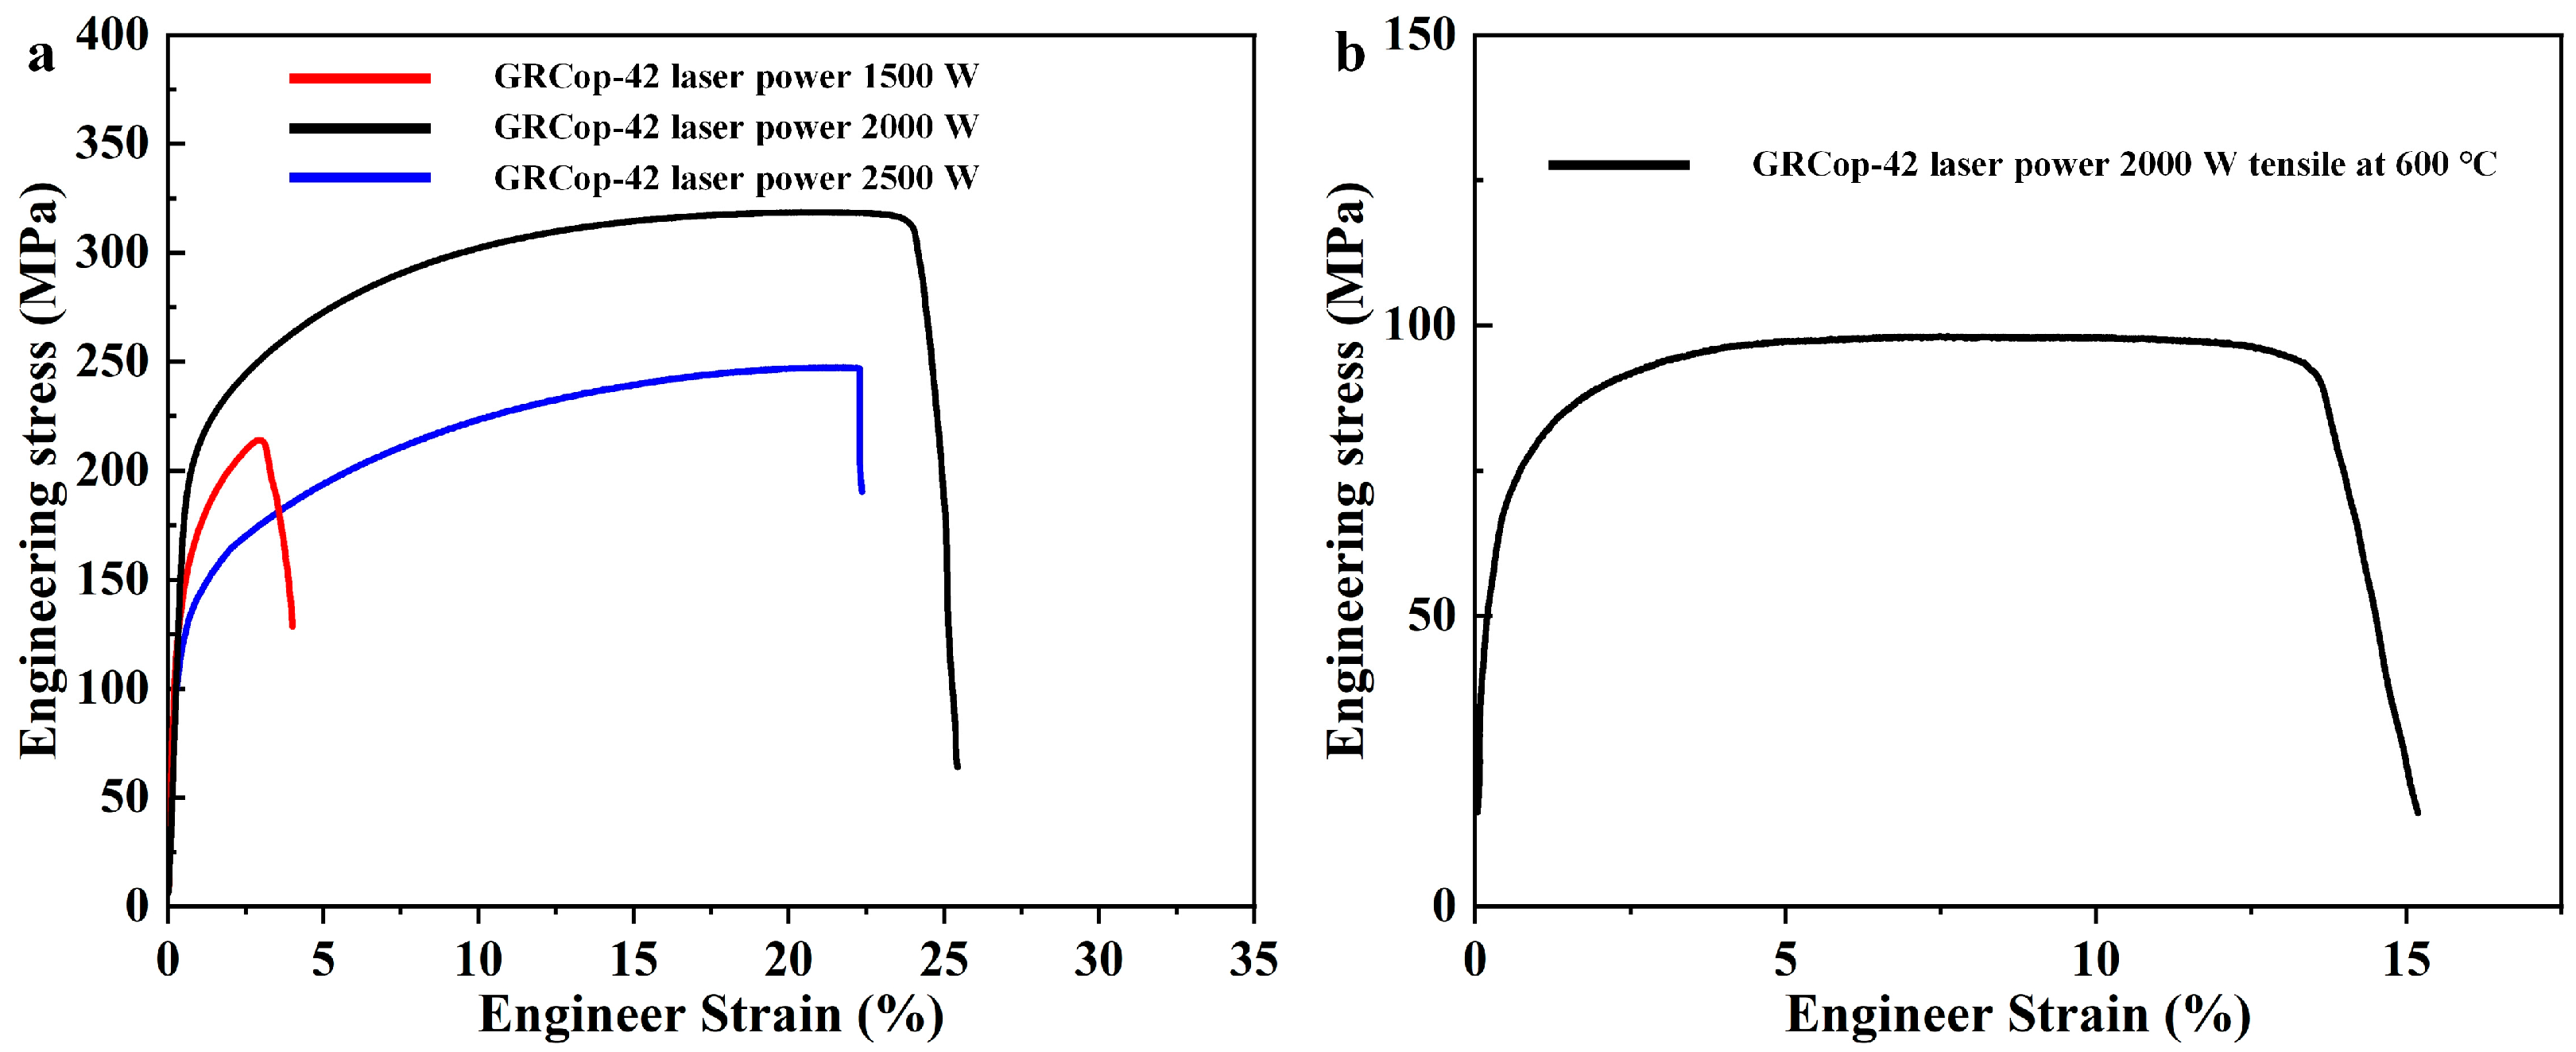
3.2. Tensile Behaviors

The tensile stress–strain curves of the as-deposited GRCop-42 with varying laser power levels are illustrated in Figure 5. The performance metrics of the as-deposited GRCop-42 at different laser power levels are summarized in Table 4. Notably, the yield strength, ultimate tensile strength, and elongation of the GRCop-42 deposited at 2000 W are measured at 236 ± 5.1 MPa, 319 ± 6.5 MPa, and 25.42 ± 1.9%, respectively. In contrast, the GRCop-42 deposited at 1500 W exhibits yield strength, ultimate tensile strength, and elongation values of 201 ± 10.4 MPa, 213 ± 17.5 MPa, and 4.00 ± 1.4%, respectively. For the alloy deposited at 2500 W, these properties are recorded as 164 ± 6.2 MPa, 247 ± 7.8 MPa, and 22.34 ± 2.5%, respectively. A comparative analysis reveals that the alloy deposited at 2000 W demonstrates the highest yield strength, ultimate tensile strength, and elongation among the three power levels. Further examination indicates that as the laser power increases, the ultimate tensile strength and elongation of GRCop-42 initially increase before subsequently declining. Holes generated in samples due to excessively high or low power can become stress concentration zones, leading to premature failure of the material and a sharp decline in its mechanical properties. For low-power samples, the lack of tight bonding between the layers due to insufficient power results in a particularly noticeable reduction in plasticity. An analysis of Figure 2 and Figure 5a confirms that the GRCop-42 alloy deposited at 2000 W exhibits the most favorable overall properties. Consequently, high-temperature tensile tests at 600 °C were conducted on the alloy fabricated under this specific process parameter. Since the heating process only took 5-8 min, the impact of the heating process on the precipitation phase of this alloy is not considered here. The tensile curves are presented in Figure 5b, with the detailed tensile properties of the alloy under high-temperature conditions listed in Table 4. It is observed that the yield strength, ultimate tensile strength, and elongation of the as-deposited GRCop-42 at 600 °C with a laser power of 2000 W are 89 ± 2.7 MPa, 98 ± 3.1 MPa, and 15.83 ± 1.5%, respectively. The high-temperature properties of the GRCop-42 alloy fabricated with a 2000 W laser power are comparable to the reference values provided by NASA [27].
The changes in performance of alloys (Table 4 and Figure 5a) are closely related to the microstructures, which are mainly affected by the laser powers. At 1500 W, the shallow melt pool results in mere adhesive bonding between layers, not metallurgical bonding. This significantly reduces the alloy’s plastic deformation ability, causing early fracture during tension due to ineffective load-bearing (Figure 2a). At 2500 W, although metallurgical bonding is achieved, the many pores induce crack initiation and accelerate their spread during tension, lowering the alloy’s tensile strength and elongation (Figure 2c). In contrast, at 2000 W, the melt pool depth and heat input are ideally balanced. The cladding layer is most densest and has the fewest internal defects. Under this process, the tensile strength and elongation of the alloy reach their peak.
SEM observation was performed on the surfaces and longitudinal section of the tensile fractured samples to study the tensile fractured mechanism at room temperature and 600 °C (Figure 6). Figure 6a–c show the fracture surface morphology, fracture surface, and side view of the fracture for the GRCop-42 alloy fabricated by LDED under room temperature conditions. Figure 6d,e present the corresponding fracture surface morphology, fracture surface, and side view of the fracture for the alloy under high-temperature conditions at 600 °C. As shown in Figure 6a, the fracture surface of the GRCop-42 alloy at room temperature is relatively flat, exhibiting typical ductile fracture characteristics. In contrast, the fracture surface at 600 °C (Figure 6d) shows significant unevenness, accompanied by visible tearing. These tears may arise from intergranular fracture, resulting in complex crack propagation paths. This indicates a distinct difference in deformation and fracture mechanisms between room temperature and high-temperature conditions. As shown in Figure 6b, the fracture surface at room temperature is covered with dense, equiaxed dimples, indicating a typical ductile fracture via microvoid coalescence. This suggests that significant plastic deformation and necking occurred during deformation at room temperature. In contrast, Figure 6e shows that the fracture surface at 600 °C has a rough, uneven appearance with an obvious oxide layer and tear ridge structures in some areas. Figure 6c,f are SEM images of the fracture side after room stretching and 600 °C high temperature, respectively. The crack propagation paths and fracture mechanisms of the GRCop-42 alloy differ significantly at different temperatures. At room temperature, microcracks initially form at the interface between Cr2Nb precipitates and the copper matrix. Some larger precipitates are directly cut by cracks due to stress concentration. Cracks mainly propagate through weak areas within grain boundaries, accompanied by microvoid coalescence to form dimples. This indicates that the effect of precipitates is the key factor initiating cracks at room temperature, while plastic deformation within the grain boundaries dominates subsequent crack propagation. At high temperature (600 °C), the significant weakening of grain boundary strength at elevated temperatures leads to predominantly intergranular crack propagation. Cracks extend along grain boundaries in a tortuous manner, resulting in typical intergranular fracture features. Dispersed Cr2Nb precipitates at the grain boundaries hinder direct crack penetration, effectively lengthening the crack propagation path and enhancing the grain boundary strength at high temperatures. However, coarse precipitates exceeding a critical size (≈5 μm) may debond from the matrix under high-temperature stress, creating pits on the fracture surface, which could potentially degrade material performance at elevated temperatures.
Figure 7(a1,b1) show the Scanning Transmission Electron Microscope-Bright Field (STEM-BF) morphology of the sample after room-temperature tensile testing. Figure 7(a2–a4,b2–b4) correspond to the scanning images of the Cu, Cr, and Nb elements in the a1 and b1 regions, respectively. Observations from Figure 7(a1–a4) indicate that during the deformation process at room temperature, larger Cr2Nb phases develop cracks during the tensile process. It is speculated that during the tensile process, the stress near the precipitated phase is relatively high, and since it is inherently a hard and brittle phase, cracks initiate and propagate rapidly in this region. From the observation of Figure 7(b1–b4), it is noted that during the deformation process, there are many Cr-rich phases in the Cu matrix with sizes smaller than 100 nm. These Cr-rich phases entangle with dislocations during the tensile process, hindering the dislocation movement towards the grain boundaries, thereby preventing premature failure of the alloy at room temperature. Furthermore, the interlocking entanglement of dislocations and the precipitated phases can enhance the strength of the alloy. For copper alloys, the size of the precipitated phase primarily affects the relationship between dislocations and the precipitated phase. Generally speaking, when the precipitated phase size is around 50 nm, dislocations can pile up at the precipitated phases, forming interaction configurations that involve either bypass (Orowan looping) or cutting mechanisms. Figure 7(c1) shows the transmission electron microscope bright field (TEM-BF) morphology of the sample after tensile testing at 600 °C, highlighting the TEM dark field image of the deformed twin, as seen in Figure 7(c2). In addition to dislocation walls and pile-ups within the matrix, deformation twin structures induced by plastic deformation are observed. Figure 7(c3) presents the selected area electron diffraction (SAED) analysis of the c1 region. The spots imaged in Figure 7(c2) are highlighted with yellow circles. Analyzing the diffraction spots in Figure 7(c3) reveals that the twin plane is {111} and the twin direction is <112>, which is consistent with the twinning mechanism of face-centered cubic crystal structures [28,29]. Due to the significant strain in the matrix after deformation, the spots do not appear as standard circles. Figure 7(c4) illustrates Scanning Transmission Electron Microscope-Dark Field (STEM-DF), which reveals the presence of dislocations at the twin boundaries of the deformed twin. Subsequently, we conducted High-Resolution Transmission Electron Microscopy (HRTEM) characterization on similar regions, with detailed results shown in Figure 8. The HRTEM results shown in Figure 8a indicate that the width of this deformed twin is approximately 5.2 nm. While matrix and twins are observed, there are also regions that disrupt this regular arrangement, referred to as irregular areas in Figure 8a. The width of the irregular zones spans only a few atoms. Corresponding Fourier transforms were performed on the regions F1 and F2 in Figure 8a, with results displayed in Figure 8b,c. It was found that the twin type is a typical FCC twin, with the twin plane being {111} and the twin direction being <112>.
To facilitate the discussion of the deformation mechanisms of the GRCop-42 alloy at different temperatures, we illustrated the deformation mechanisms as shown in Figure 9. At room temperature, when materials are subjected to external forces, significant stress concentration occurs at the interface between second-phase particles and the matrix. The complex stress state and high local stress levels make this region prone to crack initiation. When the stress threshold is reached, the interfacial atomic bonds break, forming initial microcracks. Some larger precipitates are directly cut by these cracks, which typically form perpendicular to the maximum tensile stress direction (Figure 6c, Figure 7(a1) and Figure 9) [30,31]. The room-temperature tensile fracture surface shows typical characteristics of microporosity coalescence fracture (Figure 6a,b). At elevated temperatures of 600 °C, the grain boundary strength diminishes, leading to a higher propensity for crack initiation at these sites (Figure 6d). At elevated temperatures, cracks appeared at the Cr2Nb phase and Cu matrix boundaries. It is speculated that during the high-temperature tensile process, the interfacial bonding strength at this location also decreased, leading to the formation of some cracks [32,33]. Some of the larger precipitated phases even detach during the deformation process (Figure 6f). However, smaller precipitates at the grain boundaries can hinder crack propagation, providing some high-temperature strengthening to the alloy (Figure 6f and Figure 7(c4)).
Due to its low dislocation energy, copper is susceptible to the formation of dislocation twins by incomplete dislocation slip on {111} crystal faces during room temperature deformation. The introduction of Cr significantly increases the stacking fault energy of the copper matrix, thereby shifting its room-temperature deformation mechanism to one dominated by dislocation slip. For Cu-Cr alloys with precipitate sizes exceeding 200 nm, dislocations cannot easily bypass these coarse secondary phases via the Orowan mechanism [34]. Instead, these large precipitates impede dislocation motion, leading to extensive dislocation pile-ups and the formation of dislocation walls (Figure 7(a1,b1)). As the ambient temperature rises, enhanced atomic diffusion reduces the stacking fault energy, reactivating the deformation twinning mechanism. Consequently, deformation twins begin to appear in the high-temperature deformed microstructure (Figure 7(c1–c4), Figure 8 and Figure 9).

4. Conclusions

This study explored how varying laser powers affect the microstructure and properties of GRCop-42 copper alloys. Tensile tests at room temperature were conducted for all samples with varying laser powers, as well as 600 °C tensile tests on the sample with the laser power at 2000 W. The following are the key conclusions drawn from this research:
1. As the laser power gradually increased, the relative density of the samples first increased and then decreased. At a laser power of 1500 W, insufficient energy input led to inadequate fusion at the edges of the melt pool, forming defects. When the power was raised to 2500 W, excessive energy input caused violent boiling of the melt pool, with the vigorous escape of metal vapor introducing numerous porosity defects and reducing the level of densification. A laser power of 2000 W was found to be the optimal process parameter. At this setting, the energy input into the melt pool and the metal solidification process reached an ideal balance, achieving a peak relative density of 99.71% for the samples.
2. When the laser power was 2000 W, the GRCop-42 alloy samples exhibited optimal mechanical properties at room temperature, with a tensile strength of 319 ± 6.5 MPa and an elongation of 25.42 ± 1.9%. Fracture analysis indicated a typical microporosity coalescence fracture mechanism, with dislocation glide as the main deformation mechanism. At 600 °C, the fracture mode shifted to intergranular fracture, and the plastic deformation was dominated by dislocation glide and twinning.
3. Due to the high thermal input from laser-directed energy, the alloy microstructure exhibits coarse equiaxed grains. In the plane parallel to the build direction (BD), the main diffraction peak is (111), while in the plane perpendicular to the BD, the main diffraction peaks are (200) and a relatively weaker (220). The crystal texture of the samples shows anisotropy in both the horizontal and vertical planes.
4. The GRCop-42 alloy samples contain two main precipitate phases: a micron-sized Cr2Nb phase that is dispersed throughout the matrix and a Cr-rich phase approximately 50 nanometers in size located within the grains. During room temperature tensile testing, the inherent brittleness of the Cr2Nb phase allows for the easy formation of large cracks near Cr2Nb. Within the grains, the nanometer-sized Cr-rich phases entangle with dislocations, hindering their accumulation at the grain boundaries and preventing premature failure of the alloy due to localized stress concentration.

Author Contributions

Conceptualization, P.H.; Methodology, P.H.; Investigation, C.L.; Resources, C.L.; Data curation, C.L.; Writing—original draft, C.L.; Writing—review and editing, C.L.; Supervision, H.S.; Project administration, Y.Z.; Funding acquisition, Y.Z. All authors have read and agreed to the published version of the manuscript.

Funding

This research was funded by the National Key Research and Development Program of China (grant number 2024YFB4609900).

Data Availability Statement

Dataset available on request from the authors.

Conflicts of Interest

The authors declare no conflicts of interest.

References

  1. Svetlizky, D.; Das, M.; Zheng, B.; Vyatskikh, A.L.; Bose, S.; Bandyopadhyay, A.; Schoenung, J.M.; Lavernia, E.J.; Eliaz, N. Directed energy deposition (DED) additive manufacturing: Physical characteristics, defects, challenges and applications. Mater. Today 2021, 49, 271–295. [Google Scholar] [CrossRef]
  2. Liu, M.; Kumar, A.; Bukkapatnam, S.; Kuttolamadom, M. A Review of the Anomalies in Directed Energy Deposition (DED) Processes & Potential Solutions—Part Quality & Defects. Procedia Manuf. 2021, 53, 507–518. [Google Scholar] [CrossRef]
  3. Zhao, W.; Sun, Y.; Che, P.; Ning, Z.; Fan, H.; Yang, H.; Sun, J.; Liaw, P.K.; Ngan, A.H.W.; Huang, Y. The columnar to equiaxed transition of CoCrNi medium-entropy alloy fabricated by laser directed energy deposition. Mater. Des. 2024, 237, 112538. [Google Scholar] [CrossRef]
  4. Hu, Z.; Zhao, Y.; Zhan, X.; Xu, J.; Ma, Z. The immiscible W/Cu composites with heterostructures and excellent bond strength prepared by additively manufactured transient liquid-phase direct bonding: Experiments and simulations. Compos. Part B 2025, 291, 111981. [Google Scholar] [CrossRef]
  5. Hu, Z.; Qian, Z.; Yan, Z.; Shi, G.; Qiao, Z.; Li, S.; Zhan, X.; Ma, Z. Synchronized construction of metallurgical bonding and mechanical interlocking interface in immiscible W/CuCrZr functional gradient material by additive manufacturing. Scr. Mater. 2025, 260, 116599. [Google Scholar] [CrossRef]
  6. Zhang, D.; Sun, S.; Qiu, D.; Gibson, M.A.; Dargusch, M.S.; Brandt, M.; Qian, M.; Easton, M. Metal Alloys for Fusion-Based Additive Manufacturing. Adv. Eng. Mater. 2018, 20, 1700952. [Google Scholar] [CrossRef]
  7. Sames, W.J.; List, F.A.; Pannala, S.; Dehoff, R.R.; Babu, S.S. The metallurgy and processing science of metal additive manufacturing. Int. Mater. Rev. 2016, 61, 315–360. [Google Scholar] [CrossRef]
  8. Tang, X.; Chen, X.; Sun, F.; Liu, P.; Zhou, H.; Fu, S. The current state of CuCrZr and CuCrNb alloys manufactured by additive manufacturing: A review. Mater. Des. 2022, 224, 111419. [Google Scholar] [CrossRef]
  9. Demeneghi, G.; Barnes, B.; Gradl, P.; Ellis, D.; Mayeur, J.R.; Hazeli, K. Directed energy deposition GRCop-42 copper alloy: Characterization and size effects. Mater. Des. 2022, 222, 111035. [Google Scholar] [CrossRef]
  10. Hazeli, K.; June, D.; Anantwar, P.; Babamiri, B.B. Mechanical behavior of additively manufactured GRCop-84 copper alloy lattice structures. Addit. Manuf. 2022, 56, 102928. [Google Scholar] [CrossRef]
  11. Gradl, P.R.; Protzb, C.S.; Ellisc, D.L.; Greened, S.E. Progress in Additively Manufactured Copper-Alloy GRCop-84, GRCop-42, and Bimetallic Combustion Chambers for Liquid Rocket Engines. In Proceedings of the 70th International Astronautical Congress (IAC), Washington, DC, USA, 21–25 October 2019. [Google Scholar]
  12. Pan, Y.; Guo, Q.; Hu, Z.; Wei, C.; Ding, R.; Liu, C.; Ma, Z.; Liu, Y. The role of the post-heat treatment on the Cr-based precipitates and related room temperature mechanical properties of the sintered Nb-lean Cu–Cr–Nb alloy. J. Mater. Res. Technol. 2024, 28, 2420–2429. [Google Scholar] [CrossRef]
  13. Preis, J.; Wang, Z.; Howard, J.; Lu, Y.; Wannenmacher, N.; Shen, S.; Paul, B.K.; Pasebani, S. Effect of laser power and deposition sequence on microstructure of GRCop42—Inconel 625 joints fabricated using laser directed energy deposition. Mater. Des. 2024, 241, 112944. [Google Scholar] [CrossRef]
  14. Zhao, R.; Li, L.; Nie, Z.; Ma, Z.; Guo, Q. Effects of pre-heating induced interfacial diffusion on microstructure and related mechanical properties of direct laser metal deposited Inconel 625 superalloy on a Cu-Cr-Zr substrate. Mater. Sci. Eng. A 2025, 920, 147551. [Google Scholar] [CrossRef]
  15. Landes, S.; Suresh, T.; Prasad, A.; Letcher, T.; Gradl, P.; Ellis, D. Investigation of additive manufactured GRCop-42 alloy developed by directed energy deposition methods. In Proceedings of the ASME 2020 International Mechanical Engineering Congress and Exposition, Portland, OR, USA, 16–19 November 2020. [Google Scholar]
  16. Kini, A.R.; Maischner, D.; Weisheit, A.; Ponge, D.; Gault, B.; Jägle, E.A.; Raabe, D. In-situ synthesis via laser metal deposition of a lean Cu–3.4Cr–0.6Nb (at%) conductive alloy hardened by Cr nano-scale precipitates and by Laves phase micro-particles. Acta Mater. 2020, 197, 330–340. [Google Scholar] [CrossRef]
  17. Holzwarth, U.; Stamm, H. The precipitation behaviour of ITER-grade Cu–Cr–Zr alloy after simulating the thermal cycle of hot isostatic pressing. J. Nucl. Mater. 2000, 279, 31–45. [Google Scholar] [CrossRef]
  18. Suresh, T.; Landes, S.; Letcher, T.; Prasad, A.; Ellis, D. Nanomechanical Characterization of Additive Manufactured GRCop-42 Alloy Developed by Directed Energy Deposition Methods. In Proceedings of the ASME 2020 International Mechanical Engineering Congress and Exposition, Portland, OR, USA, 16–19 November 2020. [Google Scholar]
  19. de Groh, H.C.; Ellis, D.L.; Loewenthal, W.S. Comparison of GRCop-84 to Other Cu Alloys with High Thermal Conductivities. J. Mater. Eng. Perform. 2008, 17, 594–606. [Google Scholar] [CrossRef]
  20. Seltzman, A.H.; Wukitch, S.J. Fracture characteristics and heat treatment of laser powder bed fusion additively manufactured GRCop-84 copper. Mater. Sci. Eng. A 2021, 827, 141690. [Google Scholar] [CrossRef]
  21. Zhang, X.; Sun, G.; Zhang, P.; Xu, J.; Zhang, X.; Gao, H.; Xie, H.; Xu, S.; Zhao, J.; Li, P.; et al. Dispersoid inhomogeneity induced HDI effects in the dispersion-strengthened GRCop-42 alloy without typical hetero-structures. Mater. Sci. Eng. A 2025, 923, 147737. [Google Scholar] [CrossRef]
  22. Li, W.Y.; Guo, X.P.; Verdy, C.; Dembinski, L.; Liao, H.L.; Coddet, C. Improvement of microstructure and property of cold-sprayed Cu–4at.%Cr–2at.%Nb alloy by heat treatment. Scr. Mater. 2006, 55, 327–330. [Google Scholar] [CrossRef]
  23. Hao, Z.; He, Z.; Nie, Z.; Li, J.; Ma, Z.; Guo, Q. Effects of residual Laves phase on microstructural evolution and mechanical properties of wire arc additive manufactured GH4169 Ni-based superalloy. Mater. Sci. Eng. A 2024, 914, 147175. [Google Scholar] [CrossRef]
  24. Li, L.; Liu, C.; Ma, Z.; Guo, Q. Microstructure and mechanical properties of Stellite 6 alloy coating metallurgically bonded to 304 stainless steel by DED-LB technology. J. Mater. Sci. 2024, 59, 20012–20027. [Google Scholar] [CrossRef]
  25. Hu, Z.; Ma, Z.; Yu, L.; Liu, Y. Functionally graded materials with grain-size gradients and heterogeneous microstructures achieved by additive manufacturing. Scr. Mater. 2023, 226, 115197. [Google Scholar] [CrossRef]
  26. Zhang, K.; Chen, Y.; Marussi, S.; Fan, X.; Fitzpatrick, M.; Bhagavath, S.; Majkut, M.; Lukic, B.; Jakata, K.; Rack, A.; et al. Pore evolution mechanisms during directed energy deposition additive manufacturing. Nat. Commun. 2024, 15, 1715. [Google Scholar] [CrossRef] [PubMed]
  27. Ellis, D.; Gray, H.; Nathel, M. Aerospace Structural Materials Handbook Supplement GRCop-84; Cindas Llc.: West Lafayette, IN, USA, 2001. [Google Scholar]
  28. Tang, L.; Guo, Q.; Li, C.; Ding, R.; Liu, Y. Precipitation and tensile behaviors of Allvac 718Plus superalloy during long-term thermal exposure. Mater. Sci. Eng. A 2024, 896, 146221. [Google Scholar] [CrossRef]
  29. Tang, L.; Guo, Q.; Li, C.; Liu, C.; Liu, Y. Precipitation sequences in rapidly solidified Allvac 718Plus alloy during solution treatment. J. Mater. Sci. Technol. 2022, 128, 180–194. [Google Scholar] [CrossRef]
  30. Hu, Z.; Du, Z.; Yang, Z.; Yu, L.; Ma, Z. Preparation of Cu–Cr–Zr alloy by selective laser melting: Role of scanning parameters on densification, microstructure and mechanical properties. Mater. Sci. Eng. A 2022, 836, 142740. [Google Scholar] [CrossRef]
  31. Wang, G.; Ouyang, H.; Fan, C.; Guo, Q.; Li, Z.; Yan, W.; Li, Z. The origin of high-density dislocations in additively manufactured metals. Mater. Res. Lett. 2020, 8, 283–290. [Google Scholar] [CrossRef]
  32. Turnage, S.A.; Rajagopalan, M.; Darling, K.A.; Garg, P.; Kale, C.; Bazehhour, B.G.; Adlakha, I.; Hornbuckle, B.C.; Williams, C.L.; Peralta, P.; et al. Anomalous mechanical behavior of nanocrystalline binary alloys under extreme conditions. Nat. Commun. 2018, 9, 2699. [Google Scholar] [CrossRef]
  33. Hornbuckle, B.C.; Koju, R.K.; Kennedy, G.; Jannotti, P.; Lorenzo, N.; Lloyd, J.T.; Giri, A.; Solanki, K.; Thadhani, N.N.; Mishin, Y.; et al. Direct observation of deformation and resistance to damage accumulation during shock loading of stabilized nanocrystalline Cu-Ta alloys. Nat. Commun. 2024, 15, 9135. [Google Scholar] [CrossRef]
  34. Hu, Z.; Gan, B.; Tan, J.; Wu, J.; Chen, S.; Dong, J.; Ma, Z. The enhancement of laser absorptivity and properties in laser powder bed fusion manufactured Cu-Cr-Zr alloy by employing Y2O3 coated powder as precursor. J. Alloys Compd. 2022, 927, 167111. [Google Scholar] [CrossRef]
Figure 1. (a) Experimental path planning diagram. (b) Schematic of laser-directed energy deposition (LDED) process. (c) The image of the GRCop-42 powders. (d) The particle size distributions of GRCop-42 powders. (e) Schematic diagram of printed specimen and tensile specimen sampling locations. (f) The schematic diagram of tensile specimens.
Crystals 15 00547 g001
Figure 2. Representative OM images of the LDED prepared GRCop-42 specimens at laser powers of (a) 1500 W, (b) 2000 W, and (c) 2500 W. The melt pool boundary is indicated by white dashed lines. The crack, defect, and pore are marked with white arrows.
Crystals 15 00547 g002
Figure 3. XRD patterns of the 2000 W samples taken parallel and perpendicular to the BD.
Crystals 15 00547 g003
Figure 4. (a) SEM image of the GRCop-42 alloy prepared by LDED, along the building direction (BD). (b1) The high magnification SEM image of the region marked by the yellow dashed rectangular regions in (a) and (b2b4) the corresponding Cu, Cr, Nb elemental maps of the b1 region. (c) Precipitate size and volume fraction in GRCop-42 alloy prepared by LDED. (d) Three-dimensional (3D) IPF images of GRCop-42 alloy prepared by LDED, where the black dashed lines represent the melt pool boundary. (e) Grain size distribution of different planes, parallel and perpendicular to the BD.
Crystals 15 00547 g004
Figure 5. (a) Tensile properties of GRCop-42 alloy prepared at laser powers of 1500 W, 2000 W, and 2500 W at room temperature. (b) Tensile properties of GRCop-42 alloy prepared at a laser power of 2000 W at 600 °C.
Crystals 15 00547 g005
Figure 6. (ac) show the macroscopic morphology, fracture surface, and side view of the fracture, respectively, for GRCop-42 specimens prepared at 2000 W laser power after tensile testing at room temperature, observed by SEM. (df) show the macroscopic morphology, fracture surface, and side view of the fracture, respectively, for GRCop-42 specimens prepared at 2000 W laser power after tensile testing at 600 °C, observed by SEM.
Crystals 15 00547 g006
Figure 7. (a1,b1) STEM-BF image of the GRCop-42 specimens after room temperature tensile test and (a2a4,b2b4) the corresponding Cu, Cr, Nb elemental maps of the (a1,b1) region, (c1) TEM-BF image of the GRCop-42 sample after tensile testing at 600 °C, (c2) corresponding deformation twin dark-field image of the same region as in (c1), with the selected diffraction spots marked by yellow circles in (c3), highlighting the deformation twin structures, (c3) the SAED patterns from deformation twins in (c2), (c4) STEM-DF magnified image of the deformation twin region.
Crystals 15 00547 g007
Figure 8. (a) HRTEM images of the deformation twin substructure; (b,c) FFT patterns at the corresponding F1 and F2 positions in (a).
Crystals 15 00547 g008
Figure 9. The deformation mechanism of LDED GRCop-42 alloy after tensile testing at different temperatures.
Crystals 15 00547 g009
Table 1. GRCop-42 powder composition (wt%).
MaterialCuCrNbONCS
GRCop-42 powderBal.3.242.760.0350.0010.00290.0012
Table 2. LDED parameters used for manufacturing GRCop-42 samples.
ParametersValue
Laser power (W)1500/2000/2500
Scanning speed (mm/s)15
Laser beam spot diameter (mm)3.2
Hatch width (mm)1.6
Powder feed rate (g/min)8.4
Protective gas flow rate (L/min)15
Table 3. SEM-EDS result in Figure 4(b1) showing the composition information (at%).
Point IDCuCrNb
P199.25-0.75
P251.139.8339.03
P310.5784.225.21
Table 4. The yield strength, ultimate tensile strength, and elongation of GRCop-42 samples deposited at 1500 W, 2000 W, and 2500 W, as well as the high-temperature tensile properties at 600 °C for samples deposited at 2000 W.
SamplesYield Strength (MPa)Ultimate Tensile Strength (MPa)Elongation (%)
GRCop-42 laser power 1500 W201 ± 10.4213 ± 17.54.00 ± 1.4
GRCop-42 laser power 2000 W236 ± 5.1319 ± 6.525.42 ± 1.9
GRCop-42 laser power 2500 W164 ± 6.2247 ± 7.822.34 ± 2.5
GRCop-42 laser power 2000 W at 600 °C89 ± 2.798 ± 3.115.83 ± 1.5
Disclaimer/Publisher’s Note: The statements, opinions and data contained in all publications are solely those of the individual author(s) and contributor(s) and not of MDPI and/or the editor(s). MDPI and/or the editor(s) disclaim responsibility for any injury to people or property resulting from any ideas, methods, instructions or products referred to in the content.

