Article

Performance of Microbially Induced Carbonate Precipitation for Reinforcing Cohesive Soil in the Reservoir Area

National Engineering Research Center of Coal Mine Water Hazard Controlling, School of Resources and Civil Engineering, Suzhou University, Suzhou 234000, China
*
Author to whom correspondence should be addressed.
Crystals 2025, 15(6), 540; https://doi.org/10.3390/cryst15060540
Submission received: 21 April 2025 / Revised: 14 May 2025 / Accepted: 3 June 2025 / Published: 5 June 2025
(This article belongs to the Section Inorganic Crystalline Materials)

Abstract

Cohesive soil in the reservoir area is vulnerable to natural disasters because of its poor erosion resistance and low strength. Therefore, it needs to be reinforced. Microbially induced calcium carbonate precipitation (MICP) is a sustaibable soil reinforcement technique with low energy consumption and no pollution. Different combinations of Bacillus subtilis bacterial solution (BS) concentrations and cementing solution (CS) concentrations were set to perform MICP solidification treatment. The characterization of cohesive soil before MICP was carried out by means of Scanning Electron Microscopy (SEM), Fourier-Transform Infrared Spectroscopy (FTIR), and Laser Particle Size Analyzer (LPSA). The results showed that the unreinforced soil showed an amorphous state with low strength and the particle size distribution was dominated by powder particles. However, with the addition of BS concentrations and CS concentrations, SEM results showed that spherical and rhombohedral minerals filled the pores of the cohesive soil, which increased the content of precipitations and enhanced the cementitious characteristics. When the concentrations of CS or BS were fixed, CaCO3 content, deviatoric stress, shear strength, cohesive force, and internal friction angle all showed a trend of first increasing and then decreasing with the increase in CS or BS concentration. The optimal combination of CS and BS concentration was 1.5 mol/L and OD600 = 1.8. Thermochemical analyses showed an improved thermal stability of the reinforcing cohesive soil, with the lowest mass loss (32%) and the highest pyrolysis temperature (812 °C) of the samples at the optimal combination of BS and CS concentration. This study is expected to improve the understanding of the MICP reinforcement process and contribute to the optimal design of future biologically mediated soil amendments, promoting bioremediation.

1. Introduction

Microbially induced calcium carbonate precipitation (MICP) is a low-carbon-emission eco-friendly soil amendment technology which is environmentally friendly [1,2,3]. It also increases soil strength as well as reduces soil permeability, which makes the technology an attractive solution for various disciplines such as geotechnical, environmental, and geological engineering. MICP technology utilizes a certain type of bacteria in nature that can produce urease to decompose urea. By providing abundant calcium and nitrogen sources of nutrients, MICP rapidly precipitates calcite-type calcium carbonate crystals with excellent bonding properties. The basic mechanism of urease-based MICP can be represented by the following reaction equations. During MICP, urea is hydrolyzed by urease to calcium carbonate ions and ammonium ions, as seen in Equation (1); subsequently, the generated carbonate ions combine with free calcium ions to produce a calcium carbonate precipitate, as shown in Equation (2). Inside the granular material, the presence of calcium carbonate crystals enhances the inter-particle bonding and significantly alters the internal physicochemical properties of the material [4,5].
C O ( N H 2 ) 2 + 2 H 2 O C O 3 2 + 2 N H 4 +
C O 3 2 + C a 2 + C a C O 3
This technology has the advantages of simple control and economic efficiency. Since its proposal, it has been widely used in fields including crack repair of cultural relics, treatment of heavy metal pollution in soil, anti-seepage of rock and soil, wind and sand fixation, and reduction in erosion, and especially in the field of rock and soil reinforcement, where significant achievements have been made [6].
The macroscopic properties of calcium carbonate, as the core product of the MICP reaction, have a crucial influence on the overall properties of calcium carbonate. Overall, the increase in the contents of calcium carbonate in the soil under MICP treatment decrease permeability and increase shear strength, cohesion, and internal friction angle. In addition to the calcium carbonate content, the microscopic characteristics of MICP, such as mineral morphology, size, and composition, are also important in improving the reinforcement effect. Previous studies have shown that changes in temperature in the reaction system can greatly affect the size of calcium carbonate crystals. Sun et al. (2019) revealed that the size of calcium carbonate crystals formed at 25 °C was 10 times larger than that at 60 °C, which was attributed to the inhibition of microbial activity by the higher temperature [7]. However, the effects of bacterial solution (BS) concentrations and cementing solution (CS) concentrations on calcium carbonate characteristics are not clear. To solve this problem and analyze the underlying mechanisms, it is necessary to quantify the mineral content in calcium carbonate under different conditions. Currently, the main types of reinforcement contain the mixing method, one-way grouting method, and soaking method [8]. The mixing method provides relatively uniform reinforcement, but the one-time mixing of CS and BS results in low strength of the cohesive soil. Due to the immediate reaction of the mixed liquid, the one-way grouting method generates a large amount of accumulated calcium carbonate in the injected part. For silt or cohesive soil with a smaller particle size, the lower permeability may cause blockage at the beginning of the test. Guo et al. (2023) found that the contact area between CS, BS, and the sample was increased by the soaking method, and the permeability of chemicals was greatly enhanced by the fiber structure of geotextile molds, promoting the reaction process and preventing the cohesive soil from disintegrating in the solution [9]. Therefore, the soaking method was selected and geotextile was used to wrap the sample during soak.
Cohesive soil is the main soil type in the reservoir area, with the pore size and soil particle size between sandy soil and loess. The soil has poor erosion resistance and a shallow soil layer, and is subject to frequent natural disasters in the reservoir area, such as landslides, collapses, rolling stones, mudslides, etc. The vegetation coverage in the reservoir area is low, and soil erosion is very serious, which seriously threatens the safe operation of the reservoir area in natural conditions [10]. Therefore, it is necessary to reinforce it to achieve the purpose of disaster prevention and reduction. Environmentally friendly soil reinforcement technology is very important. MICP technology is a soil reinforcement technology with low energy consumption, no pollution, and sustainable advantages. Applying this technology to the reservoir area will help reduce the frequency of natural disasters and will not have adverse effects on the surrounding environment. MICP is currently widely used in sand reinforcement and has good effects. However, the particle size of cohesive soil is small, and its permeability is relatively low compared to sand, which is not conducive to the movement of bacteria [11,12]. MICP reinforcement of soil is difficult, and the reinforcement effect is not clear. At present, there is relatively little research on MICP reinforcement of cohesive soil.
Therefore, cohesive soil in the WuLiu reservoir area was collected and the particle size distribution was analyzed. The effects of different BS and CS concentrations on the crystal morphologies of calcium carbonates were investigated. Mechanical and thermochemical tests were carried out to evaluate the effectiveness of MICP in reinforcing cohesive soil. The results of this study not only improve the current understanding of the basic mechanisms in the formation of calcium carbonate, but also provide a theoretical basis for the reinforcement of cohesive soil in reservoir areas and a reduction in the probability of natural disasters.

2. Materials and Methods

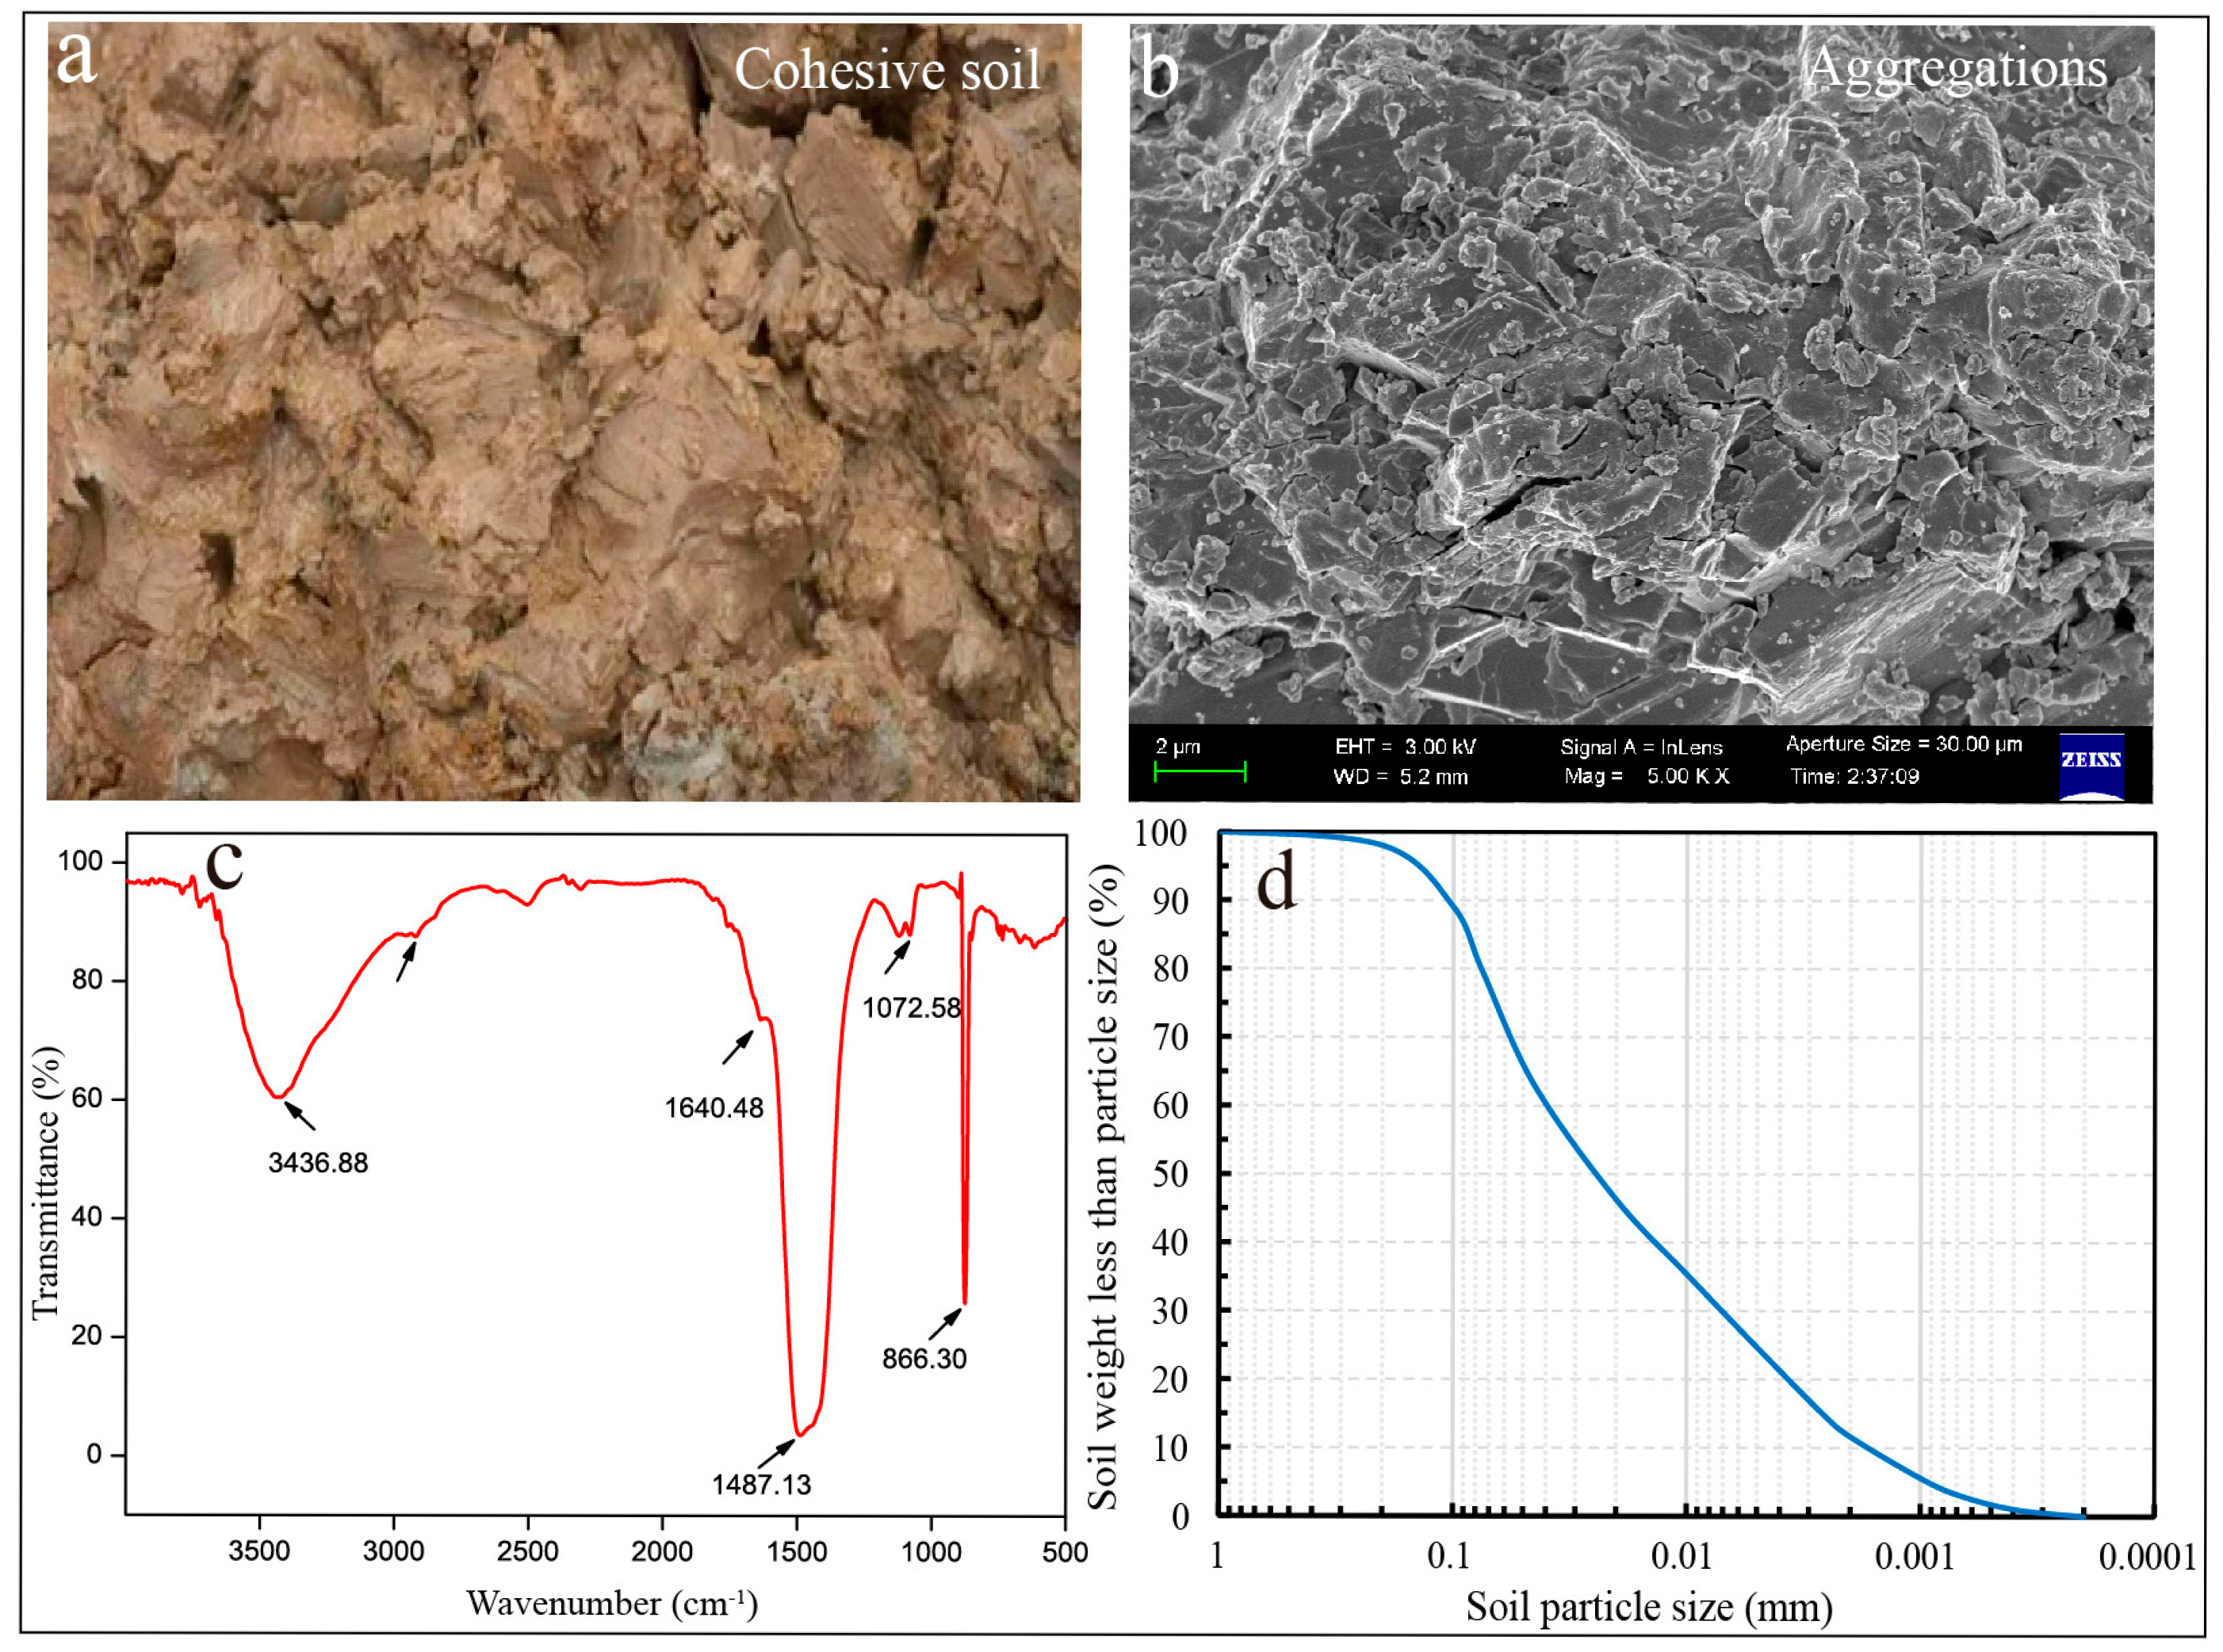
2.1. Source and Characterization of Cohesive Soil

Cohesive soil from the WuLiu reservoir area was used as the experimental soil, and was collected from Suzhou, Anhui Province, China (116~119° N; 33~39° E) [13]. Distinguishing between sandy and cohesive soil only did not cover other key soil types (e.g., silt, organic soil, etc.), whereas the particle size distribution, permeability, and mineral composition of different soils significantly affected the efficiency of cement infiltration and the homogeneity of the distribution of calcium carbonate in the MICP. The pore structure of pulverized soils was more likely to lead to localized retention of cementing fluid and reduce the reinforcement uniformity because the particle size was between sandy and cohesive soil. The high permeability of sandy soil was conducive to the diffusion of cement, but may lead to calcium carbonate precipitation concentrated in the shallow layer. Cohesive soil limited cement migration due to low permeability, requiring adjustments to the grouting method or cement concentration.
The sample was naturally air dried and sieved through a 200-mesh sieve to remove impurities. The morphology of dried cohesive soil was sprayed with gold for scanning electron microscopy (SEM, HITACHI, S-4800, Tokyo, Japan). The particle size distribution of the studied soil samples was measured by laser particle size analyzer (LPSA, Malvern Instruments Ltd., Mastersizer 2000, Malvern, UK). Then, 100–300 mg of sample was taken out and mixed with dispersing medium, adding an appropriate amount of dispersant and subjecting it to ultrasonic treatment for 5–10 min until no agglomeration. Next, 2–5 g of dry powder was adopted, adjusting the width of the sample tank and turning on the compressed air dispersing system. The function group absorption was analyzed by Fourier-transform infrared spectroscopy (FTIR, Thermo Fisher Scientific Inc, Nicolet 380, Waltham, MA, USA). The FTIR spectrogram was measured from 4000 to 500 cm−1 in a resolution ratio of 4 cm−1.

2.2. Bacterial Solution (BS) and Cementing Solution (CS)

During the MICP experiment, urease and cementing solution are secreted by microorganisms that can provide nitrogen and calcium sources. The strain used was Bacillus subtilis (ATCC11859, Hubei Zechuan Technology Co., Ltd., Hubei, China), with high urease activity in the alkaline environment, It is a rod-shaped aerobic Gram-positive bacterium with a length of 2–3 μm. It was stored in a freeze-drying tube in the form of freeze-dried powder under vacuum. Then, the bacteria were inoculated into a liquid medium (beef extract 10 g/L, tryptone 10 g/L, NaCl 6 g/L and tris base 10 g/L) to obtain a highly active BS [14]. The BS was incubated in an electrically operated thermostatic incubator with a speed of 150 rpm at 25 °C for 24 h. The same solvent as the bacterial solution (e.g., sterile water) was used as a blank control. The wavelength of the spectrophotometer was set as 600 nm. Then, the BS concentrations were expressed by the value of OD600. Bacteria were inoculated into urea-containing liquid medium and incubated at suitable temperature until the logarithmic phase. The supernatant was collected by centrifugation as the tested sample. The urea-containing reaction solution was obtained by dissolving urea in a buffer (e.g., pH 6.7 phosphate buffer). An appropriate amount of reaction solution was taken and added to the measurement cell of the conductivity meter and the initial conductivity value was recorded. The sample to be measured was added and the conductivity value was determined. It was converted to microbial urease activity by plotting the conductivity versus time curve.

2.3. Process of MICP

To investigate the effect of CS and BS concentration on the reinforcement of cohesive soil by MICP, four CS concentration levels of 0.5, 1.0, 1.5, and 2.0 mol/L (M) and four BS concentration levels of OD600 = 0.6, OD600 = 1.2, OD600 = 1.8, and OD600 = 2.4 were set. For ease of understanding, the sample with a CS concentration of 0.5 M and OD600 = 0.6 was numbered Z 0.5–0.6. Other samples are numbered similarly to this method. In the next series of experiments, all tests were performed at a temperature of 25 °C and an initial solution pH of 7. The detailed experimental conditions are summarized and presented in Table 1.
The cohesive soil was loaded into the sampler. Compaction was carried out in three layers in the sample maker, and the contact surface of each layer was shaved. The diameter and height of the soil sample were 4 cm and 8 cm, respectively. After being saturated in a vacuum for 12 h in a saturation cylinder, it was stored in a moisturizing cylinder. The triaxial specimen was wrapped with a layer of 1.5 mm thick black geotextile. All soil samples were placed in a soaking container (transparent high-hardening plastic container, 10 cm × 10 cm × 10 cm). The entire container was placed in a constant temperature box at 25 °C to ensure consistent temperature during the biochemical reaction [15]. Then, 300 mL of BS was added to the soaking container for 4 h to ensure that the sample was completely submerged. Then, 300 mL of CS was added after soaking for 4 h. In this way, it can be determined that the BS penetrated more into the gaps between soil samples by first soaking the sample in pure BS, improving the cementation degree. The samples were dried naturally and used for subsequent experiments.

2.4. Characteristics of Calcium Carbonate

The sample was divided into upper, middle, and lower parts for cutting, and each part was placed in an oven for drying at 105 °C. Then, 10 g of powder sample was taken after being ground to determine the calcium carbonate content using the acid washing method. The specific method was that excess 1.0 mol/L hydrochloric acid was added to soak the sample for 12 h until it was completely dissolved and no obvious bubbles were produced. Then, the sample was washed with distilled water and left to stand for 24 h before using a pipette to extract the supernatant, ensuring that quality was not lost. Finally, the sample was placed in an oven and dried at 105 °C until constant weight. The percentage content of calcium carbonate represented the ratio of the mass of calcium carbonate generated to the original mass, denoted as M (%), as shown in Equation (3).
M = M 1 M 2 M 1 × 100 %
Here, M1 is the mass of the soil sample to be tested, g; M2 is the mass of the soil washed with distilled water and dried, g. SPSS 24 software was used for data processing and significant difference analysis [16,17].

2.5. Mechanical Tests

Shear strength is the ability of a portion of cohesive soil to resist shear damage by sliding relative to another portion of soil when subjected to an external force [18,19]. The engineering properties and stability of cohesive soils were assessed by determining their ultimate strength to resist shear damage. The unconsolidated undrained shear tests were conducted using a strain-controlled triaxial apparatus (Nanjing Soil Instrument Factory, TSZ30-2.0, Nanjing, China). The net confining pressure for the test was set to 100, 200, and 300 kPa, and the test was carried out at a shear rate of 0.8 mm/min until the maximum axial strain reached 20% or the sample was destroyed. By plotting Mohr’s circle for states with (σ1 + σ3)/2 as the center and (σ1σ3)/2 as the radius at different confining pressures, the shear strength lines were obtained to further determine the cohesion (c) and internal friction angle (φ).

2.6. Thermal Analysis

Thermal analysis techniques can help us to understand the physical and chemical changes in cohesive soil under different temperature conditions, predicting the strength and stability of the soil. The samples were placed on a high-precision balance at a constant rate of heating and analyzed by using the thermal analyzer (METTLER TOLEDO Co., TGA/DSC1/1600LF, Zürich, Switzerland). As the temperature increased, the physical or chemical changes (e.g., dehydration, decomposition, oxidation, etc.) were recorded in TG data, which reflected an increase or decrease in mass loss. The powdered samples were sieved through a 200-mesh sieve to ensure consistent particle size of the cohesive soil after drying. Then, 10 mg of the sample was removed and placed in a thin layer at the bottom of a heat-resistant crucible. The temperature range was set from 50 °C to 1000 °C at a heating rate of 10 °C/min. In addition, nitrogen was continuously added as a protective gas during the pyrolysis process to prevent the sample from being oxidized in the high temperature [20]. At the end of the thermal decomposition process, TG curves were plotted according to the relationship between mass and temperature at different moments using Origin Lab 9.5 software.

3. Results

3.1. Characterization of Cohesive Soil

The morphological characteristics of cohesive soil are shown in Figure 1a,b. Soil color is usually dominated by brown and gray. Cohesive soil often develops slip surfaces along water-rich layers or bedrock contacts, with creep-slip marks or microcracks visible on the surface. These spherical particles can also be aggregated into clusters to form larger aggregates with a diameter of 200 μm. As shown in Figure 1c, the cohesive soil was analyzed by FTIR from the range of 4000–500 cm−1. The spectra exhibited an absorption peak at 1072.58 cm−1 which originated from the V1 mode (the symmetric stretch in the non-centrosymmetric structure). The next absorption band at 866.30 cm−1 may be due to the V2 mode (carbonate out-of-plane bending) and the absorption band at 1487.13 cm−1 might be due to the V3 mode (the asymmetric stretch) [21]. The characteristic absorption peak corresponding to V4 mode (mainly associated with functional groups such as carbonyls, carboxylic acids, and esters) seemed to emerge in 500–1000 cm−1. Furthermore, the absorption peak at 1640.48 cm−1 as well as 3436.88 cm−1 may be derived from C=C double bond stretching vibrations and hydroxyl (-OH) stretching vibrations [22].
The particle size distribution of the studied soil samples was measured by LPSA and the specific particle size distribution is shown in Figure 1d. The results showed that the sand particle content (0.075–2 mm) was 19.49%, the powder particle content (0.005–0.075 mm) was higher at 56.75%, and the clay particle content (<0.005 mm) was 23.76%, and the content of each particle group is shown in Table 2. According to the soil classification method in the “Geotechnical Engineering Investigation Specification” (GB 50021-2009), this typical cohesive soil was defined as silty soil [23].

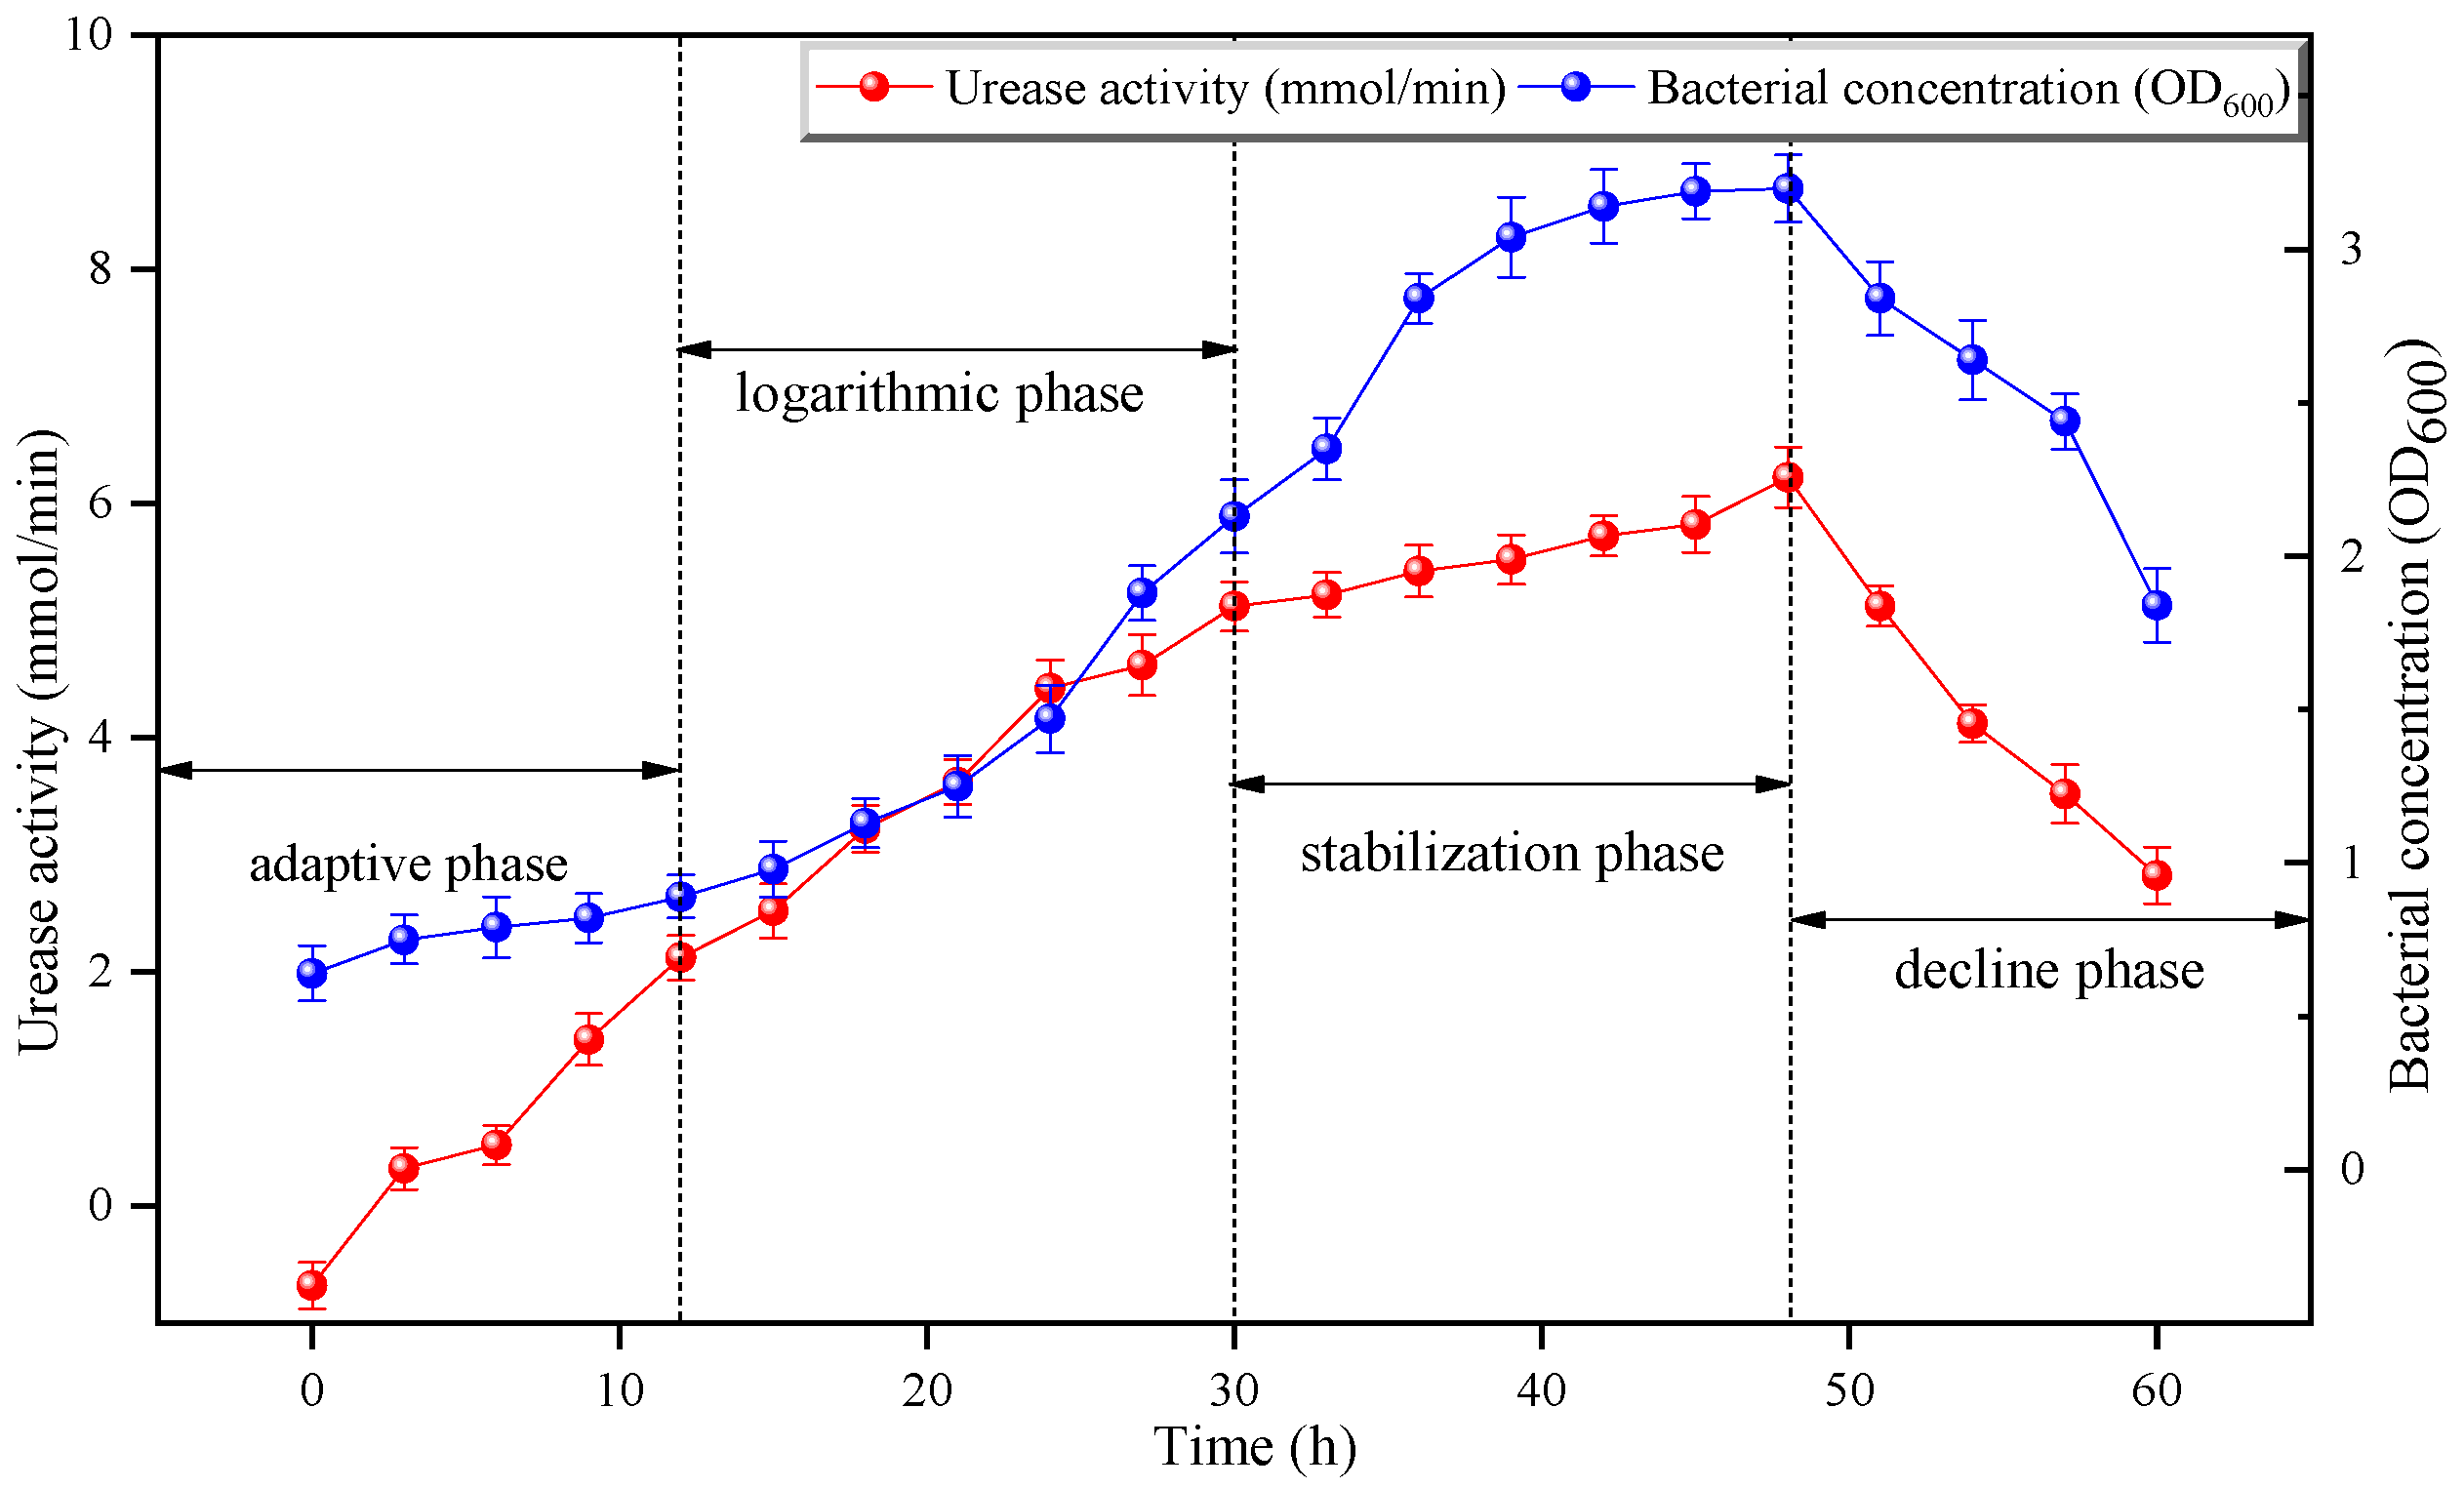
3.2. Bacterial Concentration and Urease Activity of Bacteria

The components of the liquid culture medium were beef extract (5 g/L), tryptone (10 g/L), and NaCl (5 g/L). The pH value was adjusted to 7.0–7.2 by NaOH and HCl solutions. The results of bacterial concentration (OD600) and urease activity are shown in Figure 2. The growth process of bacteria consisted of four phases, which were adaptive phase, logarithmic phase, stabilization phase, and decline phase. The bacterial concentration reached its maximum value at 48 h, which corresponded to a peak urease activity with 6.72 mmol/min. After 48 h, there was a decrease in the bacterial concentration due to the depletion of nutrients in the culture medium. Therefore, bacteria cultured for 48 h were selected to induce calcium carbonate precipitation.

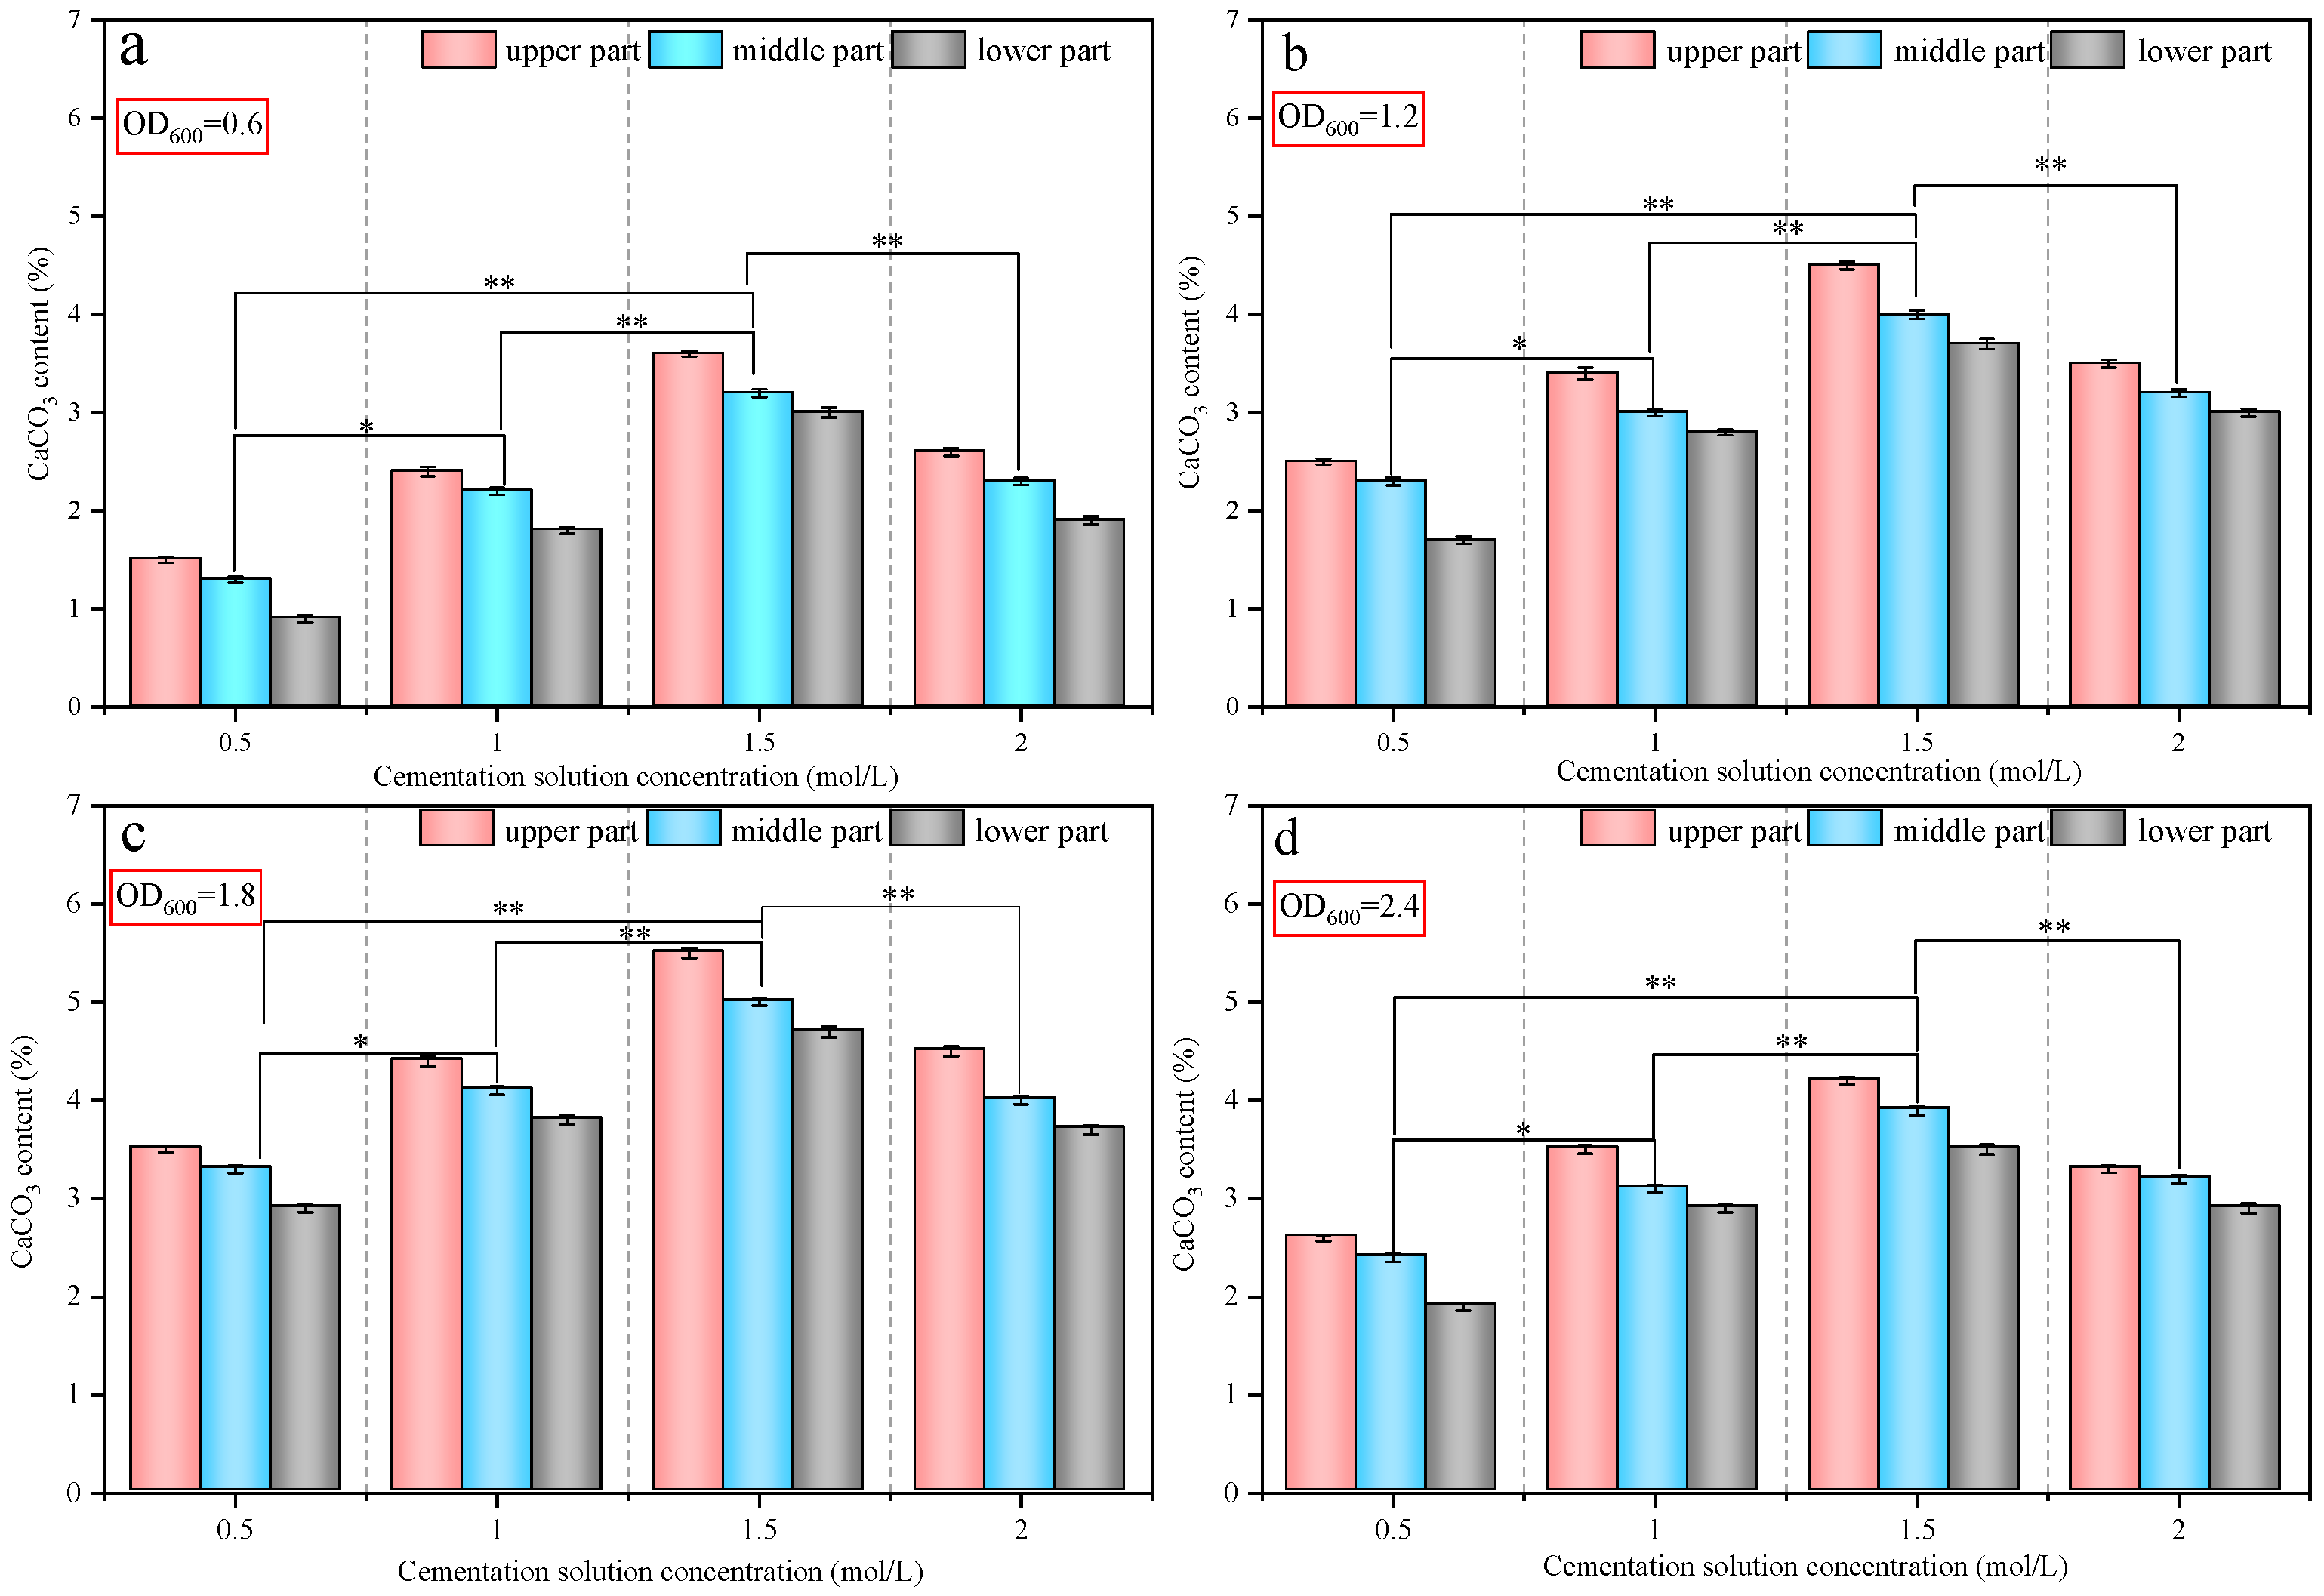
3.3. Calcium Carbonate Content

The average calcium carbonate content of the sample increased many times compared to the original calcium carbonate content in the cohesive soil after undergoing MICP, indicating that a large amount of calcium carbonate was generated in the pores of the soil sample. The concentration of BS and CS had a significant effect on the content of calcium carbonate, as shown in Figure 3. At the same concentration of BS, as the concentration of CS increased, the average calcium carbonate content showed a trend of first increasing and then decreasing, reaching its maximum value at a CS concentration of 1.5 M. At the same concentration of CS, as the concentration of BS increased, the average calcium carbonate content also showed a trend of first increasing and then decreasing, reaching its maximum value when the OD600 value of the BS was 1.8. To summarize, the calcium carbonate content tended to increase and then decrease with the increase in BS and CS concentrations (Figure 3a–d), which may be due to the insufficient number of bacteria at low BS concentrations, leading to the production of less calcium carbonate. The bacterial population was excessive and consumed more material energy at high BS concentrations, and the production of calcium carbonate no longer increased but decreased [24]. In addition, the Ca2+ concentration would inhibit the microbial activity at a high CS concentration of 2.0 M, and the efficiency of calcium carbonate conversion would be greatly reduced.
There were differences in the content of calcium carbonate in different parts of the sample, showing a variation pattern of upper > middle > lower and indicating that the distribution of calcium carbonate in the sample was not uniform (Figure 3a–d). The main reason for this phenomenon was the poor permeability of the cohesive soil. Calcium carbonate generated in the upper pores tended to block the pores and lead to solution buildup [25]. The BS and CS flowed slowly through the pores of the sample, which resulted in the upper cohesive soils being the first to come into contact with sufficient BS and CS. The microbially induced calcium carbonate precipitates were the most abundant and filled in the pores of the cohesive soil. The remaining BS and CS traveled sequentially along the pores to the middle and bottom of the sample, corresponding to the production of calcium carbonate precipitates [26,27].

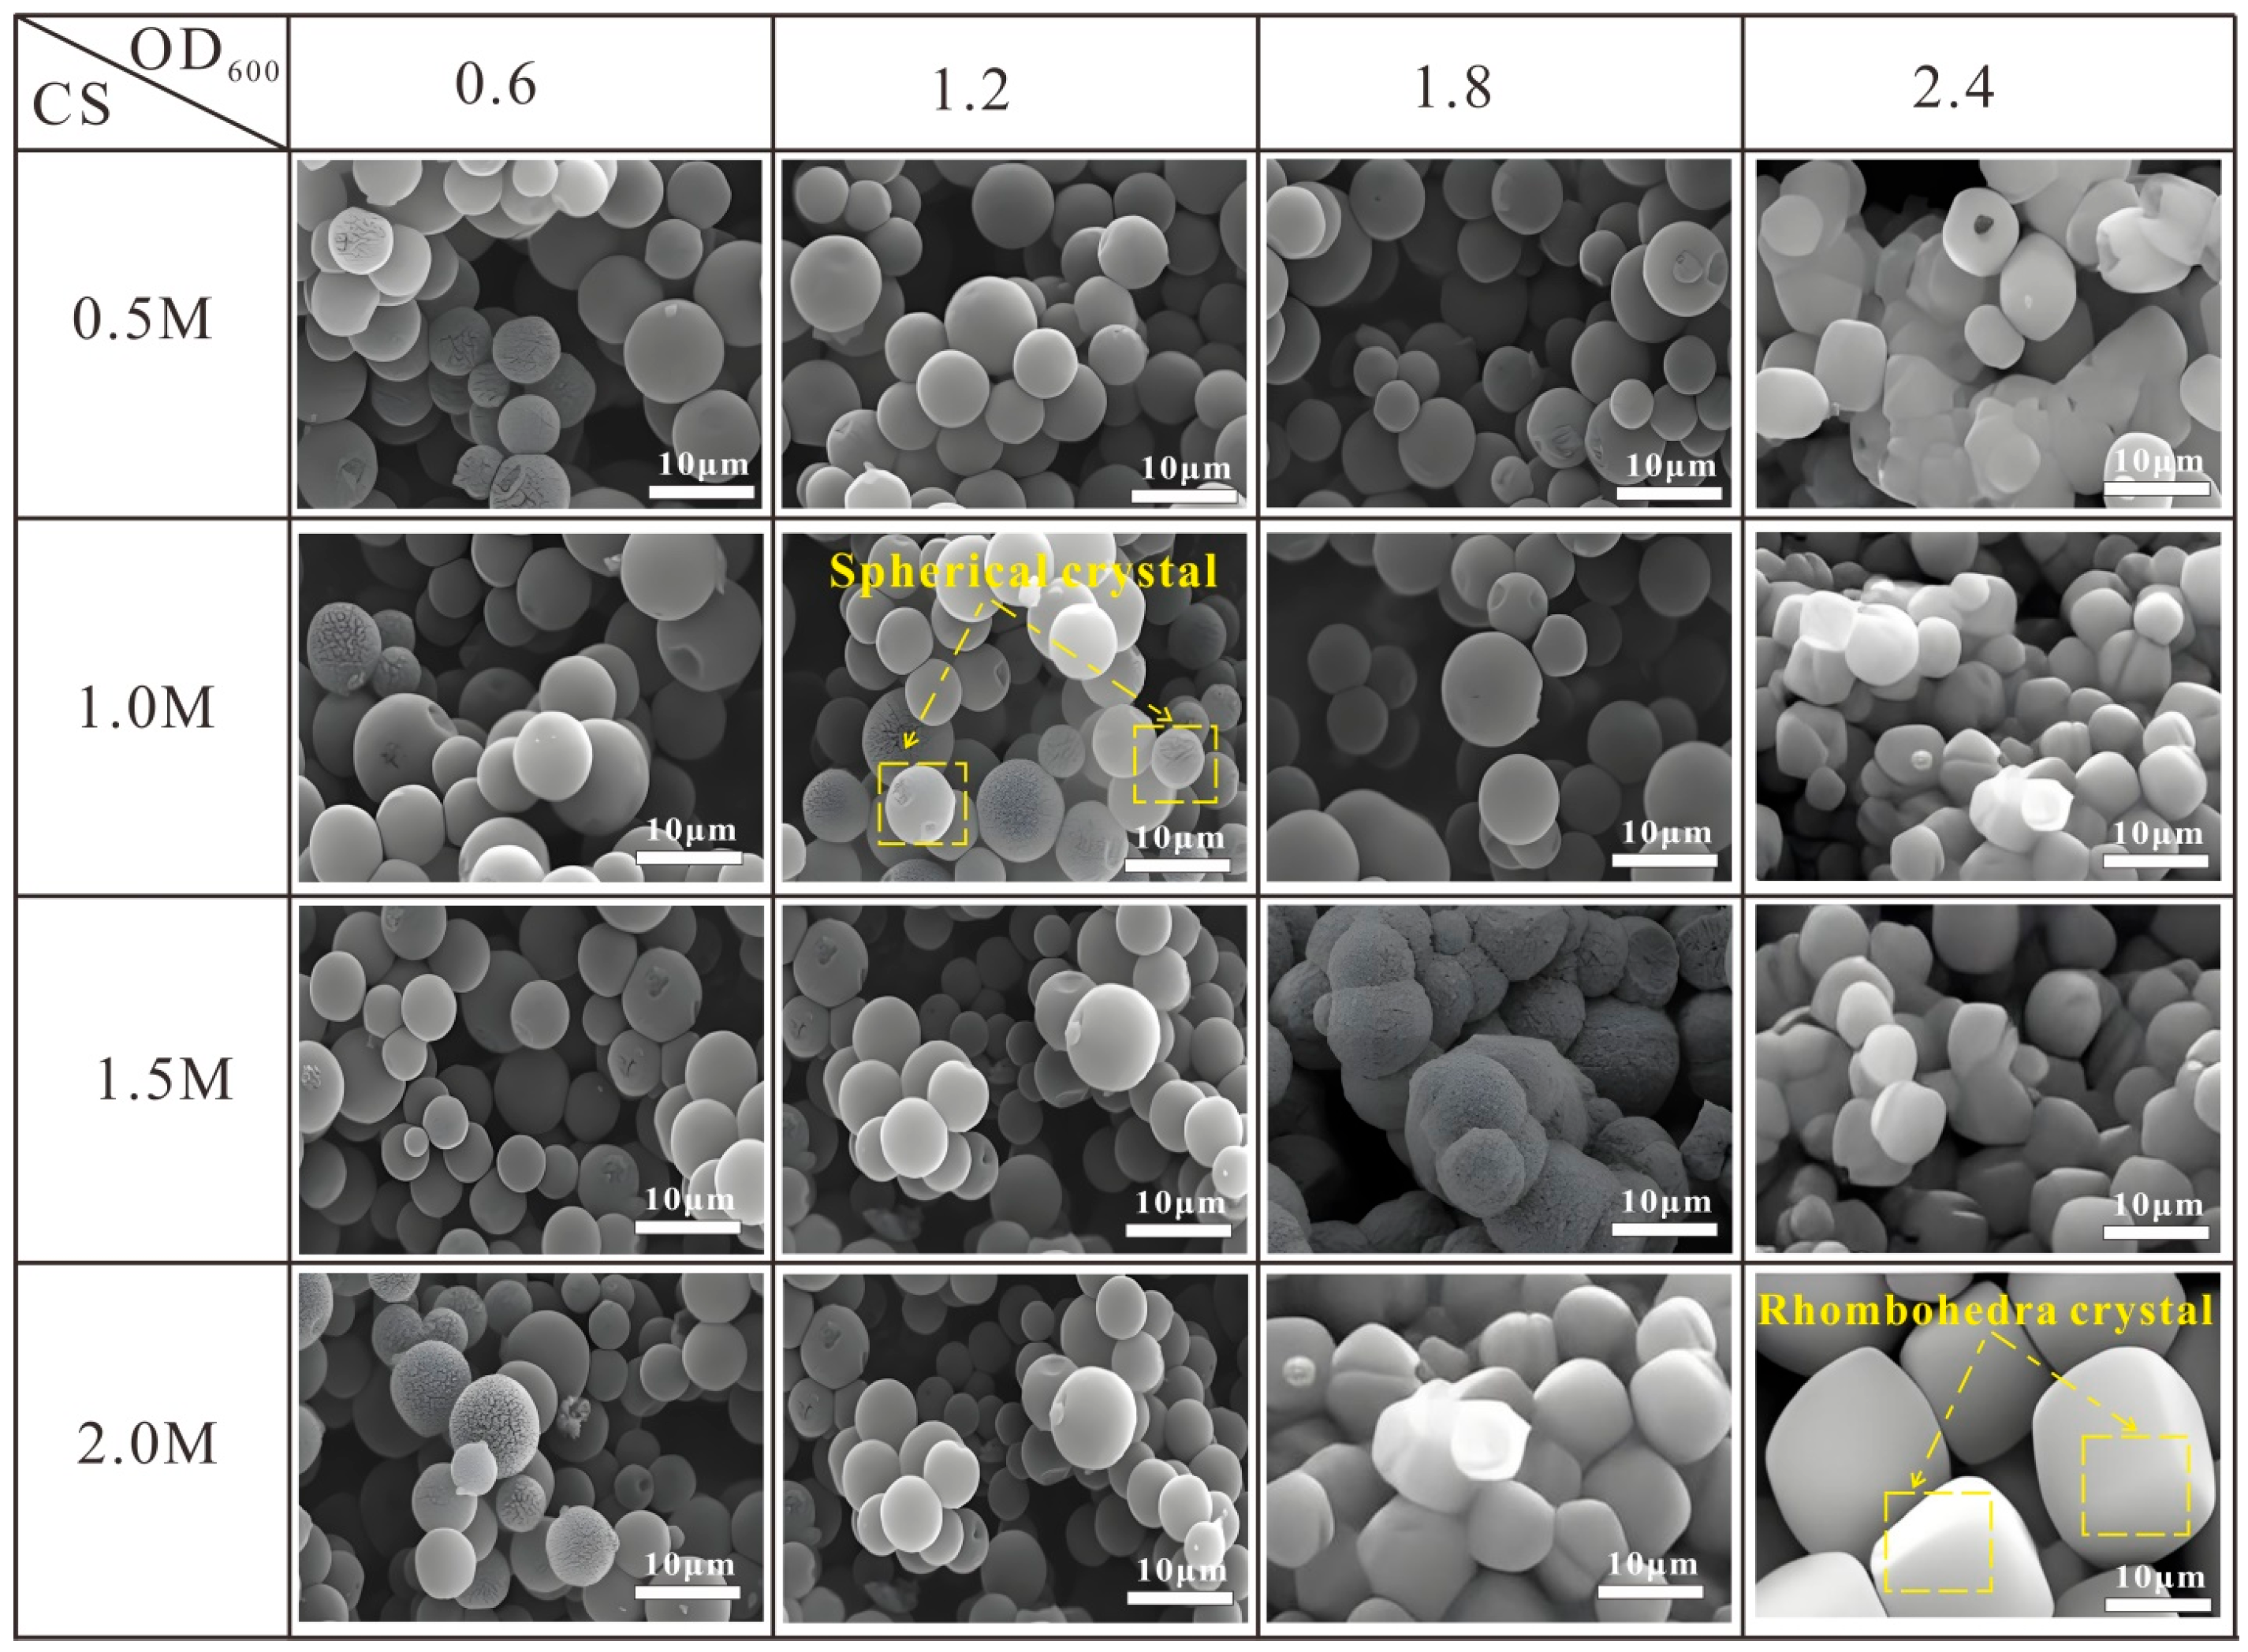
3.4. Morphological Characteristics at Different CS and BS Concentrations

Figure 4 shows the morphological changes in calcium carbonate minerals at different combinations of CS and BS concentrations. The surface of the unreinforced soil sample was not smooth and the boundary was not clear, as shown in Figure 1a,b. The structure of the soil samples changed significantly after reinforcement; the soil pores were filled with calcium carbonate crystals, and calcium carbonate precipitation was observed in all parts. A large number of spherical and rhombohedral calcium carbonate crystals were found. They interlocked with each other and kept stacking in contact, forming a multilayer calcium carbonate crystal superposition cover. Among them, the morphologies of calcium carbonate crystals were mainly spherical crystals at low combinations of CS and BS concentrations. The surface of the spherical crystals was smooth and the diameter of the crystals was inconsistent, ranging from 5 μm to 20 μm. The spherical crystals gradually disappeared and the rhombohedral shape appeared with the increase in BS concentration, and the angles of the crystals were clear. Calcium carbonate crystals continued to grow at high concentrations, with a diameter of 40 μm. In particular, the calcium carbonate crystals were all a rhombohedral shape with the highest BS concentration (OD600 = 2.4), regardless of the CS concentrations. These two different shapes of calcium carbonate crystals and soil particles were cemented together, occluding each other to improve the integrity and stability of the cohesive soil.
A higher BS concentration of microorganisms secreted more urease, which accelerated the hydrolysis of urea to NH4+ and CO32−, significantly increasing the local pH value [28,29]. Alkaline environments (pH > 8.5) were more favorable for the formation of thermodynamically stable rhombohedral crystal than sub-stable spherical crystal. In addition, the ability of negatively charged functional groups on the microbial cell surface to adsorb Ca2+ increased with increasing concentration, resulting in the formation of more evenly distributed nucleation sites. The dense nucleation sites induced the directional growth of crystals along specific crystal faces and inhibited the random accumulation of spherical crystals [30].

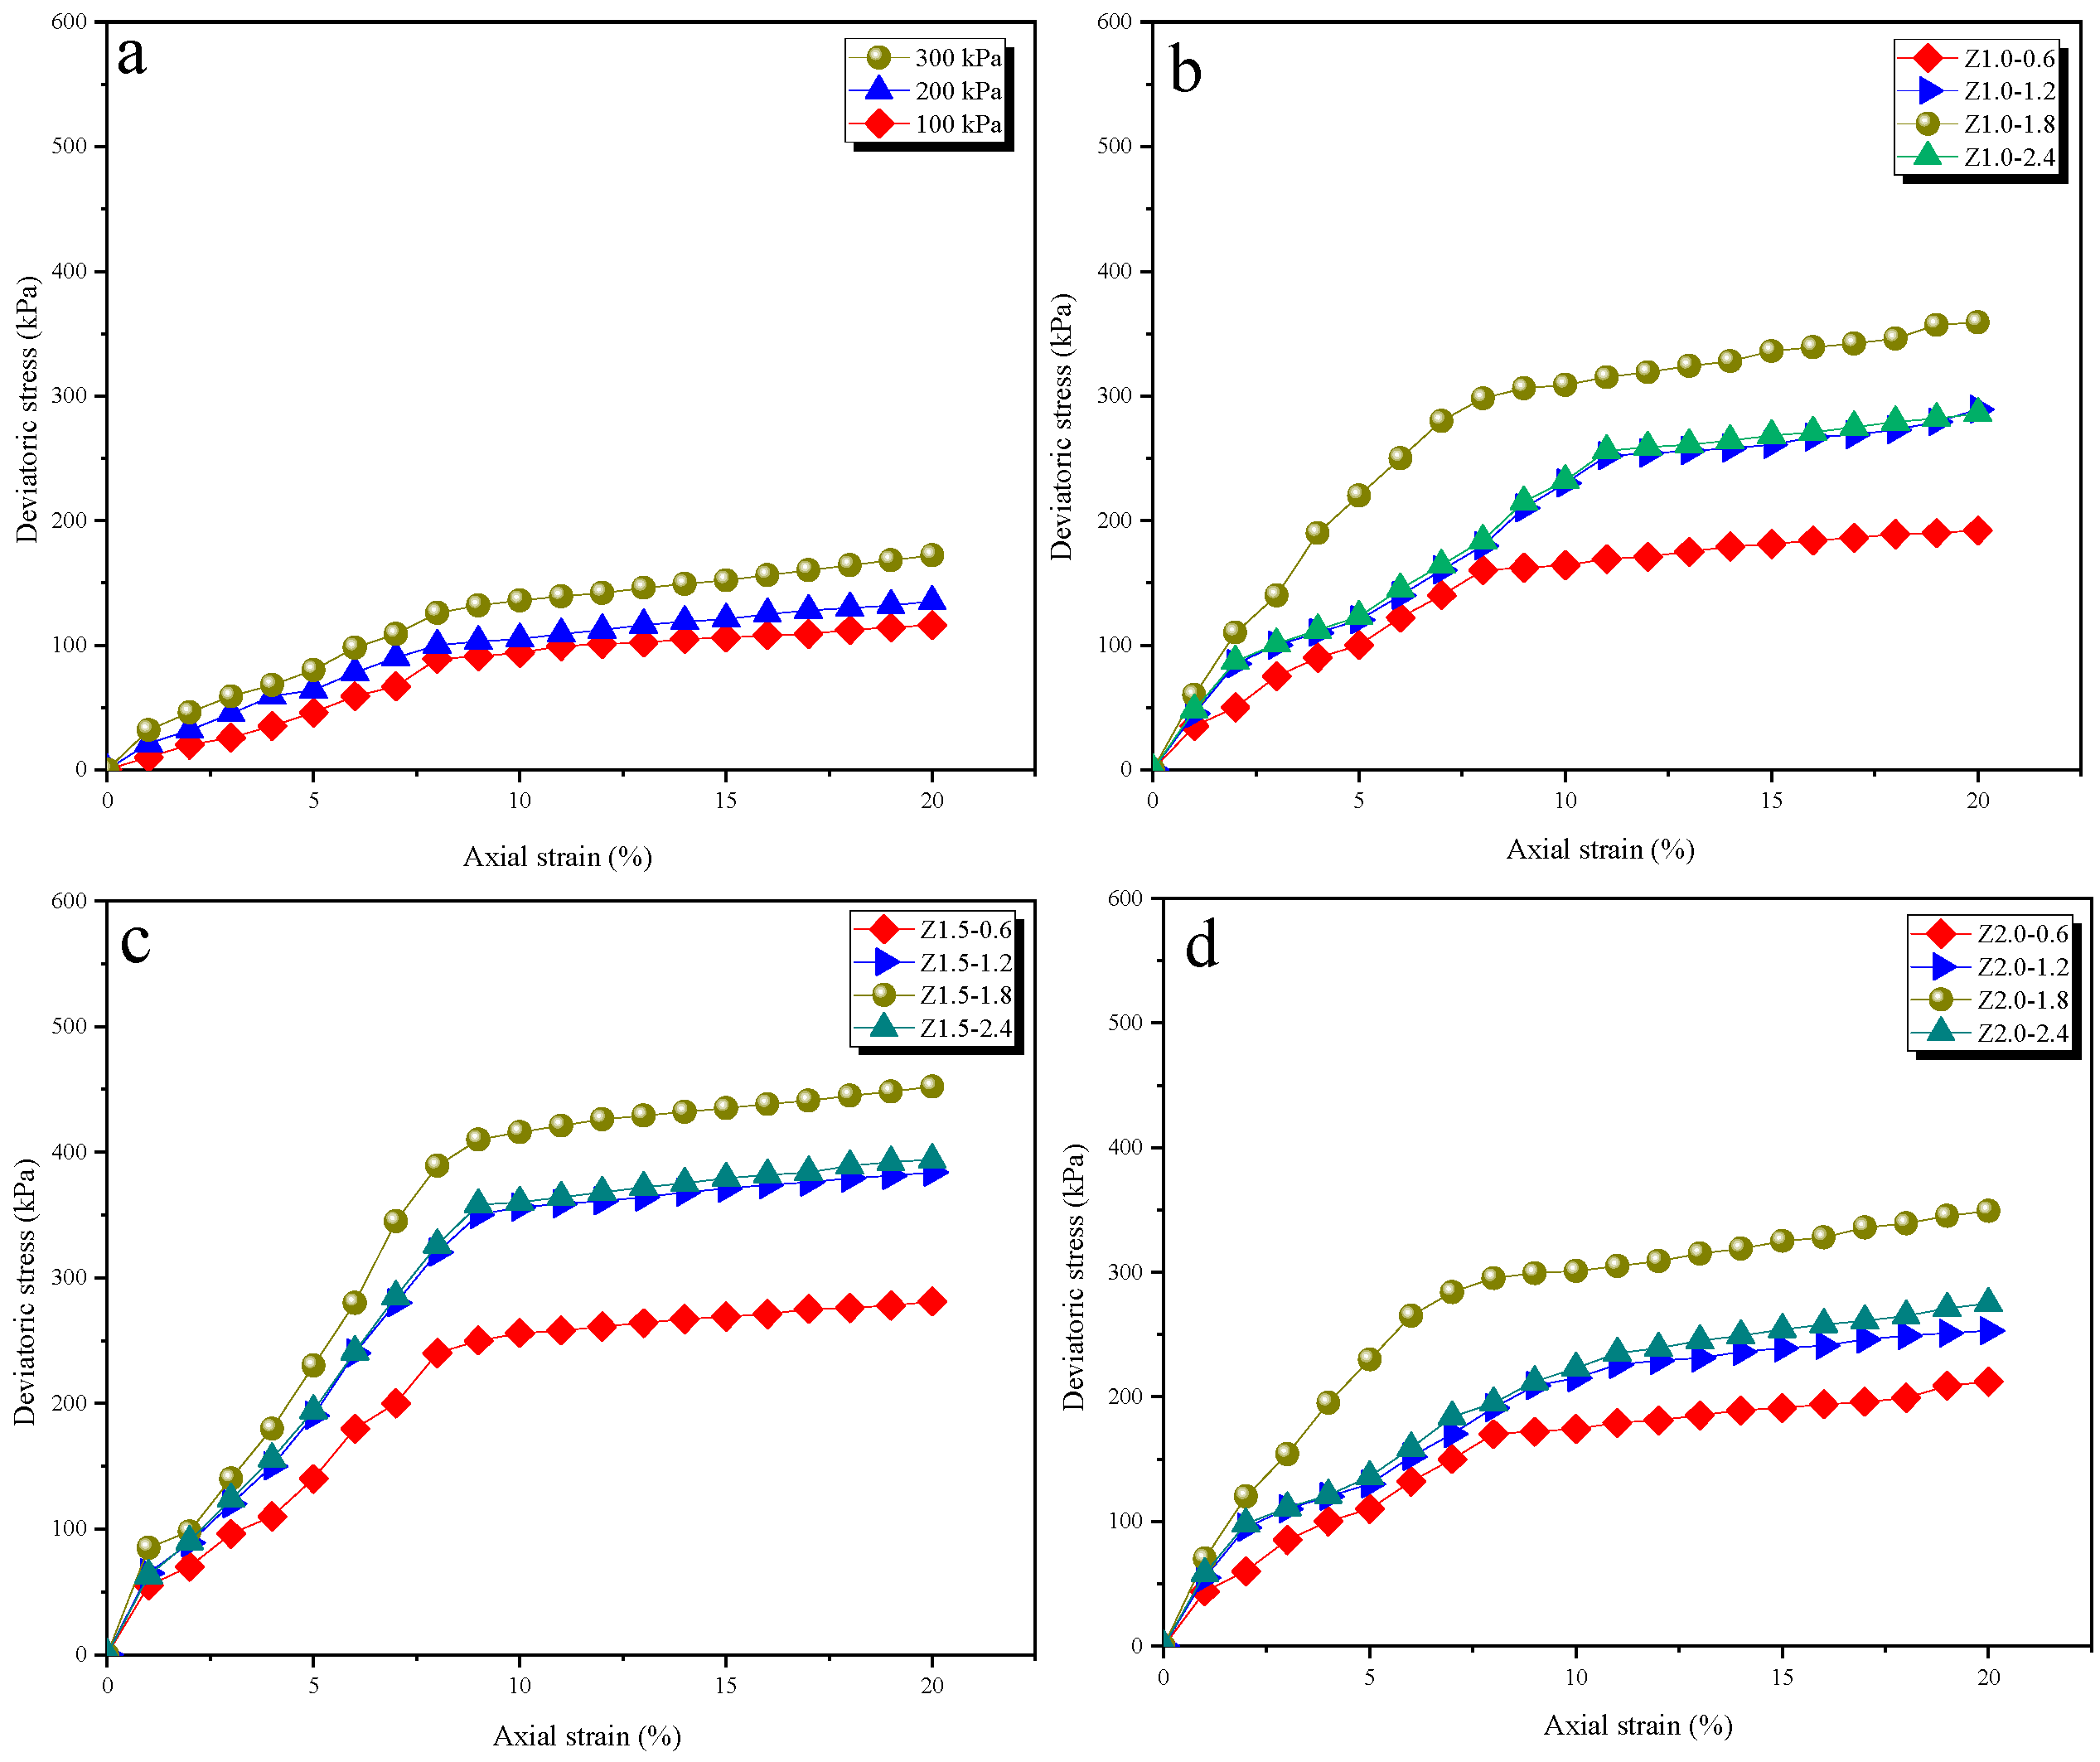
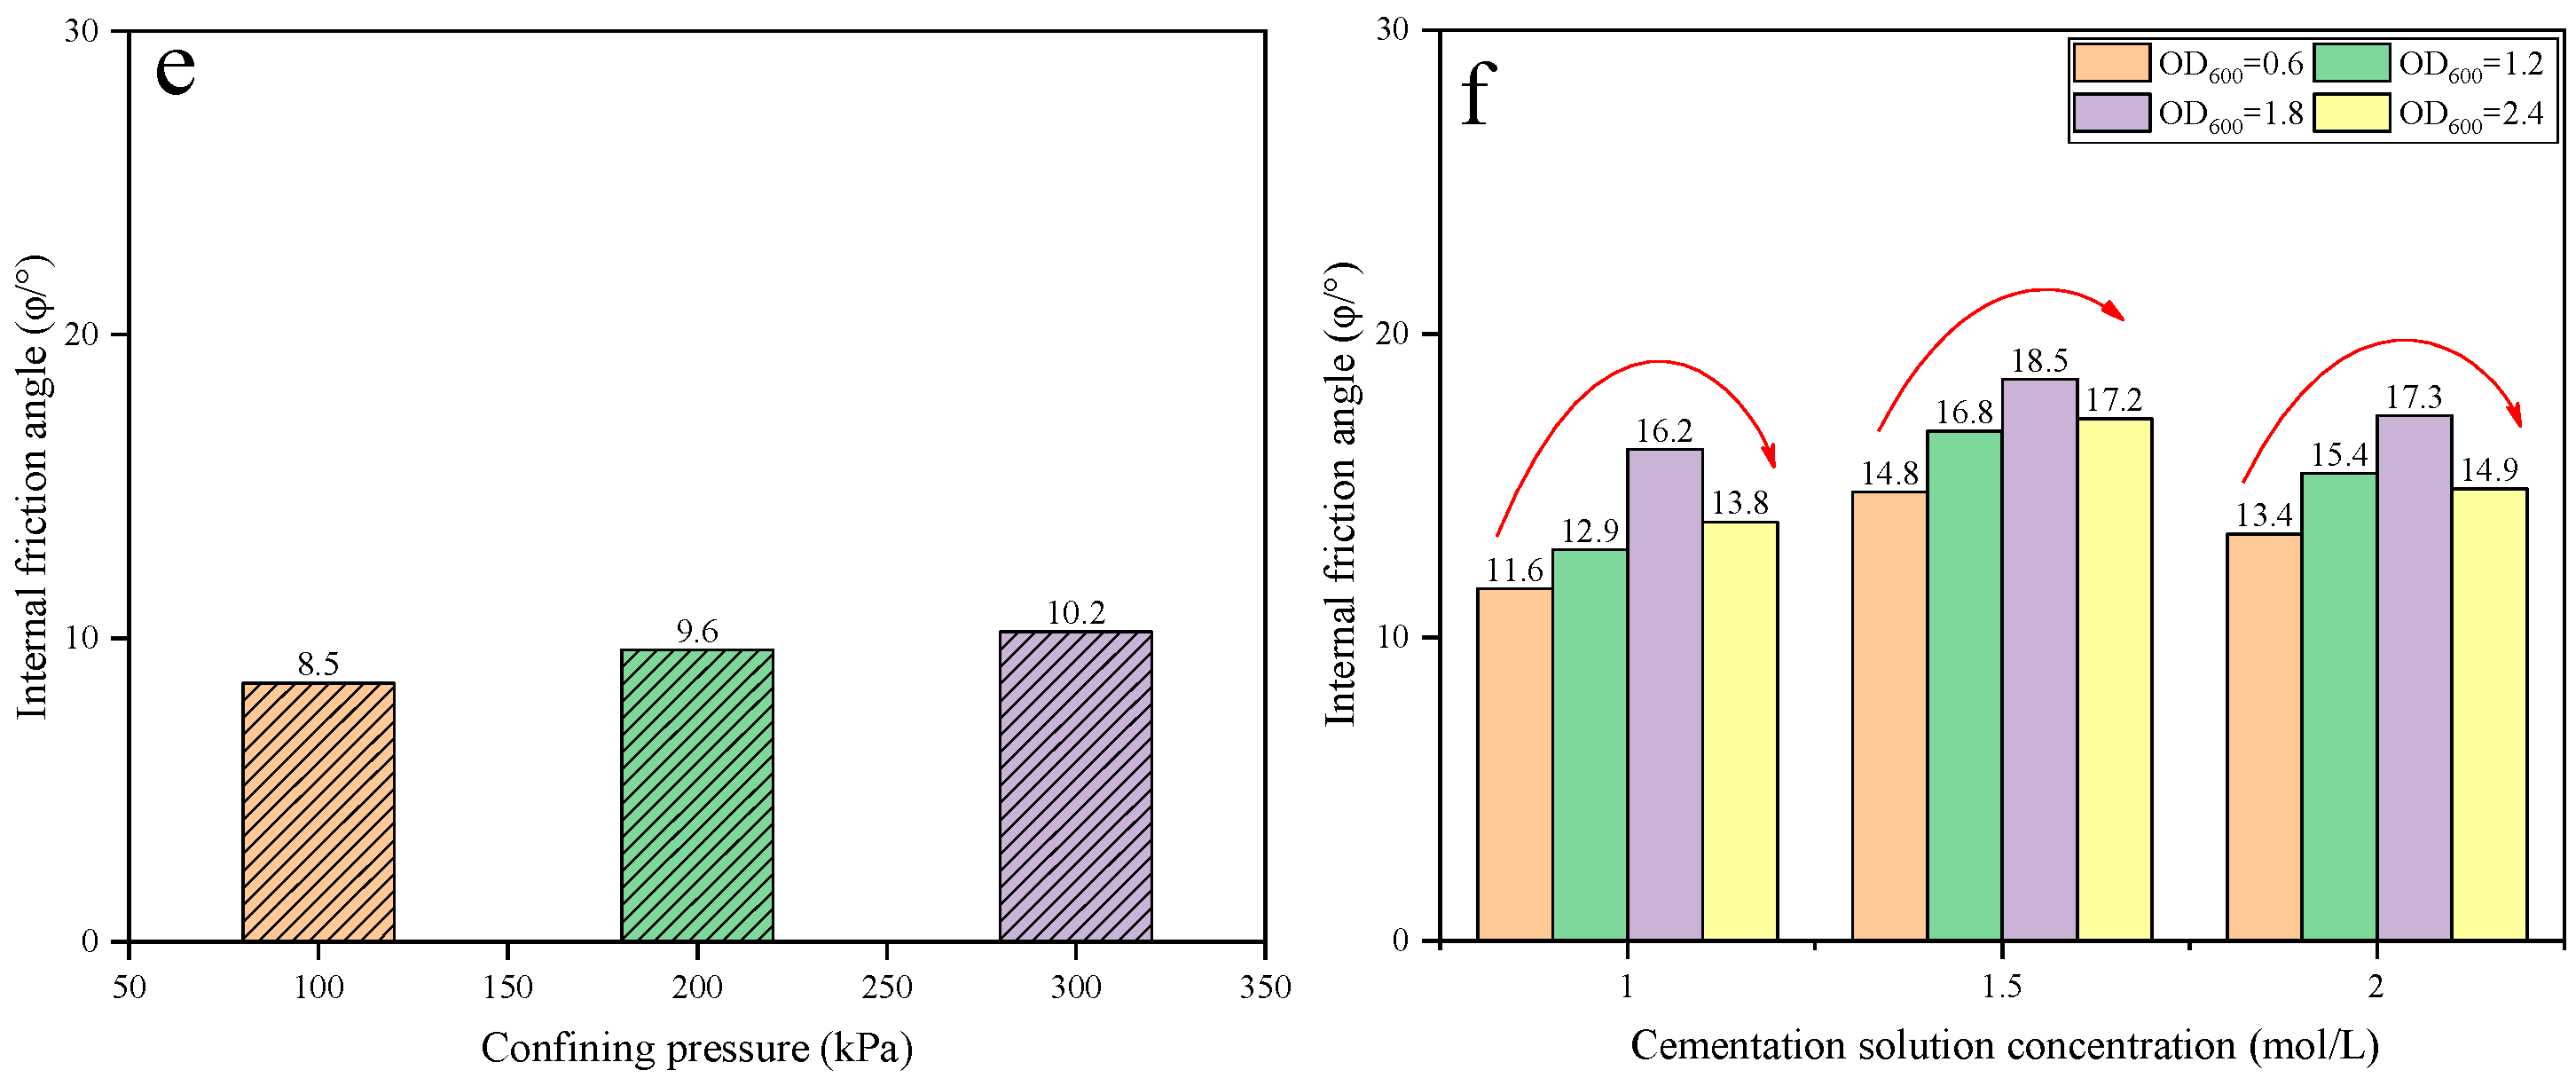
3.5. Mechanical Characteristics

As shown in Figure 5, the strength of calcium carbonate and the reinforcing effect of MICP can be reflected by the mechanical characteristics of the cohesive soil. The stress–strain curves of the unreinforced soil samples were generally of hardening type [31,32]. Specifically, deviatoric stress rose with the increase in axial strain, roughly linearly (initial yielding stage), and then the increasing trend gradually slowed down, and its strain hardening modulus was relatively small (stress strengthening stage). At the same time, the stress–strain curve shifted upward with the increase in the confining pressure, ranging from 100 kPa to 300 kPa (Figure 5a).
The change rules of the stress–strain curves of the soil samples at a confining pressure of 300 kPa were basically the same as those before MICP reinforcement, indicating that the MICP reinforcement did not affect the change rules of stress–strain and damage mode. The stress–strain curves of the soil samples were shifted upward after reinforcement, which indicated that the strength of the cohesive soil was improved after MICP treatment. According to the results presented in Figure 5b–d, both CS and BS concentrations had a significant effect on the deviatoric stress of the microbially induced calcium carbonate. When the CS concentration was determined (CS = 1.0, 1.5 and 2.0 M), the deviatoric stress of the soil samples gradually increased with increasing BS concentration. In particular, the deviatoric stress reached its maximum value with the BS concentration (OD600 = 1.8). A decrease in the value of deviatoric stress occurred corresponding to the BS concentration (OD600 = 2.4). Alternatively, a decrease in the value of deviatoric stress occurred when the CS concentration was 2.0 M. Combining the effects of all the combinations of CS and BS on the soil samples, it can be found that the optimal combination to maximize the strength of the cohesive soil was CS = 1.5 M and OD600 = 1.8.
In addition, the relationships between other mechanical characteristics, including shear strength, cohesion, and internal friction angle, and CS-BS concentrations are shown in Figure 6. The shear strength of the cohesive soil before MICP treatment was 115 kPa, 135 kPa, and 172 kPa under the confining pressures of 100 kPa, 200 kPa, and 300 kPa, respectively (Figure 6a). The variation patterns under different confining pressures were the same. Taking a confining pressure of 300 kPa as an example, for 1.0 M CS concentration, the shear strength was 192 kPa, 209 kPa, 249 kPa, and 216 kPa corresponding to the different BS concentrations (OD600 = 0.6, 1.2, 1.8 and 2.4). For 1.5 M and 2.0 M CS concentration, the shear strength ranged from 201 to 299 kPa and 208 to 259 kPa, respectively (Figure 6b), indicating that the shear strength of soil samples after MICP treatment was significantly higher than that of soil samples before MICP treatment. In addition, at the same CS concentration, the shear strength showed a trend of first increasing and then decreasing with the increase in the BS concentration. At the same BS concentration, as the concentration of bacterial solution increased, the shear strength also showed a trend of first increasing and then decreasing with the increase in the CS concentration, reaching its maximum value with optimal combination (CS = 1.5 M and OD600 = 1.8). After MICP reinforcement, the shear strength of the cohesive soil increased by 11.6%~73.8%, with the least and most increased combinations being Z 1.0–0.6 and Z 1.5–1.8, respectively.
Indices of soil shear strength included cohesion (c) and internal friction angle (φ). Among them, cohesion (c) reflected the cementation between soil particles, while internal friction angle (φ) represented the frictional resistance between soil particles. These two indices can evaluate the ability of cohesive soil to resist shear damage. As shown in Figure 6c, the cohesion was 15 kPa, 18 kPa, and 22 kPa before MICP treatment under the confining pressures of 100 kPa, 200 kPa, and 300 kPa, respectively. For 1.0 M CS concentration, the cohesion was 26 kPa, 30 kPa, 38 kPa, and 32 kPa corresponding to the different BS concentrations (OD600 = 0.6, 1.2, 1.8 and 2.4). For 1.5 M and 2.0 M CS concentration, the cohesion ranged from 31 kPa to 43 kPa and 29 kPa to 40 kPa, respectively (Figure 6d). Overall, the cohesion of the sample increased by 18.2% to 95.4%, with the least and most increased combinations being Z 1.0–0.6 and Z 1.5–1.8, respectively. As shown in Figure 6e, the internal friction angle was 8.5, 9.6, and 10.2 before MICP treatment under the confining pressures of 100 kPa, 200 kPa, and 300 kPa, respectively. After MICP reinforcement, the shear strength of the cohesive soil increased by 13.7%~81.3% at the same optimal combination (CS = 1.5 M and OD600 = 1.8) in Figure 6f. Furthermore, the change rules of the cohesion (c) and internal friction angle (φ) corresponding to different CS-BS combination concentrations were the same as that in shear strength.
After reinforcement, both the cohesion and internal friction angle improved, with the cohesion increasing significantly compared to the internal friction angle. This may be due to the cementation effect of calcium carbonate crystals generated in the gaps between soil particles, increasing the cohesion. The calcium carbonate crystals generated on the surface of soil particles increased the roughness, increasing the internal friction angle [33,34]. This was similar to the findings investigated by Zhang et al. (2015), where the increase in cohesion was much greater than that in internal friction angle, and cohesion dominated the strength improvement [35].

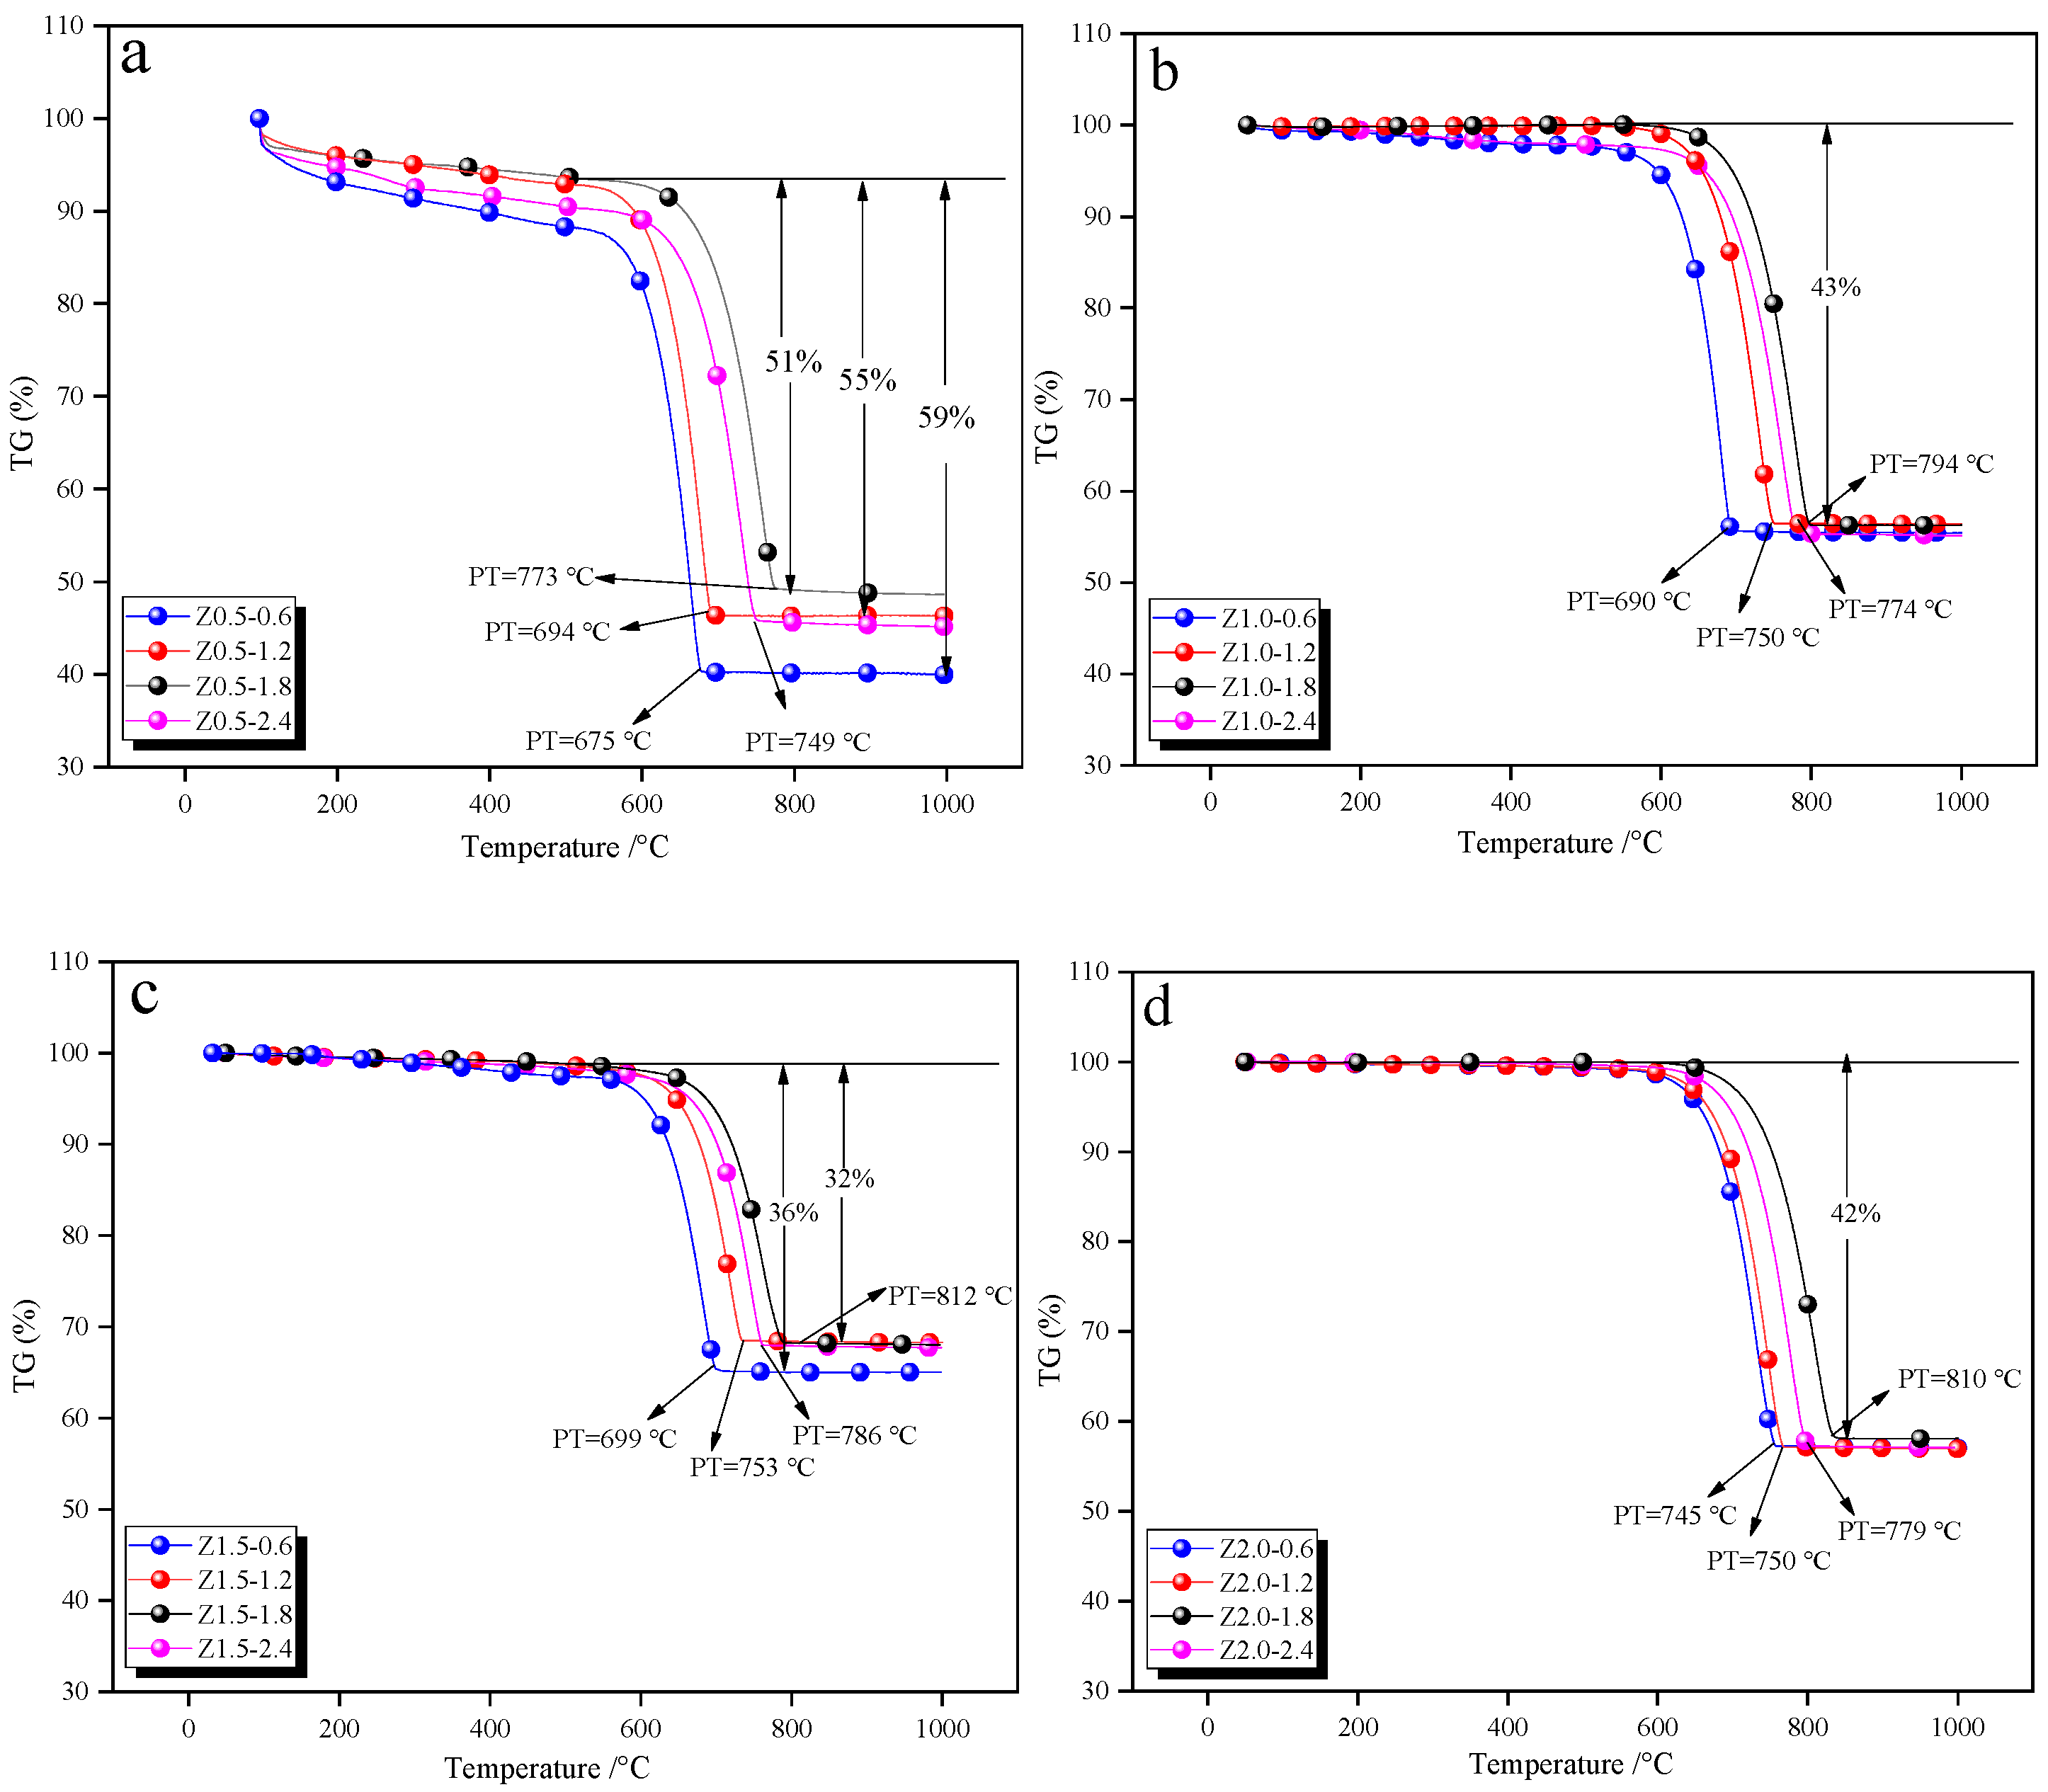
3.6. Thermal Stability Characteristics

Thermal stability analysis of cohesive soil is important for assessing and improving the engineering properties. It can help to understand the response of soil under temperature changes so that appropriate engineering measures can be taken to ensure stability and safety [36,37]. The thermal stability characteristics of the cohesive soil reinforced by MICP at different CS and BS concentrations are described in the TG curves from 50 °C to 1000 °C (Figure 7). The greatest amount of mass loss was observed in soil samples at the lowest CS concentration (0.5 M), ranging from 51% to 59% in Figure 7a, which was higher than that of mass loss at other CS concentrations (1.0 M, 1.5 M, and 2.0 M) with 43%, 36%, and 42% (Figure 7b–d). The minimum mass loss was 32%, corresponding to the CS-BS combination concentration of 1.5 mol/L and OD600 = 1.8. The peak temperature (PT) usually corresponded to the temperature point at which the maximum mass loss of the sample occurred, which helped us to accurately determine the thermal decomposition temperature. In this study, at the same CS concentration, the peak temperature (PT) showed an increasing and then decreasing trend with increasing BS concentration. Taking 0.5 M CS concentration as the example, the peak temperature (PT) was 675 °C, 694 °C, 773 °C, and 749 °C, corresponding to BS concentration with OD600 = 0.6, OD600 = 1.2, OD600 = 1.8, and OD600 = 2.4. The characteristics of changes in the other CS and BS concentrations were the same as described above. The minimum peak temperature (PT) was 812 °C, corresponding to the CS-BS combination concentration, which was also 1.5 mol/L and OD600 = 1.8.
The thermal stability of cohesive soil is mainly affected by volume change and strength change at different temperatures. The water content of cohesive soils will decrease at high temperatures, leading to shrinkage and the reduction of strength, whereas cohesive soil may expand at low temperatures, leading to volume changes and structural damage [38,39]. These changes directly affect the engineering properties of cohesive soil, such as bearing capacity, deformability and stability [40]. In this study, the thermal stability of cohesive soil can be characterized by mass loss and peak temperature; that is to say, less mass loss and high peak temperature indicated a better thermal stability and strength of the cohesive soil. Combined with the SEM results in Figure 4, it can be found that the crystalline degree and thermal stability reached their best at an optimal combination of CS and BS concentration, indicating that cohesive soil reinforced by MICP achieved good results. This can provide a good reference for future studies to investigate the reaction conditions of MICP.

4. Discussion

4.1. Comprehensive Evaluation of MICP

MICP significantly improves the shear strength and unconfined compressive strength of the cohesive soil by filling the soil pores and forming inter-particle cementation through calcium carbonate precipitation generated by microbial metabolism. At the same time, permeability is reduced, which is suitable for the needs of seepage resistance reinforcement of reservoir bank slopes [41,42]. Cohesive soil can still maintain high strength under dynamic stress, and the destructive strain threshold is improved, which is suitable for an environment with frequent changes in reservoir water level. Calcium carbonate is precipitated in the form of calcite and vaterite, which are chemically stable and not easily decomposed in the range of room to medium temperature (common temperature fluctuation in the reservoir area), which maintains the reinforcement effect for a long period of time. MICP also can reduce the migration and bioconcentration of heavy metal ions (e.g., Pb2+, Cd2+) by encapsulating them in the lattice of calcium carbonate, reducing their mobility and biotoxicity, and minimizing the risk of contamination of the reservoir sediment [43,44]. Compared with traditional chemical grouting technology, MICP uses natural strains of bacteria and low concentration of binder (e.g., urea, calcium chloride) without harmful by-products, which meets the requirements of green construction. The reaction process, reinforcement index test, and effect evaluation of MICP are shown in Figure 8.
MICP technology realizes the efficient improvement of cohesive soil in reservoir areas in terms of mechanical properties, thermal stability, and ecological remediation through the synergistic effect of microbial metabolism and mineral precipitation [45]. Its core advantages include significant improvement to mechanical strength (e.g., shear strength, compressive strength), environmental adaptability (resistance to temperature fluctuations and cyclic loading), and ecological compatibility (heavy metal immobilization, low pollution) [46]. This technology provides a sustainable solution for cohesive soil reinforcement and ecological restoration in reservoir projects.

4.2. Practical Applications and Future Research Prospects

This study found that the use of a soaking method to reinforce cohesive soil with low permeability resulted in an uneven distribution of calcium carbonate precipitations, which may be due to the continuous generation of calcium carbonate near the upper surface hindering the further diffusion of CS and BS fluid into the soil interior. Other scholars have also found similar phenomena by using a mixing method, one-way grouting method, and soaking method, and uneven distribution of calcium carbonate will significantly weaken the reinforcement effect of MICP. Therefore, scholars have explored methods such as adjusting the CS and BS concentrations, urease activity, and pH value to slow down the sedimentation rate of calcium carbonate and biological flocculation, which is beneficial for the CS-BS combination concentrations to enter the deep part of the soil, so that the mixed solution can be evenly distributed inside the soil before reacting to improve the uniformity of soil reinforcement. However, the improvement effect of these improvement methods on the uneven distribution of calcium carbonate in the process of MICP reinforcement of cohesive soil still needs further research, providing a scientific basis for the on-site application of MICP technology.

5. Conclusions

This study mainly investigated the influences of the different CS and BS concentrations on cohesive soil reinforced by MICP. The results showed that the unreinforced soil showed an amorphous state, with low strength, and the particle size distribution was dominated by powder particles. However, with the addition of BS concentrations and CS concentrations, SEM results showed that spherical and rhombohedral minerals filled the pores of the cohesive soil, which increased the content of precipitations and enhanced the cementitious characteristics. Mechanical and thermochemical experiments were performed to analyze the strength of cohesive soil and the reinforcing effect of MICP. The optimal combination of CS and BS concentration was 1.5 mol/L and OD600 = 1.8. At this point, the crystalline degree and thermal stability of the cohesive soil reached their best levels and the soil samples reinforced by MICP achieved good results.

Author Contributions

Conceptualization, D.Z.; methodology, X.L.; software, D.Z.; validation, D.Z. and X.L.; formal analysis, D.Z.; investigation, X.L.; resources, D.Z.; data curation, D.Z.; writing—original draft preparation, X.L.; writing—review and editing, R.H. and D.Z.; funding acquisition, X.L. All authors have read and agreed to the published version of the manuscript.

Funding

This work was supported by the University Natural Science Research Project of Anhui Province (2023AH052243, 2023AH052223); Doctoral Research Start-up Fund of Suzhou University (2020BS008, 2021BSK036, 2022BSK011); Postdoctoral Research Start-up Fund of Suzhou University (2023BSH002, 2024BSH002); and the Key Laboratory of Mine Water Resource Utilization of Anhui Higher Education Institutes, Suzhou University (KMWRU202403).

Data Availability Statement

No new data were created or analyzed in this study.

Acknowledgments

The SEM analysis was conducted by Chao Wang from the Shiyanjia Lab (www.shiyanjia.com, accessed on 13 February 2025), and the authors express their gratitude for his contribution.

Conflicts of Interest

All authors have read and approved this version of the article, and due care has been taken to ensure the integrity of the work. No part of this paper has been published or submitted elsewhere. The authors declare no conflicts of interest.

References

  1. Wang, Y.; Wang, G.; Wan, Y.; Yu, X.; Zhao, J.; Shao, J. Recycling of dredged river silt reinforced by an eco-friendly technology as microbial induced calcium carbonate precipitation (MICP). Soils Found. 2022, 62, 101216. [Google Scholar] [CrossRef]
  2. Fouladi, A.S.; Arulrajah, A.; Chu, J.; Horpibulsuk, S. Application of Microbially Induced Calcite Precipitation (MICP) technology in construction materials: A comprehensive review of waste stream contributions. Constr. Build. Mater. 2023, 388, 131546. [Google Scholar] [CrossRef]
  3. Zhuang, D.; Wang, R.J.; Chen, S.; Li, X. The geochemical and thermodynamic characteristics of waste sand reinforced by microbially induced calcium carbonate precipitation. Environ. Technol. Innov. 2024, 36, 103828. [Google Scholar] [CrossRef]
  4. Song, M.; Ju, T.; Meng, Y.; Han, S.; Lin, L.; Jiang, J. A review on the applications of microbially induced calcium carbonate precipitation in solid waste treatment and soil remediation. Chemosphere 2022, 290, 133229. [Google Scholar] [CrossRef]
  5. Zhang, K.; Tang, C.-S.; Jiang, N.-J.; Pan, X.-H.; Liu, B.; Wang, Y.-J.; Shi, B. Microbial induced carbonate precipitation (MICP) technology: A review on the fundamentals and engineering applications. Environ. Earth Sci. 2023, 82, 229. [Google Scholar] [CrossRef]
  6. Kidanemariam, T.G.; Gebru, K.A.; Kidane Gebretinsae, H. A mini review of enzyme-induced calcite precipitation (EICP) technique for eco-friendly bio-cement production. Environ. Sci. Pollut. Res. 2024, 31, 16206–16215. [Google Scholar] [CrossRef]
  7. Sun, X.; Miao, L.; Tong, T.; Wang, C. Study of the effect of temperature on microbially induced carbonate precipitation. Acta Geotech. 2019, 14, 627–638. [Google Scholar] [CrossRef]
  8. Lu, H.; Yi, J.; Liu, Q.; Cao, A.; Wei, A.; Zhang, K. A self-dissolved grouting reinforcement method for water-rich soft rock roadway. Bull. Eng. Geol. Environ. 2022, 81, 256. [Google Scholar] [CrossRef]
  9. Guo, L.; Dai, Q.; Lin, X.; Jiang, Y.; Wang, B.; Pan, X.; Peng, Y.; Zhao, G.; Ru, Y.; Zhou, L. Enhancing fiber–matrix interface permeability resistance of natural fiber-reinforced, bio-cemented sand by CaCO3 seed pretreatment. Geomech. Energy Environ. 2023, 35, 100481. [Google Scholar] [CrossRef]
  10. Liang, C.; Cao, C.; Wu, S. Hydraulic-mechanical properties of loess and its behavior when subjected to infiltration-induced wetting. Bull. Eng. Geol. Environ. 2018, 77, 385–397. [Google Scholar] [CrossRef]
  11. Bu, C.; Lu, X.; Zhu, D.; Liu, L.; Sun, Y.; Wu, Q.; Zhang, W.; Wei, Q. Soil improvement by microbially induced calcite precipitation (MICP): A review about mineralization mechanism, factors, and soil properties. Arab. J. Geosci. 2022, 15, 863. [Google Scholar] [CrossRef]
  12. Rajasekar, A.; Wilkinson, S.; Moy, C.K.S. MICP as a potential sustainable technique to treat or entrap contaminants in the natural environment: A review. Environ. Sci. Ecotechnol. 2021, 6, 100096. [Google Scholar] [CrossRef] [PubMed]
  13. Liu, W.; Zhang, Z.; Huang, X.; Zhang, Q.; Cao, L.; Yang, C. The large deformation mechanism of sewage-treatment plant slope in the Three Gorges Reservoir, China. Arab. J. Geosci. 2021, 14, 2130. [Google Scholar] [CrossRef]
  14. Rasmey, A.H.M.; Aboseidah, A.A.; Gaber, S.; Mahran, F. Characterization and optimization of lipase activity produced by Pseudomonas monteilli 2403-KY120354 isolated from ground beef. Afr. J. Biotechnol. 2017, 16, 96–105. [Google Scholar]
  15. Laity, P.R.; Asare-Addo, K.; Sweeney, F.; Šupuk, E.; Conway, B.R. Using small-angle X-ray scattering to investigate the compaction behaviour of a granulated clay. Appl. Clay Sci. 2015, 108, 149–164. [Google Scholar] [CrossRef]
  16. Dweck, J.; Buchler, P.M.; Coelho, A.C.V.; Cartledge, F.K. Hydration of a Portland cement blended with calcium carbonate. Thermochim. Acta 2000, 346, 105–113. [Google Scholar] [CrossRef]
  17. Jia, N.; Cong, Z.H.; Sun, X.; Cheng, S.; Nie, Z.H.; Ren, Y.; Liaw, P.K.; Wang, Y.D. An in situ high-energy X-ray diffraction study of micromechanical behavior of multiple phases in advanced high-strength steels. Acta Mater. 2009, 57, 3965–3977. [Google Scholar] [CrossRef]
  18. Jain, R.K. Study on shear strength of soil in relation to plant roots as a combind matrix. Int. J. Appl. Sci. Eng. 2013, 1, 103–130. [Google Scholar]
  19. Hassan, W.; Alshameri, B.; Nawaz, M.N.; Qamar, S.U. Experimental study on shear strength behavior and numerical study on geosynthetic-reinforced cohesive soil slope. Innov. Infrastruct. Solut. 2022, 7, 349. [Google Scholar] [CrossRef]
  20. Zhuang, D.; Yang, F.; Xiang, Q.; Wei, Q.; Jiang, W.; Zhao, J.; Guo, Y. Differences in thermal decomposition and crystallinity of dark organic laminae and light mineral laminae in same stromatolite. Thermochim. Acta 2023, 728, 179576. [Google Scholar] [CrossRef]
  21. Buza, A.; Türkeş, C.; Arslan, M.; Demir, Y.; Dincer, B.; Nixha, A.R.; Beydemir, Ş. Discovery of novel benzenesulfonamides incorporating 1,2,3-triazole scaffold as carbonic anhydrase I, II, IX, and XII inhibitors. Int. J. Biol. Macromol. 2023, 239, 124232. [Google Scholar] [CrossRef] [PubMed]
  22. Yan, Z.; Wang, J.; Zou, R.; Liu, L.; Zhang, Z.; Wang, X. Hydrothermal synthesis of CeO2 nanoparticles on activated carbon with enhanced desulfurization activity. Energy Fuels 2012, 26, 5879–5886. [Google Scholar] [CrossRef]
  23. Chen, J.; Wei, J.; Ma, C.; Yang, Z.; Li, Z.; Yang, X.; Wang, M.; Zhang, H.; Hu, J.; Zhang, C. Photosynthetic bacteria-based technology is a potential alternative to meet sustainable wastewater treatment requirement? Environ. Int. 2020, 137, 105417. [Google Scholar] [CrossRef] [PubMed]
  24. Zeynali, Y.; Niroumand, H.; Moayed, R.Z. Stabilizing cohesive soils with Micro-and Nano-fly ash as Eco-friendly Materials: An experimental study. Constr. Build. Mater. 2023, 399, 132490. [Google Scholar] [CrossRef]
  25. Menezes, A.S.; Alencar, T.L.; Júnior, R.N.A.; Toma, R.S.; Romero, R.E.; Costa, M.C.G.; Cooper, M.; Mota, J.C.A. Functionality of the porous network of Bt horizons of soils with and without cohesive character. Geoderma 2018, 313, 290–297. [Google Scholar] [CrossRef]
  26. Han, L.; Liu, J.; Tang, H.; Yan, Z. Study of Zr addition on the composition, crystallite size, microstructure and properties of high-performance nano Cu alloys prepared by mechanical alloying. Mater. Chem. Phys. 2022, 290, 126630. [Google Scholar] [CrossRef]
  27. Akl, A.A.; El Radaf, I.M.; Hassanien, A.S. Intensive comparative study using X-Ray diffraction for investigating microstructural parameters and crystal defects of the novel nanostructural ZnGa2S4 thin films. Superlattices Microstruct. 2020, 143, 106544. [Google Scholar] [CrossRef]
  28. Zhuang, D.; Yao, W.; Guo, Y.; Wu, C.; Cao, J.; Sun, B. Comparative study on geochemical and thermodynamic characteristics among wormkalk, micrite, thrombolite, and stromatolite. Carbonates Evaporites 2025, 40, 22. [Google Scholar] [CrossRef]
  29. Zhang, P.; Chou, Y.; Peng, E.; Wang, Y. Solidification of sodium sulfate saline loess by biomineralization of reactive magnesium oxide binder. Constr. Build. Mater. 2024, 433, 136611. [Google Scholar] [CrossRef]
  30. Zhuang, D.; Yao, W.; Guo, Y.; Chen, Z.; Gui, H.; Zhao, Y. Bioremediation of Heavy Metal-Contaminated Solution and Aged Refuse by Microbially Induced Calcium Carbonate Precipitation: Further Insights into Sporosarcina pasteurii. Microorganisms 2025, 13, 64. [Google Scholar] [CrossRef]
  31. Wu, Z.; Xu, J.; Li, Y.; Wang, S. Disturbed state concept–based model for the uniaxial strain-softening behavior of fiber-reinforced soil. Int. J. Geomech. 2022, 22, 04022092. [Google Scholar] [CrossRef]
  32. Wei, L.; Chai, S.X.; Zhang, H.Y.; Shi, Q. Mechanical properties of soil reinforced with both lime and four kinds of fiber. Constr. Build. Mater. 2018, 172, 300–308. [Google Scholar] [CrossRef]
  33. Cui, M.-J.; Zheng, J.-J.; Chu, J.; Wu, C.-C.; Lai, H.-J. Bio-mediated calcium carbonate precipitation and its effect on the shear behaviour of calcareous sand. Acta Geotech. 2021, 16, 1377–1389. [Google Scholar] [CrossRef]
  34. Guo, L.; Wang, B.; Guo, J.; Guo, H.; Jiang, Y.; Zhang, M.; Dai, Q. Experimental study on improving hydraulic characteristics of sand via microbially induced calcium carbonate precipitation. Geomech. Energy Environ. 2024, 37, 100519. [Google Scholar] [CrossRef]
  35. Zhang, H.Q.; Tannant, D.D.; Jing, H.W.; Nunoo, S.; Niu, S.J.; Wang, S.Y. Evolution of cohesion and friction angle during microfracture accumulation in rock. Nat. Hazards 2015, 77, 497–510. [Google Scholar] [CrossRef]
  36. Zhuang, D.; Chen, Z.; Sun, B. Thermal Decomposition of Calcium Carbonate at Multiple Heating Rates in Different Atmospheres Using the Techniques of TG, DTG, and DSC. Crystals 2025, 15, 108. [Google Scholar] [CrossRef]
  37. Liu, L.; Cai, G.; Zhang, J.; Liu, X.; Liu, K. Evaluation of engineering properties and environmental effect of recycled waste tire-sand/soil in geotechnical engineering: A compressive review. Renew. Sustain. Energy Rev. 2020, 126, 109831. [Google Scholar] [CrossRef]
  38. Yavari, N.; Tang, A.M.; Pereira, J.-M.; Hassen, G. Effect of temperature on the shear strength of soils and the soil–structure interface. Can. Geotech. J. 2016, 53, 1186–1194. [Google Scholar] [CrossRef]
  39. Sharma, L.K.; Sirdesai, N.N.; Sharma, K.M.; Singh, T. Experimental study to examine the independent roles of lime and cement on the stabilization of a mountain soil: A comparative study. Appl. Clay Sci. 2018, 152, 183–195. [Google Scholar] [CrossRef]
  40. Zhou, H.; Shi, Y.; Yu, X.; Xu, H.; Zheng, G.; Yang, S.; He, Y. Failure mechanism and bearing capacity of rigid footings placed on top of cohesive soil slopes in spatially random soil. Int. J. Geomech. 2023, 23, 04023110. [Google Scholar] [CrossRef]
  41. Tian, X.; Xiao, H.; Li, Z.; Li, Z.; Su, H.; Ouyang, Q. Experimental study on the strength characteristics of expansive soils improved by the MICP method. Geofluids 2022, 2022, 3089820. [Google Scholar] [CrossRef]
  42. Chen, Y.; Han, Y.; Zhang, X.; Sarajpoor, S.; Zhang, S.; Yao, X. Experimental study on permeability and strength characteristics of MICP-treated calcareous sand. Biogeotechnics 2023, 1, 100034. [Google Scholar] [CrossRef]
  43. Huang, W.; Mou, Y.; Li, Y.; Zhao, B.; Li, J.; Wu, X.; Zhou, M. Study on durability of MICP treated cohesive soils under dry–wet cycle and freeze–thaw cycle. Arab. J. Geosci. 2022, 15, 422. [Google Scholar] [CrossRef]
  44. Yu, T.; Souli, H.; Pechaud, Y.; Fleureau, J.-M. Review on engineering properties of MICP-treated soils. Geomech. Eng. 2021, 27, 13–30. [Google Scholar]
  45. Banik, N.; Sarkar, R.; Uddin, M.E. Assessment of strength and low-strain shear modulus of bio-cemented sand considering MICP treatment. Environ. Earth Sci. 2023, 82, 98. [Google Scholar] [CrossRef]
  46. Karimian, A.; Hassanlourad, M. Mechanical behaviour of MICP-treated silty sand. Bull. Eng. Geol. Environ. 2022, 81, 285. [Google Scholar] [CrossRef]
Figure 1. Characterization of cohesive soil before MICP by means of SEM, FTIR, and LPSA. (a,b), Aggregations of cohesive soil by SEM; (c), function group absorption of cohesive soil by FTIR; (d), particle size distribution.
Crystals 15 00540 g001
Figure 2. Microbial growth process curves.
Crystals 15 00540 g002
Figure 3. Calcium carbonate content of specimens in relation to the concentration of cementation solution and bacterial solution. (a), the OD600 value of the BS was 0.6; (b), the OD600 value of the BS was 1.2; (c), the OD600 value of the BS was 1.8; (d), the OD600 value of the BS was 2.4. Asterisks (*, **) mean p < 0.01, indicating the results have statistical significance.
Crystals 15 00540 g003
Figure 4. Morphological changes in minerals at different BS and CS concentrations.
Crystals 15 00540 g004
Figure 5. Mechanical characteristics of the cohesive soil: (a), stress–strain curves of the unreinforced soil samples with the increase in the confining pressure from 100 kPa to 300 kPa; (bd), stress–strain curves of the soil samples after reinforcement by MICP at a confining pressure of 300 kPa.
Crystals 15 00540 g005
Figure 6. Mechanical characteristics of the cohesive soil: (a), the shear strength of the unreinforced soil samples with the increase in the confining pressure from 100 kPa to 300 kPa; (b), the shear strength of the soil samples after reinforcement by MICP at a confining pressure of 300 kPa; (c), the cohesion of the unreinforced soil samples with the increase in the confining pressure from 100 kPa to 300 kPa; (d), the cohesion of the soil samples after reinforcement by MICP at a confining pressure of 300 kPa; (e), the internal friction angle of the unreinforced soil samples with an increase in the confining pressure from 100 kPa to 300 kPa; (f), the internal friction angle of the soil samples after reinforcement by MICP at a confining pressure of 300 kPa. Red arrows indicate an increasing or decreasing trend.
Crystals 15 00540 g006aCrystals 15 00540 g006b
Figure 7. TG images of cohesive soil at different BS and CS concentrations. (a), 0.5 M CS concentration at different BS concentrations; (b), 1.0 M CS concentration at different BS concentrations; (c), 1.5 M CS concentration at different BS concentrations; (d), 2.0 M CS concentration at different BS concentrations.
Crystals 15 00540 g007
Figure 8. The reaction process, reinforcement index test, and effect evaluation of MICP. Asterisks (*, **) mean p < 0.01, indicating the results have statistical significance.
Crystals 15 00540 g008
Table 1. Experimental conditions and parameters of different cementing and bacterial solution concentrations.
No.Cementing solution
Concentration (M)
Bacterial Solution Concentration
(OD600)
Temperature
(°C)
pH
10.50.6257
21.00.6257
31.50.6257
42.00.6257
50.51.2257
61.01.2257
71.51.2257
82.01.2257
90.51.8257
101.01.8257
111.51.8257
122.01.8257
130.52.4257
141.02.4257
151.52.4257
162.02.4257
Table 2. Particle size distribution of soil samples.
Particle Size IntervalSand Particle
(0.075–2 mm)
Powder Particle
(0.005–0.075 mm)
Clay Particle
(<0.005 mm)
Percentage composition (%)19.49%56.75%23.76%
Disclaimer/Publisher’s Note: The statements, opinions and data contained in all publications are solely those of the individual author(s) and contributor(s) and not of MDPI and/or the editor(s). MDPI and/or the editor(s) disclaim responsibility for any injury to people or property resulting from any ideas, methods, instructions or products referred to in the content.

