Article

Numerical Study on Impact Damage and Damage Evolution of Cemented Backfill

1
State Key Laboratory of Precision Blasting Engineering, Jianghan University, Wuhan 430056, China
2
Faculty of Land Resources Engineering, Kunming University of Science and Technology, Kunming 650093, China
3
College of Civil and Transportation Engineering, Hohai University, Nanjing 210098, China
*
Author to whom correspondence should be addressed.
Crystals 2025, 15(6), 514; https://doi.org/10.3390/cryst15060514
Submission received: 18 March 2025 / Revised: 9 May 2025 / Accepted: 27 May 2025 / Published: 28 May 2025
(This article belongs to the Section Inorganic Crystalline Materials)

Abstract

:
To quantitatively describe the damage degree and failure process of the cemented backfill (CB) under dynamic loading, this paper performed numerical split Hopkinson pressure bar (SHPB) impact experiments on CB samples using the ANSYS/LS-DYNA. The damage pattern and failure process of CB samples with four mix ratios (cement-to-sand (c/s) ratios of 1:4, 1:6, 1:8, and 1:10) at different impact velocities (v) (1.5, 1.7, 1.8, and 2.0 m/s) were numerically investigated using the micro-crack density method to define the damage variable (d). The results revealed that the use of a waveform shaper in the numerical simulation yielded a more ideal rectangular wave to ensue uniform stress distribution across the sample’s plane without stress concentration. Numerical simulations effectively depicted the dynamic failure process of the CB, with the overall failure trend exhibiting edge spalling followed by the propagation and interconnection of internal cracks. When the v increased from 1.7 m/s to 1.8 m/s, the d increased by more than 10%. As the v increased from 1.5 m/s to 2.0 m/s, the d for c/s ratios of 1:4, 1:6, 1:8, and 1:10 ranged from 0.238 to 0.336, 0.274 to 0.413, 0.391 to 0.547, and 0.473 to 0.617, respectively. A significant “leap” phenomenon in damage was observed when the c/s ratio changed from 1:6 to 1:8.

1. Introduction

The cemented backfill mining method is widely used in metal mines because it effectively utilizes tailings and other waste materials, controls ground pressure in mining areas, reduces environmental pollution, and mitigates surface subsidence, which aligns with the “green mine” development concept. However, the dynamic loads from blasting during underground pillar mining significantly affect the stability of the CB. Numerous scholars have studied the mechanical properties of cemented backfills with different aggregates, such as Zhao et al. [1], who aimed to prepare backfill materials by consolidating dihydrate phosphogypsum with industrial waste granulated blast furnace slag and calcium carbide residue as binders. Liu et al. [2] incorporated the fiber into the CB and studied the triaxial mechanical properties and behavior of the fiber-reinforced cemented filling material. Li et al. [3] prepared two types of cold-bonded tailings lightweight aggregates; the discrete (uniform particle size 2–8 mm) and continuous (talbot coefficient 0.2–0.8) gradations at different dosages (15–40%) were prepared, and their influence on rheological as well as the thixotropic behavior of cemented ultrafine tailings backfill were explored accordingly. Some scholars have studied the structure of CB; Chen et al. [4] explored the mechanical characteristics of horizontal stratified cemented tailings backfill; explaining the strength deterioration mechanism of horizontal stratified cemented tailings backfill is essential for the strength design of backfill. Zhang et al. [5] analyzed the effects of an inclined angle, filling times, and cement tailings ratio on the uniaxial compressive strength and crack development law of layered cemented backfill using various research methods, including indoor experiments, numerical simulation, and computed tomography scanning. For different proportions of the cemented filling body, Zhang et al. [6] comprehensively analyzed the strain field evolution and crack development in cemented paste backfill specimens made from whole tailings under various backfill mix designs using uniaxial compressive strength testing, digital image correlation, and computer vision recognition technology. Zhu et al. [7] analyzed the failure mechanism of the CB with different mix ratios using the SHPB and verified the conclusions through numerical simulations. Regarding the damage constitutive model of CB, Tan et al. [8] analyzed the evolution law of cemented tailings backfill mechanical parameters and deformation and failure characteristics under different confining pressures, and they established the damage constitutive model of the filling body with the random statistical theory. Yin et al. [9] investigated the damage constitutive models of cemented tailings and waste rock backfill under impact loading through experimental analysis and theoretical validation. Based on the uniaxial compression tests and discrete element numerical simulation of cemented waste rock tailings backfill, Zhu et al. [10] studied the influence of waste rock content (0%, 10%, 20%, 0%, 40%, and 50%) on the mechanical properties and microscopic damage mechanism of cemented waste rock tailings backfill. Some scholars used numerical simulation to study the CB, Zhang et al. [11] analyzed the temperature and mechanical characteristics of the cemented tailings backfill via numerical simulations. The optimal cemented tailings backfill mix ratio at different mining depths was determined, and the corresponding safety control measures for deep metal mine filling mining were proposed. While Hou et al. [12] combined this method with the discrete element method, this study systematically explores the mechanical behavior and meso-degradation mechanisms of cemented paste backfill under the coupled action of dry–wet cycles and disturbance damage. Zhang et al. [13] investigated the hydration characteristics of cemented tailings backfill under varying curing temperatures and durations. Samples were analyzed using nuclear magnetic resonance and heat release experiments, and the hydration process was simulated with the CEMHYD3D program to evaluate characteristic parameters, hydration morphology, and product content. Gao et al. [14] studied the effects of waste rock content and waste rock size on the bending mechanical properties and macroscopic failure characteristics of cemented tailings–waste rock backfill, which were investigated through experiments.
Currently, research on the dynamic mechanical properties as well as fracture morphology and state of the CB is relatively comprehensive. However, there are limited studies on the damage variables for the CB of different strengths under various impact velocities via a combination of numerical simulations and impact tests. This study used LS-DYNA software to investigate the dynamic failure and damage evolution of the CB of different strengths under dynamic loading. The results can provide a reference for selecting material ratios and analyzing the dynamic damage evolution and failure process for the CB, and they can offer a new method for analyzing its dynamic fracture mechanism.

2. Determination of Basic Parameters

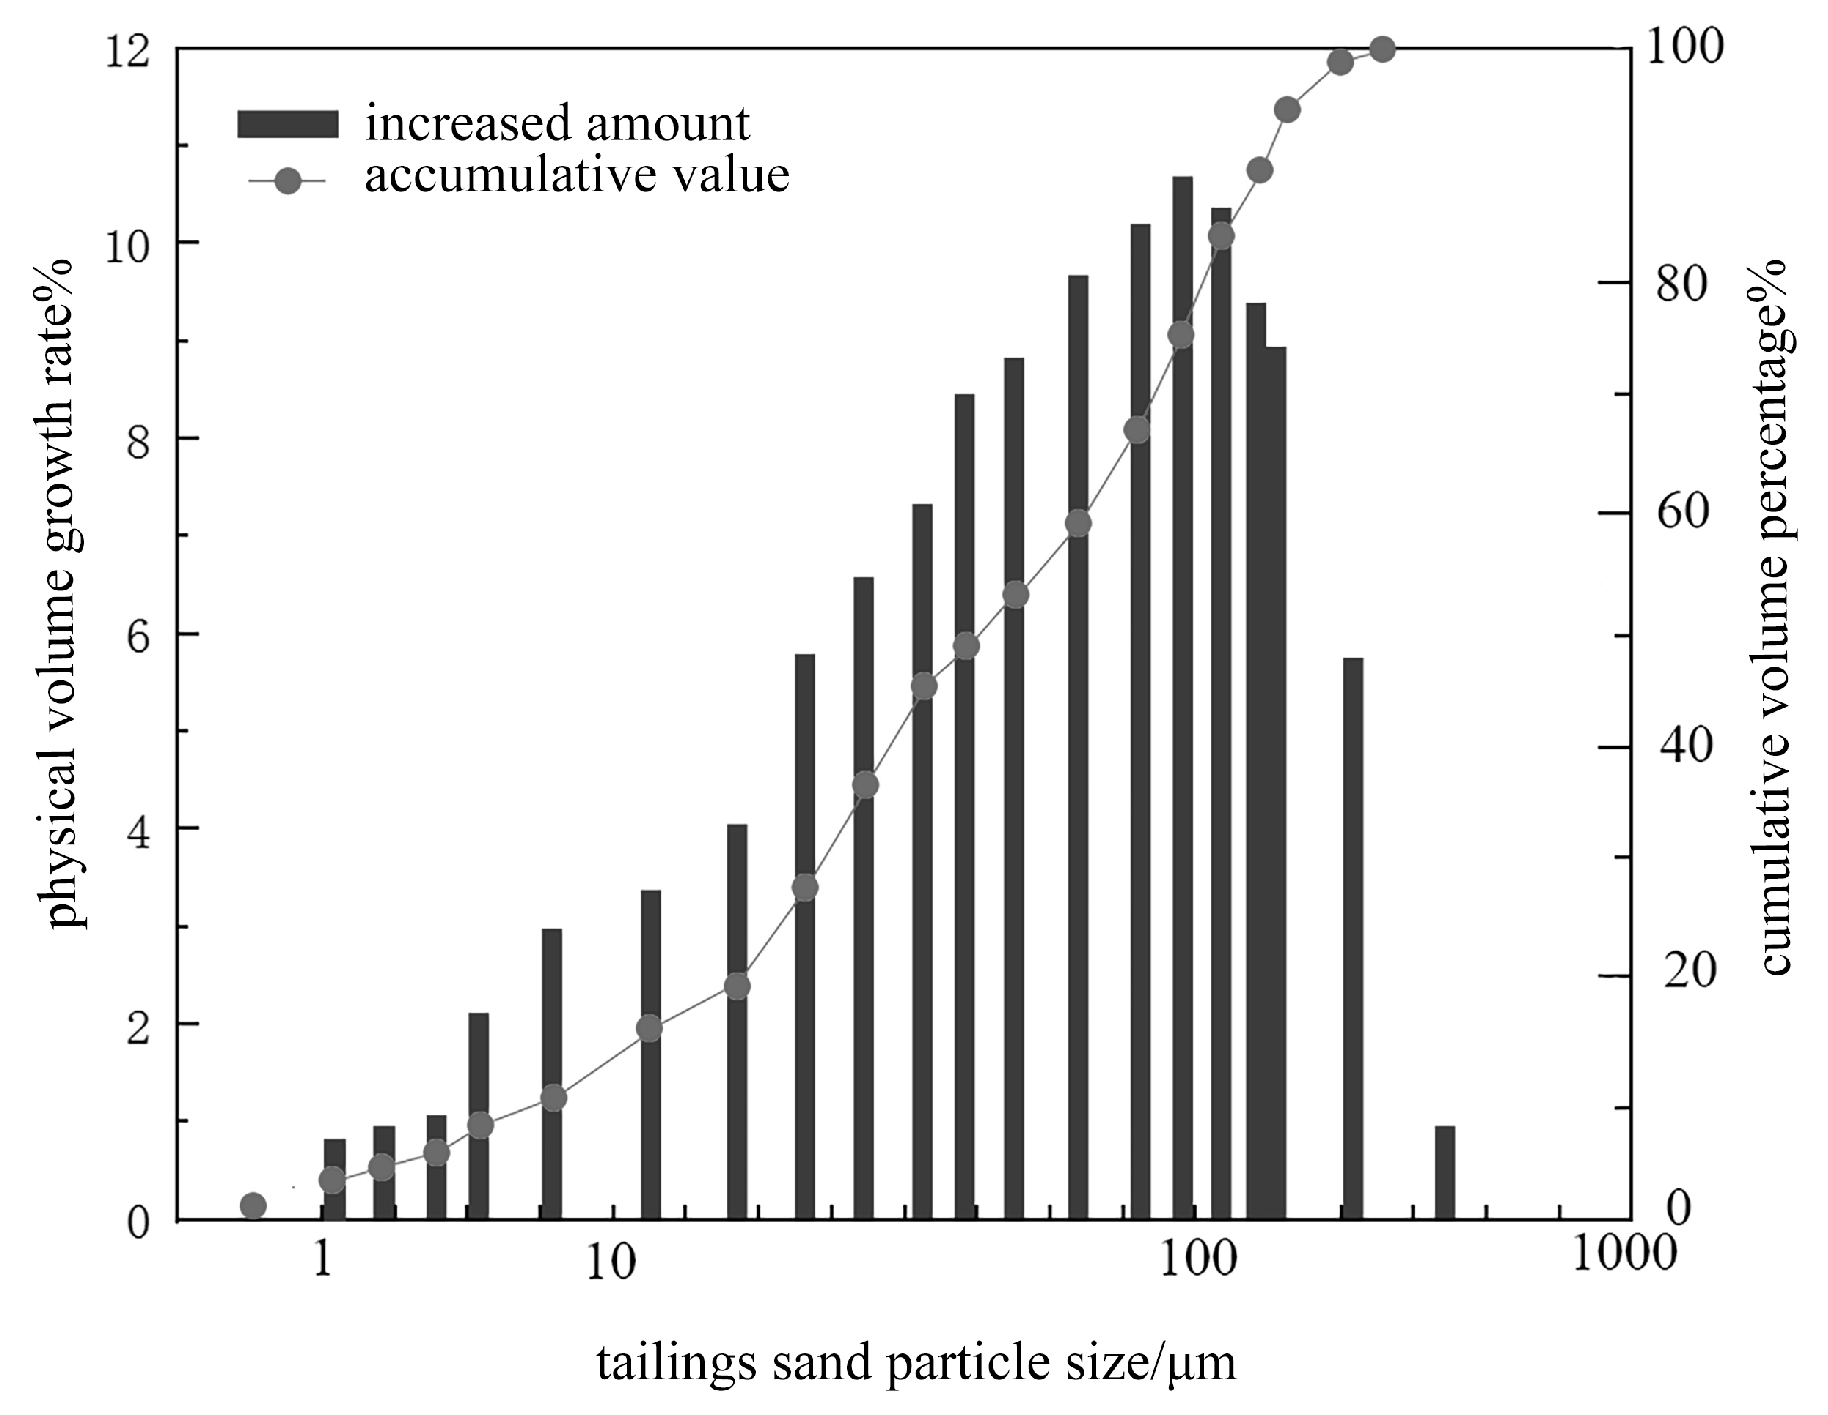
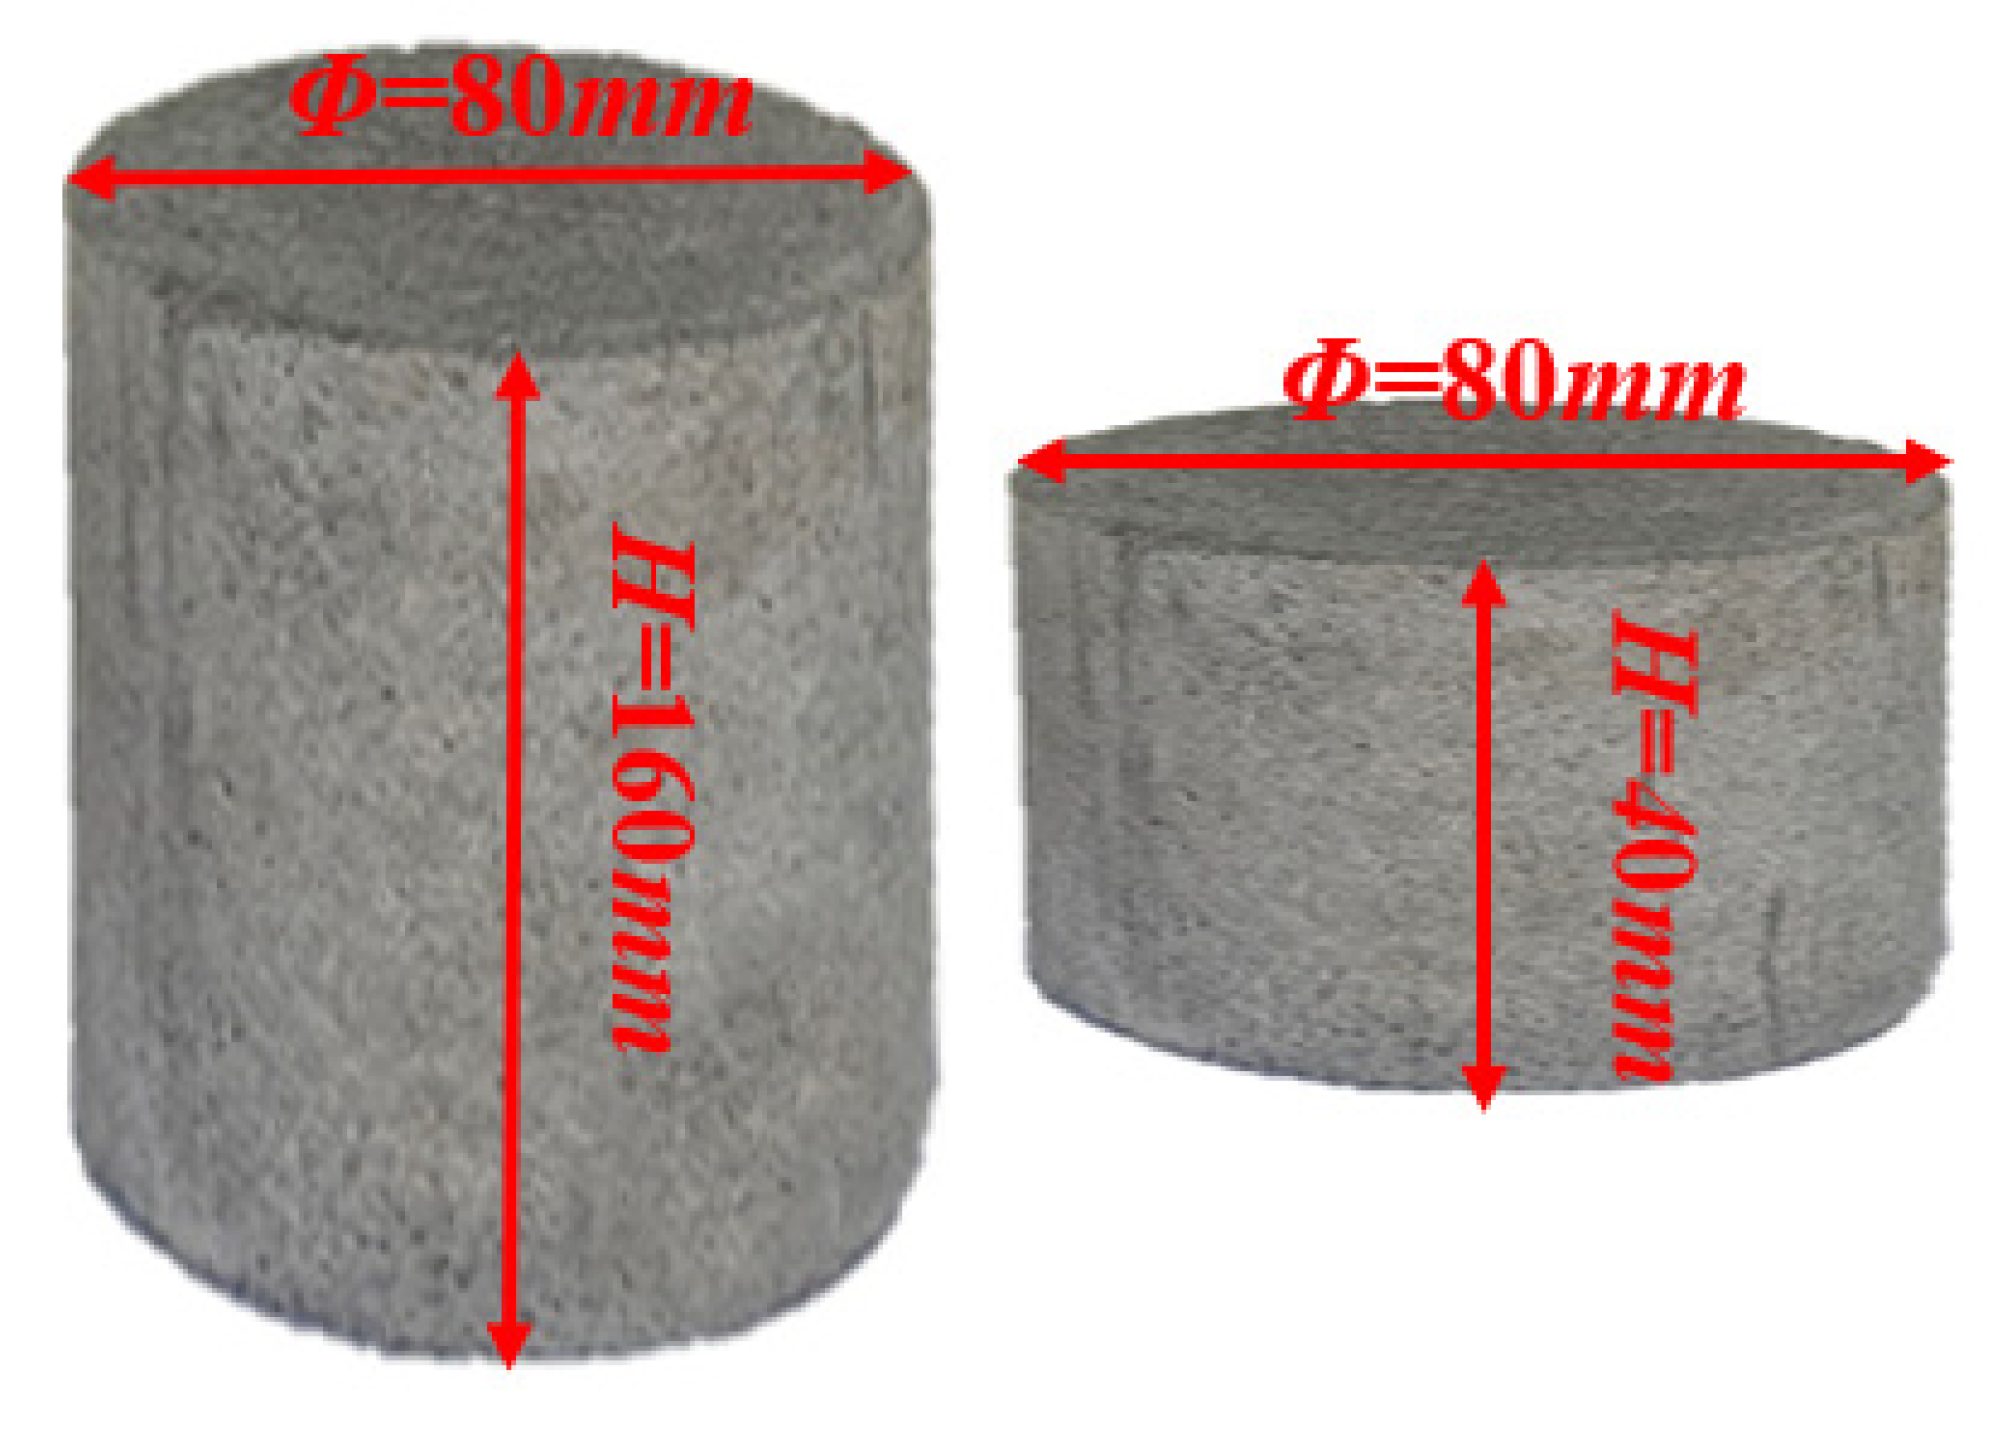
2.1. Preparation of the CB Samples and Determination of Basic Parameters

The tailings for this experiment were sourced from a copper mine in Yunnan Province [15]. The dried tailings samples underwent SA-CP3 particle size analysis, with the distribution curve displayed in Figure 1. With the increase in tailings particle size, the volume growth rate showed a trend of gradually increasing first, reaching a peak in a certain particle size range, and then decreasing. It showed that within a certain particle size range, the volume growth rate increased first with the increase in tailings particle size and then decreased after exceeding a certain particle size. The cumulative volume percentage showed a continuous upward trend with the increase in tailings particle size, and the rising rate gradually became faster, indicating that the proportion of cumulative volume to total volume increased with the increase in tailings particle size. Four groups of specimens with c/s ratios of 1:4, 1:6, 1:8, and 1:10 were prepared using 325 # ordinary Portland cement (mass concentration 72%) as cementitious material, and the water addition amount was 532 kg/m3. After the pouring was completed, the mold was opened, and the specimen was taken out after standing for 24 h. The specimen was cured in the natural state for 28 days to reach the predetermined strength. CB specimens with a diameter of 80 mm were prepared according to the experimental equipment. According to the relevant standard T/GRM 087-2023 ‘Technical Specification for Indoor Preparation and Mechanical Properties Test of Cemented Filling Body’ [16], the uniaxial compressive strength test and disc splitting tensile test were carried out with a height–diameter ratio of 2, that is, a sample height of 160 mm and 6 blocks for each c/s ratios. The uniaxial compressive strength was calculated according to the formula σ = F1/S, where F1 is the axial pressure (kN) and S is the cross-sectional area of the specimen (m2). The splitting tensile strength was calculated according to σt = 2F2/(πDH), where F2 is the axial load (kN) at the time of failure and D and H are the diameter and height (mm) of the cylinder specimen, respectively. The SHPB dynamic impact test used a specimen with a height–diameter ratio of 0.5; that is, the height of the specimen was 40 mm, and three specimens were prepared with different c/s ratios. The different sizes of CB samples are illustrated in Figure 2. The average value was calculated according to the experimental results of the three specimens, and the statistics are listed in Table 1.

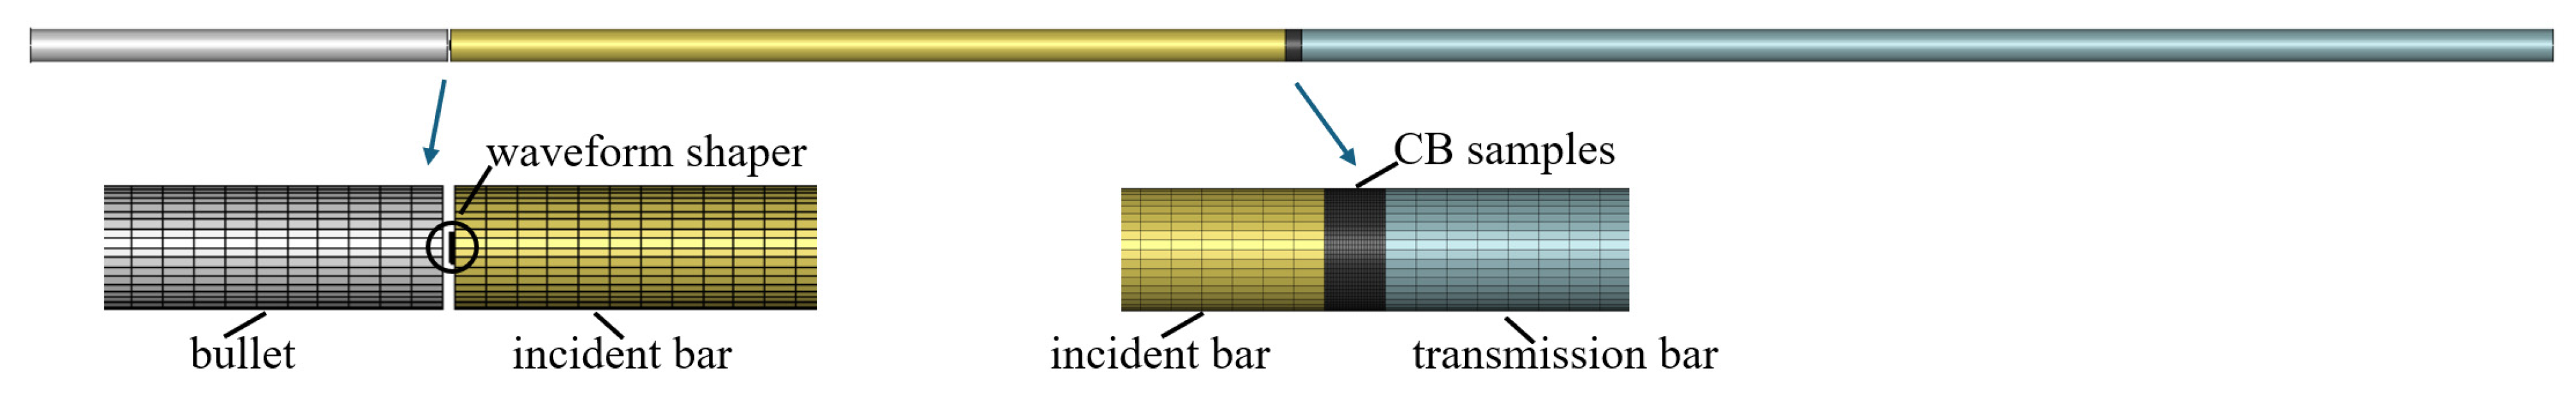
2.2. SHPB Experiment Apparatus and Basic Parameters

The dimensions of the simulated uniaxial impact test system were the same as those of the SHPB test apparatus at Kunming University of Science and Technology [17]. Figure 3 shows a schematic diagram of the SHPB system. The SHPB rods had a diameter of 80 mm, with the bullet, incident bar, and transmission bar lengths being 1, 2, and 3 m, respectively. All components were made of high-strength carbon steel, with a density of 7740 kg/m3, an elastic modulus of 207 GPa, a longitudinal wave velocity of 5159 m/s, and a Poisson’s ratio of 0.25. The experiment was carried out using the Chinese national standard GB/T 38565-2020. The velocity of the bullet was controlled by changing the air pressure so that the bullet hit the incident bar and generated a stress wave. The stress wave propagated in the incident bar, part of which was transmitted to the transmission bar through the specimen, and the other part was reflected in the incident bar. Using strain gauge and dynamic strain indicator, the signals of incident wave, reflected wave, and transmitted wave were collected synchronously. These signals reflected the propagation of stress waves in the compressive bar and the specimen. By analyzing the strain signals measured by the strain gauge, the stress–strain relationship of the CB at high strain rates can be obtained.

3. Numerical Simulation of SHPB Experiment

3.1. Determination of Material Model of the CB Sample

The numerical simulation primarily investigated the damage degree and dynamic failure process of the CB sample under dynamic loading. The SHPB test system operates within a medium-to-high strain rate range; hence, the constitutive model for the CB used the *MAT_111 material, i.e., the Holmquist–Johnson–Cook (HJC) model [18]. The HJC model comprises 21 parameters, which can be categorized into five groups [19]: (1) basic parameters (experimental value): R0 (material density), G (shear modulus), T (tensile strength), and fc (uniaxial compressive strength); (2) efficiency parameters: C (strain rate influence index) and ESPO (reference strain rate); (3) strength parameters (calculated value): A (characteristic bond strength), B (characteristic pressure hardening factor), N (pressure hardening index), and SFMAX (characteristic maximum strength); (4) equation of state parameters: pl (compaction pressure), pc (crushing pressure), μl (compaction volumetric strain), μc (crushing volumetric strain), and K1, K2, K3 (pressure constants); and (5) damage parameters: D1, D2 (damage constants), EFIMN (plastic strain before fracture), and FS (failure type). Among these 21 parameters, R0, fc, T, and G were obtained from uniaxial compressive strength tests and Brazilian splitting tensile tests, as listed in Table 1. Due to limitations in experimental conditions and costs, the remaining parameters were referenced from [20] for the HJC model of a CB with a c/s ratio of 1:4, as detailed in Table 2.

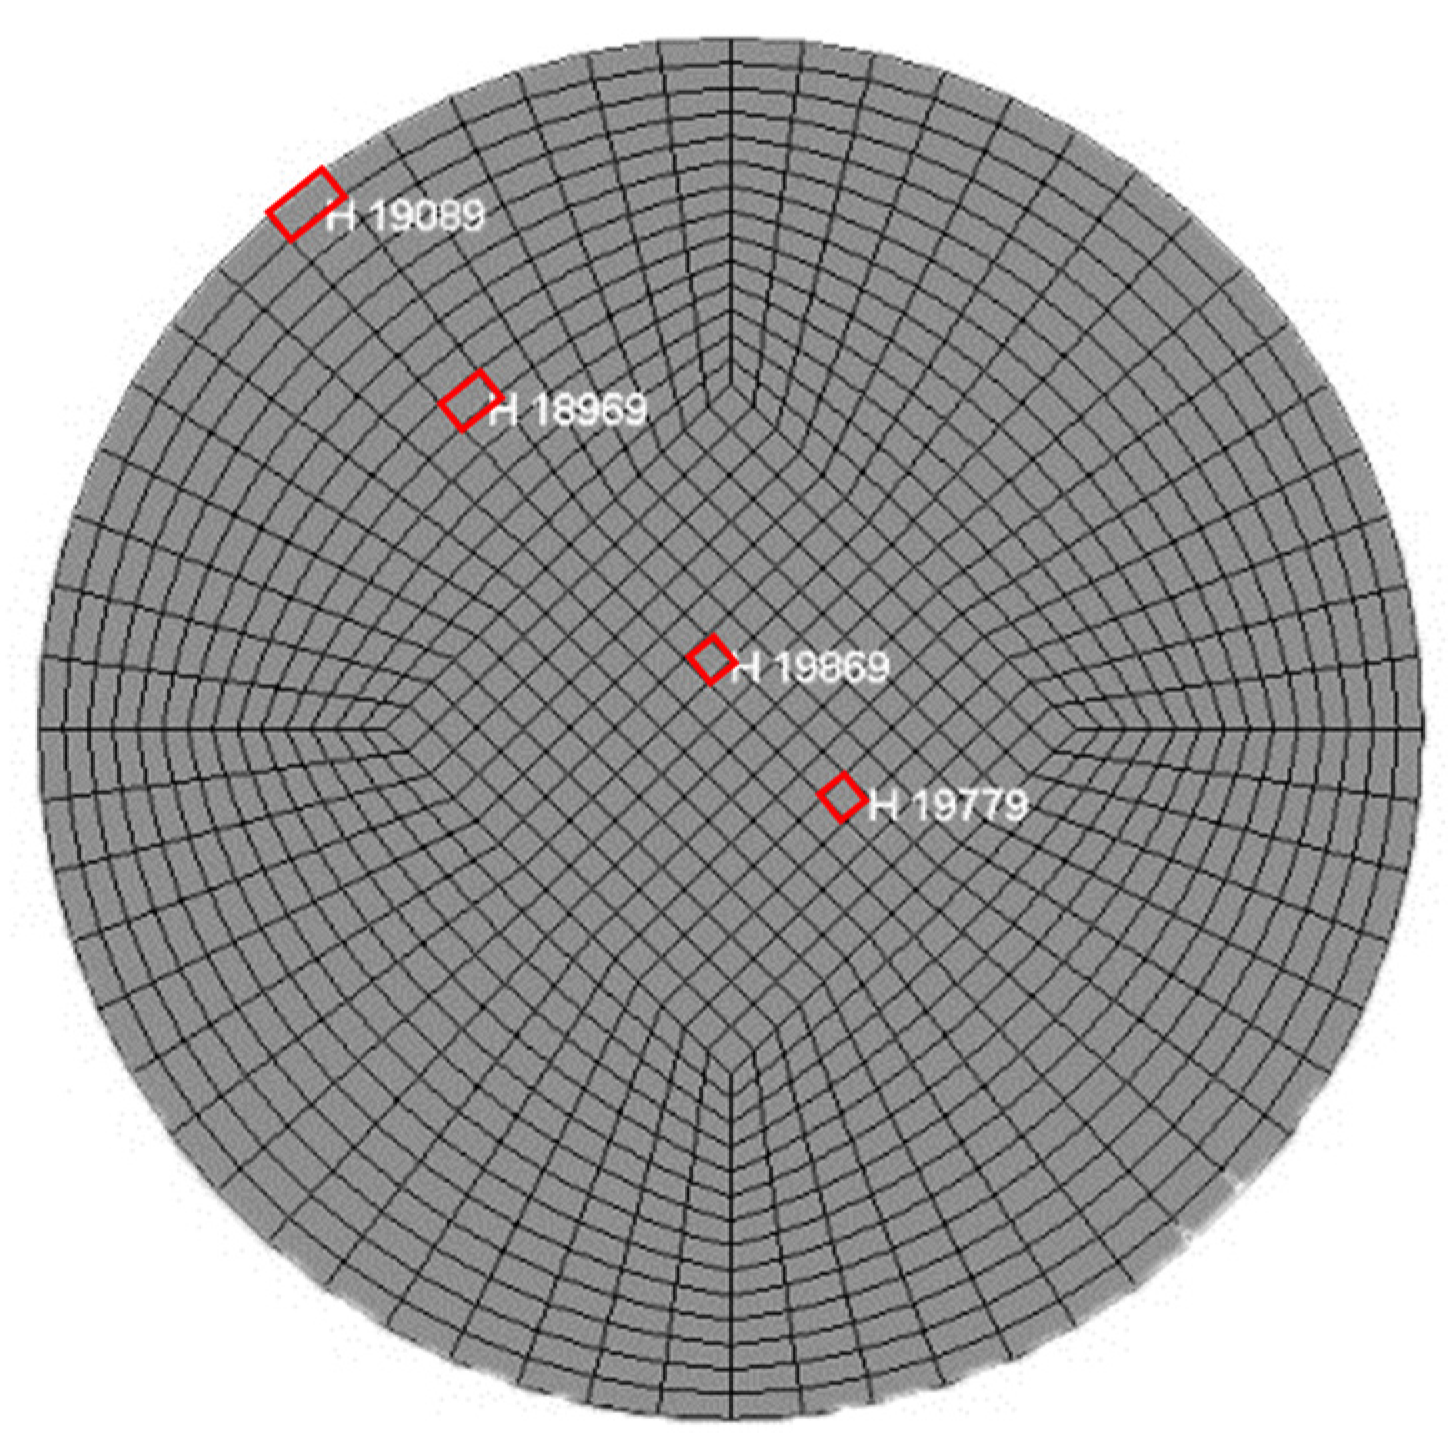
3.2. Establishment of Numerical Model for SHPB Experiment

With reference to the SHPB test system entity at Kunming University of Science and Technology, a three-dimensional (3D) model was established via the finite element software ANSYS/LS-DYNA 2023 [21]. The computational model employed SOLID164 solid elements for simulation. The material models used were MAT_ELASTIC for the bullet and Hopkinson bars, the HJC dynamic constitutive model for the CB, and the MAT_PLASTIC_KINEMATIC for the copper shims. To visualize the CB failure during the impact process, the keyword *MAT_ADD_EROSION was utilized to represent element failure and to simulate the dynamic fracture of the CB, i.e., any elements in the model that met the set strain criteria were automatically deleted. Considering the fracture effect and computational time, the CB sample was divided into 20 segments along its length and 40 segments circumferentially. The bar was divided into 20 segments circumferentially and every 2 cm along the axial direction, as displayed in Figure 4.
The consistency of the loading strain rate with the experiment as well as the stress equilibrium and uniform deformation in the sample can be achieved by either applying an initial velocity to the bullet or applying a stress wave to the incident end face [22]. In this simulation, a cylindrical copper shim was used as a waveform shaper, and it was attached to the center of the incident bar’s impact end. The waveform shaper model, with a diameter of 20 mm and a thickness of 2 mm, is illustrated in Figure 4. The waveform-shaping effects from different methods are presented in Figure 5. It can be observed that the waveform shaper smooths the waveform, significantly reduces oscillations, and maintains a gradual descent over a longer period, thus ensuring better stress equilibrium in the sample. Applying a stress wave to the incident end yields a smoother curve with minimal oscillations compared to directly imparting an initial velocity to the bullet. To ensure stress wave transmission between the bar and the CB, the CONTACT_AUTOMATIC_SURFACE_TO_SURFACE, i.e., the face-to-face contact, was employed between the bullet and shaper and between the shaper and incident bar, where the master and slave surfaces were selected based on the stiffness and the size of the area.

3.3. Experimental Program for Uniaxial Loading Simulation

Dynamic loading impact simulation experiments were conducted on CB samples with c/s ratios of 1:4, 1:6, 1:8, and 1:10; each sample was subjected to four different impact velocities. Given the low strength of the artificially compounded CB, bullet velocities of 1.5 m/s, 1.7 m/s, 1.8 m/s, and 2.0 m/s were selected, resulting in a total of 16 simulation experiments. The influence of different v on the damage degree and failure process of CB samples was observed. As discussed in Section 2.2, a method of applying stress waves to the incident end was employed, and the applied stresses were calculated using Equation (1) to be 0.145 MPa, 0.153 MPa, 0.157 MPa, and 0.165 MPa.
σ   = 1 / 2 ρ C V
where σ is the axial stress, C is the elastic longitudinal wave velocity of the rod, V is the impact velocity, and ρ is the density of the sample.
Four stress monitoring points were set along the diameter of the end surface of CB samples (Figure 6) to monitor whether the stress distribution on the end surface was uniform or not. For an applied stress of 0.165 MPa, the time-dependent stress curves of the four monitoring points are displayed in Figure 7, which indicated uniform stress across the end surface with no stress concentration points.

4. Analysis of Numerical Simulation Results

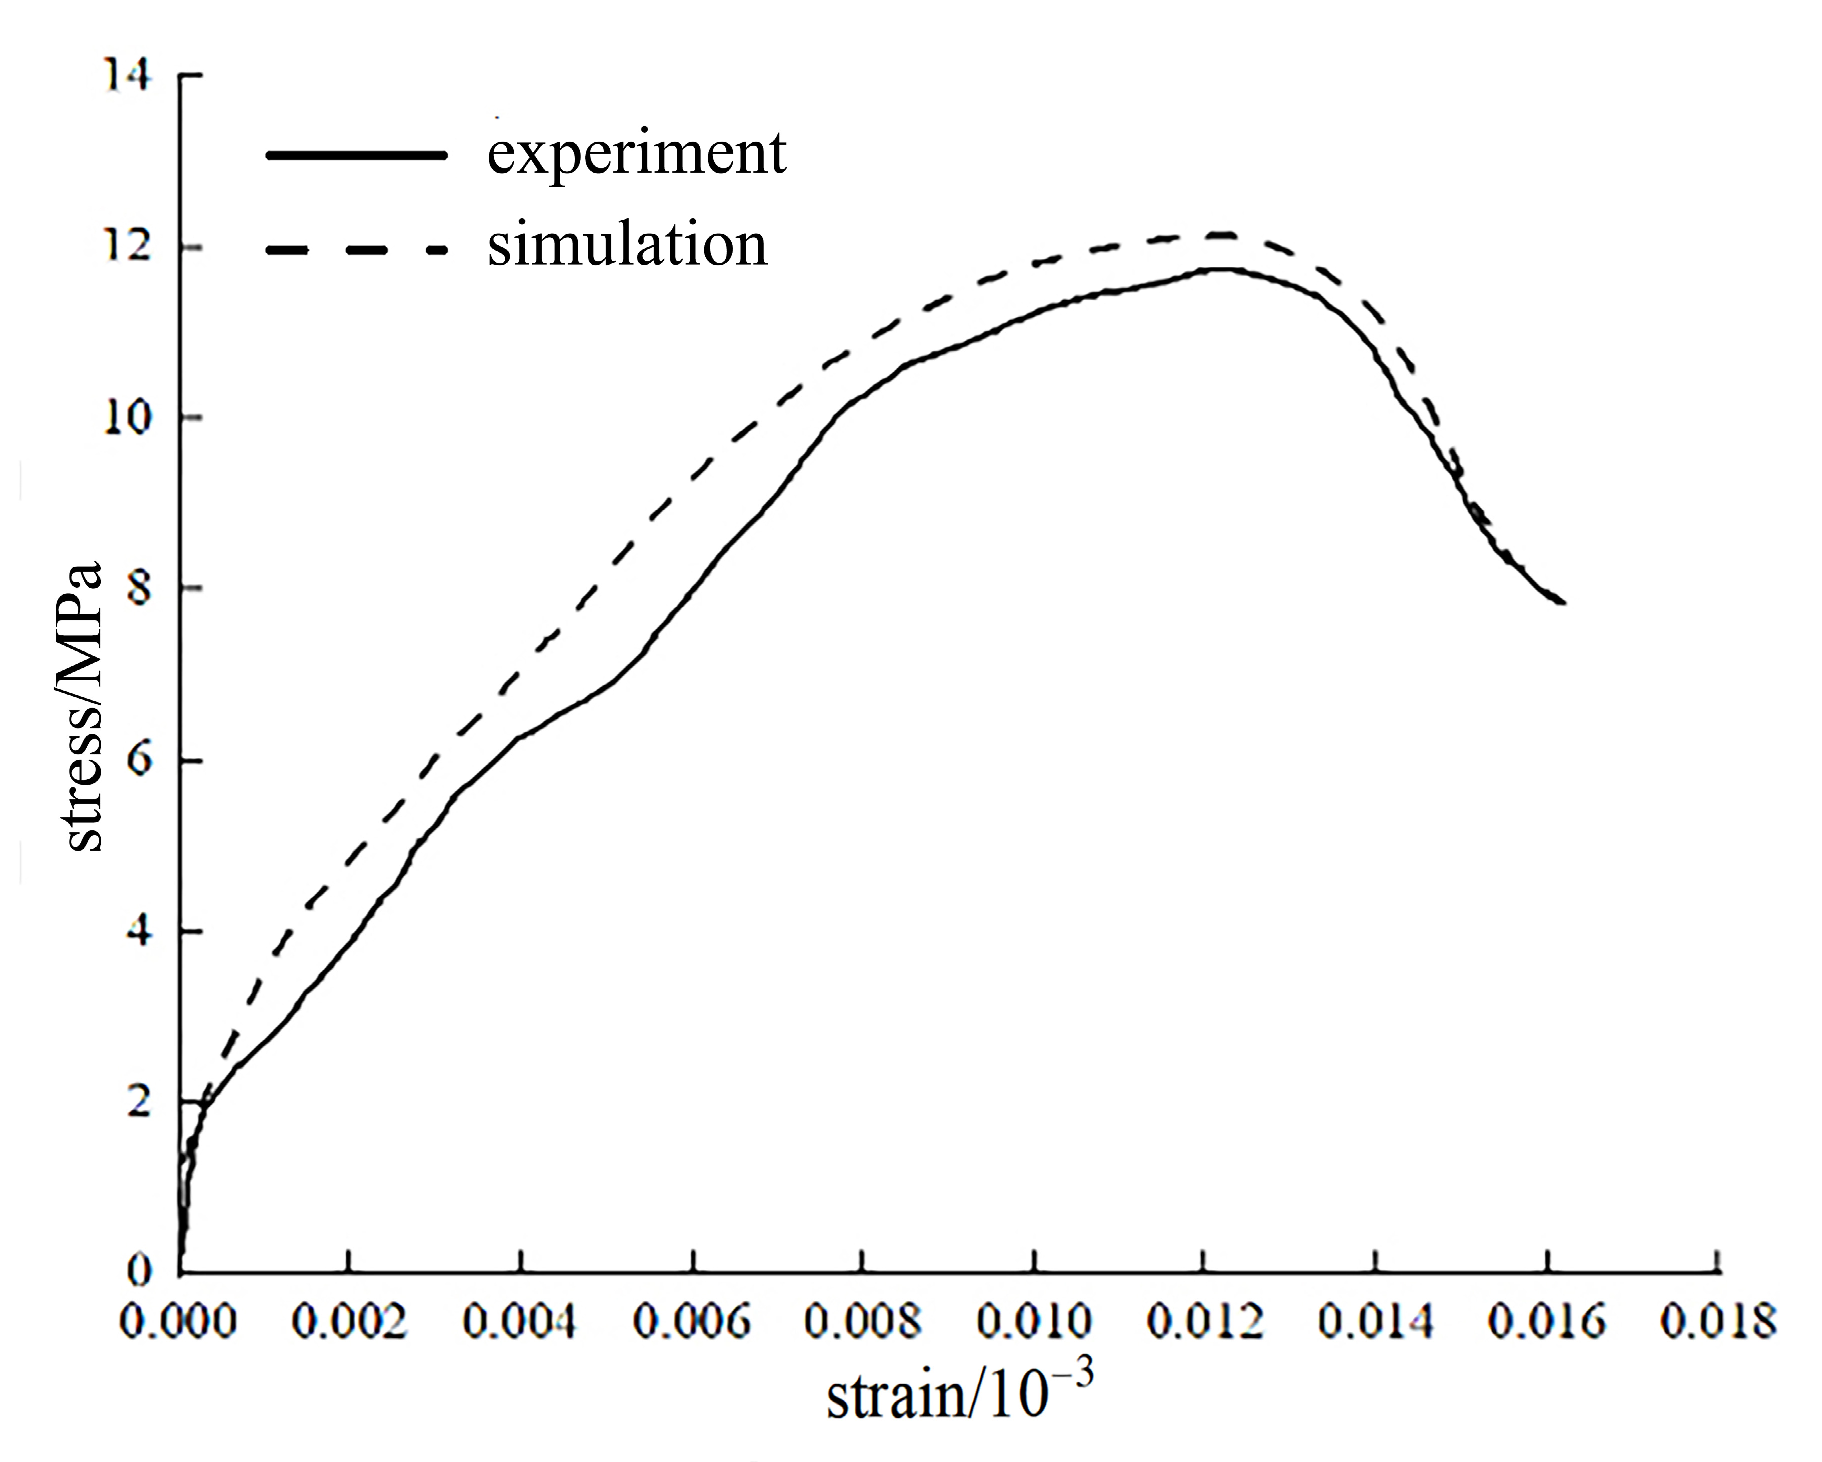
4.1. Comparative Analysis of the Accuracy of Simulation Results

To verify the numerical simulation against actual SHPB impact tests, dynamic impact experiments were conducted on CB samples with a diameter of 80 mm and length of 40 mm. Suitable samples were selected, lubricated on the end surfaces, and placed between the incident and transmission bars. The bullet’s loading velocity was measured using a laser tester. Figure 8 compares the stress–strain curves at a bullet velocity of 1.7 m/s. It was observed that the numerical curves closely matched the experimental curves, with no significant difference in peak stress, indicating appropriate selection of the HJC dynamic model parameters [23].
Figure 9 compares the failure modes of CB samples under actual impact and numerical simulation results. Figure 9a,b show the failure modes at bullet impact velocities of 1.7 m/s and 2.0 m/s, respectively. The analysis revealed that the CB sample primarily fractured due to high-speed impact along the bar direction that compresses internal primary cracks, which resulted in shear failure. The damage was mainly concentrated around the sample’s perimeter, with spalling starting at the edges. The spalled fragments exhibited lamellar and conical structures, while the rock core experienced relatively pronounced damage, at which point the sample had a high residual strength. With the increase in the bullet velocity, core retention also existed in the CB sample at a bullet velocity of 2.0 m/s, and spalling occurred from the sample edges, with an increased number of large spalls and decreased volume of retained core. Figure 9c demonstrated that the failure mode in the numerical simulation closely matched the actual failure mode, confirming that the numerical simulation accurately reflects the experimental failure behavior of the CB.

4.2. Dynamic Damage Process of Cemented Backfill

The numerical simulation results closely matched the laboratory experiments in terms of the failure mode and dynamic fracture process of the CB. The CB sample under uniaxial dynamic impact was subjected to tensile and compressive actions that cause internal primary cracks to close, so it began to undergo shear-dominated damage. The edges of the sample spalled to form a conical shape with a core retention phenomenon. The failure process of the CB sample with a c/s ratio of 1:4 and an applied stress of 0.165 MPa is illustrated in Figure 10. When the stress wave reached the end surface of the CB sample, damage first appeared on the periphery. Under high-speed compressive impact, the CB sample was deformed and reduced in length as a result of squeezing along the length direction, while the expansion occurred in its radial direction. The sample was subjected to transverse tensile stress, causing micro-cracks at the circumference edge. With the continuous increase in the transverse stress, the number of cracks increased, and they penetrated the sample. Multiple cracks of different sizes that were parallel to the length of the CB sample were formed, leading to partial spalling of the sample’s edges. As the cracks continuously increased in size and extended inwards, the external CB began to separate from the rock core, eventually resulting in a rock core surrounded by multiple fragmented pieces.

4.3. Analysis of Damage Evolution

Cemented backfill, as an artificial composite material, has mechanical properties related to the material properties of tailings and gelling agent, but it generally exhibits low strength. Due to natural solidification during pouring, it often contains micro-cracks and voids. Under dynamic loading, the CB undergoes rapid processes, such as primary crack closure, new crack formation, crack propagation, and coalescence. Current methods for defining dynamic damage variables include energy dissipation, elastic modulus, acoustic wave velocity, and micro-crack density methods [24]. Since the numerical simulation is able to measure crack volume over time, this study utilized the crack density method to define damage for quantitatively describing the damage degree of the CB. The volume was introduced to define the damage variable:
d = f = 1 − V/V0
where d is the damage variable; f is the crack density; V is the total volume of cracks and voids after the impact test; and V0 is the total volume of the original CB.
Before the impact tests, the volume of the CB sample was calculated to be 2.01 × 10⁻⁵ m3. The volume change curve over time was obtained using the LS-PREPOST post-processing software, and then the final fractured volume of the CB was determined. Since cracks in numerical simulations resulted from individual element failure, the time-dependent volume curve of the CB can represent changes in the volumes of cracks and voids. The damage variables for CB samples with different c/s ratios under impact loads were calculated by Equation (2). The calculation results that relate the c/s ratio to the v are detailed in Table 3, and the d are illustrated in Figure 11.
The larger the d represented by volume change are, the greater the damage to the CB sample under varying impact loads is. The trend in damage variables in Table 3 indicated significant differences in the damage and fracture degrees of CB samples under the same impact load. These differences were due to variations in the c/s ratios, which lead to varying internal bonding strengths of the CB. The results in Table 3 revealed that the damage variable is able to simultaneously characterize the damage and failure of the CB under different impact loads and c/s ratios.
Figure 11 showed that the d for the CB under different v values exhibited a consistent trend. As the v increased, the d increased correspondingly. When the v rose from 1.7 m/s to 1.8 m/s, the d increased by over 10%. As the v increased from 1.5 m/s to 2.0 m/s, the d ranges for c/s ratios of 1:4, 1:6, 1:8, and 1:10 were 0.238–0.336, 0.274–0.413, 0.391–0.547, and 0.473–0.617, respectively, with changes of 0.098, 0.139, 0.156, and 0.146. This indicated that the c/s ratio significantly affected the damage progression of the CB. When the ratio increased from 1:6 to 1:8, there was a noticeable “leap” phenomenon in d values under different impact loads. This was because the CB, as a granular composite material, contains many voids after casting. When the ratio reached 1:8, the increased void volume significantly reduced the bonding strength and drastically lowered the static compressive strength of the CB (see Table 1), indicating a weakened impact resistance of the CB for this ratio.

5. Conclusions

To study the failure process and damage degree of the CB under impact load, uniaxial impact tests were conducted on four groups of CB samples with different mix ratios using LS-DYNA software on the basis of validating the feasibility of the numerical simulation. The conclusions are as follows:
(1)
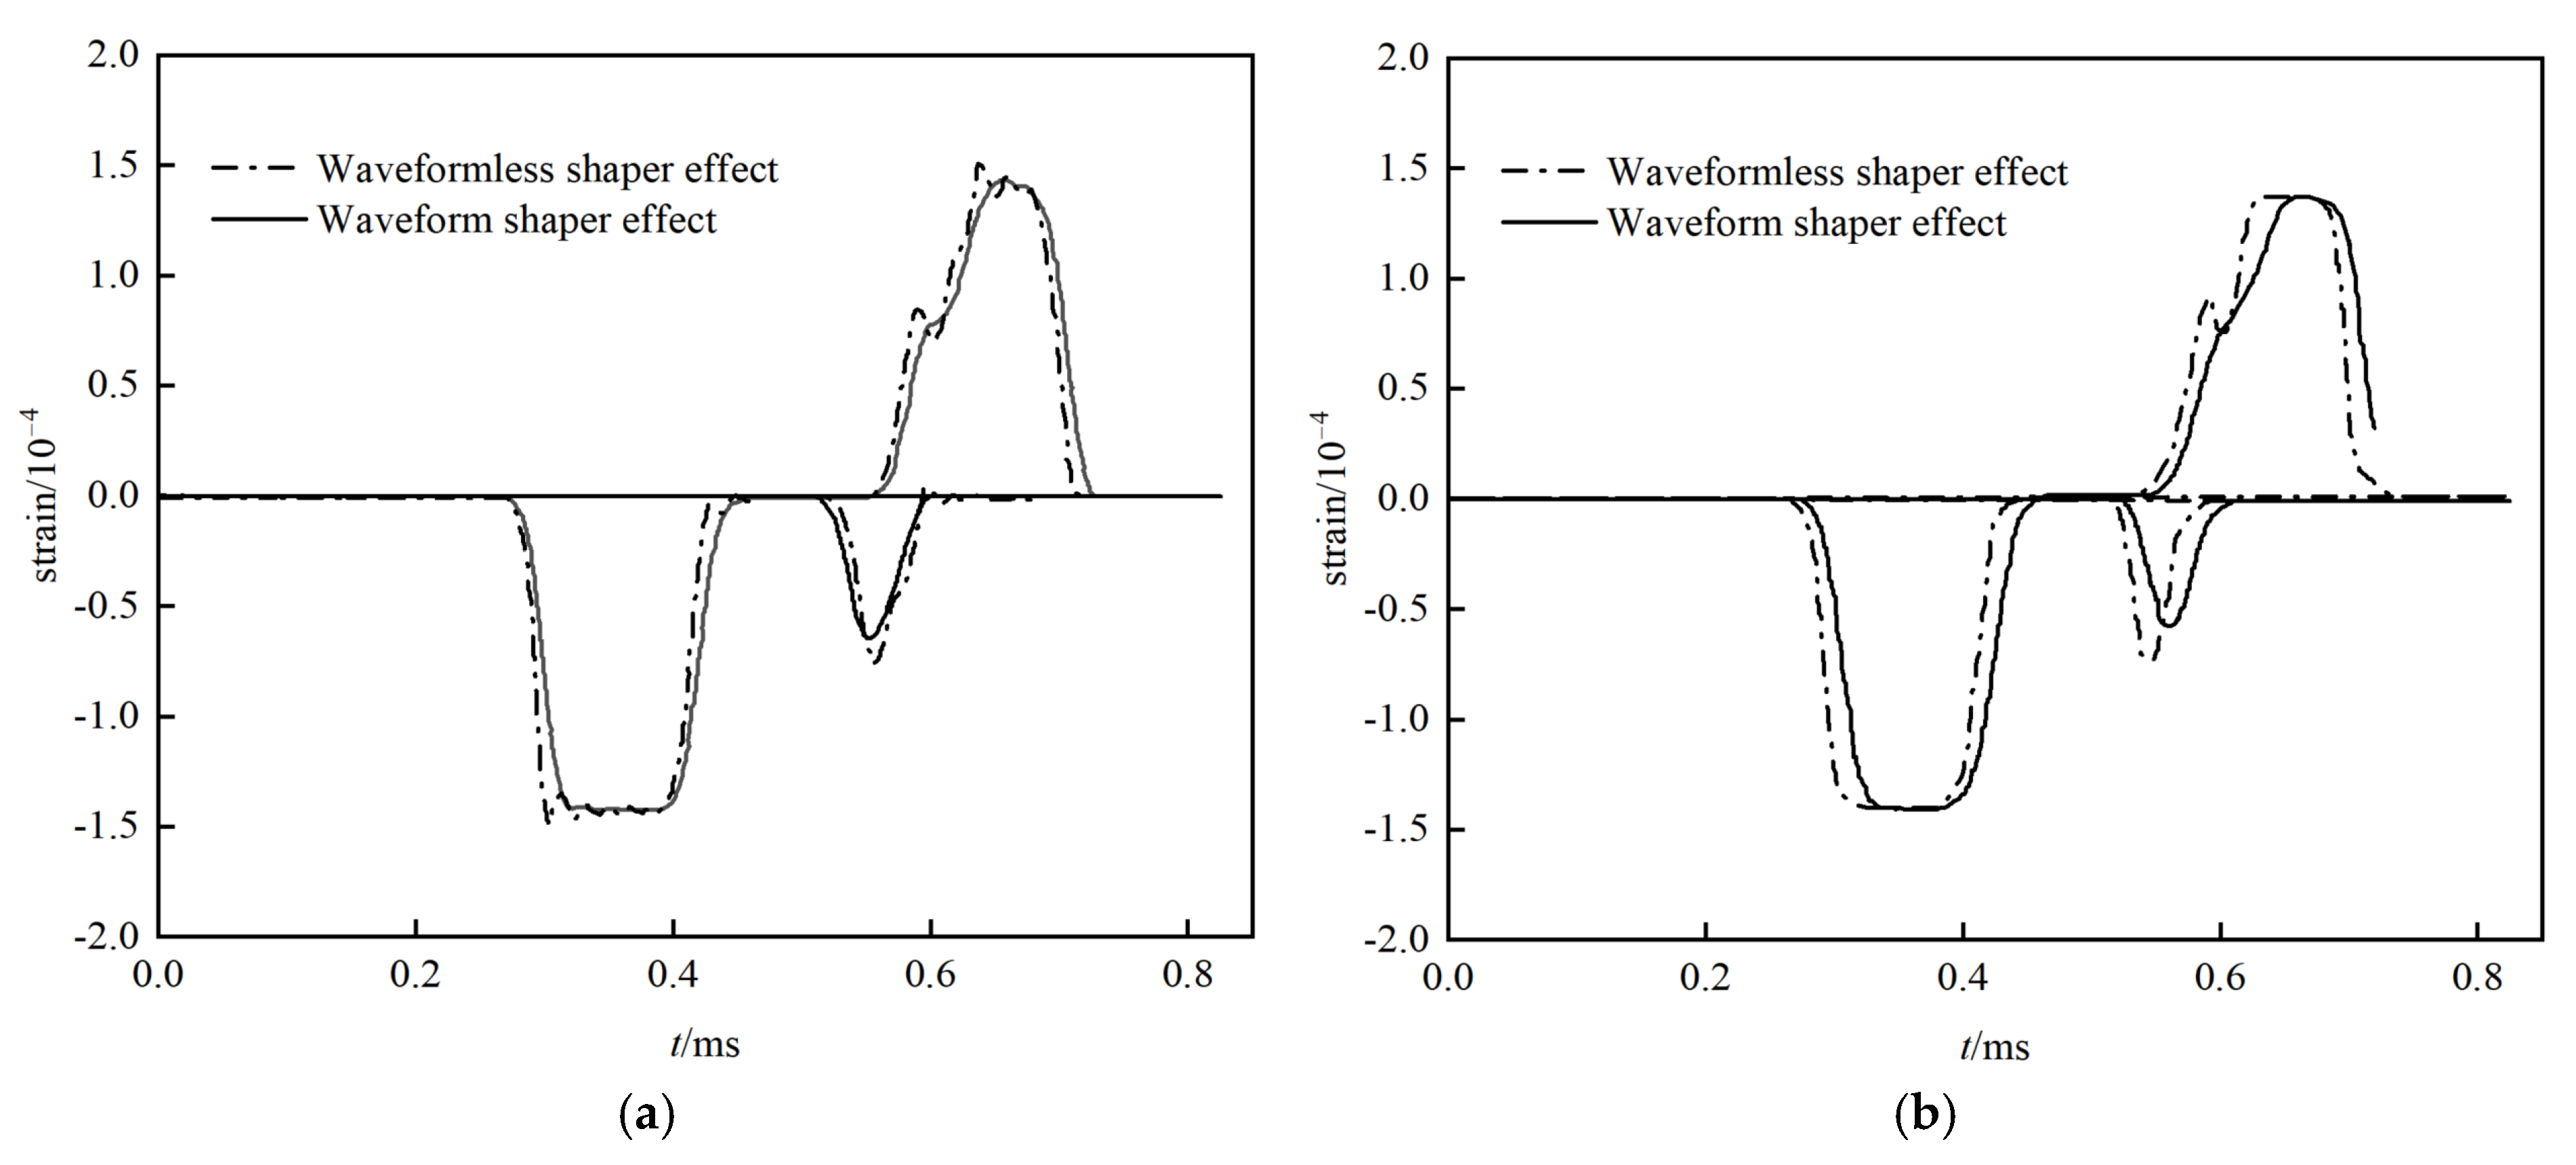
The use of a waveform shaper in the numerical simulation produced a more ideal rectangular wave to ensure uniform stress distribution across the sample’s plane with no stress concentration points.
(2)
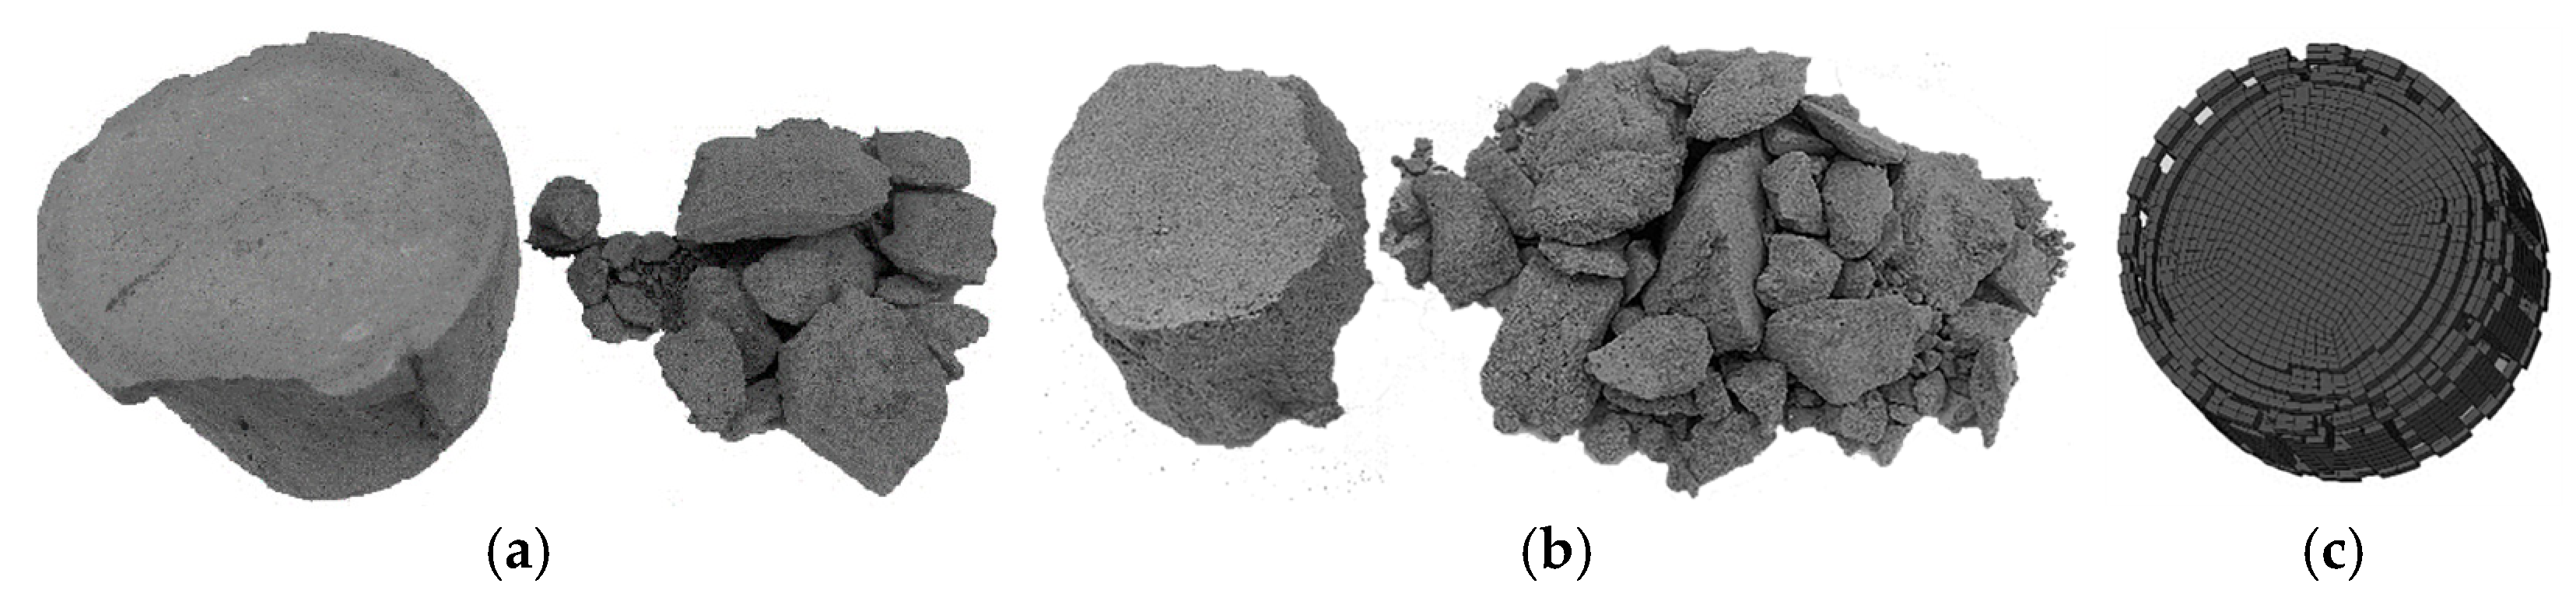
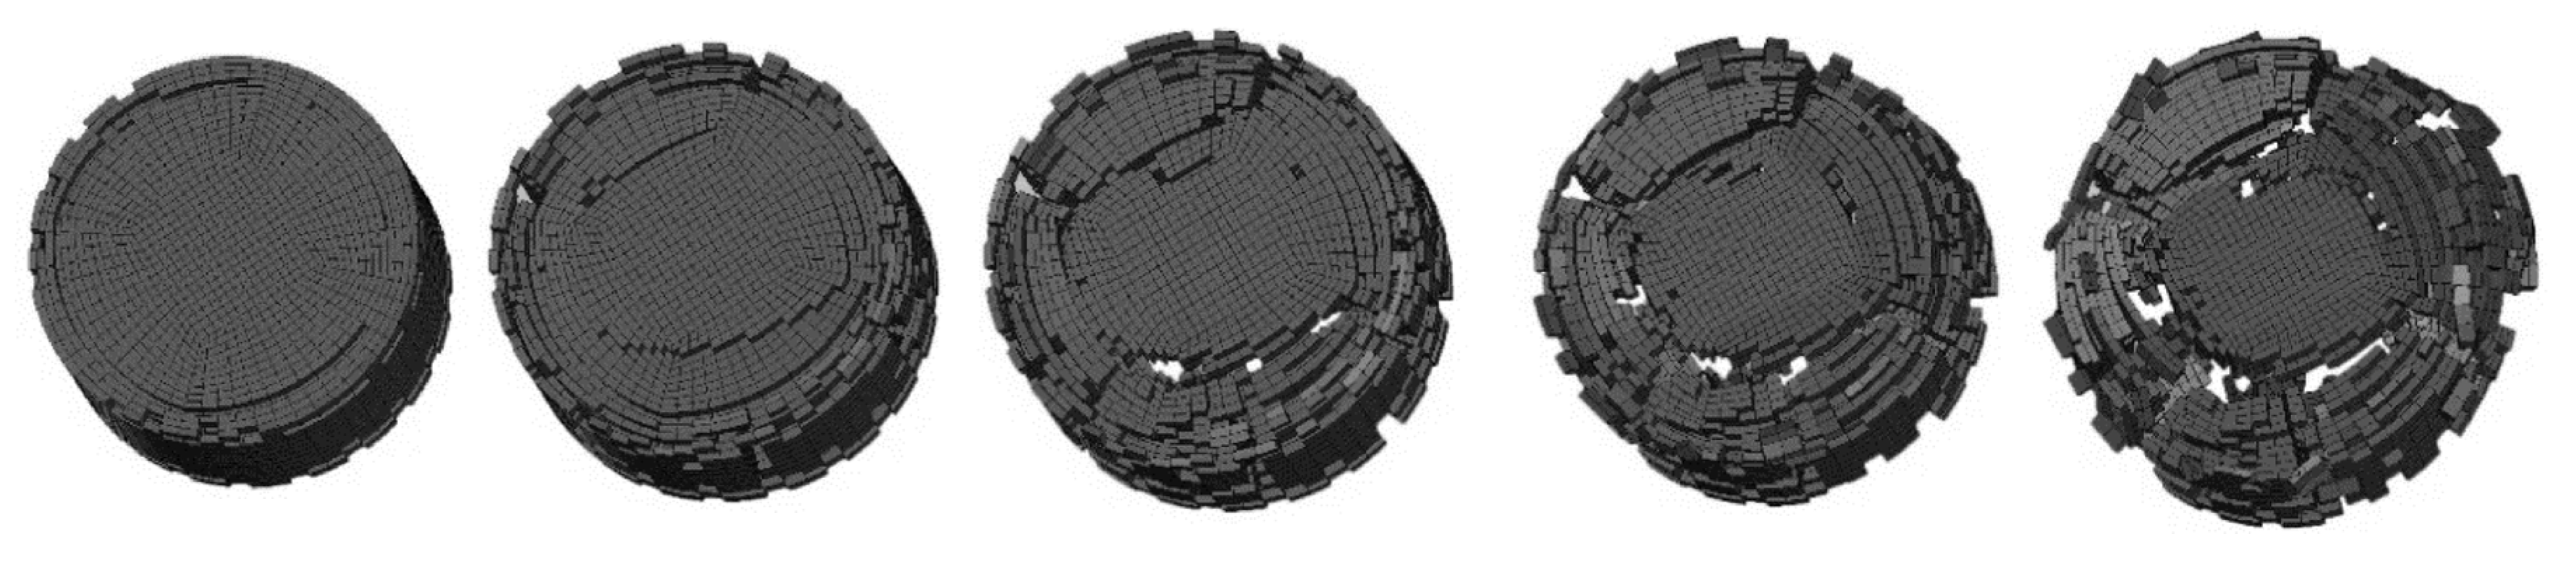
The numerical simulation accurately depicted the dynamic failure process of the CB. Its overall failure tendency was spalling at the sample edges, followed by crack penetration into the interior.
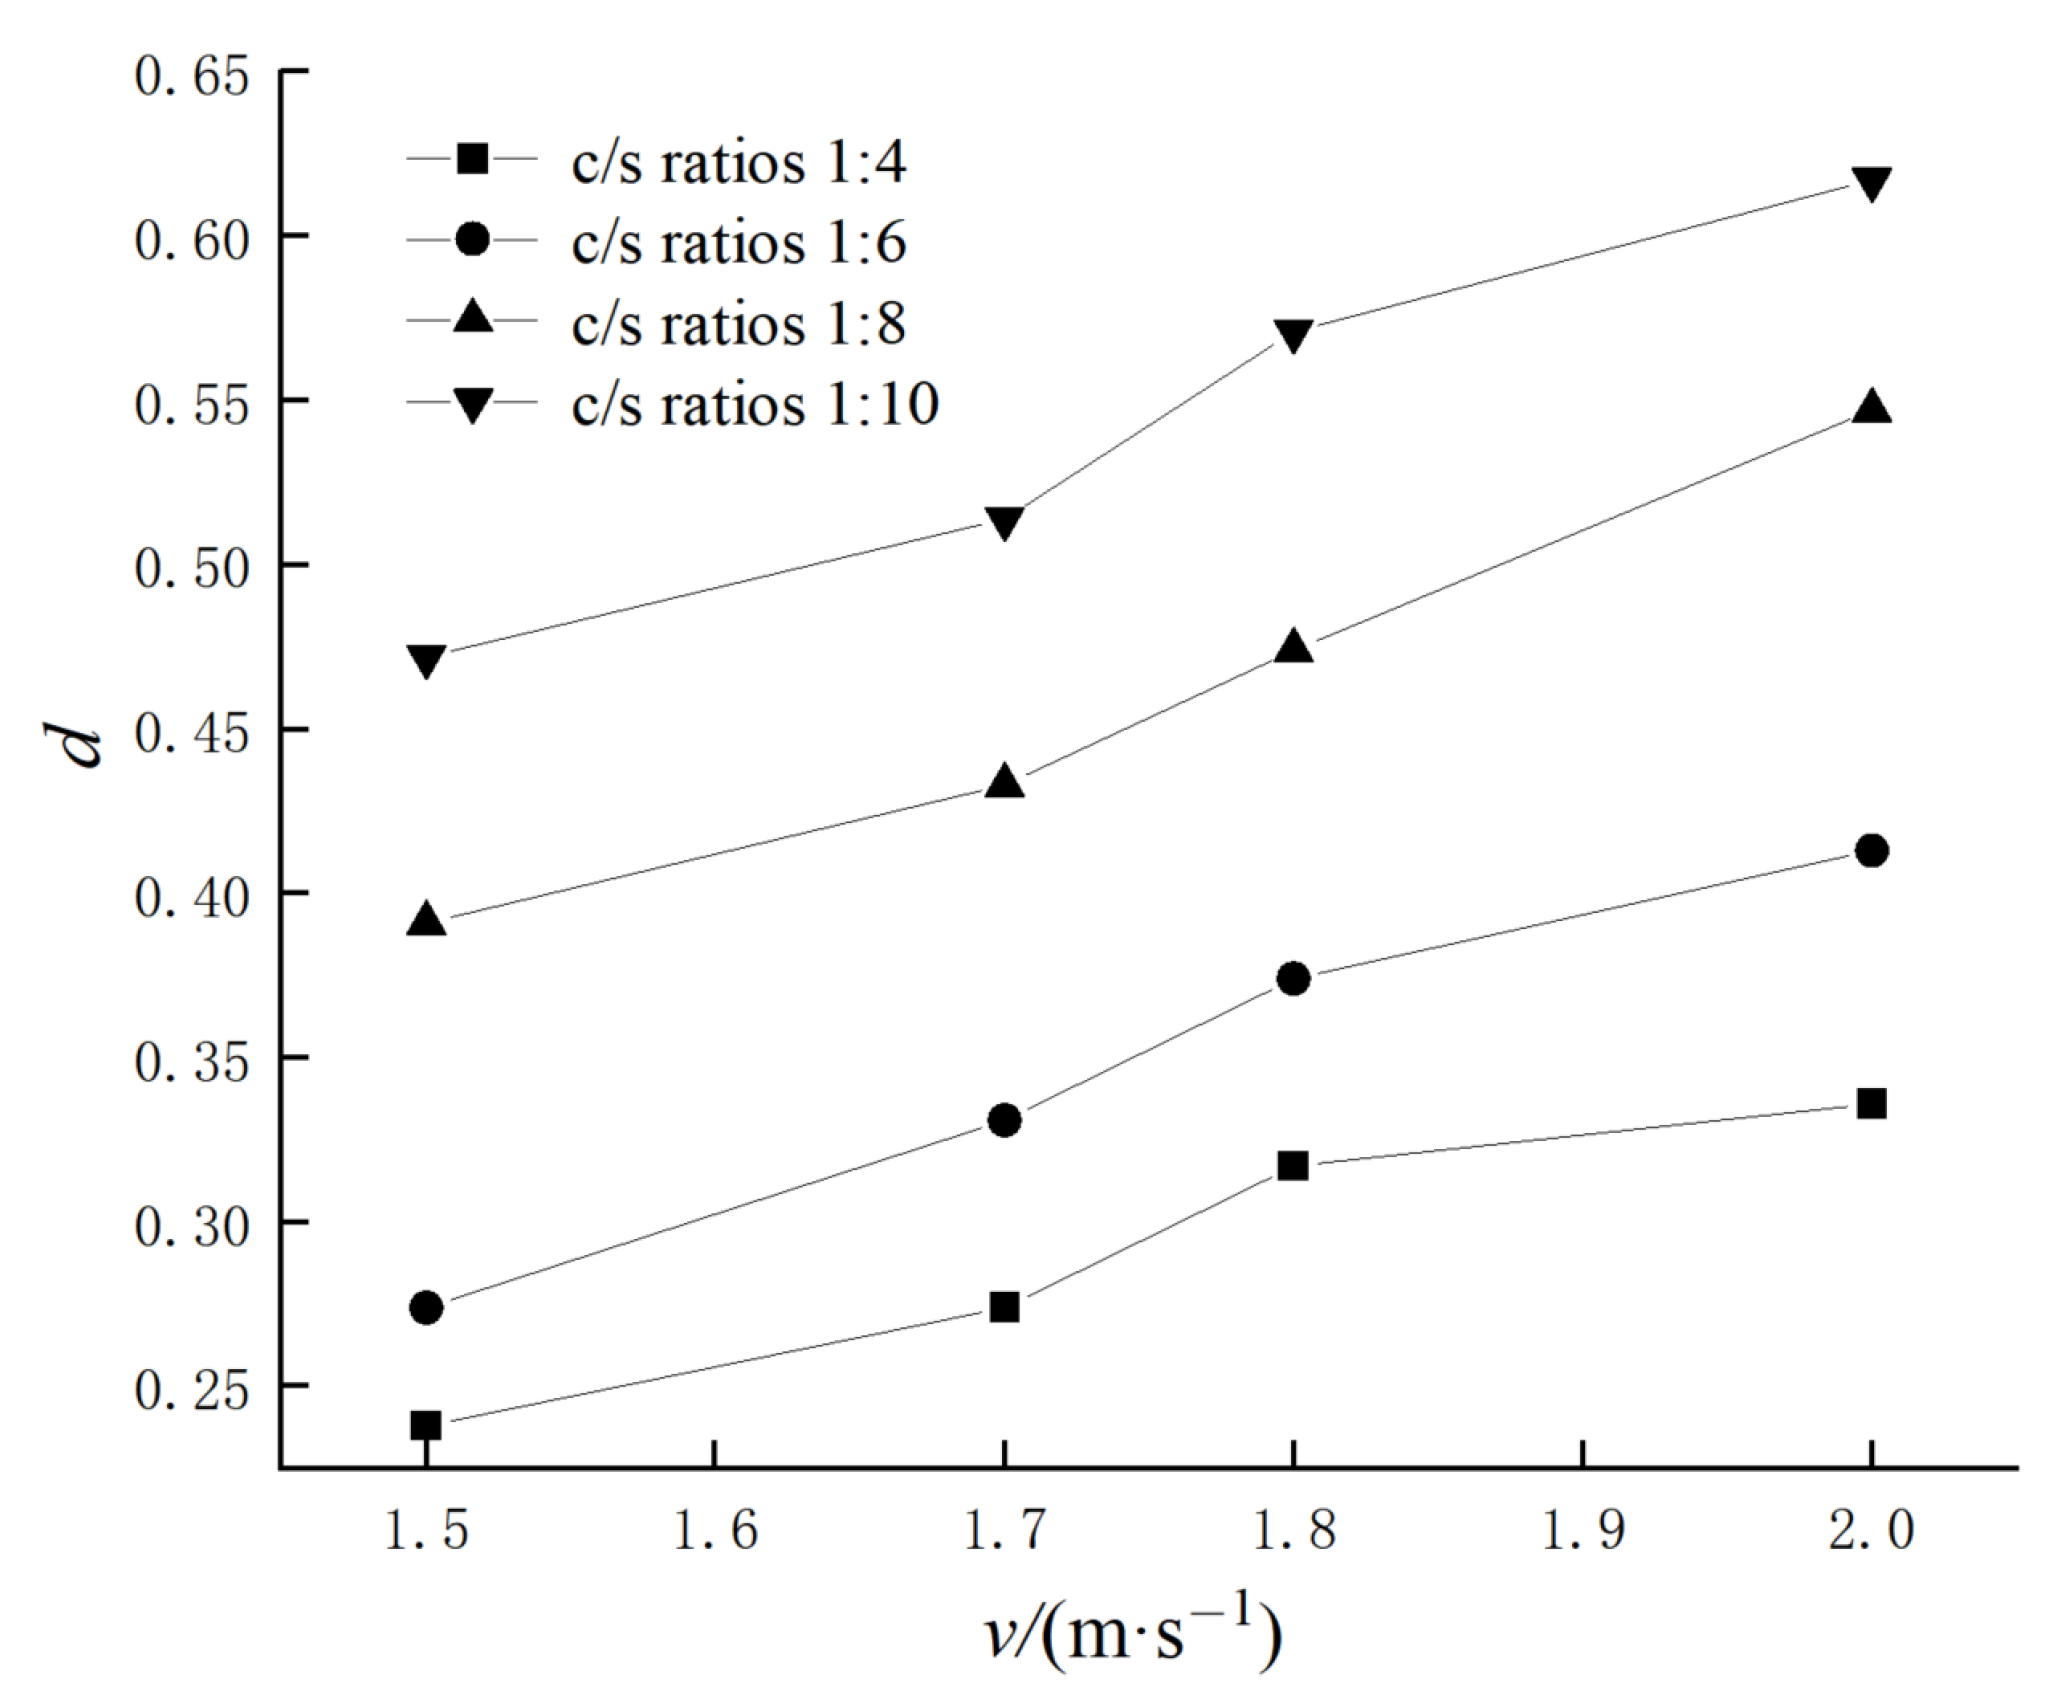
(3)
When the v increased from 1.7 m/s to 1.8 m/s, the d rose by over 10%. As the v increased from 1.5 m/s to 2.0 m/s, the d ranges for c/s ratios of 1:4, 1:6, 1:8, and 1:10 were 0.238–0.336, 0.274–0.413, 0.391–0.547, and 0.473–0.617, respectively. A significant ‘leap’ phenomenon in damage was observed when the c/s ratio changed from 1:6 to 1:8.

6. Discussion

Because the cemented filling body is a heterogeneous material, there are some errors in the basic parameters of different specimens, and there are also some errors in the value of the material in the numerical simulation. Although the numerical simulation results can qualitatively describe the damage and damage of the cemented filling body with different ratios, it can only provide a certain range of basis, but in the actual project, it is necessary to make the cemented filling body with the precise ratio of cement to sand according to the needs.

Author Contributions

Conceptualization, Q.L.; Methodology, Q.L.; Software, X.X.; Formal analysis, Q.D.; Investigation, Q.D.; Resources, X.X. and J.W.; Writing—original draft, Q.L.; Writing—review & editing, J.S.; Visualization, H.Z.; Supervision, H.Z. and T.W.; Project administration, T.W.; Funding acquisition, J.S. and Q.D. All authors have read and agreed to the published version of the manuscript.

Funding

This study was funded by Professor J.S.’s The National Key Research and Development Program (2021YFC31008), Wuhan key Research and Development Program (2024050802030155), 2024 Chutian Talent Plan—Science and Technology Innovation Team Project and Associate Professor Q.D.’s The National Natural Science Foundation of China (No. 52108368).

Data Availability Statement

All data, models, or codes that support the findings of this study are available from the corresponding author upon reasonable request.

Conflicts of Interest

The author(s) declared no potential conflicts of interest with respect to the research, authorship, and/or publication of this article.

References

  1. Zhao, Y.H.; Zhou, X.H.; Zhou, Q.S.; Cheng, F.J.; Guo, W.X. Solid waste binder cemented dihydrate phosphogypsum aggregate to prepare backfill material. Miner. Eng. 2025, 226, 109249. [Google Scholar] [CrossRef]
  2. Liu, S.G.; Fall, M.; Haruna, S. Understanding the Triaxial Behavior of Cemented Tailings Backfill Reinforced with Fibers. Int. J. Geomech. 2025, 25, 04025078. [Google Scholar] [CrossRef]
  3. Li, Q.L.; Wang, B.W.; Liu, C.Y.; Kang, M.C.; Yang, L. Rheological and thixotropic properties of cemented ultrafine tailings backfill with cold-bonded lightweight aggregates. Powder Technol. 2025, 455, 120750. [Google Scholar] [CrossRef]
  4. Chen, S.J.; Jin, A.B.; Zhao, Y.Q.; Wang, Z.S.; Zheng, Y.M. Strength deterioration mechanism of horizontal stratified cemented tailings backfill under uniaxial compression. Case Stud. Constr. Mater. 2024, 22, e04154. [Google Scholar] [CrossRef]
  5. Zhang, S.Y.; Sun, W.; Hou, Z.M.; Wu, A.X.; Li, Z.Y.; He, Y.Y.; Liu, B.; Jiang, M.G.; Wang, S.Y. Research on the strength influence and crack evolution law of layered backfill based on macro and meso mechanical response. Constr. Build. Mater. 2024, 449, 138493. [Google Scholar] [CrossRef]
  6. Zhang, H.B.; Gao, T.; Wang, F.L.; Lin, Q.B.; Zhang, S.C.; Zou, C.H.; Yang, S.J.; He, H.Y. Evolution of strain field and crack prediction in cemented paste backfill specimens based on digital image correlation and computer vision recognition model. Sci. Rep. 2025, 15, 10698. [Google Scholar] [CrossRef]
  7. Zhu, P.R.; Song, W.D.; Xu, L.H.; Wang, J.; Wan, F. A study on mechanical properties of cemented backfills under impact compressive loading. J. Vib. Shock 2018, 37, 131–137, 166. [Google Scholar]
  8. Tan, Y.Y.; Yang, J.S.; Deng, Y.C.; Kou, Y.; Li, Y.; Song, W. Research on the Long-Term Mechanical Behavior and Constitutive Model of Cemented Tailings Backfill Under Dynamic Triaxial Loading. Minerals 2025, 15, 276. [Google Scholar] [CrossRef]
  9. Yin, S.H.; Zeng, J.L.; Yan, Z.P.; Wang, L.M.; Chen, W.; Chen, D.P.; Yang, J. Damage constitutive models and damage evolution of cemented tailings and waste-rock backfill under impact loading. Constr. Build. Mater. 2025, 460, 139838. [Google Scholar] [CrossRef]
  10. Zhu, T.Y.; Chen, Z.H.; Wang, Z.Y.; Cao, J.; Hao, J.S.; Zhou, Z.H. Energy damage evolution and mesoscopic failure mechanism of cemented waste rock tailing backfill under axial compression. Structures 2025, 71, 108057. [Google Scholar] [CrossRef]
  11. Zhang, C.; Guo, J.P.; Song, W.D.; Tan, Y.; Taheri, A.; Wang, X. Stability analysis and strength optimization of cemented tailings backfill in high-temperature mining. Green Smart Min. Eng. 2025, 2, 84–95. [Google Scholar] [CrossRef]
  12. Hou, J.F.; Liu, K.Y.; Li, J.B.; Wang, B. Mechanical behavior and meso-degradation mechanism of cemented paste backfill under the coupled effect of disturbance damage and dry-wet cycles. Sci. Rep. 2025, 15, 13587. [Google Scholar] [CrossRef] [PubMed]
  13. Zhang, C.; Guo, J.P.; Song, W.D.; Taheri, A.; Wang, X.; Xia, W. Simulation of hydration reactions and microstructural characteristics of cemented tailings backfill under temperature effects. Constr. Build. Mater. 2025, 470, 140573. [Google Scholar] [CrossRef]
  14. Gao, T.; Wu, A.X.; Wang, S.; Ruan, Z.; Chen, C.; Sun, W. Experimental and numerical investigations of bending mechanical properties and fracture characteristics of cemented tailings-waste rock backfill under three-point bending. Constr. Build. Mater. 2024, 447, 138149. [Google Scholar] [CrossRef]
  15. Yang, Y.; Li, X.L.; Yang, R.S.; Wang, J.G. Study on Fractal Characteristics and Fracture Mechanism of Frozen Rocks. Trans. Beijing Inst. Technol. 2020, 40, 632–639, 682. [Google Scholar]
  16. Yang, Y.; Zhang, N.N.; Wang, J.G. A Study on the dynamic strength Deterioration Mechanism of Frozen Red Sandstone at Low Temperatures. Minerals 2021, 11, 1300. [Google Scholar] [CrossRef]
  17. Wang, J.G.; Liang, S.F.; Gao, Q.C.; Li, X.L.; Wang, L.N.; Zhao, Y. Experimental study of jointed angles impact on energy transfer characteristics of simulated rock material. J. Cent. South. Univ. Sci. Technol. 2018, 49, 1237–1243. [Google Scholar]
  18. Li, H.C.; Chen, Y.; Liu, D.S.; Huang, Y.H.; Zhao, L. Sensitivity Analysis Determination and Optimization of Rock RHT Parameters. Trans. Beijing Inst. Technol. 2018, 38, 779–785. [Google Scholar]
  19. Zhang, M.T.; Wang, W.; Zhang, S.Y. Numerical Simulation of Failure Process and Damage of Gray Sandstone under Impact Loading. Blasting 2020, 37, 46–54. [Google Scholar]
  20. Zhu, P.R.; Song, W.D.; Cao, S.; Wan, F.; Zheng, D. Tensile mechanical response mechanism ofcemented backfills under blasting load. J. Min. Saf. Eng. 2018, 35, 605–611. [Google Scholar]
  21. Li, X.L.; Zhang, S.T.; Li, M.Y.; Huang, Y.H.; He, L.H. Simulation Research of AUTODYN-Based Bulging Motion of Rock Blast. J. China Coal Soc. 2013, 33, 1220–1223. [Google Scholar]
  22. Huang, Y.H.; Liang, S.F.; Liu, D.S.; Xiong, W.G.; Xu, R. 3D SHPB Device Experimental Design and Principle Research. Trans. Beijing Inst. Technol. 2014, 34, 1024–1027, 1033. [Google Scholar]
  23. Li, X.L.; Wang, J.G.; Zhang, Z.Y.; Huang, Y.H. Experimental study for effects of strain rates and joint angles on dynamic responses of simulated rock materials. Explos. Shock Waves 2016, 36, 483–490. [Google Scholar]
  24. Chai, S.B.; Wang, H.; Jing, Y.L.; Jia, N. Experimental study on cumulative damage dynamic compression characteristics of filled jointed rock. Rock. Mech. Eng. 2020, 39, 2025–2037. [Google Scholar]
Figure 1. Distribution curve of tailings particle size.
Crystals 15 00514 g001
Figure 2. Photos of CB samples.
Crystals 15 00514 g002
Figure 3. Schematic diagram of SHPB experiment apparatus.
Crystals 15 00514 g003
Figure 4. Numerical model and meshing.
Crystals 15 00514 g004
Figure 5. An illustration of the waveform shaper. (a) Imparting an initial velocity to the bullet; (b) applying a stress wave to the incident end.
Crystals 15 00514 g005
Figure 6. Stress monitoring point.
Crystals 15 00514 g006
Figure 7. Time-dependent stress curve.
Crystals 15 00514 g007
Figure 8. Comparison of stress–strain curves at a bullet velocity of 1.7 m/s.
Crystals 15 00514 g008
Figure 9. Comparison of failure modes of CB samples. (a) Experimental failure mode at v = 1.7 m/s; (b) experimental failure mode at v = 2.0 m/s; (c) numerical failure mode at σ = 0.165 MPa.
Crystals 15 00514 g009
Figure 10. The failure process of the CB sample with a c/s ratio of 1:4.
Crystals 15 00514 g010
Figure 11. Variations in damage variable.
Crystals 15 00514 g011
Table 1. Basic physical and mechanical parameters of CB samples.
c/s RatiosAverage Density ρ/kg·m−3Uniaxial Compressive Strength fc/MPaTensile Strength T/MPaElastic Modulus E/GPaPoisson’s Ratio μ
1:41715.73.630.3570.6320.20
1:61708.13.250.3110.5060.18
1:81696.91.920.2050.4740.16
1:101681.41.410.1540.4690.12
Note: To avoid experimental error and chance, the proportioning parameters of each sample take the average value.
Table 2. The HJC model parameters of the CB when the c/s ratio is 1:4.
R0/(g·m−3)G/(GPa)T/(MPa)fc/(MPa)CESPOA
1.7163200.3573.6300.01010−60.350
BNSFMAXpl/(GPa)pc/(MPa)μlμc
0.8500.6107.000.1001.2100.1400.014
K1/(GPa)K2/(GPa)K3/(GPa)D1D2EFIMNFs
8.500−1720.800.0401.0000.0100.004
Table 3. Damage variable of CB samples under dynamic impact.
Numberingc/s Ratiosv/(m·s−1)V/(m3)d
11:42.006.75 × 10−60.336
21.806.37 × 10−60.317
31.705.51 × 10−60.274
41.504.78 × 10−60.238
51:62.008.30 × 10−60.413
61.807.52 × 10−60.374
71.706.65 × 10−60.331
81.505.51 × 10−60.274
91:82.001.10 × 10−60.547
101.809.53 × 10−60.474
111.708.70 × 10−60.433
121.507.86 × 10−60.391
131:102.001.24 × 10−50.617
141.801.15 × 10−50.571
151.701.03 × 10−50.514
161.509.51 × 10−60.473
Disclaimer/Publisher’s Note: The statements, opinions and data contained in all publications are solely those of the individual author(s) and contributor(s) and not of MDPI and/or the editor(s). MDPI and/or the editor(s) disclaim responsibility for any injury to people or property resulting from any ideas, methods, instructions or products referred to in the content.

