Article

Boundary Between Amorphously and Molecularly Dispersed Curcumin of Its Amorphous Solid Dispersions Determined by Fluorescence Spectroscopy

1
College of Material Engineering, Fujian Agriculture and Forestry University, Fuzhou 350100, China
2
School of Resources and Chemical Engineering, Sanming University, Sanming 365004, China
3
Sanming Institute of Fluorochemical Industry, Sanming University, Sanming 365004, China
4
School of Chemical Engineering, Fuzhou University, Fuzhou 350116, China
*
Authors to whom correspondence should be addressed.
Crystals 2025, 15(6), 512; https://doi.org/10.3390/cryst15060512
Submission received: 16 April 2025 / Revised: 22 May 2025 / Accepted: 24 May 2025 / Published: 27 May 2025

Abstract

:
Amorphous solid dispersion (ASD) technology is popularly used for enhancing the solubility of poorly water-soluble drugs. Drug molecules in ASDs can be dispersed in the form of either amorphous (AASD) or molecular (MASD) forms. The boundary between AASDs and MASDs (A–M boundary) is defined as the drug concentration at which the existence of MASDs obviously influences the physicochemical properties of ASDs. In this work, fluorescence spectroscopy based on the aggregation-caused quenching (ACQ) phenomenon was used to determine the A–M boundary of curcumin (CUR) ASDs prepared via neat ball milling. The relationship between the fluorescence intensity and the loading of CUR in the sample is consistent with the Stern–Volmer equation. For the CUR ASDs with PVP, the samples with CUR loading below 10% show significantly increased fluorescence and have a higher solubility (~178 μg·mL−1), suggesting the A–M boundary is around 10%. Similar A–M boundaries around 10% were also observed for CUR ASDs with PVPVA, Soluplus, HPMC, and HPMCAS. It is of great significance to define the A–M boundary of ASDs for guiding pharmaceutical ASD formulas by balancing drug loading, stability, and solubility.

1. Introduction

Amorphous solid dispersion (ASD) technology is one of the most promising approaches for enhancing the solubility of poorly water-soluble drugs [1,2]. In current descriptions, drug molecules in ASDs can be dispersed in a polymer matrix in the form of either amorphous (AASD) or molecular (MASD) forms (Scheme 1). AASDs are usually metastable phases with high drug loads and have a risk of recrystallization. MASDs are usually stable phases with low drug loads (drug molecules dissolve in a polymer matrix, forming a solid-state solution), which increases the intake of polymer excipients. The boundary between AASDs and MASDs (A–M boundary) is defined as the drug concentration at which the existence of MASDs start mainly influencing the physicochemical properties of the ASDs, while the boundary between MASDs and AASDs (M–A boundary) is defined as the drug concentration at which AASDs start mainly influencing the physicochemical properties. When the drug loading of ASDs is between A–M and M–A Boundaries, AASDs and MASDs influence the physicochemical properties together. It is of great significance to define the A–M boundary of ASDs, as the emergence of MASDs has obvious influence on the drug dissolution property, which is of great clinical significance. However, to our best knowledge, there is no research on this. It is still not known how MASDs influence the properties of ASDs. And the answer for where the A–M boundary is (how low a drug loading) would guide the synthesis method and formula of ASDs.
Curcumin (CUR, Figure 1a) has attracted considerable attention for its health benefits and pharmaceutical properties [3]. However, CUR belongs to BCS Class IV and is limited as an oral medication due to its weak solubility and bioavailability [4]. Preparation of ASDs is a common method to improve the water solubility of CUR [5]. And polyvinylpyrrolidone (PVP) is a classical polymer used for preparing CUR ASDs (Table 1). The range of CUR loadings in ASDs with PVP can be wide. Most of these ASDs are prepared by solvent evaporation, and there are also other preparation methods, such as milling, electrostatic spinning, supercritical anti-solvents, etc. The dispersion state of CUR in these ASDs is reported as an amorphous or molecular form. It is strange that the form of CUR in its ASDs with PVP was reported in different literatures as amorphous or molecular with the same CUR contents. Characterization techniques such as powder X-ray diffraction (PXRD), differential scanning calorimeter (DSC), IR, and Raman spectroscopy were used to determine the dispersion state of CUR. It is necessary to develop new methods to distinguish the dispersion state of CUR in its ASDs.
Aggregation-caused quenching (ACQ) refers to the phenomenon that fluorophore with a high emission in dilute solution becomes a weak emission or even no emission in the aggregation state [32]. The fluorescence intensity of ASDs of drugs with the ACQ property are highly correlated with the drug molecule’s dispersion state (amorphous or molecular form), which can be used to determine the A–M and M–A Boundaries of ASDs. CUR is a typical ACQ dye. No fluorescence can be observed for commercial CUR (Figure S1), and its dilute solution shows a distinct fluorescent signal [33]. CUR is a good model for studying the A–M boundary in ASD systems with fluorescence spectroscopy because of its pharmaceutical properties and aggregation-caused quenching property.
In this work, a series of CUR ASDs with PVP were synthesized through neat ball milling with the mass ratio of CUR ranging from 1 to 40 wt.%. IR and Raman spectroscopy failed to distinguish the existing form of CUR, while fluorescence spectroscopy was able to characterize the A–M boundary. When CUR loading is approximately 5–10 wt.%, the ASDs exhibited a prominent fluorescence increase, indicating that MASDs significantly improve the fluorescence property at this CUR loading range, and the A–M boundary of CUR ASDs with PVP is at this range. The dissolution profiles of CUR ASDs with PVP are similar; when the CUR loading is below 10 wt.%, the ASDs show a high solubility of ~178 μg·mL−1. The similar A–M boundary was also observed for CUR ASDs with PVPVA, Soluplus, HPMC, or HPMCAS. CUR ASDs with PVPVA, Soluplus, and HPMC have a significant enhanced solubility when CUR loading is below the A–M boundary. The A–M boundary also influences the dissolution behaviors of ASD systems of other drugs, such as indomethacin (IND). Dissolution profiles of IND ASDs with PVP are similar when IND loading is below 10 wt.%, but face the risk of recrystallization and show a relatively low solubility. The dissolution profiles of ASDs with drug loading below the A–M boundary show significant changes; however, the effect is uncertain. The effects of the A–M boundary of ASDs on solubility can guide the design of pharmaceutical ASD formulas.

2. Experimental Section

2.1. Materials

Curcumin (98%, synthetic, CUR), indomethacin (99%, IND), polyvinylpyrrolidone K30 (PVP), polyvinylpyrrolidone-vinylacetate copolymer (PVPVA), and hydroxypropyl methyl cellulose (HPMC) were bought from Shanghai Aladdin Biochemical Technology Co., Ltd. (Shanghai, China). Packaged Soluplus and hydroxypropyl methyl cellulose acetate succinate (HPMCAS, HF grade) were from BASF Chemicals Co., Ltd. (Ludwigshafen, Rhineland-Palatinate, Germany).

2.2. Methods

2.2.1. Preparation of Curcumin (CUR) ASDs

A total of 2 g of CUR and PVP or other polymers (PVPVA, Soluplus, HPMC, HPMCAS) mixtures were ball milled (Changsha Tianchuang Powder Technology Co., Ltd. Changsha, China, XQM-1, 220 V, 50 Hz, 670 rpm, 100 mL of stainless-steel blow) for 4 h. The material of the balls used for ball milling is ZrO2. The total weight of the balls used is about 88 g, which is composed of 1 ball with Φ15 mm, 1 ball with Φ12 mm, 7 balls with Φ7 mm, 13 balls with Φ 8 mm, and 63 balls with Φ5 mm. The CUR loadings in the ASDs are 1, 2, 4, 6, 8, 10, 12, 14, 16, 18, 20, 30, and 40 wt.%. The ASDs containing 0.1% and 0.01% CUR were prepared via a stepwise dilution process. ASD-0.1% was prepared by neat ball milling of 0.20 g ASD-1% and 1.80 g PVP, and ASD-0.01% was prepared by neat ball milling of 0.20 g ASD-0.1% and 1.80 g PVP.

2.2.2. Preparation of Amorphous CUR

Amorphous CUR was prepared using a melt-quenching method because the ball milled CUR is not amorphous. Briefly, CUR powders were heated at 220 °C on an aluminum substrate until completely melted, and then the melt was cooled at room temperature.

2.2.3. Preparation of Indomethacin ASDs

A total of 2 g of indomethacin (IND) and PVP mixtures were ball milled for 4 h. The IND loadings in the ASDs are 1, 2, 4, 6, 10, and 20 wt.%.

2.2.4. Characterization

The samples were characterized conventionally by powder X-ray diffraction (PXRD, Philips X′Pert Pro, PANalytical, Almelo, The Netherlands, Cu Kα, 40 kV, 30 mA, 5–30°, 4°·min−1), Fourier transform infrared spectroscopy (FTIR, Shimadzu IRAffinity-1S, Shimadzu, Kyoto, Japan, 400–4000 cm−1, 2 cm−1, 32 scans), confocal laser Raman spectroscopy (Thermo Fisher Scientific, Waltham, MA, USA, DXR3xi, 785 nm laser, 35 mW, 0.02 s, 1000 scans, 50–3300 cm−1), and fluorescence spectroscopy (Tianjin Gangdong, F-320A, Tianjin, China, λex 430 nm, 440–700 nm).

2.2.5. Working Curve

A CUR solution of ~10 μg·mL−1 was prepared by dissolving 10 mg of raw CUR in 1 L of 50% (v/v) ethanol–water solvent. The working curve of curcumin 50% (v/v) ethanol–water solutions with absorbance at 430 nm (UV-vis, Shimadzu UV-2550) was established at intervals of 1 μg·mL−1 in the concentration range of 0–10 μg·mL−1.

2.2.6. Dissolution Profiles

For CUR, 40 mg of raw CUR or CUR ASDs containing 40 mg of CUR was added into 200 mL of deionized water (oxygen was removed using ultrasound). For IND, 40 mg of raw IND or ASDs containing 40 mg of IND was used. And then the samples were kept at 37 °C in thermostat water baths. A 5 mL quantity of supernatant was collected and filtered (PES membrane, 0.22 μm) at specific intervals (1, 2, 4, 8, 12, 24, 36, 48, 60, and 72 h). A 3 mL quantity of the filtrate and 3 mL of ethanol were mixed to avoid drug precipitation. The drug concentrations were determined by working curve method. Three parallel samples were tested to ensure accuracy and reproducibility.

3. Results

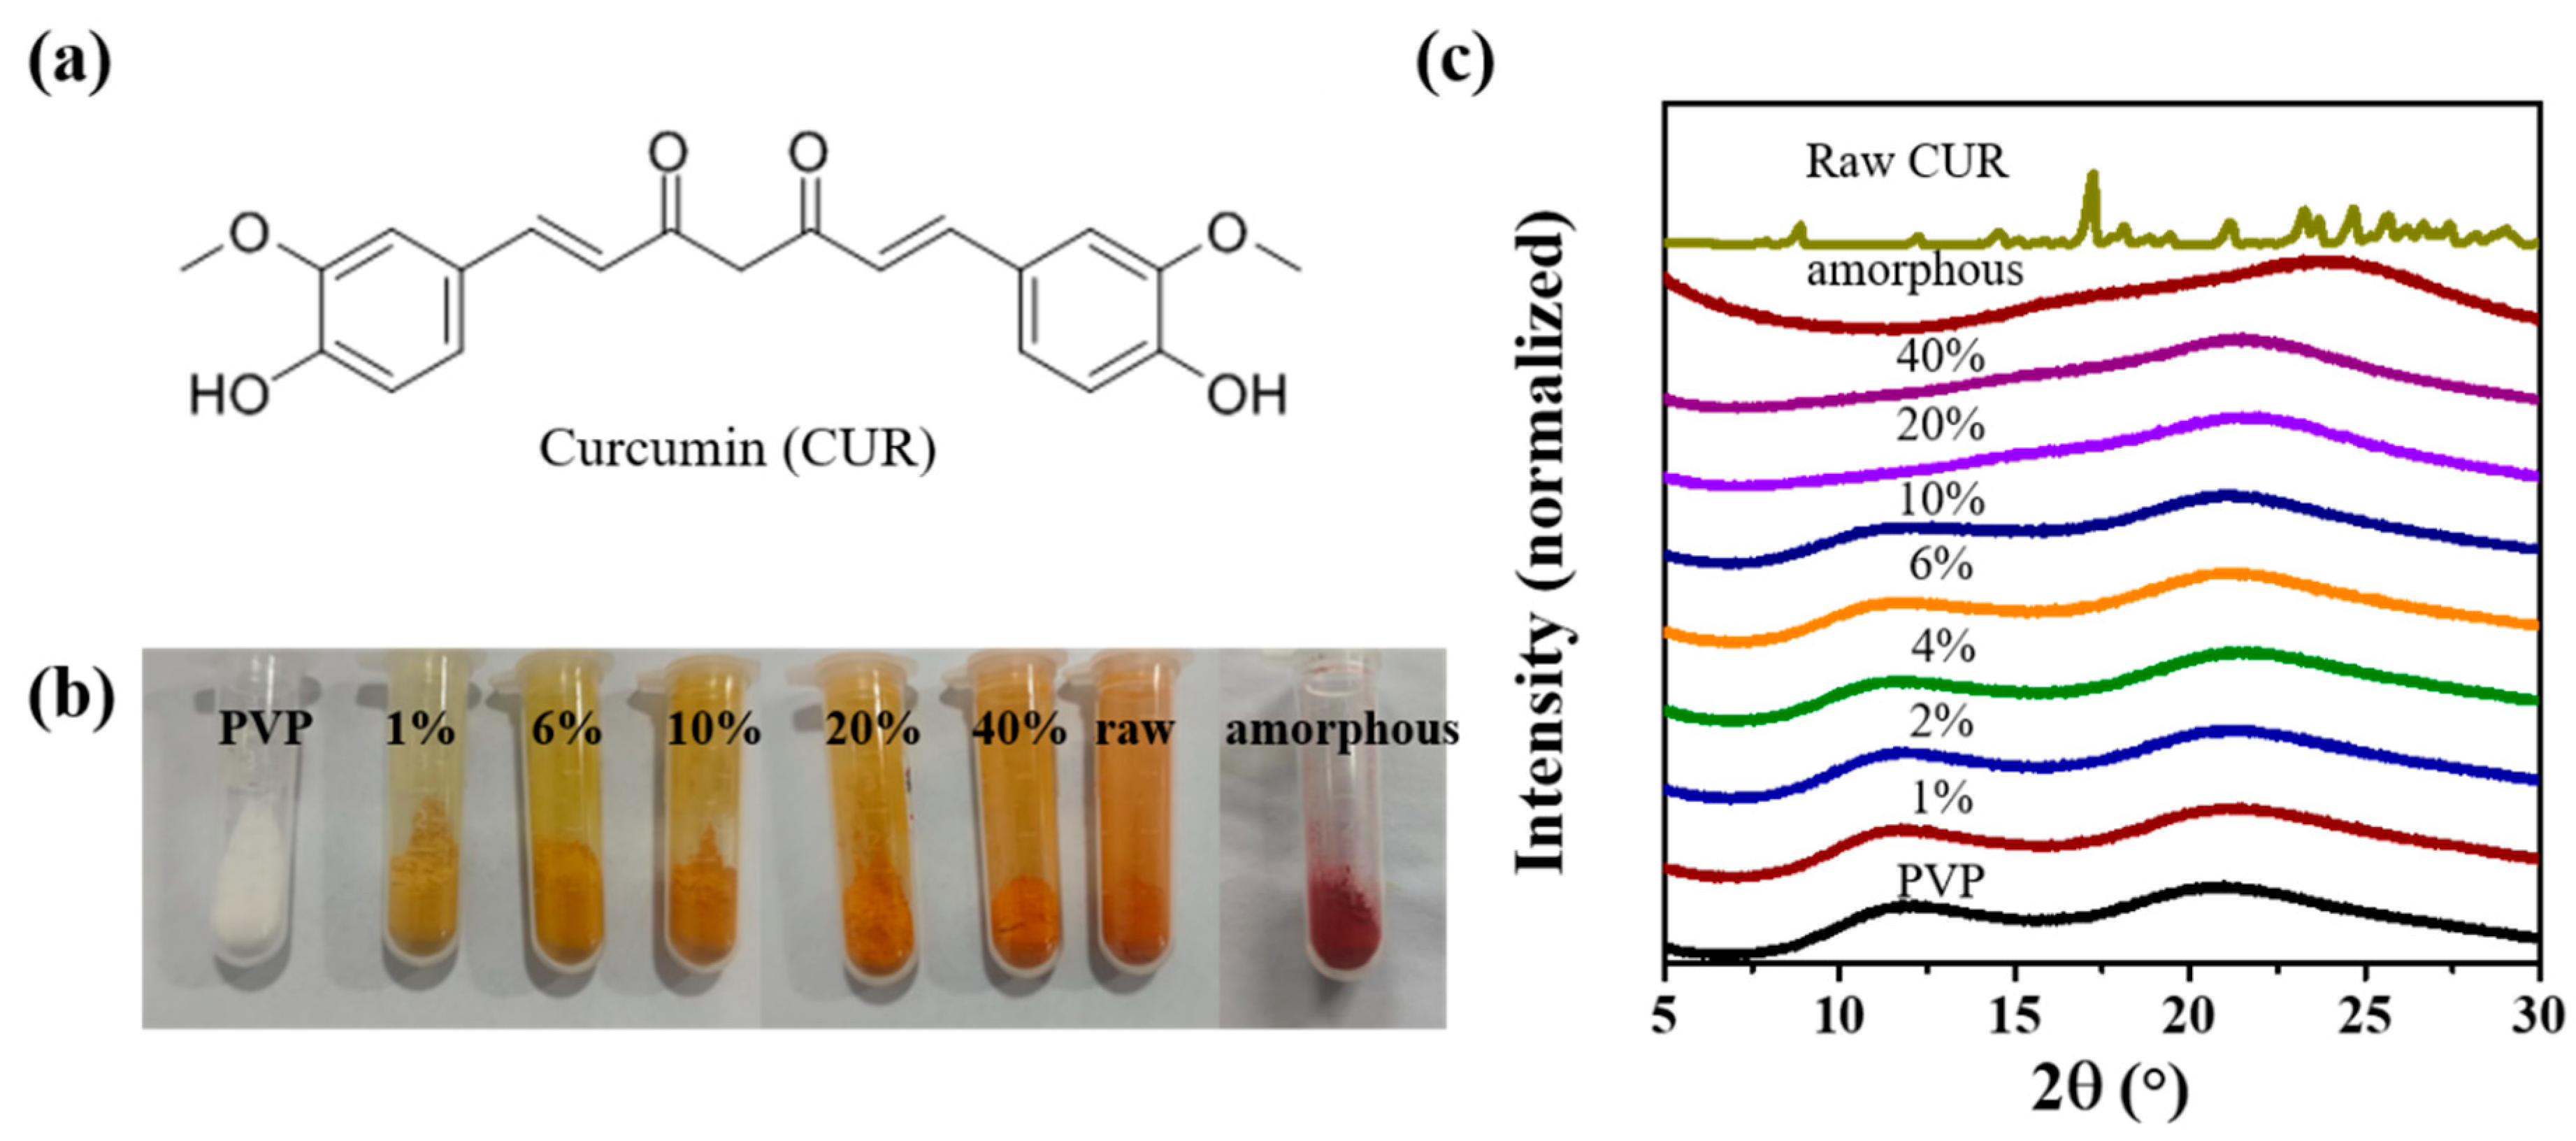
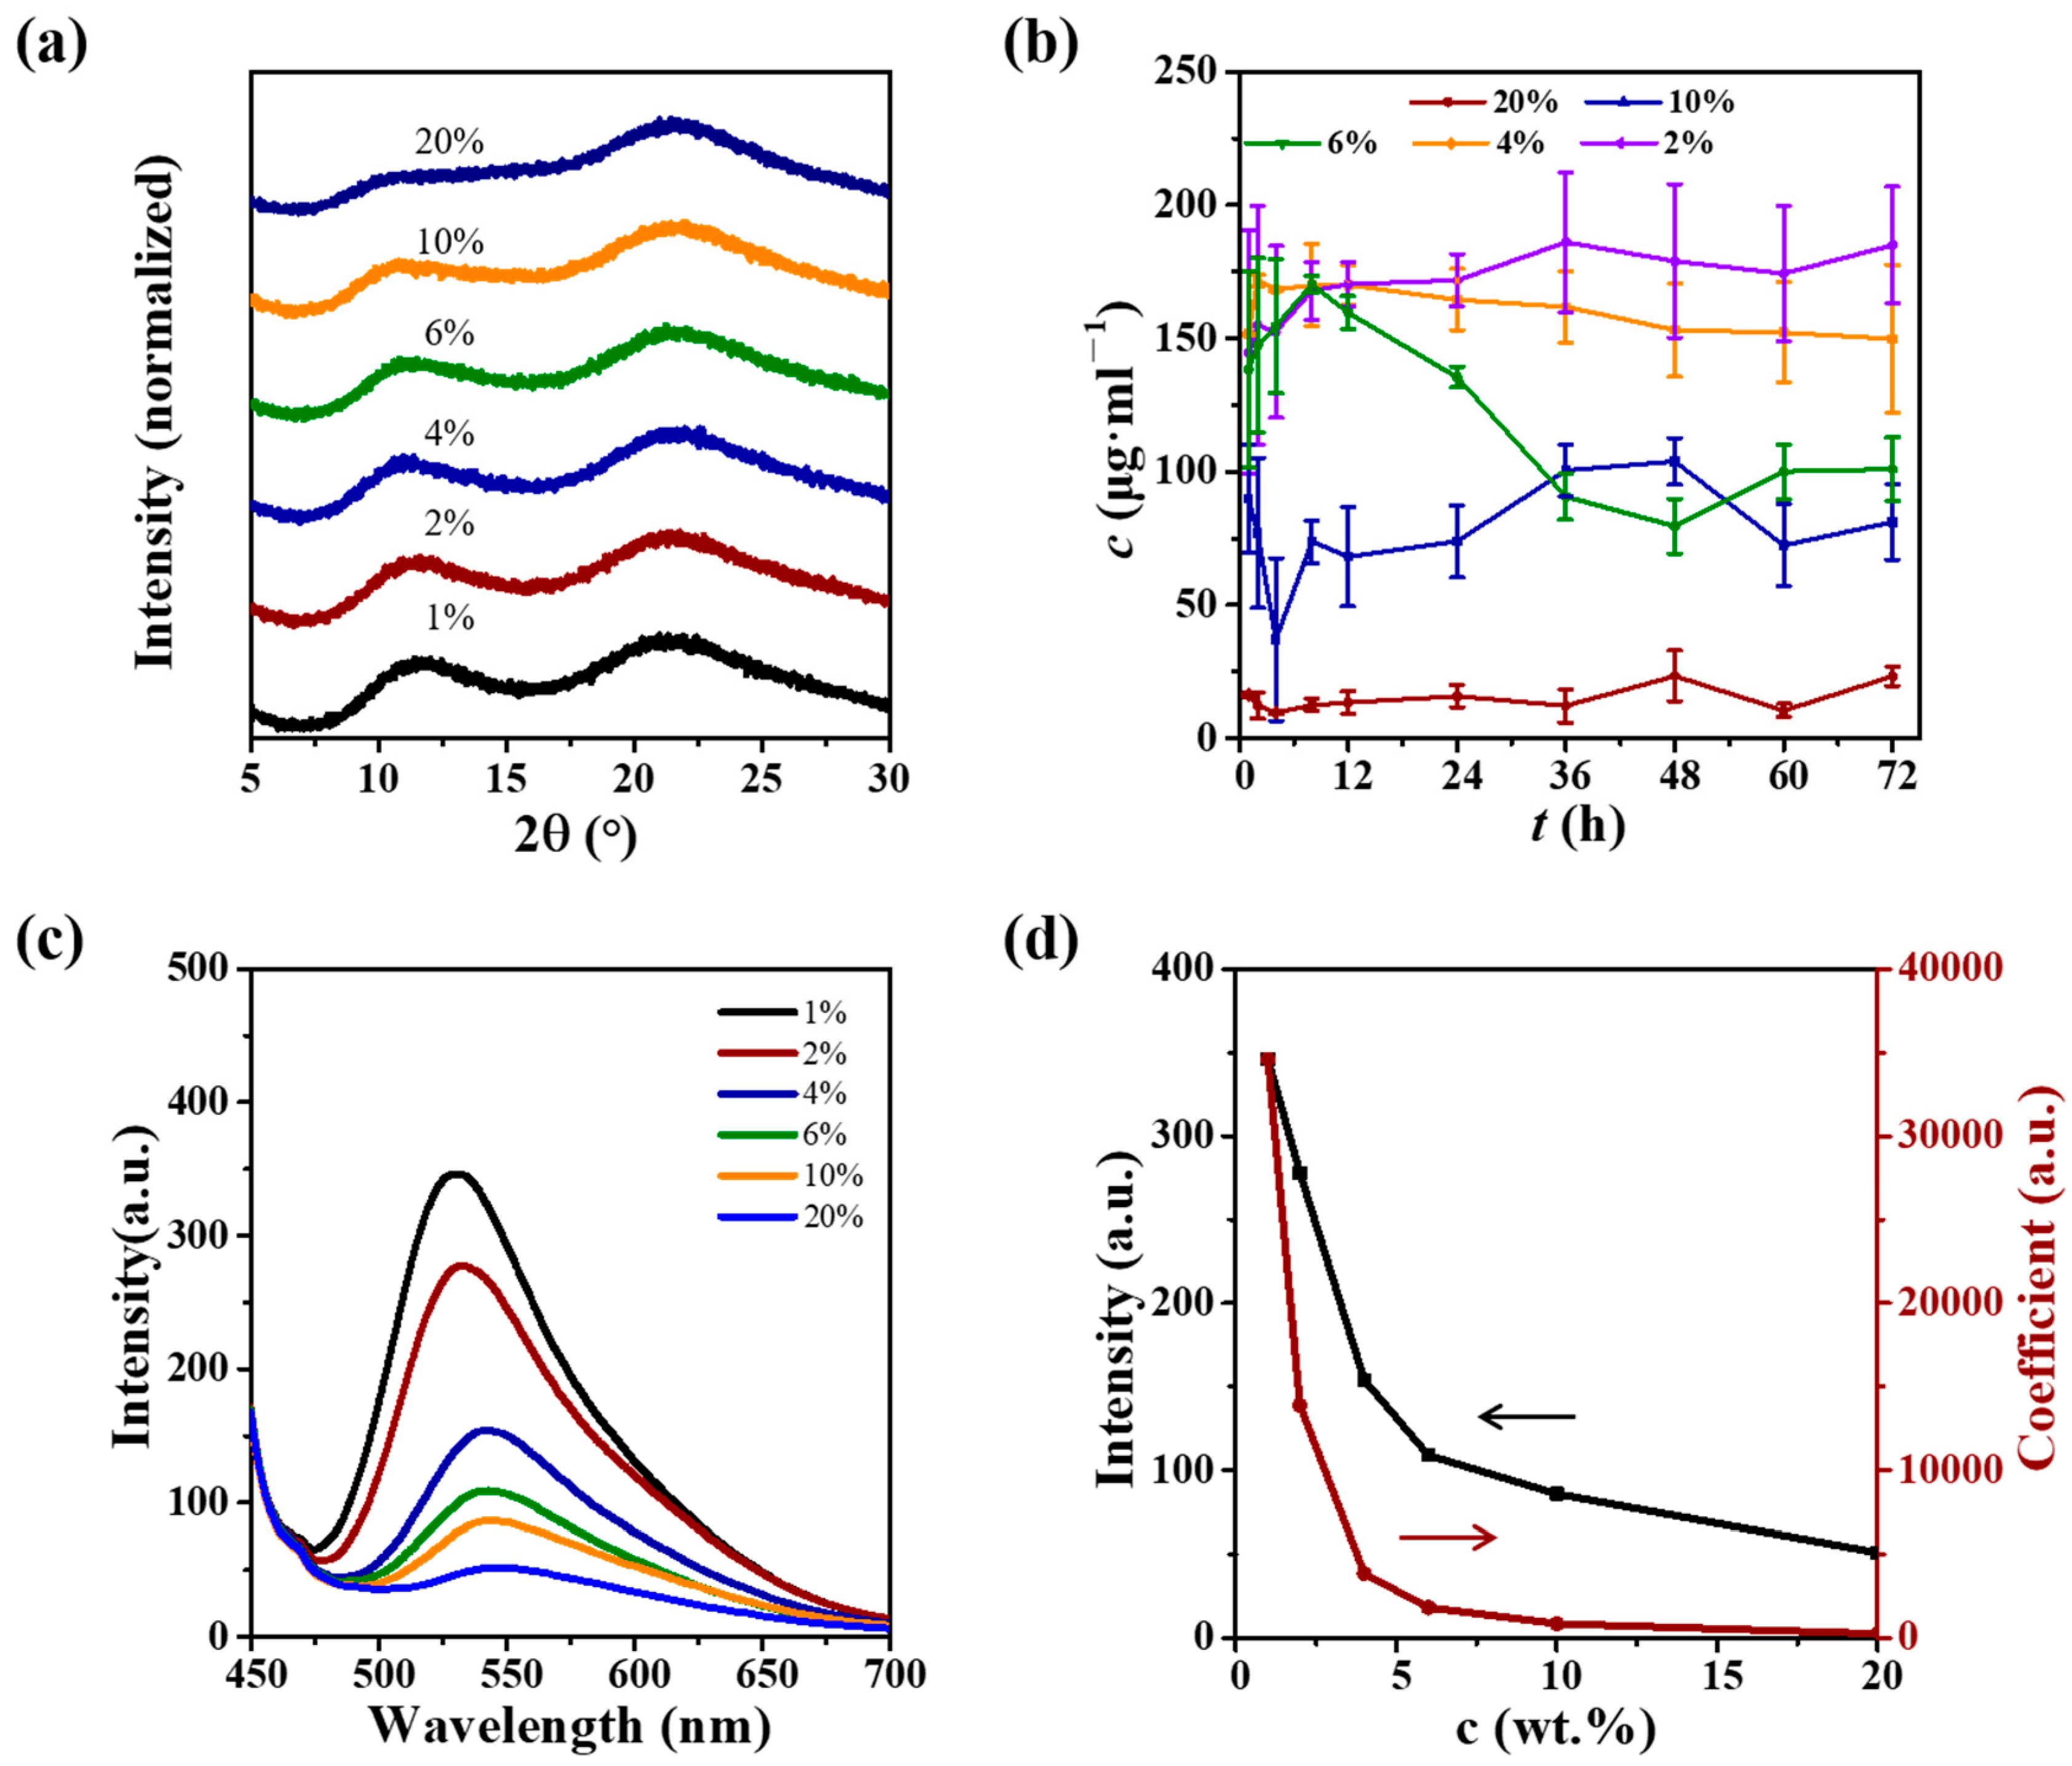
3.1. Preparation and Characterizations of CUR ASDs with PVP

The solid dispersions of CUR and PVP prepared through the ball milling method, with CUR loading ranging from 1 to 40 wt.%, show a uniform yellow appearance (Figure 1b). The sample color gradually transitions from light yellow with 1% curcumin to dark yellow with 40% curcumin. The PXRD patterns confirm that all these solid dispersions are ASDs (Figure 1c), indicating that the current ball milling conditions were sufficient to prepare ASDs of CUR with PVP. The continuous variations of these CUR ASDs’ PXRD patterns are attributed to their different compositions. It is impossible to distinguish between ASD-1% and ASD-10% by visual observation or by comparing their PXRD patterns. Commercial CUR is the stable crystalline Form I, confirmed with its PXRD pattern [34]. In this work, amorphous CUR, prepared by melt-quenching method [35] and confirmed by PXRD pattern, was used as the reference sample. The ball milled CUR is a mixture of amorphous CUR and crystalline Form I (Figure S2), and thus it cannot be used as the amorphous reference.

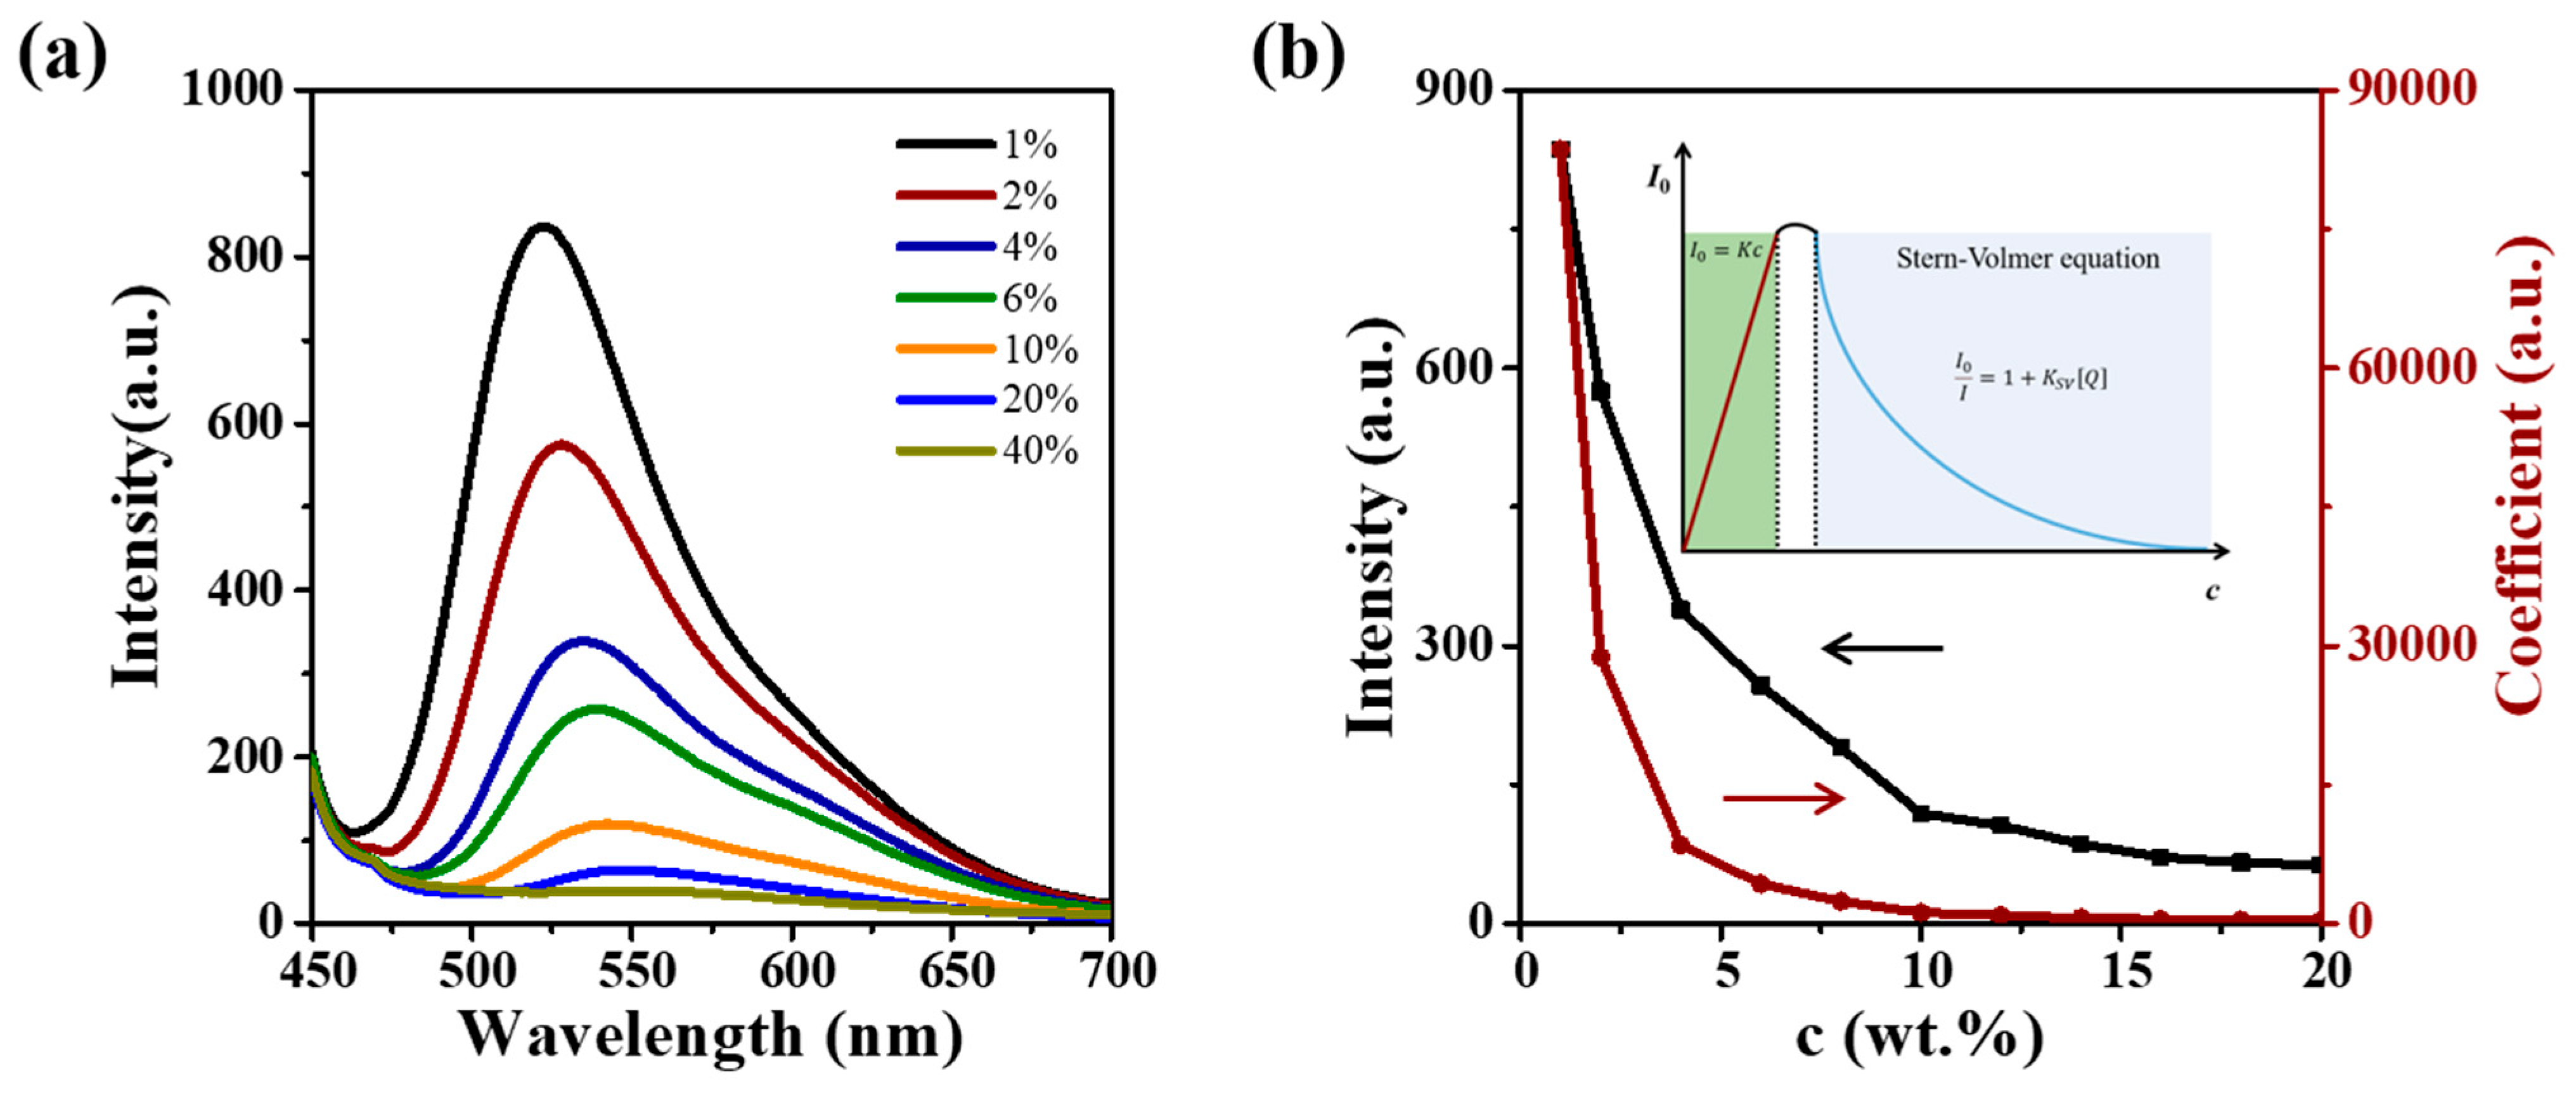
3.2. A–M Boundary Determination for CUR ASDs with PVP

The ACQ phenomenon was observed for CUR ASDs with different CUR loadings (Figure 2a). Considering that the polymer PVP is a white powder with no fluorescence, the fluorescence changes of CUR ASDs can be attributed to the form of CUR. ASD-40% exhibits very weak fluorescence, suggesting that most of the CUR molecules exist in an aggregated state (amorphous state here). Differently, ASD-1% shows relatively strong fluorescence, indicating that some of the aggregated CUR molecules have transformed into dispersed CUR molecules, as represented below.
(CUR)nnCUR
The relationship curve of fluorescence intensity and coefficient k with CUR loadings was used to determine the A–M boundary of CUR ASDs with PVP (Figure 2b). The coefficient k is defined as below.
I = k·c,
where I is the fluorescence intensity at concentration c.
Compared with ASD-20%, the fluorescence intensities of ASD-1% increase more than one order of magnitude, and the coefficient k increases more than three orders of magnitude. A notable increase of the coefficient k is observed in the CUR loadings ranging from 10% to 5%. The specific CUR loading at which the fluorescence intensity changes suddenly is hard to determine because the dispersion process is a continuous process. We propose that the A–M boundary of CUR ASDs with PVP is below 10% and with the appearance of observable fluorescence.
Considering that the CUR ASDs are ACQ systems and CUR itself serves as the quencher, the Stern–Volmer equation [36] was employed to fit the relationship between fluorescence intensity (I) and curcumin concentration (c).
I0·I−1 = 1 + KSV[Q]
where KSV is the Stern–Volmer constant, I0 is the fluorescence intensity with the absence of quencher Q, and I is the fluorescence intensity upon the addition of quencher with concentration [Q].
In the case of CUR ASDs, [Q] represents the CUR concentration after subtracting a constant for the CUR maximum concentration of CUR ASDs (maybe M–A boundary) in which no ACQ phenomenon can be observed, which is related to I0. And I0 is a constant, but unknown. The fitting equation can be transformed as below.
I−1 = I0−1 + KSVI0−1·(c-constant) = constant + K·c
The fitting results for CUR ASDs with curcumin loading ranging from 1 to 40 wt.% are shown below.
I−1 = (1.3 ± 3.9) × 10−4 + (0.079 ± 0.002)·c, R2 = 0.991
To our best knowledge, this is the first time that the Stern–Volmer equation was used to fit ACQ phenomenon. However, due to the self-quenching in the ACQ phenomenon, the lack of I0 and [Q] make it hard to calculate KSV. It is challenging to prepare uniform ASDs with low CUR loading by the ball milling method because of the phase separation and degradation of CUR (Figure S3).

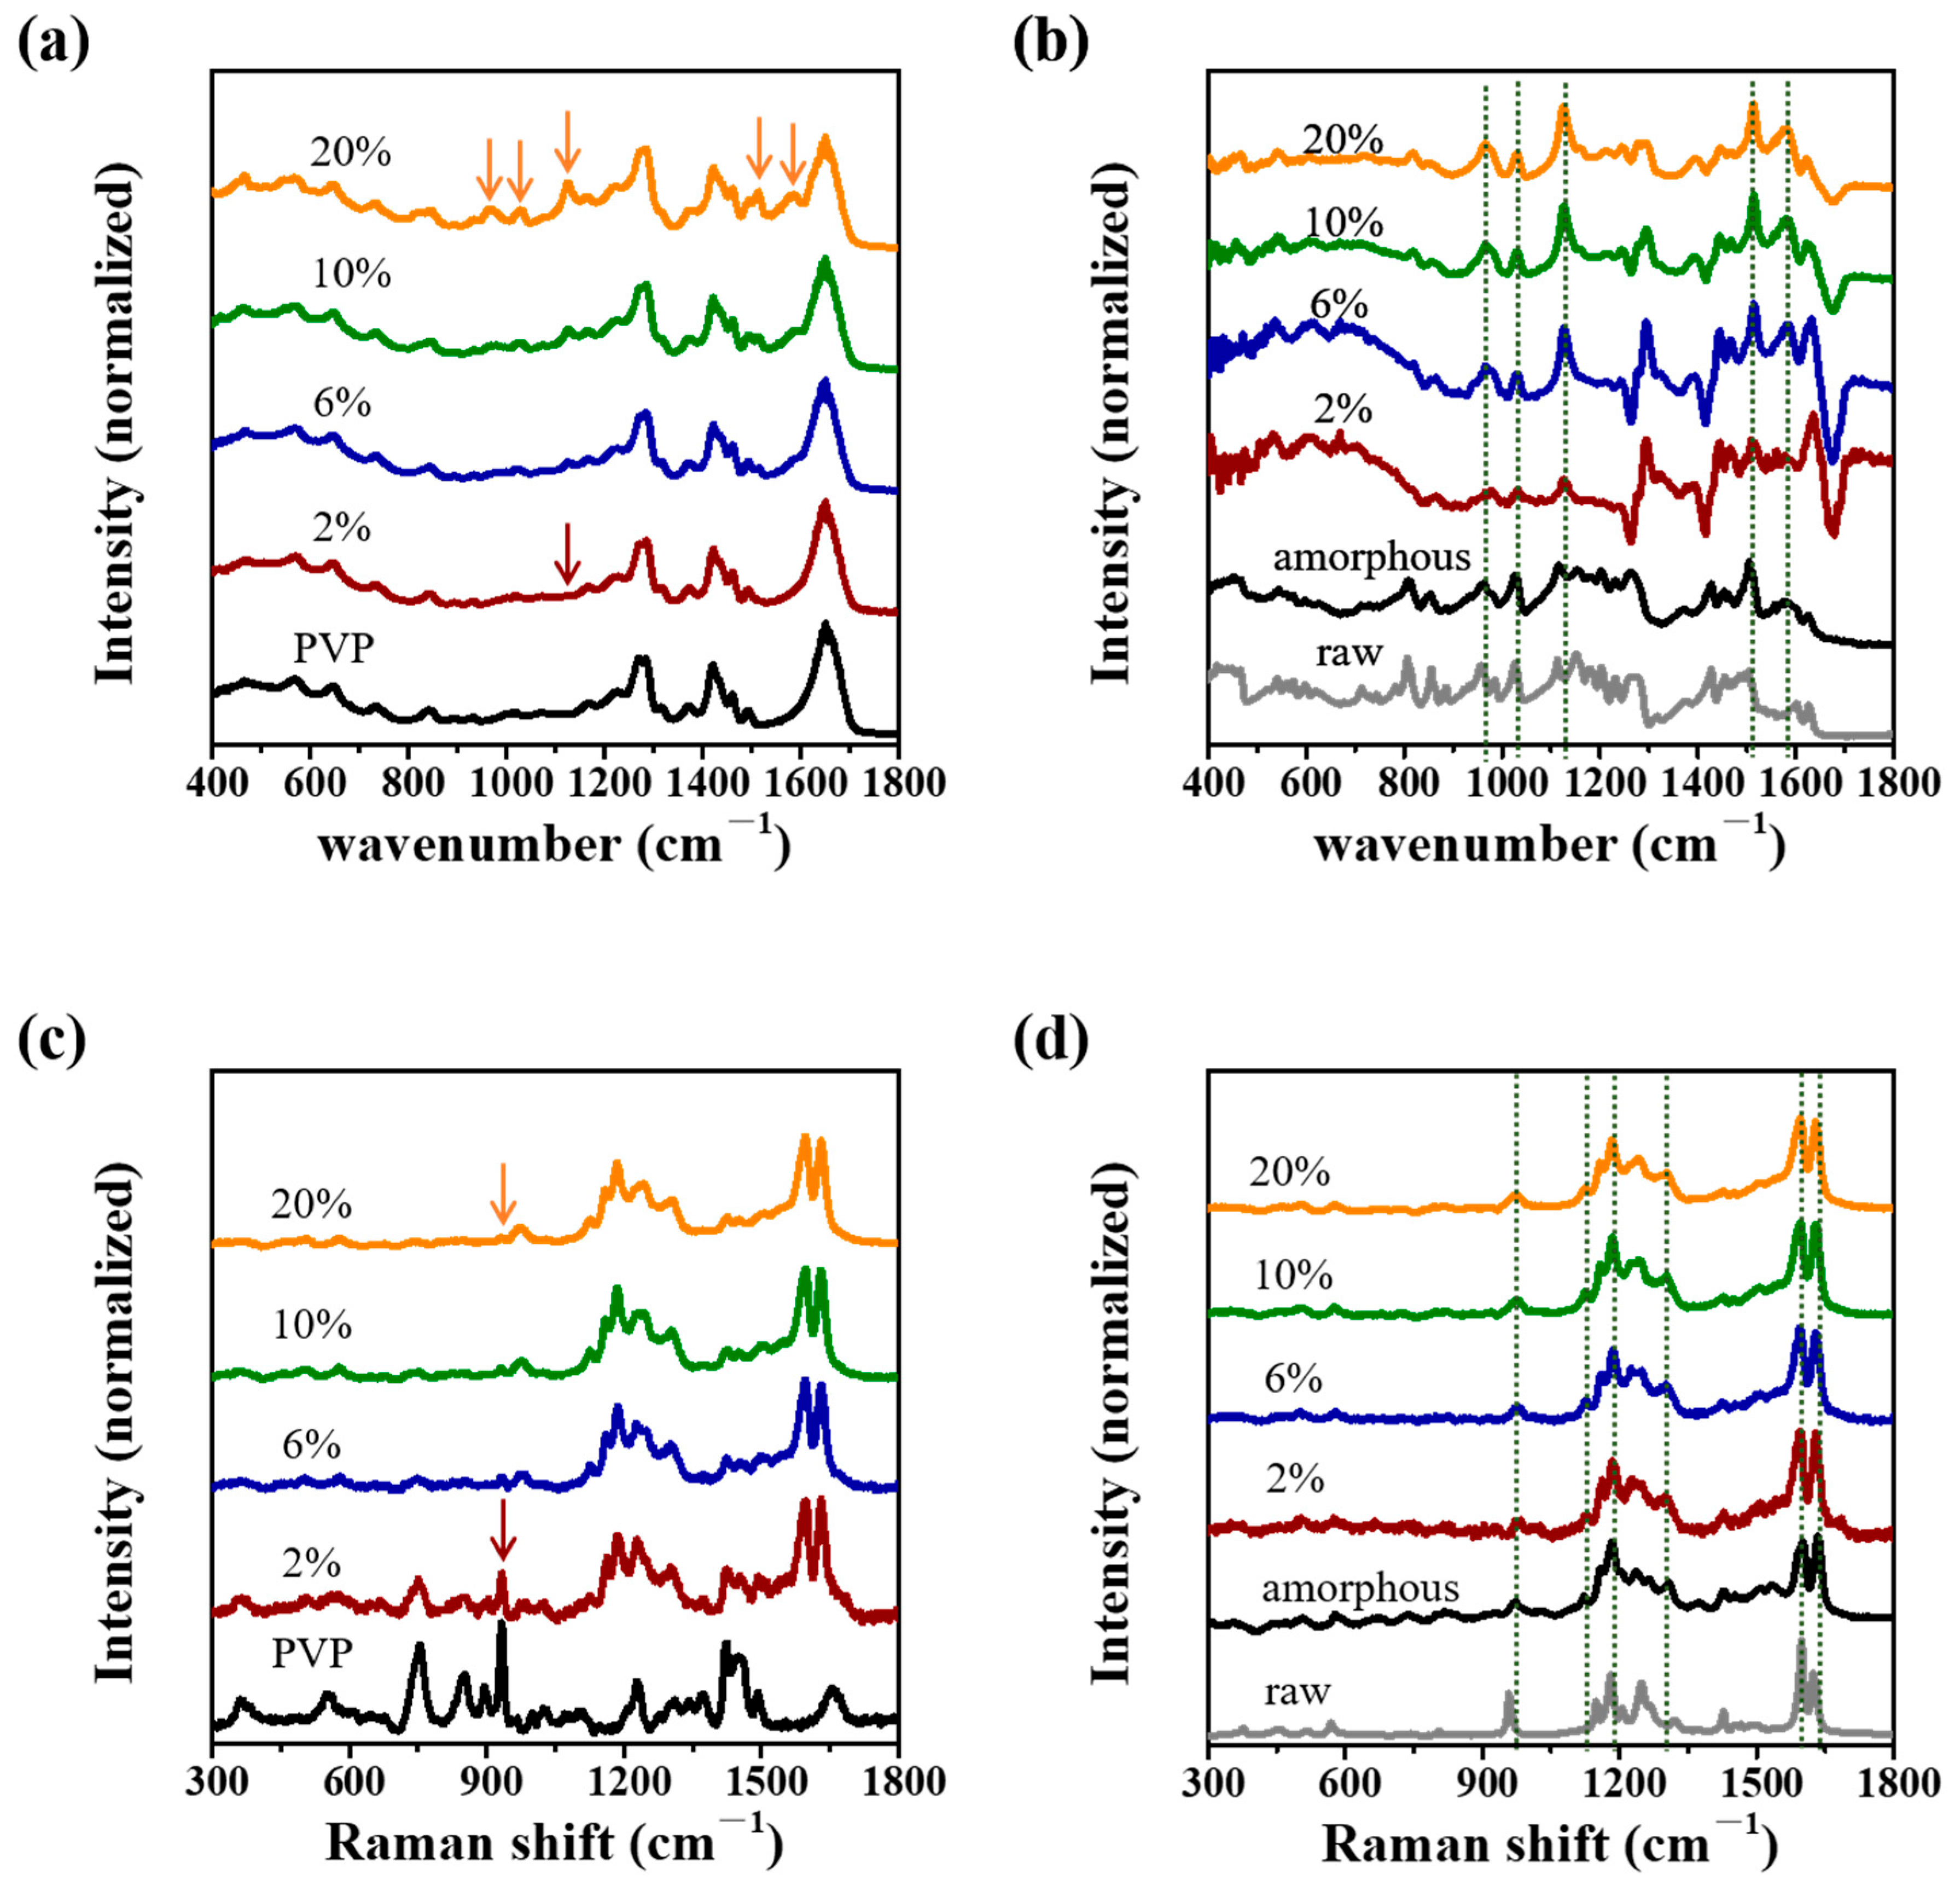
3.3. IR and Raman Spectra of CUR ASDs with PVP

IR and Raman spectroscopy are common characterization techniques used for studying the interaction between CUR and PVP (Table 1). The crystallized CUR is not suitable to compare as reference because crystallized CUR and amorphous CUR have obviously different IR and Raman spectra (Figure 3, Table 2). Amorphous CUR has more similar spectral patterns as CUR ASDs than crystallized CUR. As in the field of poorly soluble drugs’ ASDs, the amorphous phase is also usually used to compare with ASDs instead of the crystallized drug. The IR peak intensities of PVP are much stronger than those of CUR, which resulted in weak IR signals of CUR in ASDs (Figure 3a, arrowed). The IR signals of CUR in ASDs can be isolated by subtracting the IR spectrum of PVP from that of CUR ASDs (Figure 3b). Briefly, the CUR signals were obtained by subtracting the IR spectrum of PVP from that of CUR ASDs, with the intensity of the PVP IR band at around 1650 cm−1 as reference. After careful comparisons, we concluded that the characteristic IR peaks of ASD-2%, 6%, 10% and 20% are almost the same (Table 2), whose differences are less than 4 cm−1. The Raman signal intensities of PVP (Figure 3c, arrowed) are much weaker than those of CUR. The mid-frequency Raman spectra of CUR ASDs are mainly composed of CUR signals. The mid-frequency Raman signals of CUR in ASDs were also obtained by subtracting the Raman spectrum of PVP from that of CUR ASDs, with the Raman band at 932 cm−1 of PVP as reference, showing good signal to noise ratios (Figure 3d). Raman spectroscopy is a more suitable technique for investigating CUR ASDs than IR spectroscopy. The characteristic Raman bands are almost the same for ASD-2%, 6%, 10% and 20% (Figure S4, Table 2), with differences less than 2 cm−1. Both IR and Raman spectra cannot distinguish the MASDs and AASDs of CUR. IR and Raman spectroscopy may not be powerful enough tools for studying the interactions between drugs and polymers in ASDs.
CUR has a keto–enol isomerism equilibrium [37], which can be adjusted by solvent, pH, and temperature. The different tautomerisms of CUR may have different biological activities [38,39]. Usually, the enol form of CUR exists in ethanol and the keto form exists in aqueous solution [40,41]. The enol form is more energetically stable than the keto form, but water molecules can stabilize the keto form [42]. CUR exists in the keto form in the crystal structure of Form I. The stretching of C=O at 1626 cm−1 in the Raman spectrum of raw CUR confirms the existence of the CUR keto form [18]. The stretching bands of C=O at 1634 cm−1 in amorphous CUR and ~ 1630 cm−1 in CUR ASDs are related to the CUR enol form.

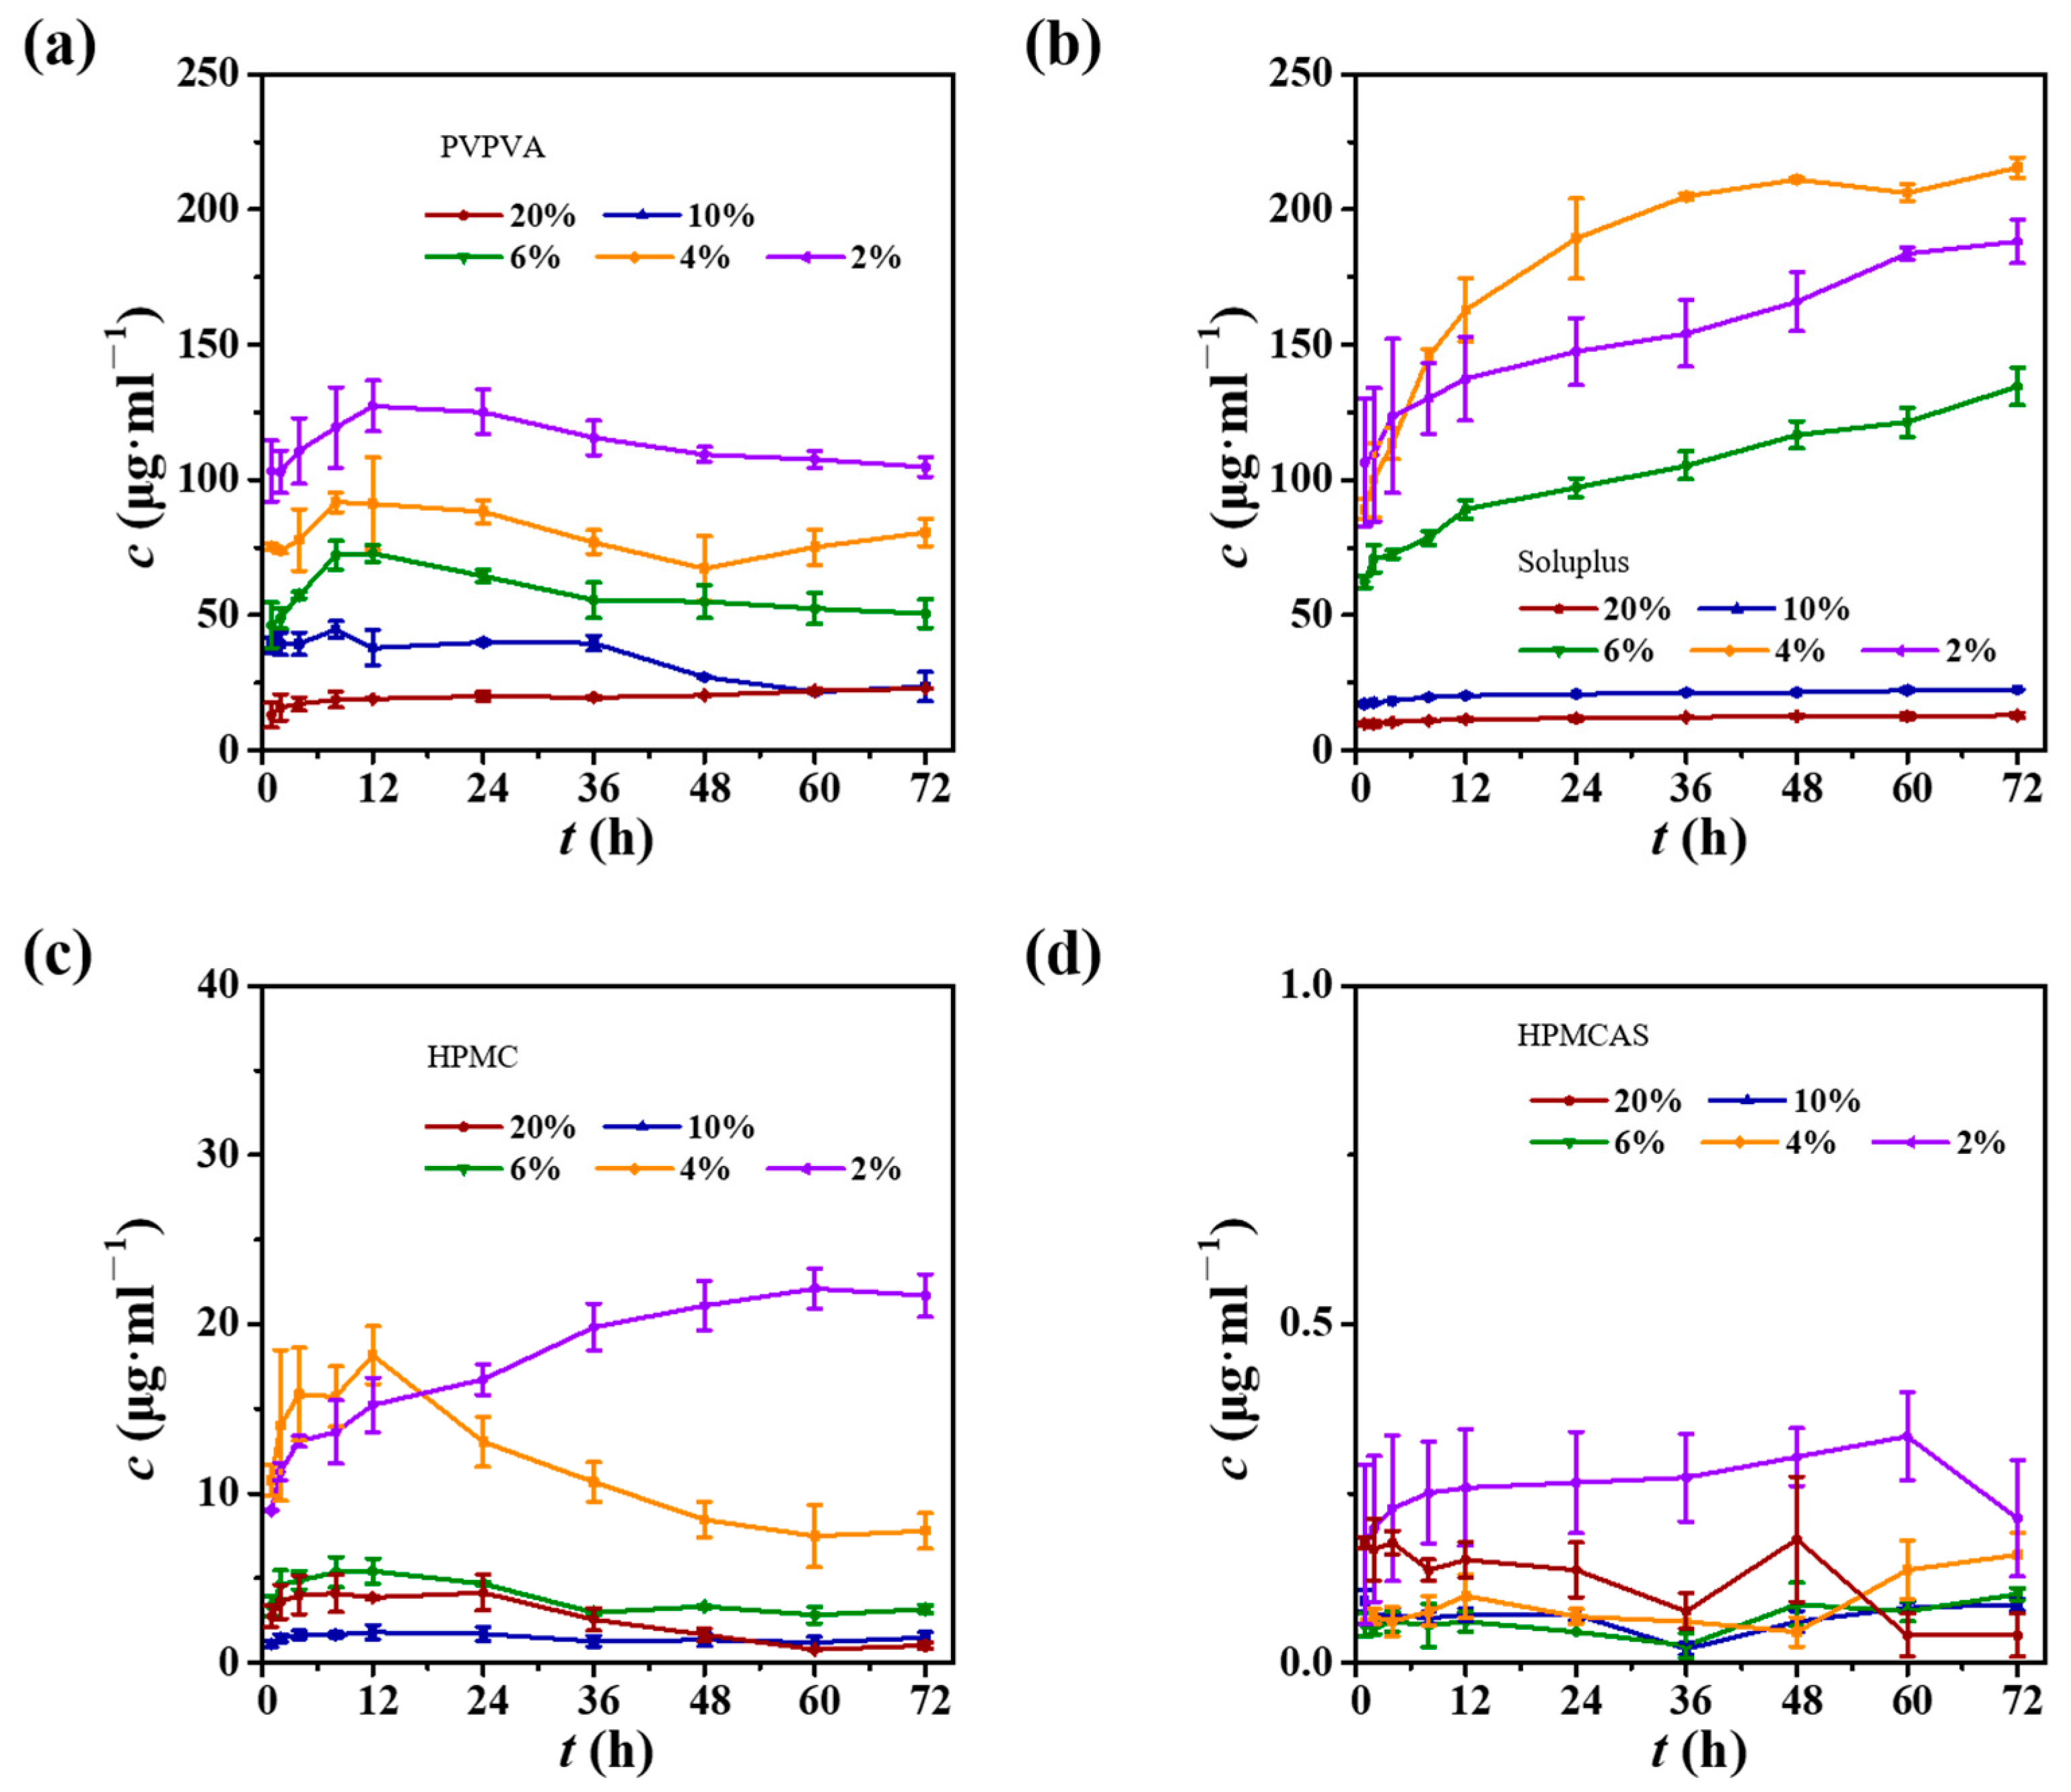
3.4. Dissolution Behavior and Stability of Curcumin ASDs with PVP

The dissolution profile of raw CUR indicates that it has a poor dissolution performance (Figure 4, <1 μg·mL−1) due to its poor aqueous solubility. The referenced amorphous CUR also shows a poor dissolution performance (Figure S5, <1 μg·mL−1). After 24 h of dissolution, the solubilities of CUR ASDs with PVP reached equilibrium. The equilibrium solubility of ASD-20% and ASD-10% is ~49 μg·mL−1 and ~140 μg·mL−1, respectively, while the equilibrium solubility of ASD-6%, ASD-4%, and ASDs-2% is approximately 178 μg·mL−1. The dissolution profiles of ASD-6%, ASD-4% and ASD-2% are similar, which might be related to the A–M boundary.
The stability of CUR ASDs was investigated here. The characterization results of CUR samples after one year’s storage are shown in Figure 5. The PXRD patterns of CUR ASDs with CUR loadings in the range from 1 to 20 wt.% show no observable change after one year’s storage in sealed dark environments at room temperature, maintaining amorphous characteristic (Figure 5a) and indicating no recrystallization occurring during the storage period. However, the dissolution profiles indicate that CUR ASDs have minor differences after one year’s storage (Figure 5b). The maximum dissolution concentrations of ASD-20% and ASD-10% significantly decreased compared to the fresh samples. ASD-20% achieves a solubility of 16 μg·mL−1 at 24 h, and ASD-10% achieves a solubility of 74 μg·mL−1 at 24 h. ASD-6% reaches a solubility of 160 μg·mL−1 at 8 and 12 h, and decreases to 79 μg·mL−1 at 48 h. The dissolution profiles of the stored ASD-4% and ASD-2% are also similar. Long-term storage degrades the dissolution properties of CUR ASDs with high CUR loading, although their PXRD patterns show no differences compared to fresh products. Long-term storage does not affect the dissolution properties of CUR ASDs with low CUR loading, indicating that the presence of MASD may stabilize the dissolution properties. For ASD-6%, the appearance of the parachute effect significantly leads to a solubility decrease, which might be caused by the recrystallization of CUR ASDs.
Fluorescence spectra of CUR ASDs after one year’s storage show a similar ACQ phenomenon (Figure 5c) as observed for freshly prepared products. A direct comparison of the fluorescence intensities between the two measurement periods was challenging due to the attenuation of the instrument’s light source over time, indicating a limitation of our experimental setup. ASD-20% exhibits a weak fluorescence signal, whereas ASD-1% shows a strong fluorescence signal. In comparison to ASD-20%, the fluorescence intensities of ASD-1% increase seven times, and the coefficient k increases more than two orders of magnitude (Figure 5d). The coefficient k exhibits a significant increase in the range of 5–10%.

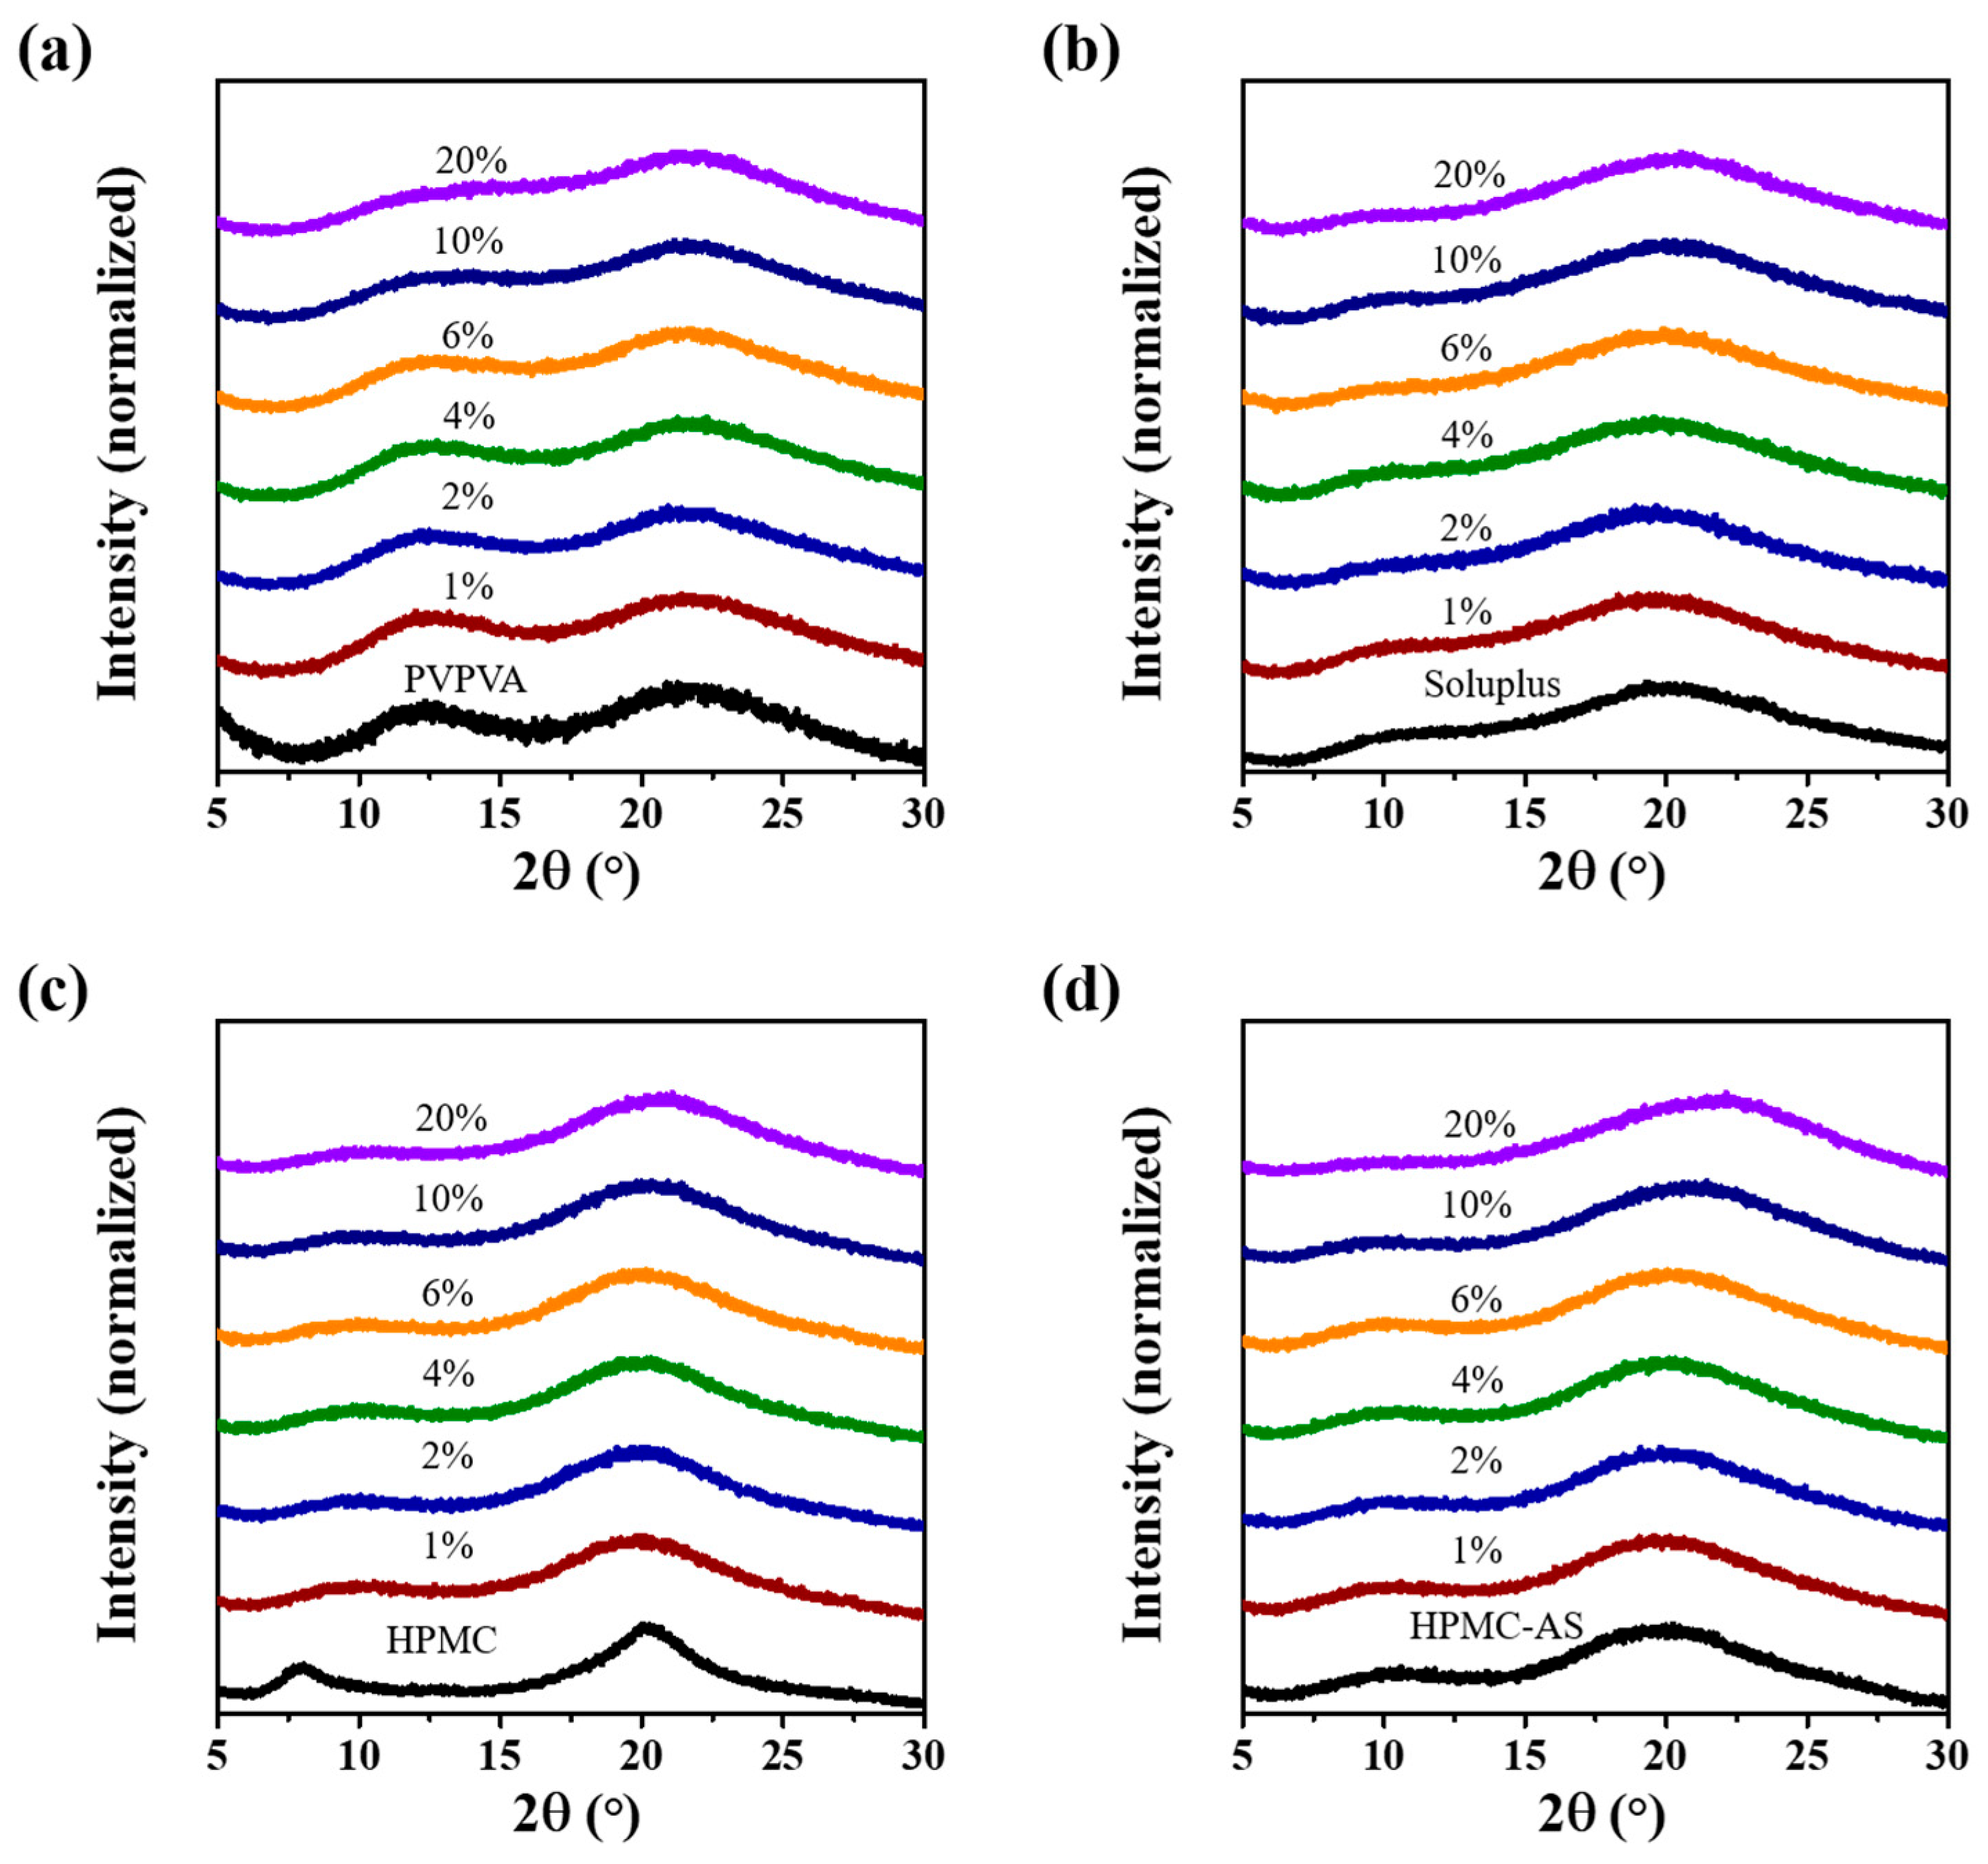
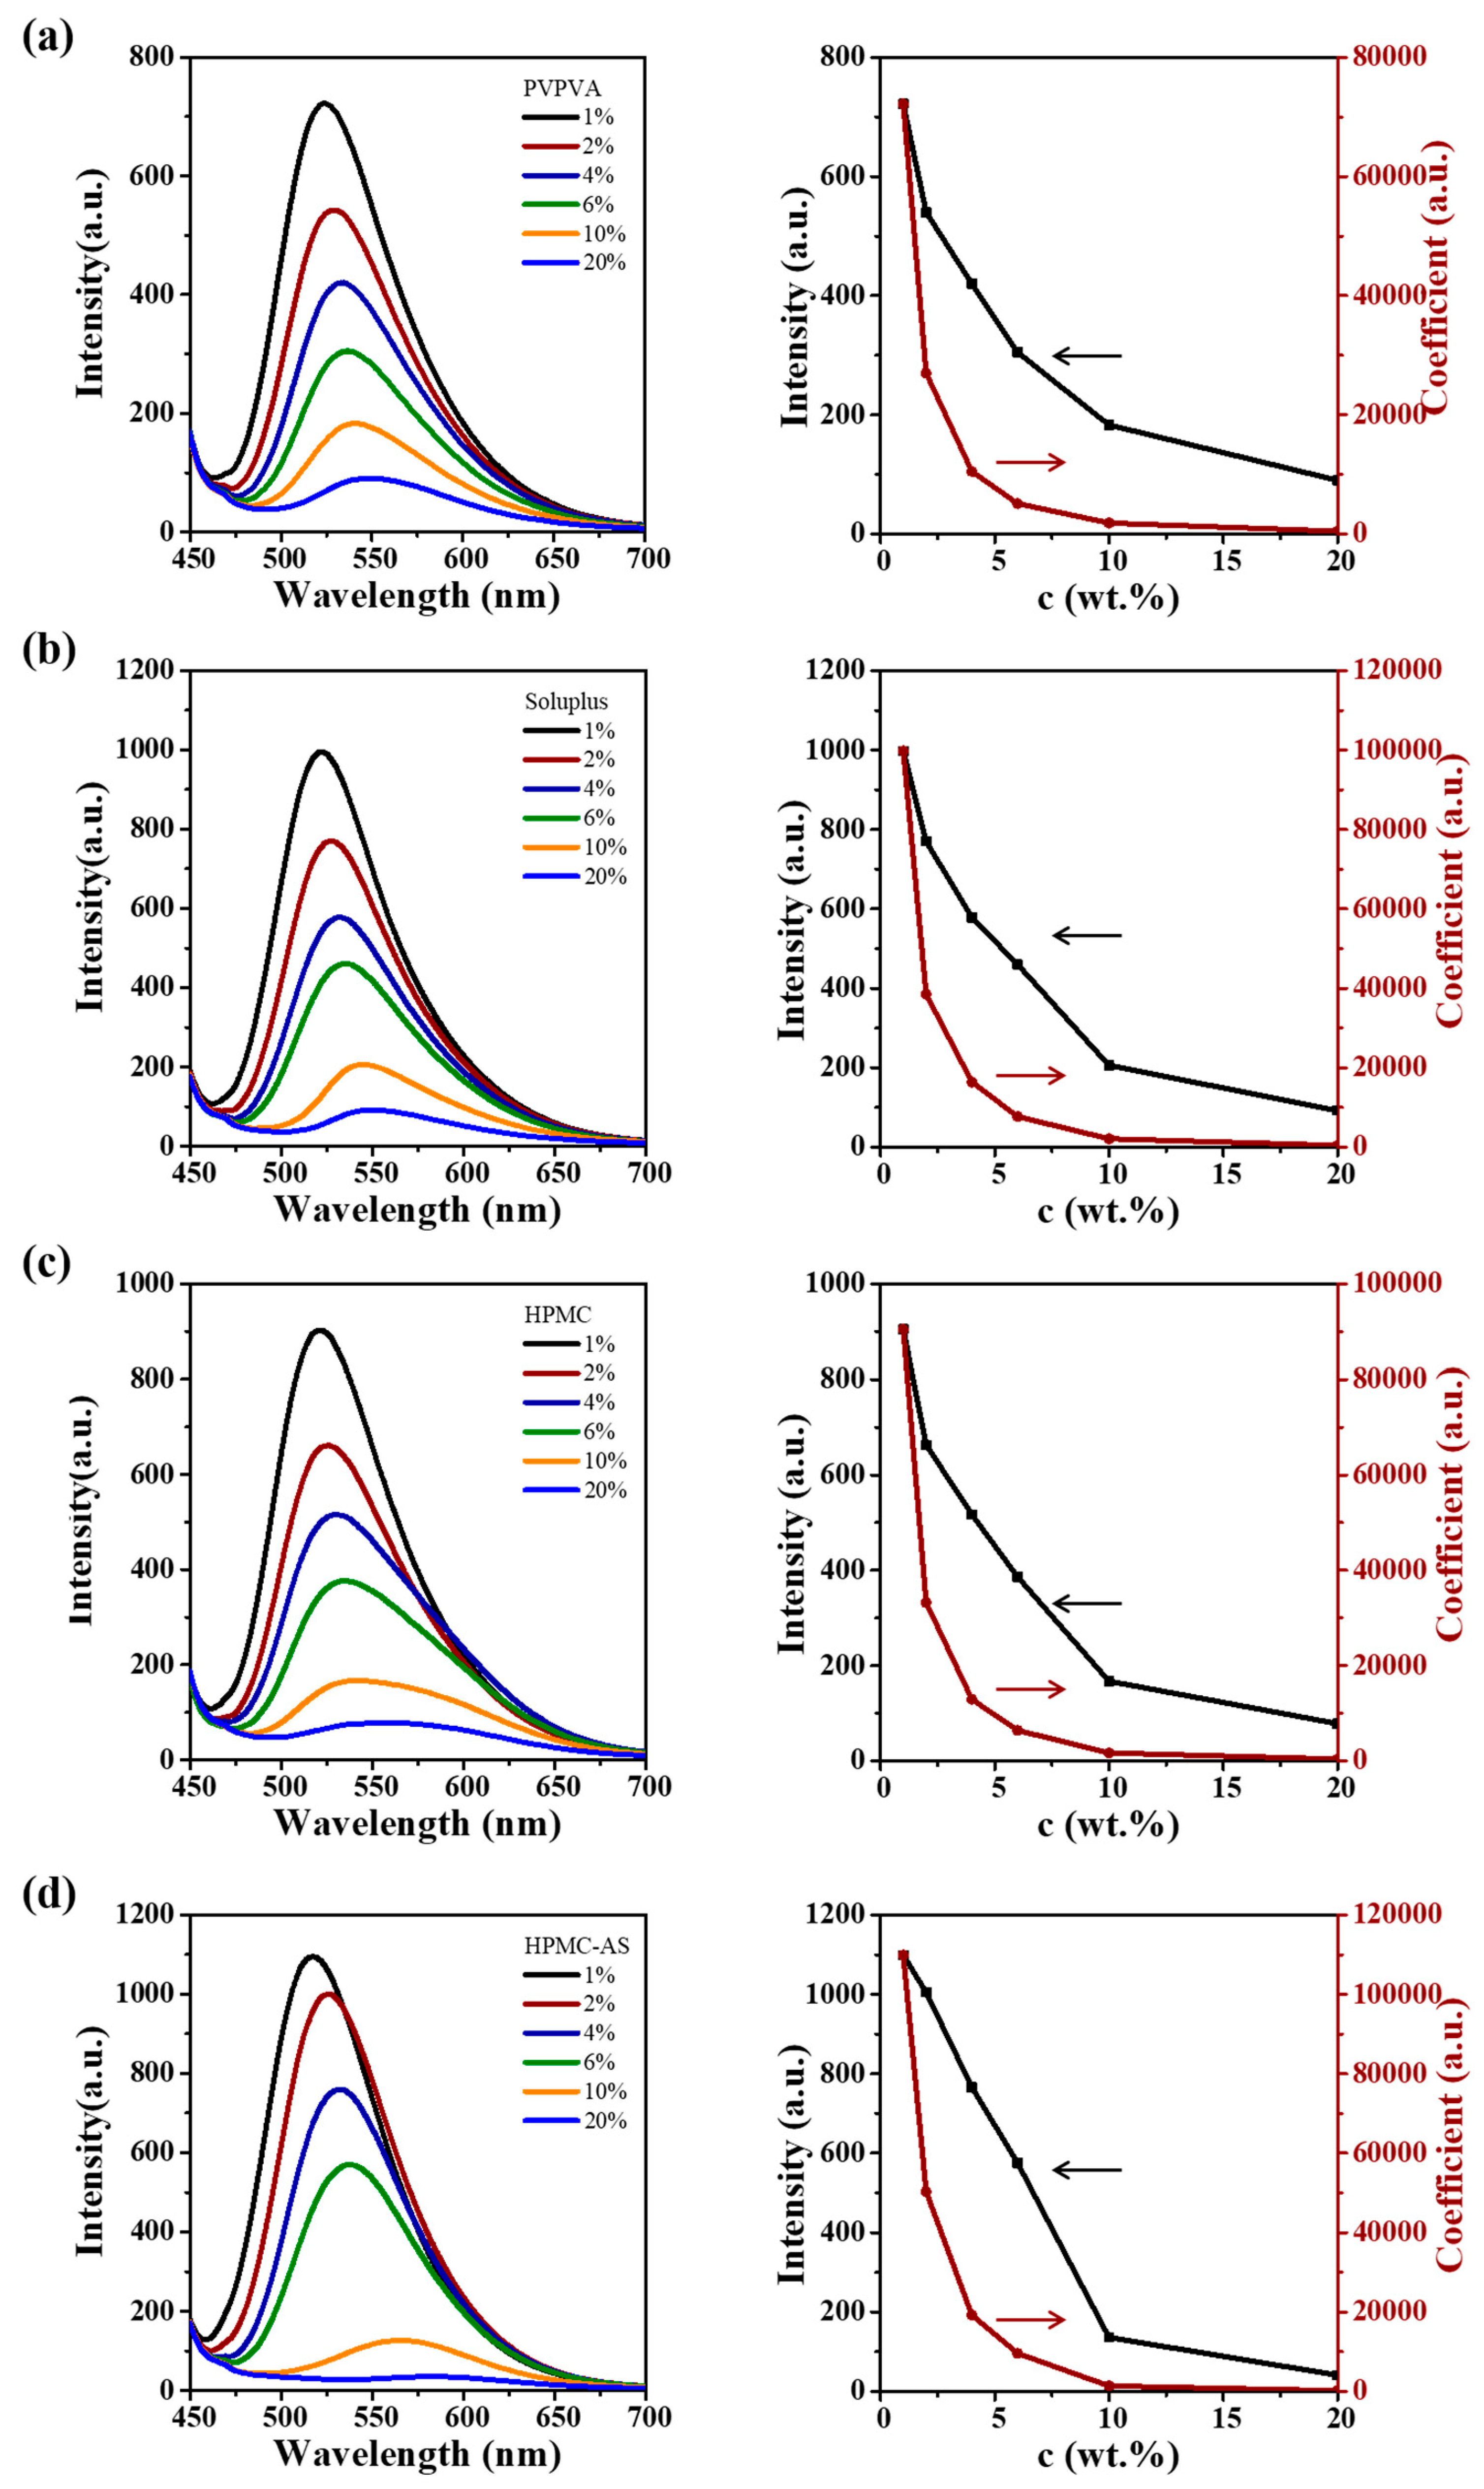
3.5. CUR ASDs with Different Polymers

CUR ASDs with various polymers were prepared to demonstrate that the A–M boundary is a universal phenomenon for CUR. A series of ball milling products of CUR with PVPVA, Soluplus, HPMC, and HPMC-AS are verified as ASDs, confirmed by PXRD patterns (Figure 6a–d). CUR exhibits a good ability to form ASDs with a variety of polymers.
The A–M boundary of CUR ASDs with various polymers was also investigated by utilizing fluorescence spectroscopy. PVPVA, Soluplus, HPMC, and HPMCAS are all white powders with no fluorescence; similarly, the fluorescence changes of CUR ASDs can be attributed to the change of the form of CUR. Specifically, in the case of CUR ASDs with PVPVA (Figure 7a), a notable enhancement of fluorescence is observed as the CUR loading decreases from 20% to 1%, which is similar to the trend observed in CUR ASDs with PVP. The coefficient k exhibits a consistent increase. The value of coefficient k increases by more than two orders of magnitude from ASD-20% to ASD-1%. The coefficient k undergoes a significant increase within the range of CUR loadings of 5–10%, suggesting that the A–M boundary is around 5–10%. The fluorescence spectra, the relationship curves of characteristic fluorescence intensities, and the coefficient k values with CUR loading of CUR ASDs with Soluplus (Figure 7b), HPMC (Figure 7b), and HPMCAS (Figure 7d) are similar to those of CUR ASDs with PVP. The significant increases of coefficient k of these CUR ASDs are all within the CUR loading range of 5–10%, suggesting that this concentration range is critical for the emergence of MASD and may have a profound impact on the dissolution behavior of CUR ASDs.
CUR ASDs with PVPVA exhibit a pronounced increase in solubility when CUR loading is below 10% (Figure 8a). The equilibrium solubility of ASD-20% increases gradually and stabilizes near 22 μg·mL−1. ASD-10% reaches its maximum solubility of 45 μg·mL−1 at 8 h and subsequently has a gradual decline to 23 μg·mL−1 at 72 h. ASD-6%, 4%, and 2% also reach the maximum solubilities of 72, 92, and 119 μg·mL−1 around 8 h and have gradual declines to 51, 81, and 105 μg·mL−1 at 72 h, respectively. CUR ASDs with PVPVA demonstrate a significant increase in solubility below the A–M boundary without a sudden change. CUR ASDs with Soluplus have similar dissolution profiles (Figure 8b) as those of CUR ASDs with PVP. The dissolution concentrations of ASD-20% and 10% at 72 h are only 13 and 22 μg·mL−1, and a significant increase in solubility is observed for ASD-6%, 4%, and 2%, reaching 135, 216, and 188 μg·mL−1, respectively, at 72 h. The dissolution profiles of ASD-4% and 2% are similar. CUR ASDs with HPMC have a significant increase in solubility observed in ASD-4% and 2% (Figure 8c). The dissolution concentration of ASD-20% is low as 4 μg·mL−1 at 8 h and decreases to 1 μg·mL−1 at 72 h. The dissolution concentrations of ASD-10% and ASD-6% are also less than 6 μg·mL−1 in the total dissolution processes. The dissolution profile of ASD-4% shows dissolution concentrations of 16 μg·mL−1 at 8 h and 8 μg·mL−1 at 72 h, and that of ASD-2% shows dissolution concentrations of 14 μg·mL−1 at 8 h and 22 μg·mL−1 at 72 h. ASD-4% and 2% demonstrate significant enhancements in dissolution. The dissolution concentrations of CUR ASDs with HPMCAS are less than 1 μg·mL−1 (Figure 8d), indicating HPMCAS is not suitable for CUR ASDs. It seems that A–M boundary is highly related to the dissolution profiles of CUR ASDs; however, its effect can be different for various polymers. PVP, PVPVA, Soluplus, and HPMC are hydrophilic polymers, and HPMCAS is an amphiphilic polymer. It seems that hydrophilic polymers are of benefit in obtaining a high dissolution concentration of CUR, which may be caused by delaying the nucleation and crystal growth process with hydrophilic polymers [43]. CUR ASDs with PVP and Soluplus show increased solubilities towards equilibrium, while below the A–M boundary, CUR ASDs with PVPVA and HPMC exhibit increased solubilities, and CUR ASDs with HPMCAS do not show a solubilizing effect.

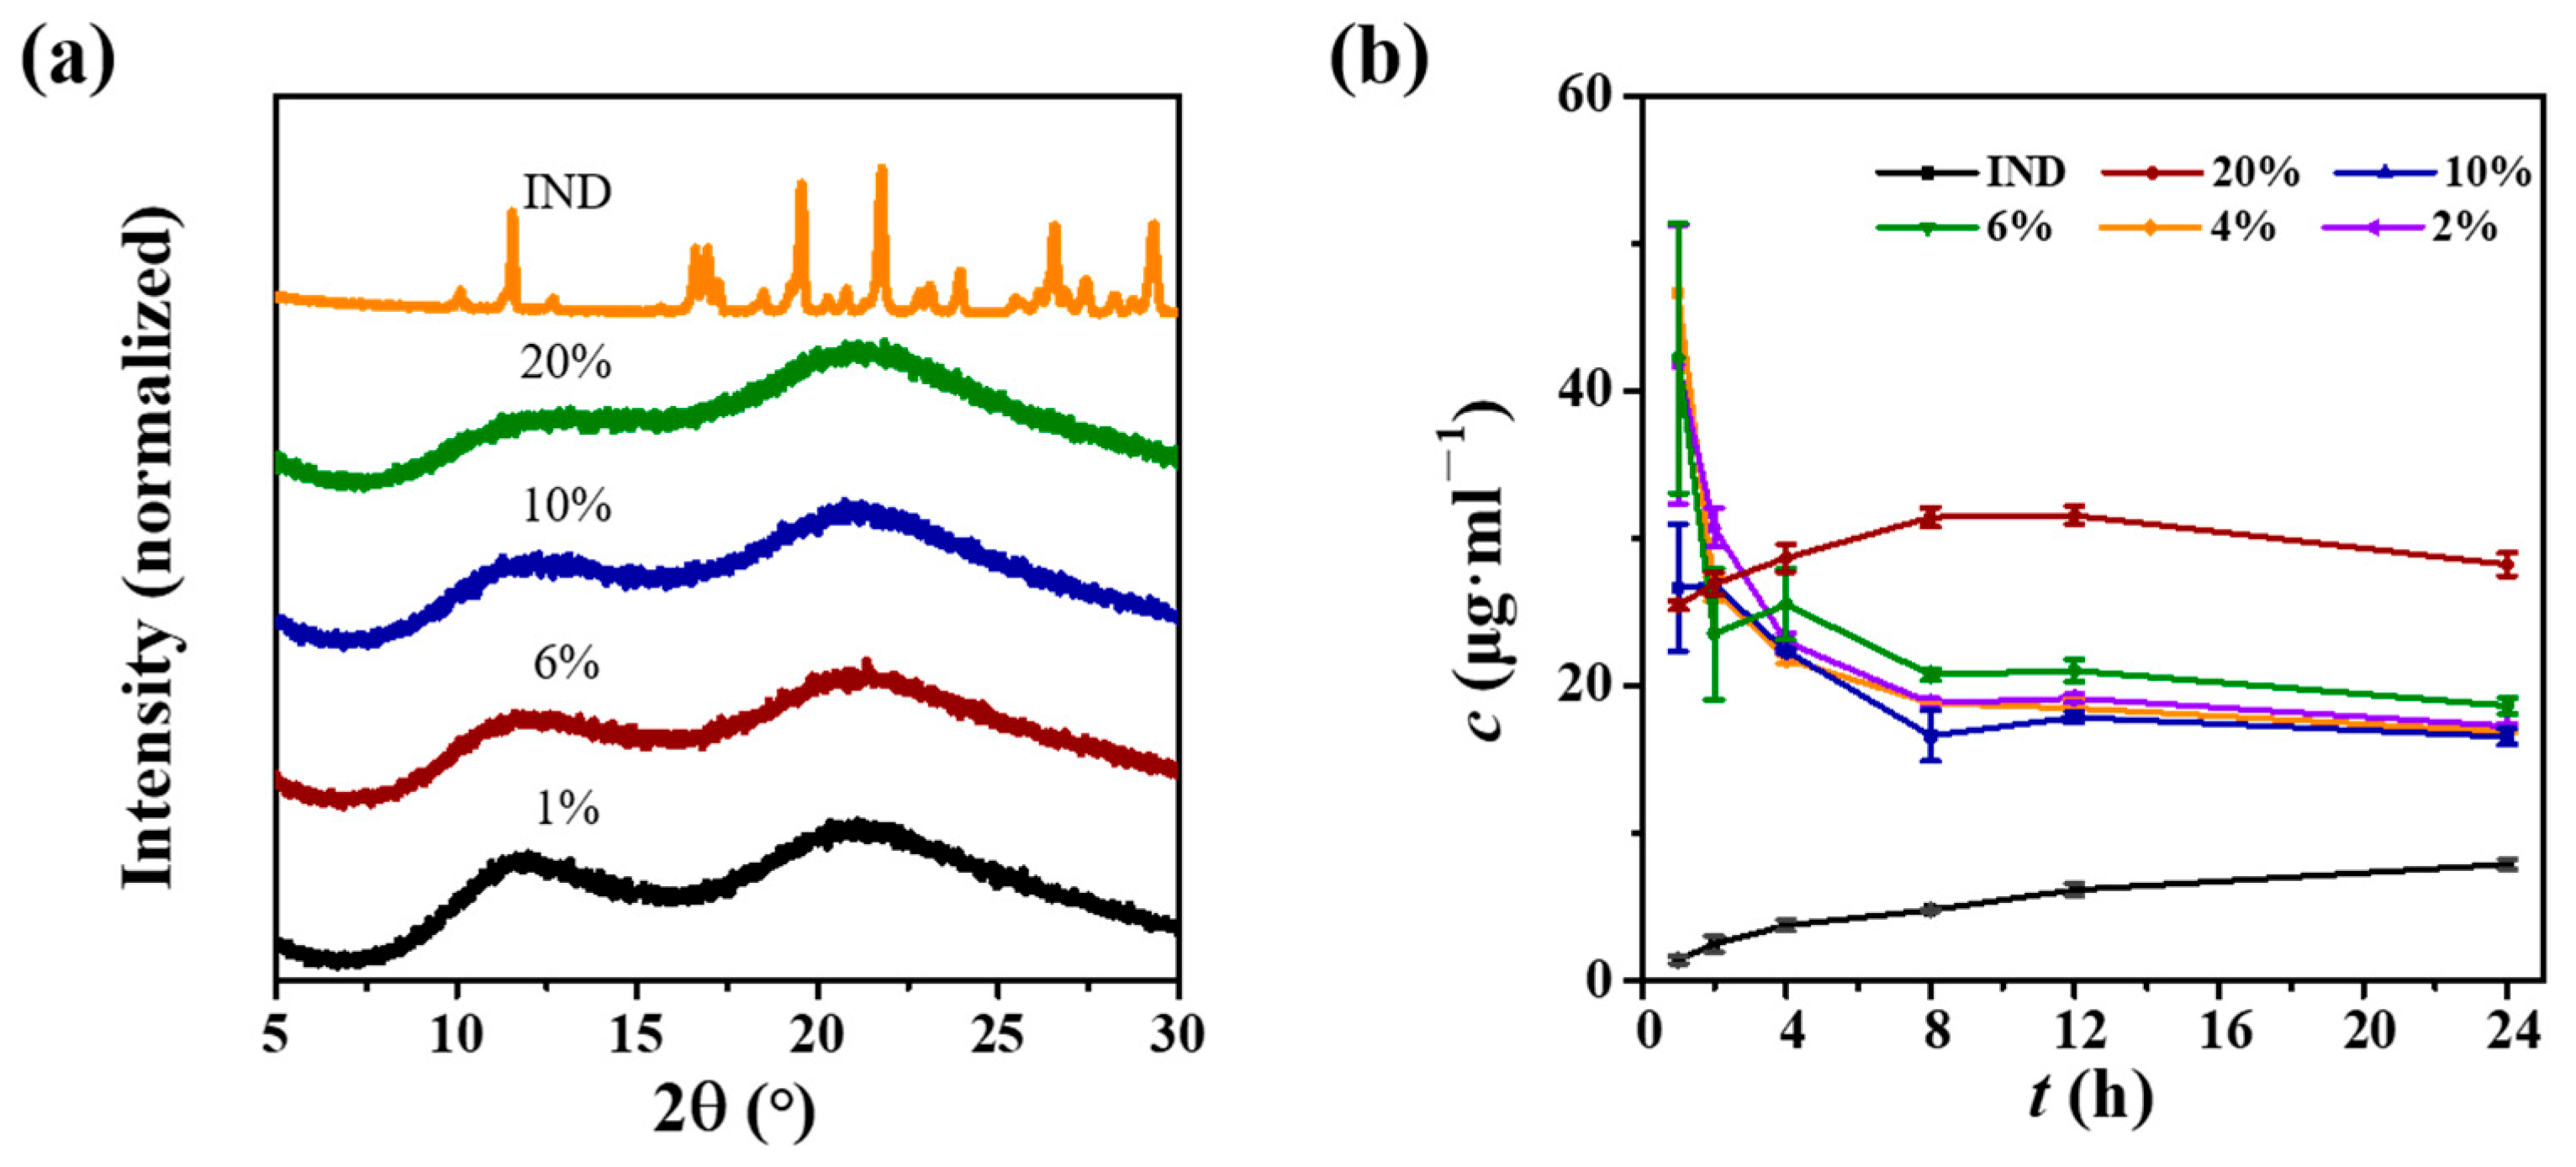
3.6. Indomethacin ASDs with PVP

The differences between MASD and AASD can shed light on designing the formulation of pharmaceutical ASDs. In the case of indomethacin (IND), the raw material is the stable γ phase (Figure 9a). IND and PVP can be easily prepared into ASDs with IND loading in the range from 1 to 20% through neat ball milling, confirmed by PXRD patterns. The dissolution profiles (Figure 9b) show that the raw IND has a low dissolution concentration, with an equilibrium concentration of 8 μg·mL−1 after 24 h. ASD-20% exhibits a significant increase in solubility. The dissolution concentration rapidly reaches 25 μg·mL−1 at 1 h and then maintains at approximately 28 μg·mL−1 within 24 h. ASD-10%, ASD-6%, ASD-4%, and ASD-2% only achieve a solubility of 19 μg·mL−1 at 24 h. These ASDs demonstrate spring effects [44], which cause the dissolution profiles to be worse than that of ASD-20%. The dissolution profiles of ASD-10%, ASD-6%, ASD-4%, and ASD-2% are very similar, which might be caused by the existence of MASDs as well as the A–M boundary. Different from CUR, IND ASDs do not show a high solubility below the A–M boundary. The sudden decrease of solubility indicates that these ASDs with enough MASDs undergo recrystallization.

4. Discussion

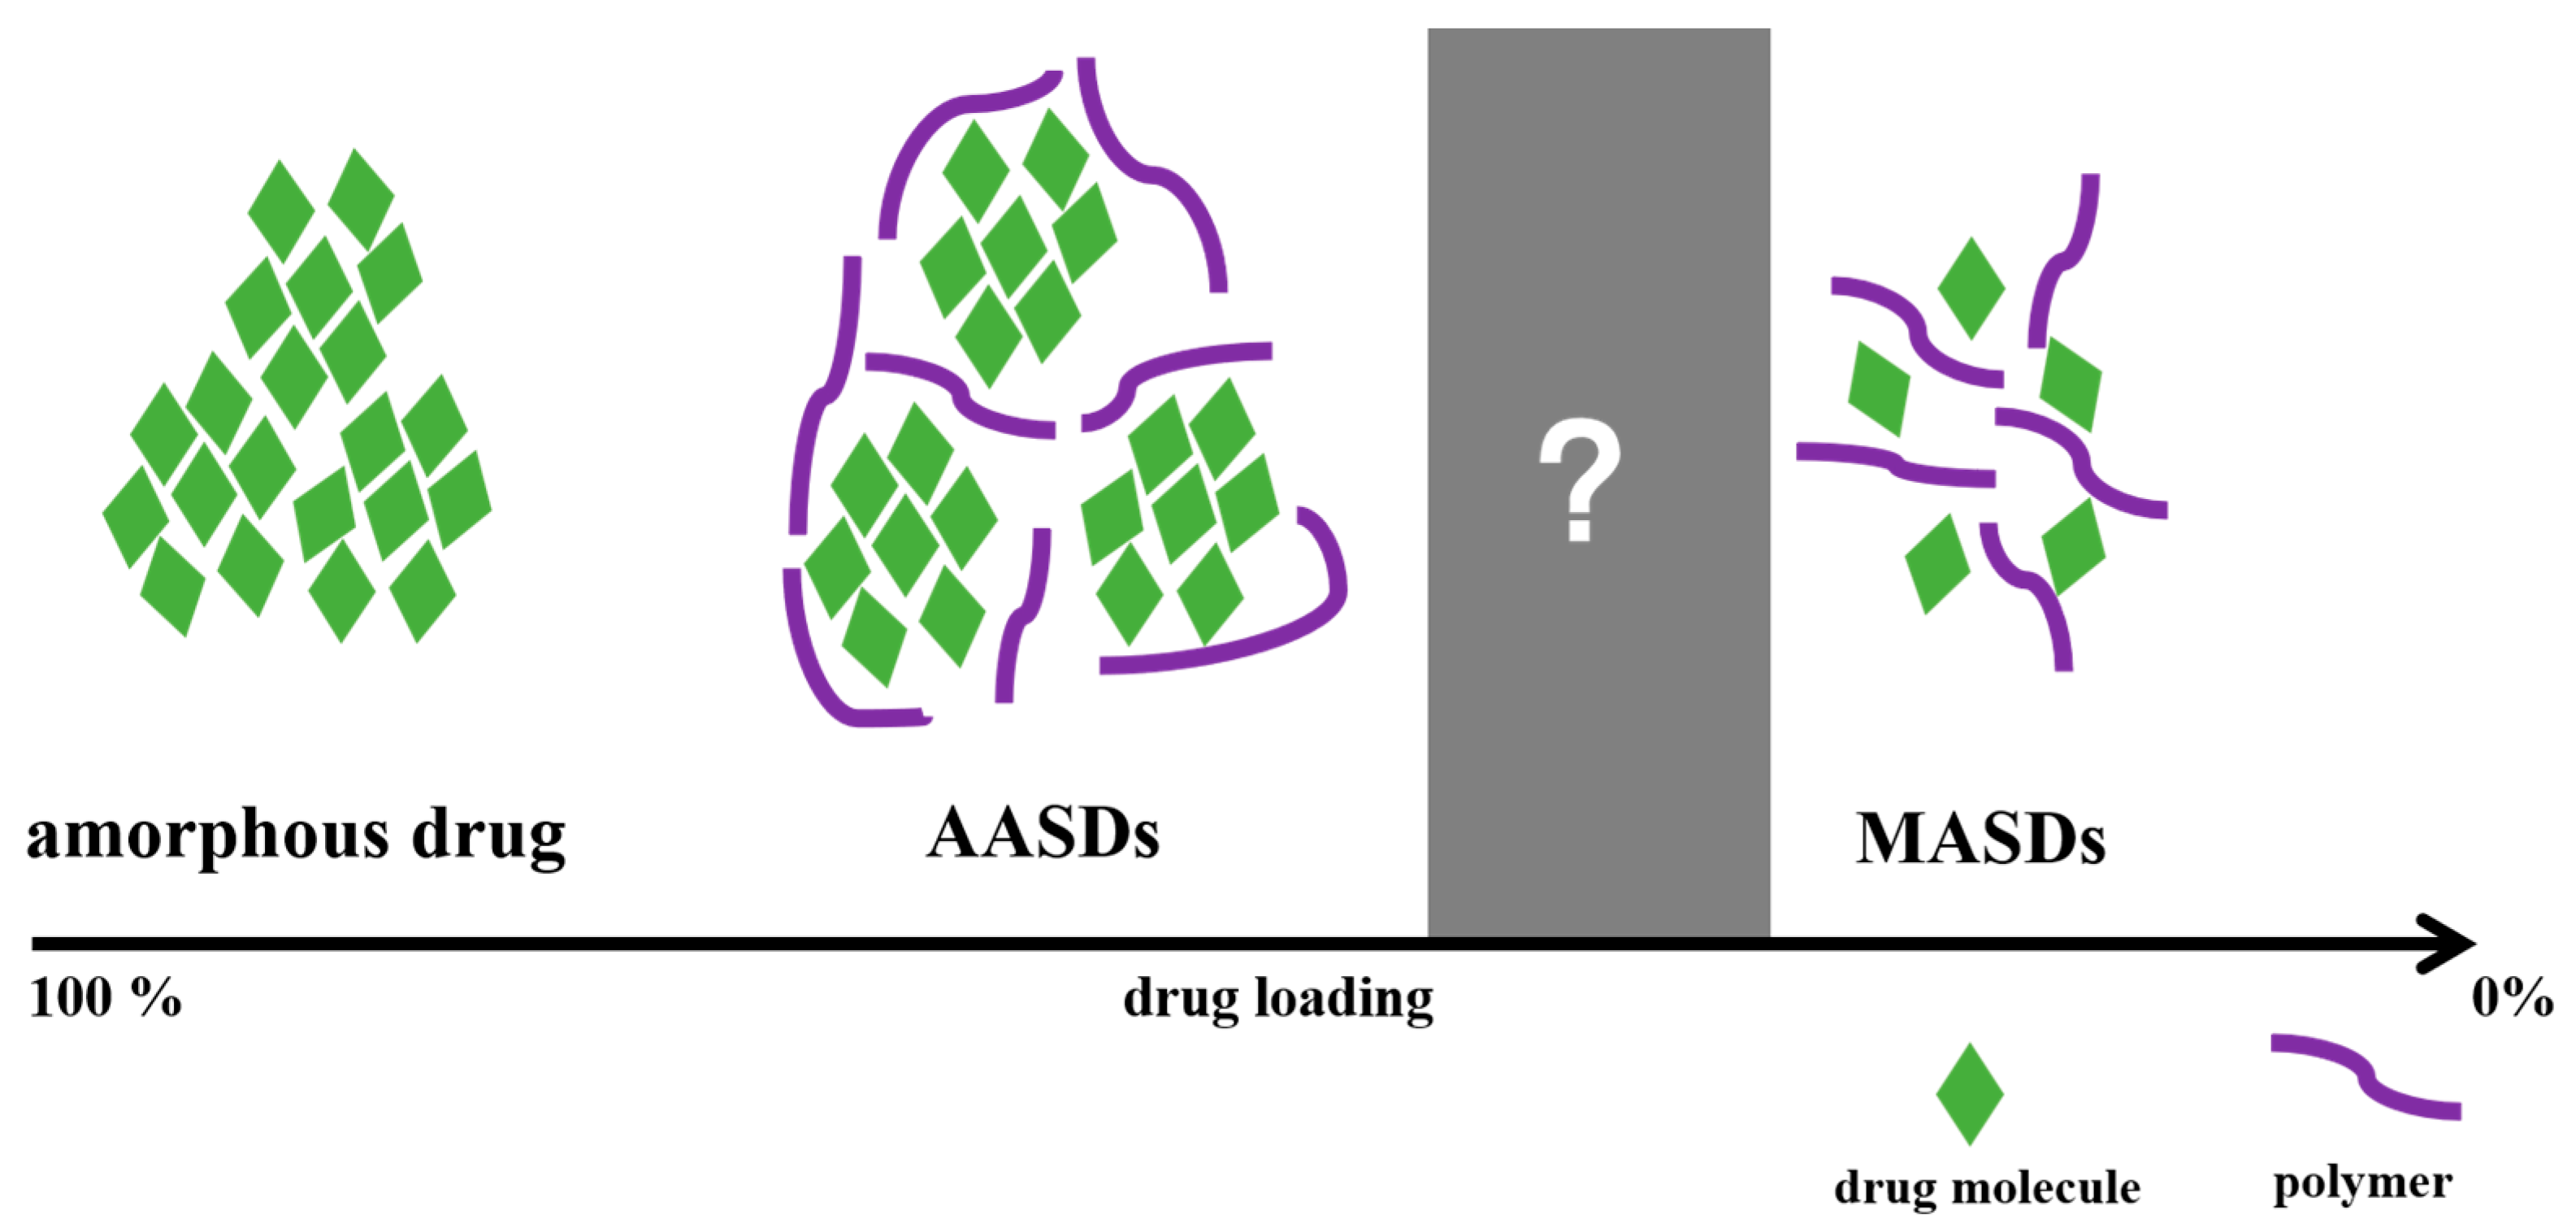
4.1. A–M Boundary and M–A Boundary

The A–M and M–A boundaries are hard to determine because of the lack of proper characterizations. The most common characterization methods, such as PXRD, DSC, and spectroscopy, are essentially unable to detect them. The MASDs always exist in the ASDs, but the small amount of MASDs in ASDs does not affect the properties of the ASDs. The A–M boundary in this work is defined as the drug concentration at which MASDs significantly influence the ASD properties, fluorescence, and dissolution profile. In the case of CUR ASDs, based on the ACQ property of CUR, the appearance of fluorescence was used to determine the A–M boundary. The M–A boundary failed to be observed because of a failure in the preparation of ASDs with low CUR loading. The limitation of the neat milling method and the instability feature of CUR make it difficult. Suitable molecules and ASD synthetic methods can help in knowing more about the M–A boundary. The A–M boundary is important for the ASDs of poorly water-soluble drugs, and the A–M boundary of CUR ASDs is 5–10%, which is a common drug concentration in ASDs in vitro. The M–A boundary is not important for ASD applications in drugs because the M–A boundary of CUR ASDs is much less than 1%.

4.2. A–M Boundary and Stability

In the solid state, CUR MASDs are more stable than CUR AASDs. After a one year of storage, although CUR AASDs maintain the amorphous PXRD patterns, the dissolution properties of CUR AASDs have a significant decrease, which might be caused by weak recrystallization, phase separation, enthalpic relaxation, participles aggregation, or hydration. Systematic DSC analysis [45,46] and TEM analysis may be suitable to observe what happened to the CUR AASDs during storage. CUR MASDs can maintain their dissolution properties, showing a good storage stability and avoiding the influence of aging and hydration during storage.

4.3. A–M Boundary and Dissolution

The dissolution behaviors of CUR AASDs and MASDs are different (Scheme 2). CUR AASDs dissolves mainly as amorphous particles, and then the amorphous particles dissolve into aqueous solution, forming a supersaturated solution. CUR MASDs dissolve as molecules. The CUR molecules are rapidly released from the carriers and then dissolved in water, forming a highly supersaturated solution, which causes a high risk of recrystallization. CUR ASDs with CUR loadings between the A–M boundary and the M–A boundary dissolve as amorphous particles and molecules, and the concertation of amorphous particles and CUR molecules finally reach equilibrium. During the dissolution process of ASDs, AASDs play a role in storing molecules and preventing too many molecules dissolving into aqueous solution, while MASDs play a role in quick dissolution.
Usually, ASDs with a low drug loading have good stability and can avoid recrystallization. However, the existence of MASDs makes ASDs face the risk of recrystallization in solution. Although MASDs are more stable than AASDs, MASDs are perhaps not stable when dispersed in aqueous solution. MASDs can dissolve as molecular conditions and reach a high supersaturation; however, they face a high risk of recrystallization. However, the effect of the A–M boundary on the dissolution profiles of drug ASDs is uncertain because of the different recrystallization behaviors of different drug ASDs. We propose to determine the drug loading of ASDs based on the A–M boundary, aiming to achieve a balance between dissolution performance and stability. For CUR, ASDs with the coexistence of AASDs and MASDs do not have the risk of recrystallization. Thus, the suggested drug loading of CUR ASDs is around 10%, nearly the A–M boundary. For IND ASDs with PVP, the existence of MASDs causes the risk of recrystallization. Thus, the suggested drug loading of IND ASDs is 20%, higher than the A–M boundary (~10%). For celecoxib ASDs with PVP, only a slight increase in solubility was observed (Figure S6). The A–M boundary suggests a change of the dissolution behaviors of ASDs, but we do not know whether the change is beneficial based on our current knowledge. It is necessary to know more about the roles of the A–M boundary.

5. Conclusions

CUR ASDs with PVP were prepared via a neat ball milling process and the A–M boundary was determined at 10%, approximately. The ASDs with CUR loading below 10% show increased fluorescence, overcoming the ACQ effect and similar dissolution profiles with enhanced solubilities (~178 μg·mL−1). The similar A–M boundary was observed for CUR ASDs with various polymers, PVPVA, Soluplus, HPMC, and HPMCAS. The solubility of CUR is significantly increased when the CUR loading is below the A–M boundary of ASDs with PVPVA, Soluplus, and HPMC. IND ASDs with PVP with IND loading below 10% show similar dissolution profiles with a relatively low solubility because of the recrystallization of MASDs. Research on the A–M boundary of drug ASDs aids in designing pharmaceutical ASD formulas by balancing drug loading, stability, and solubility.

Supplementary Materials

The following supporting information can be downloaded at https://www.mdpi.com/article/10.3390/cryst15060512/s1: Figure S1: Fluorescence spectra of raw curcumin (CUR); Figure S2: PXRD pattern of ball milled CUR.; Figure S3: Fluorescence spectra of ASD-1%, 0.1%, and 0.01%; inset is the optical images of ASD-0.1% and 0.01%; Figure S4: The selected six strong Raman bands’ positions of CUR ASDs and amorphous CUR; Figure S5: Dissolution profile of amorphous CUR; Figure S6: PXRD patterns and dissolution profiles of celecoxib (CEL) ASDs with PVP.

Author Contributions

Conceptualization, methodology, supervision, resources, F.C. and R.X.; project administration, investigation, data curation, validation, S.F. and W.Z.; resources, S.R. and W.X.; visualization, writing—original draft preparation, F.C.; writing—review and editing, R.X.; funding acquisition, W.X., F.C. and R.X. All authors have read and agreed to the published version of the manuscript.

Funding

This research was funded by the National Natural Science Foundation of China [grant number 22005175], the Central Government Guided Local Special Foundation [grant number 2023L3016], and the Natural Science Foundation of Fujian Province [grant number 2020J01374].

Data Availability Statement

The original contributions presented in the study are included in the article/Supplementary Material; further inquiries can be directed to the corresponding authors.

Conflicts of Interest

The authors declare no conflicts of interest.

Abbreviations

ASDsAmorphous Solid Dispersions
AASDsASDs with Drug Dispersed Amorphously
MASDsASDs with Drug Dispersed Molecularly
A–M BoundaryBoundary between AASDs and MASDs
M–A BoundaryBoundary between MASDs and AASDs
ACQAggregation-Caused Quenching
CURCurcumin
INDIndomethacin
PVPPolyvinylpyrrolidone
PVPVAPolyvinylpyrrolidone-Vinylacetate Copolymer
HPMCHydroxypropyl Methyl Cellulose
HPMCASHydroxypropyl Methyl Cellulose Acetate Succinate

References

  1. Li, J.; Wang, X.; Yu, D.; Zhoujin, Y.; Wang, K. Molecular complexes of drug combinations: A review of cocrystals, salts, coamorphous systems and amorphous solid dispersions. Int. J. Pharm. 2023, 648, 123555. [Google Scholar] [CrossRef] [PubMed]
  2. Mamidi, H.; Palekar, S.; Patel, H.; Nukala, P.K.; Patel, K. Formulation strategies for the development of high drug-loaded amorphous solid dispersions. Drug Discovery Today 2023, 28, 103806. [Google Scholar] [CrossRef] [PubMed]
  3. Azari Torbat, N.; Akbarzadeh, I.; Rezaei, N.; Salehi Moghaddam, Z.; Bazzazan, S.; Mostafavi, E. Curcumin-incorporated biomaterials: In silico and in vitro evaluation of biological potentials. Coord. Chem. Rev. 2023, 492, 215233. [Google Scholar] [CrossRef]
  4. Hegde, M.; Girisa, S.; BharathwajChetty, B.; Vishwa, R.; Kunnumakkara, A.B. Curcumin Formulations for Better Bioavailability: What We Learned from Clinical Trials Thus Far? ACS Omega 2023, 8, 10713–10746. [Google Scholar] [CrossRef]
  5. Sanphui, P.; Bolla, G. Curcumin, a biological wonder molecule: A crystal engineering point of view. Cryst. Growth Des. 2018, 18, 5690–5711. [Google Scholar] [CrossRef]
  6. Samsoen, S.; Dudognon, É.; Le Fer, G.; Fournier, D.; Woisel, P.; Affouard, F. Impact of the polymer dispersity on the properties of curcumin/polyvinylpyrrolidone amorphous solid dispersions. Int. J. Pharm. 2024, 653, 123895. [Google Scholar] [CrossRef]
  7. Xu, Y.; Shen, C.; Yuan, H.; Wu, W. Mapping multiple phases in curcumin binary solid dispersions by fluorescence contrasting. Chin. Chem. Lett. 2023, 35, 109324. [Google Scholar] [CrossRef]
  8. Al Fatease, A.; Abourehab, M.A.S.; Alqahtani, A.M.; Chidambaram, K.; Qureshi, A.A.; Venkatesan, K.; Alshahrani, S.M.; Abdelkader, H. Polymeric/dextran wafer dressings as promising long-acting delivery systems for curcumin topical delivery and enhancing wound healing in male wistar albino rats. Pharmaceuticals 2023, 16, 38. [Google Scholar] [CrossRef]
  9. Pan-On, S.; Tiyaboonchai, W. Development, characterization and Caco-2 cells absorption of curcumin solid dispersion for oral administration. J. Drug Deliv. Sci. Technol. 2023, 86, 104574. [Google Scholar] [CrossRef]
  10. Nogami, S.; Minoura, K.; Kiminami, N.; Kitaura, Y.; Uchiyama, H.; Kadota, K.; Tozuka, Y. Stabilizing effect of the cyclodextrins additive to spray-dried particles of curcumin/polyvinylpyrrolidone on the supersaturated state of curcumin. Adv. Powder Technol. 2021, 32, 1750–1756. [Google Scholar] [CrossRef]
  11. Meng, F.; Paul, S.K.; Borde, S.; Chauhan, H. Investigating crystallization tendency, miscibility, and molecular interactions of drug–polymer systems for the development of amorphous solid dispersions. Drug Dev. Ind. Pharm. 2021, 47, 579–608. [Google Scholar] [CrossRef] [PubMed]
  12. Sekitoh, T.; Okamoto, T.; Fujioka, A.; Tramis, O.; Takeda, K.; Matsuura, T.; Imanaka, H.; Ishida, N.; Imamura, K. Sole-amorphous-sugar-based solid dispersion of curcumin and the influence of formulation composition and heat treatment on the dissolution of curcumin. Dry. Technol. 2021, 39, 2065–2074. [Google Scholar] [CrossRef]
  13. Liu, Y.; Chen, X.; Yu, D.-G.; Liu, H.; Liu, Y.; Liu, P. Electrospun PVP-core/PHBV-shell fibers to eliminate tailing off for an improved sustained release of curcumin. Mol. Pharm. 2021, 18, 4170–4178. [Google Scholar] [CrossRef]
  14. Jamal Moideen, M.M.; Alqahtani, A.; Venkatesan, K.; Ahmad, F.; Krisharaju, K.; Gayasuddin, M.; Shaik, R.A.; Ibraheem, K.M.M.; Salama, M.E.-d.M.; Abed, S.Y. Application of the Box–Behnken design for the production of soluble curcumin: Skimmed milk powder inclusion complex for improving the treatment of colorectal cancer. Food Sci. Nutr. 2020, 8, 6643–6659. [Google Scholar] [CrossRef]
  15. Fan, N.; Lu, T.; Li, J. Surface tracking of curcumin amorphous solid dispersions formulated by binary polymers. J. Pharm. Sci. 2020, 109, 1068–1078. [Google Scholar] [CrossRef]
  16. He, Y.; Liu, H.; Bian, W.; Liu, Y.; Liu, X.; Ma, S.; Zheng, X.; Du, Z.; Zhang, K.; Ouyang, D. Molecular interactions for the curcumin-polymer complex with enhanced anti-inflammatory effects. Pharmaceutics 2019, 11, 442. [Google Scholar] [CrossRef]
  17. Gao, Y.; Chen, G.; Luan, X.; Zou, M.; Piao, H.; Cheng, G. Improved oral absorption of poorly soluble curcumin via the concomitant use of borneol. AAPS PharmSciTech 2019, 20, 150. [Google Scholar] [CrossRef]
  18. Matos, R.L.; Lu, T.; Prosapio, V.; McConville, C.; Leeke, G.; Ingram, A. Coprecipitation of curcumin/PVP with enhanced dissolution properties by the supercritical antisolvent process. J. CO2 Util. 2019, 30, 48–62. [Google Scholar] [CrossRef]
  19. Liang, Q.; Wang, Y.-R.; Deng, Y.-Y. Effect of HPMCAS/curcumin amorphous solid dispersion in enhancing dissolution and chemical stability of curcumin. China J. Chin. Mater. Med. 2019, 44, 3305–3311. [Google Scholar]
  20. de Almeida, M.; da Rocha, B.A.; Francisco, C.R.L.; Miranda, C.G.; Santos, P.D.d.F.; de Araújo, P.H.H.; Sayer, C.; Leimann, F.V.; Gonçalves, O.H.; Bersani-Amado, C.A. Evaluation of the in vivo acute antiinflammatory response of curcumin-loaded nanoparticles. Food Funct. 2018, 9, 440–449. [Google Scholar] [CrossRef]
  21. Li, J.; Wang, X.; Li, C.; Fan, N.; Wang, J.; He, Z.; Sun, J. Viewing molecular and interface interactions of curcumin amorphous solid dispersions for comprehending dissolution mechanisms. Mol. Pharm. 2017, 14, 2781–2792. [Google Scholar] [CrossRef] [PubMed]
  22. Tsekova, P.B.; Spasova, M.G.; Manolova, N.E.; Markova, N.D.; Rashkov, I.B. Electrospun curcumin-loaded cellulose acetate/polyvinylpyrrolidone fibrous materials with complex architecture and antibacterial activity. Mater. Sci. Eng. 2017, 73, 206–214. [Google Scholar] [CrossRef] [PubMed]
  23. Tsekova, P.; Spasova, M.; Manolova, N.; Rashkov, I.; Markova, N.; Georgieva, A.; Toshkova, R. Electrospun cellulose acetate membranes decorated with curcumin-PVP particles: Preparation, antibacterial and antitumor activities. J. Mater. Sci. Mater. Med. 2017, 29, 9. [Google Scholar] [CrossRef]
  24. Adami, R.; Di Capua, A.; Reverchon, E. Supercritical Assisted Atomization for the production of curcumin-biopolymer microspheres. Powder Technol. 2017, 305, 455–461. [Google Scholar] [CrossRef]
  25. Sadeghi, F.; Ashofteh, M.; Homayouni, A.; Abbaspour, M.; Nokhodchi, A.; Garekani, H.A. Antisolvent precipitation technique: A very promising approach to crystallize curcumin in presence of polyvinyl pyrrolidon for solubility and dissolution enhancement. Colloids Surf. B 2016, 147, 258–264. [Google Scholar] [CrossRef]
  26. Rahma, A.; Munir, M.M.; Khairurrijal; Prasetyo, A.; Suendo, V.; Rachmawati, H. Intermolecular interactions and the release pattern of electrospun curcumin-polyvinyl (pyrrolidone) fiber. Biol. Pharm. Bull. 2016, 39, 163–173. [Google Scholar] [CrossRef]
  27. Meng, F.; Trivino, A.; Prasad, D.; Chauhan, H. Investigation and correlation of drug polymer miscibility and molecular interactions by various approaches for the preparation of amorphous solid dispersions. Eur. J. Pharm. Sci. 2015, 71, 12–24. [Google Scholar] [CrossRef]
  28. Wegiel, L.A.; Zhao, Y.; Mauer, L.J.; Edgar, K.J.; Taylor, L.S. Curcumin amorphous solid dispersions: The influence of intra and intermolecular bonding on physical stability. Pharm. Dev. Technol. 2014, 19, 976–986. [Google Scholar] [CrossRef]
  29. Kakran, M.; Sahoo, N.G.; Tan, Y.W.; Li, L. Ternary dispersions to enhance solubility of poorly water soluble antioxidants. Colloids Surf. A 2013, 433, 111–121. [Google Scholar] [CrossRef]
  30. Munjal, B.; Pawar, Y.B.; Patel, S.B.; Bansal, A.K. Comparative oral bioavailability advantage from curcumin formulations. Drug Deliv. Transl. Res. 2011, 1, 322–331. [Google Scholar] [CrossRef]
  31. Paradkar, A.; Ambike, A.A.; Jadhav, B.K.; Mahadik, K.R. Characterization of curcumin–PVP solid dispersion obtained by spray drying. Int. J. Pharm. 2004, 271, 281–286. [Google Scholar] [CrossRef] [PubMed]
  32. Qi, J.; Hu, X.; Dong, X.; Lu, Y.; Lu, H.; Zhao, W.; Wu, W. Towards more accurate bioimaging of drug nanocarriers: Turning aggregation-caused quenching into a useful tool. Adv. Drug Deliv. Rev. 2019, 143, 206–225. [Google Scholar] [CrossRef] [PubMed]
  33. Tomar, Y.; Maheshwari, S.; Gorantla, S.; Singhvi, G. Curcumin loaded liquid crystalline nanoparticles for enhanced topical application: Design, characterization, ex vivo and dermatokinetic evaluation. J. Drug Deliv. Sci. Technol. 2024, 92, 105391. [Google Scholar] [CrossRef]
  34. Dai, Y.; Terskikh, V.; Brinmkmann, A.; Wu, G. Solid-state 1H, 13C, and 17O NMR characterization of the two uncommon polymorphs of curcumin. Cryst. Growth Des. 2020, 20, 7484–7491. [Google Scholar] [CrossRef]
  35. Han, J.; Wei, Y.; Li, L.; Song, Y.; Pang, Z.; Qian, S.; Zhang, J.; Gao, Y.; Heng, W. Gelation elimination and crystallization Inhibition by co-amorphous strategy for amorphous curcumin. J. Pharm. Sci. 2023, 112, 182–194. [Google Scholar] [CrossRef]
  36. Gehlen, M.H. The centenary of the Stern-Volmer equation of fluorescence quenching: From the single line plot to the SV quenching map. J. Photochem. Photobiol. C 2020, 42, 100338. [Google Scholar] [CrossRef]
  37. Puglisi, A.; Giovannini, T.; Antonov, L.; Cappelli, C. Interplay between conformational and solvent effects in UV-visible absorption spectra: Curcumin tautomers as a case study. Phys. Chem. Chem. Phys. 2019, 21, 15504–15514. [Google Scholar] [CrossRef]
  38. Malik, P.; Mukherjee, T.K. Structure-function elucidation of antioxidative and prooxidative activities of the polyphenolic compound curcumin. Chin. J. Biol. 2014, 2014, 396708. [Google Scholar] [CrossRef]
  39. Yang, F.; Lim, G.P.; Begum, A.N.; Ubeda, O.J.; Simmons, M.R.; Ambegaokar, S.S.; Chen, P.P.; Kayed, R.; Glabe, C.G.; Frautschy, S.A.; et al. Curcumin Inhibits Formation of Amyloid β Oligomers and Fibrils, Binds Plaques, and Reduces Amyloid in Vivo*. J. Biol. Chem. 2005, 280, 5892–5901. [Google Scholar] [CrossRef]
  40. Cornago, P.; Claramunt, R.M.; Bouissane, L.; Alkorta, I.; Elguero, J. A study of the tautomerism of β-dicarbonyl compounds with special emphasis on curcuminoids. Tetrahedron 2008, 64, 8089–8094. [Google Scholar] [CrossRef]
  41. Payton, F.; Sandusky, P.; Alworth, W.L. NMR study of the solution structure of curcumin. J. Nat. Prod. 2007, 70, 143–146. [Google Scholar] [CrossRef] [PubMed]
  42. Shen, L.; Ji, H.-F. Theoretical study on physicochemical properties of curcumin. Spectrochim. Acta Part A 2007, 67, 619–623. [Google Scholar] [CrossRef] [PubMed]
  43. Huang, Y.; Dai, W.-G. Fundamental aspects of solid dispersion technology for poorly soluble drugs. Acta Pharm. Sin. B 2014, 4, 18–25. [Google Scholar] [CrossRef] [PubMed]
  44. Babu, N.J.; Nangia, A. Solubility advantage of amorphous drugs and pharmaceutical cocrystals. Cryst. Growth Des. 2011, 11, 2662–2679. [Google Scholar] [CrossRef]
  45. Newman, A.; Engers, D.; Bates, S.; Ivanisevic, I.; Kelly, R.C.; Zografi, G. Characterization of amorphous API: Polymer mixtures using X-ray powder diffraction. J. Pharm. Sci. 2008, 97, 4840–4856. [Google Scholar] [CrossRef]
  46. Newman, A.; Zografi, G. Commentary: Considerations in the measurement of glass transition temperatures of pharmaceutical amorphous solids. AAPS PharmSciTech 2019, 21, 26. [Google Scholar] [CrossRef]
Scheme 1. Schematic diagram of the boundary between AASDs and MASDs (A–M boundary) and the boundary between MASDs and AASDs (M–A boundary). A–M boundary: the drug concentration at which the existence of MASDs start mainly influencing the physicochemical properties of the ASDs. M–A boundary: the drug concentration at which AASDs start mainly influencing the physicochemical properties.
Crystals 15 00512 sch001
Figure 1. Preparation and characterizations of curcumin (CUR) ASDs with PVP. (a) Molecular structure of CUR, (b) optical images, and (c) PXRD patterns of raw CUR, amorphous CUR prepared by melt-quenching method, and CUR ASDs with varying CUR loadings ranging from 1 to 40 wt.%.
Crystals 15 00512 g001
Figure 2. Determination of the A–M boundary for CUR ASDs by fluorescence spectroscopy. (a) Fluorescence spectra (λex 430 nm) and (b) the relationship curve between the fluorescence intensity and coefficient k of CUR ASDs and the CUR loading. The arrows in (b) are used to indicate the corresponding vertical coordinate of the curve.
Crystals 15 00512 g002
Figure 3. Mid-frequency IR and Raman spectra (normalized) of CUR ASDs with PVP. (a) IR spectra (in the range of 400–1800−1) of PVP and CUR ASDs (IR signals of CUR are arrowed); (b) IR spectra (in the range of 400–1800−1) of raw CUR, amorphous CUR, and IR signals of CUR in ASDs obtained by subtracting the IR spectrum of PVP from that of CUR ASDs (dotted lines added for annotation to facilitate comparison); (c) Raman spectra of PVP and CUR ASDs in the range of 300–1800−1 (Raman signals of PVP are arrowed); (d) Raman spectra of raw CUR, amorphous CUR, and Raman signals of CUR in ASDs obtained by subtracting the Raman spectrum of PVP from that of CUR ASDs (dotted lines added for annotation to facilitate comparison).
Crystals 15 00512 g003
Figure 4. Dissolution profiles of raw CUR and CUR ASDs with PVP (CUR loading: 2, 4, 6, 10, and 20 wt.%).
Crystals 15 00512 g004
Figure 5. Stability of CUR ASDs with PVP with CUR loadings in the range of 1–20 wt.%. (a) PXRD patterns, (b) dissolution profiles, (c) fluorescence spectra, and (d) the relationship curve of characteristic fluorescence intensities and coefficient k with CUR loading of samples after being stored for one year. The arrows in (d) are used to indicate the corresponding vertical coordinate of the curve.
Crystals 15 00512 g005
Figure 6. Preparation of CUR ASDs with various polymers with CUR loading ranging from 1 to 20 wt.%. (a) PVPVA, (b) Soluplus, (c) HPMC, and (d) HPMC-AS.
Crystals 15 00512 g006
Figure 7. A–M boundary determined for CUR ASDs with various polymers. Fluorescence spectra, the relationship between the characteristic fluorescence intensities, and coefficient k and the CUR loading of CUR ASDs with (a) PVPVA, (b) Soluplus, (c) HPMC, and (d) HPMCAS. The arrows in the figures are used to indicate the corresponding vertical coordinate of the curve.
Crystals 15 00512 g007
Figure 8. Dissolution profiles of CUR ASDs with various polymers. (a) PVPVA, (b) Soluplus, (c) HPMC, and (d) HPMCAS. The CUR loadings are 2%, 4%, 6%, 10%, and 20%.
Crystals 15 00512 g008
Figure 9. (a) PXRD patterns and (b) dissolution profiles of indomethacin (IND) ASDs with PVP.
Crystals 15 00512 g009
Scheme 2. Schematic diagram of the dissolution models for AASDs and MASDs.
Crystals 15 00512 sch002
Table 1. Summary of some reported curcumin (CUR) amorphous solid dispersions (ASDs) with PVP.
CUR%Preparation MethodCharacterizationsDispersion StateRef
5–90co-milling or solvent evaporationPXRDamorphous[6]
5–50solvent co-precipitationPXRD, DSCamorphous[7]
-solvent castingPXRD, DSC, IRamorphous or molecular[8]
10–25melting solventPXRDamorphous[9]
10solvent evaporationPXRD, IRamorphous[10]
30–70solvent evaporationPXRD, DSC, IRamorphous[11]
1–10vacuum foam drying--[12]
10electrospinningPXRDamorphous[13]
12.5–25solvent evaporationPXRD, IRamorphous[14]
20solvent evaporationPXRD, IR, Ramanamorphous[15]
10–50solvent evaporationPXRD, DSCamorphous or molecular[16]
25–50solvent evaporationPXRD, DSC, IRamorphous[17]
10–25supercritical antisolventPXRD, DSC, IRamorphous[18]
10–25solvent evaporationDSCamorphous[19]
14solvent evaporationIRamorphous[20]
25–50rotary evaporationIR, Ramanamorphous[21]
10electrospinningPXRD, DSCamorphous[22]
3–5electrospinningPXRD, IRamorphous[23]
10–30supercritical assisted atomizationPXRD, DSC, IRamorphous[24]
33–100antisolvent crystallizationPXRD, DSC, IRamorphous[25]
9electrospinningIR, Ramanamorphous[26]
70solvent evaporationPXRD, DSC, IR, Ramanamorphous[27]
25rapid solvent evaporationPXRD, DSC, IRamorphous[28]
-solvent evaporationPXRD, DSC, IR, Ramanamorphous or molecular[29]
50solvent evaporationPXRD, DSCmolecular[30]
9–50spray dryingPXRD, DSC, IRamorphous[31]
Table 2. Characteristic IR and Raman bands of crystallized CUR, amorphous CUR, and CUR ASDs.
SpectraRawAmorphous20%10%6%2%
IR15981584158515891582
149815101514151415151513
111311151124112611261126
102610261030102810301031
958962966966966
Raman162616341631163216321630
160016011598159815971597
13211308130513051305
118311831186118611871186
11511122112611271128
960972974976974
Disclaimer/Publisher’s Note: The statements, opinions and data contained in all publications are solely those of the individual author(s) and contributor(s) and not of MDPI and/or the editor(s). MDPI and/or the editor(s) disclaim responsibility for any injury to people or property resulting from any ideas, methods, instructions or products referred to in the content.

