Article

Study of the Electrical Conduction Mechanism in Low-Frequency Field for CuMnO2 Crednerite-Type Materials Obtained by Microwave-Assisted Hydrothermal Synthesis

1
Faculty of Physics, West University of Timisoara, Bd. V. Parvan No. 4, 300223 Timisoara, Romania
2
Institute for Advanced Environmental Research, West University of Timisoara (ICAM-WUT), Oituz Str., No. 4, 300086 Timisoara, Romania
3
National Institute for Research and Development in Electrochemistry and Condensed Matter (INCEMC), Dr. A.P. Podeanu Str. No. 144, 300569 Timisoara, Romania
*
Authors to whom correspondence should be addressed.
Crystals 2025, 15(6), 497; https://doi.org/10.3390/cryst15060497
Submission received: 28 March 2025 / Revised: 20 May 2025 / Accepted: 21 May 2025 / Published: 23 May 2025
(This article belongs to the Section Inorganic Crystalline Materials)

Abstract

:
The electrical conductivity of nanocrystalline CuMnO2 samples, obtained by microwave-assisted hydrothermal synthesis (MWH), is studied by impedance spectroscopy over a frequency range of 30 Hz to 2 MHz and a temperature range from 30 to 120 °C. Three samples are prepared to start from a mixture of sulphate reactants, at two synthesis temperatures and different reaction times (of applying microwaves): sample S1 at 80 °C for 5 min; sample S2 at 120 °C for 5 min and sample S3 at 120 °C for one hour. The static conductivity values, σDC of samples S2 and S3, are approximately equal but larger than those of sample S1. This result suggests that using MWH synthesis at 120 °C, with different reaction times (samples S2 and S3), is sufficient for microwaves to be applied for at least 5 min to obtain samples with similar electrical properties. The experimental data were analysed based on three theoretical models, demonstrating that the most appropriate theoretical model to explain the electrical conduction mechanism in the samples is Mott’s variable range hopping (VRH) model. Using this model, the activation energy of conduction, (EA,cond), the density of localized states near the Fermi level, N(EF), the hopping distance, Rh(T), the hopping energy, Wh(T) and the charge carrier mobility (μ) were determined for the first time, for microwave-assisted hydrothermally synthesized crednerite. Additionally, the band gap energy (Wm) and hopping frequency (ωh) were evaluated at various temperatures T. Understanding the electrical conduction mechanism in the polycrystalline CuMnO2 materials is important for their use in photo-electrochemical and photocatalytic applications, photovoltaic devices, and, more recently, in environmental protection.

1. Introduction

Delafossite CuMO2 compounds have attracted the attention of many researchers due to their intriguing optoelectronic properties (p-type dye-sensitized solar cells [1], p-type transparent conductive materials [2]) and magnetic properties (multiferroics such as spin-driven ferroelectrics [3,4]) for example, being and have been intensively studied over the last few decades. Furthermore, research has been conducted to develop optically active oxides with new band structures for photo-electrochemical (PEC) applications [5]. On another note, promising results have emerged in photochemical energy conversion [6], and in various fields, such as photovoltaic devices [7], photocatalysis [8], and environmental protection [9]. These copper-based delafossites CuMO2 (M = Cr, Ga, In, Fe, Mn) have been extensively investigated [10] to understand the transport of electrical charges and to optimize their optical and electrical properties.
The CuMnO2 crednerite-type material from the delafossite family is the only oxide compound that crystallizes in monoclinic symmetry within the space group C2/m, due to the Jahn-Teller effect of Mn3+ ions [11]. Studies are conducted on the optical and semiconductor characterization [12] of the CuMnO2 material, which exhibits p-type conductivity and can be enhanced by factors such as Cu for Mn substitution, preparation method, and the influence of Cu/Mn non-stoichiometry. Notable results regarding the photoelectrochemical properties of the crednerite CuMnO2 and its application in hydrogen production have also been documented in [13,14].
Regarding the synthesis of the CuMnO2 crednerite compound, several preparation methods are possible: solid-phase sintering [15], coprecipitation [16], sol-gel method [17], or hydrothermal synthesis at (80–210) °C [18,19]. In the methods used, tuning the preparation conditions (temperature, alkali concentration, pH, time, reactants) is particularly useful for preventing the formation of impurity phases and obtaining CuMnO2 compounds with the crednerite structure and the desired Cu/Mn ratio. The electrical and magnetic properties of CuMnO2 greatly depend on the preparation conditions and may change upon entering Fe, Mg, or Al ions in the crednerite structure [20,21,22].
In this paper, CuMnO2 crednerite samples are prepared by a new method, microwave-assisted hydrothermal synthesis, and obtained at two synthesis temperatures (80 °C and 120 °C) and different microwave application times (5 min and 1 h). The reaction conditions, especially the precursors, are selected and optimized to obtain the crednerite structure. To our knowledge, only a limited number of studies are reported in the literature [23] to address the electrical properties and conduction mechanisms of charge carriers in crednerite. Thus, in other papers, the temperature dependence of static electrical conductivity is determined for Cu1+xMn1-xO2 type crednerite compounds [20], respectively CuMnO2 doped with Mg ions [21]. Also, using the temperature dependence of the static electrical resistivity [2], the thermal activation energies of the undoped delafossitic compound CuCrO2, were determined and the values obtained are between (100–300) meV. In the case of doped delafossitic compounds, such as Ni/CuCrO2 [10], the thermal activation energy drops below 100 meV because the Fermi level is shifted towards the valence band by doping. Regarding the dynamic electrical properties of crednerite-type materials CuMn1−xMgxO2 (x = 0–0.06), in our recent paper [24] we analyzed the influence of substitution with Mg ions of different x concentrations, on the electrical conductivity (σ), electrical modulus (M) and complex dielectric permittivity (ε) at room temperature and in a low-frequency field. As a result, in our paper, the electrical conductivity of CuMnO2 crednerite samples is determined using the complex impedance measurements at low frequencies (30 Hz–2 MHz) and different temperatures in the range (30–120) °C, to correlate the electrical conductivity with the original method of obtaining the samples through microwave-assisted hydrothermal synthesis. At the same time, the electrical conduction mechanism in the CuMnO2 samples was analysed using three theoretical models: (i) the semiconduction (SC) model [25], (ii) the variable range hopping (VRH) model of Mott [26], and (iii) the Efros–Shklovskii (ES-VRH) model [27]. It demonstrates that the most suitable theoretical model to explain the mechanism of electrical conduction in samples is Mott’s VRH model. The results obtained may be useful both in applications of crednerite materials and in the studies on transport phenomena by charge carrier hopping between localized states in these systems.

2. Materials and Methods

2.1. Microwave-Assisted Hydrothermal Synthesis (MWH)

The CuMnO2 samples are obtained using the microwave-assisted hydrothermal method (MWH), proposed for the first time for these materials in [28]. This paper introduces a new approach for obtaining crednerite materials, starting from different raw materials. The starting reactants used to synthesize the three samples from this study in the microwave reaction system Multiwave 300 (Anton Paar,Graz, Austtria 2.45 GHz) are the following sulphates: 2 mmol CuSO4 (0.3192 g) and 2 mmol MnSO4·H2O (0.338 g), being different from the nitrates reactants used in the previous study [28]. These sulphate precursors weighed in the desired proportions, dissolved sequentially in 10 mL distilled water and then transferred together in the same Berzelius glass. A solution of 2.5 M NaOH is prepared by adding NaOH (pellets of 10.07 g) in 100 mL distilled water and 30 mL of this solution is added to the sulphates mixture which determines the precipitation of the solution. The NaOH base set a pH value equal to ~12, it was shown in the previous studies that this parameter is essential in the synthesis of CuMnO2 as the main product and has to be adjusted between ~11 and 1~2.5. The final precipitate (volume of 50 mL) is stirred vigorously at room temperature for approximately 30 min and then transferred to the vessel inside the Multiwave 300 Anton Paar. The precipitate is subjected to two synthesis temperatures and different microwave application times (t), as follows: 80 °C, t = 5 min (Sample S1); 120 °C, t = 5 min (Sample S2), and 120 °C, t = 1 h (Sample S3). After the thermal treatment ended, the samples were removed from the vessel, washed with distilled water several times, and dried in an oven at 80 °C for 12 h.

2.2. Characterization Techniques

The obtained polycrystalline crednerite CuMnO2 samples were analyzed by X-ray diffraction (XRD) using the PANalytical-X’Pert PRO diffractometer (PANalytical, Almelo, The Netherlands) with Cu Kα, 10° ≤ 2θ ≤ 80° incident radiations. Using the Rietveld method, the refinement of the sample diffractograms is performed with the FULLPROF program from the Fullprof suite (version April 2021) [29].
The Fourier transform infrared (FT-IR) spectra were recorded in the air with a Shimadzu Prestige Company, Model Prestige, Tokyo, Japan, FT-IR spectrometer, using the KBr pellets technique in the 400–1800 cm−1 range.
The surface morphology for CuMnO2 crednerite materials synthesized by the microwave-assisted hydrothermal method is highlighted using a Scanning Electron Microscope EmCrafts CUBE II (EmCrafts Co. Ltd., Gwangjusi, Republic of Korea).
The real part (Z′) and the imaginary part (Z″) of complex impedance (Z) of the crednerite CuMnO2 samples were measured across a frequency range of 30 Hz to 2 MHz at varying temperatures between 30 °C and 120 °C. These measurements were conducted using an LCR-meter (Agilent E-4980A type) USA, in combination with a custom-built experimental setup, following a procedure analogous to ASTM D150-98 [30,31]. From these experimental data, the electrical conductivity of crednerite samples was determined.

3. Results and Discussion

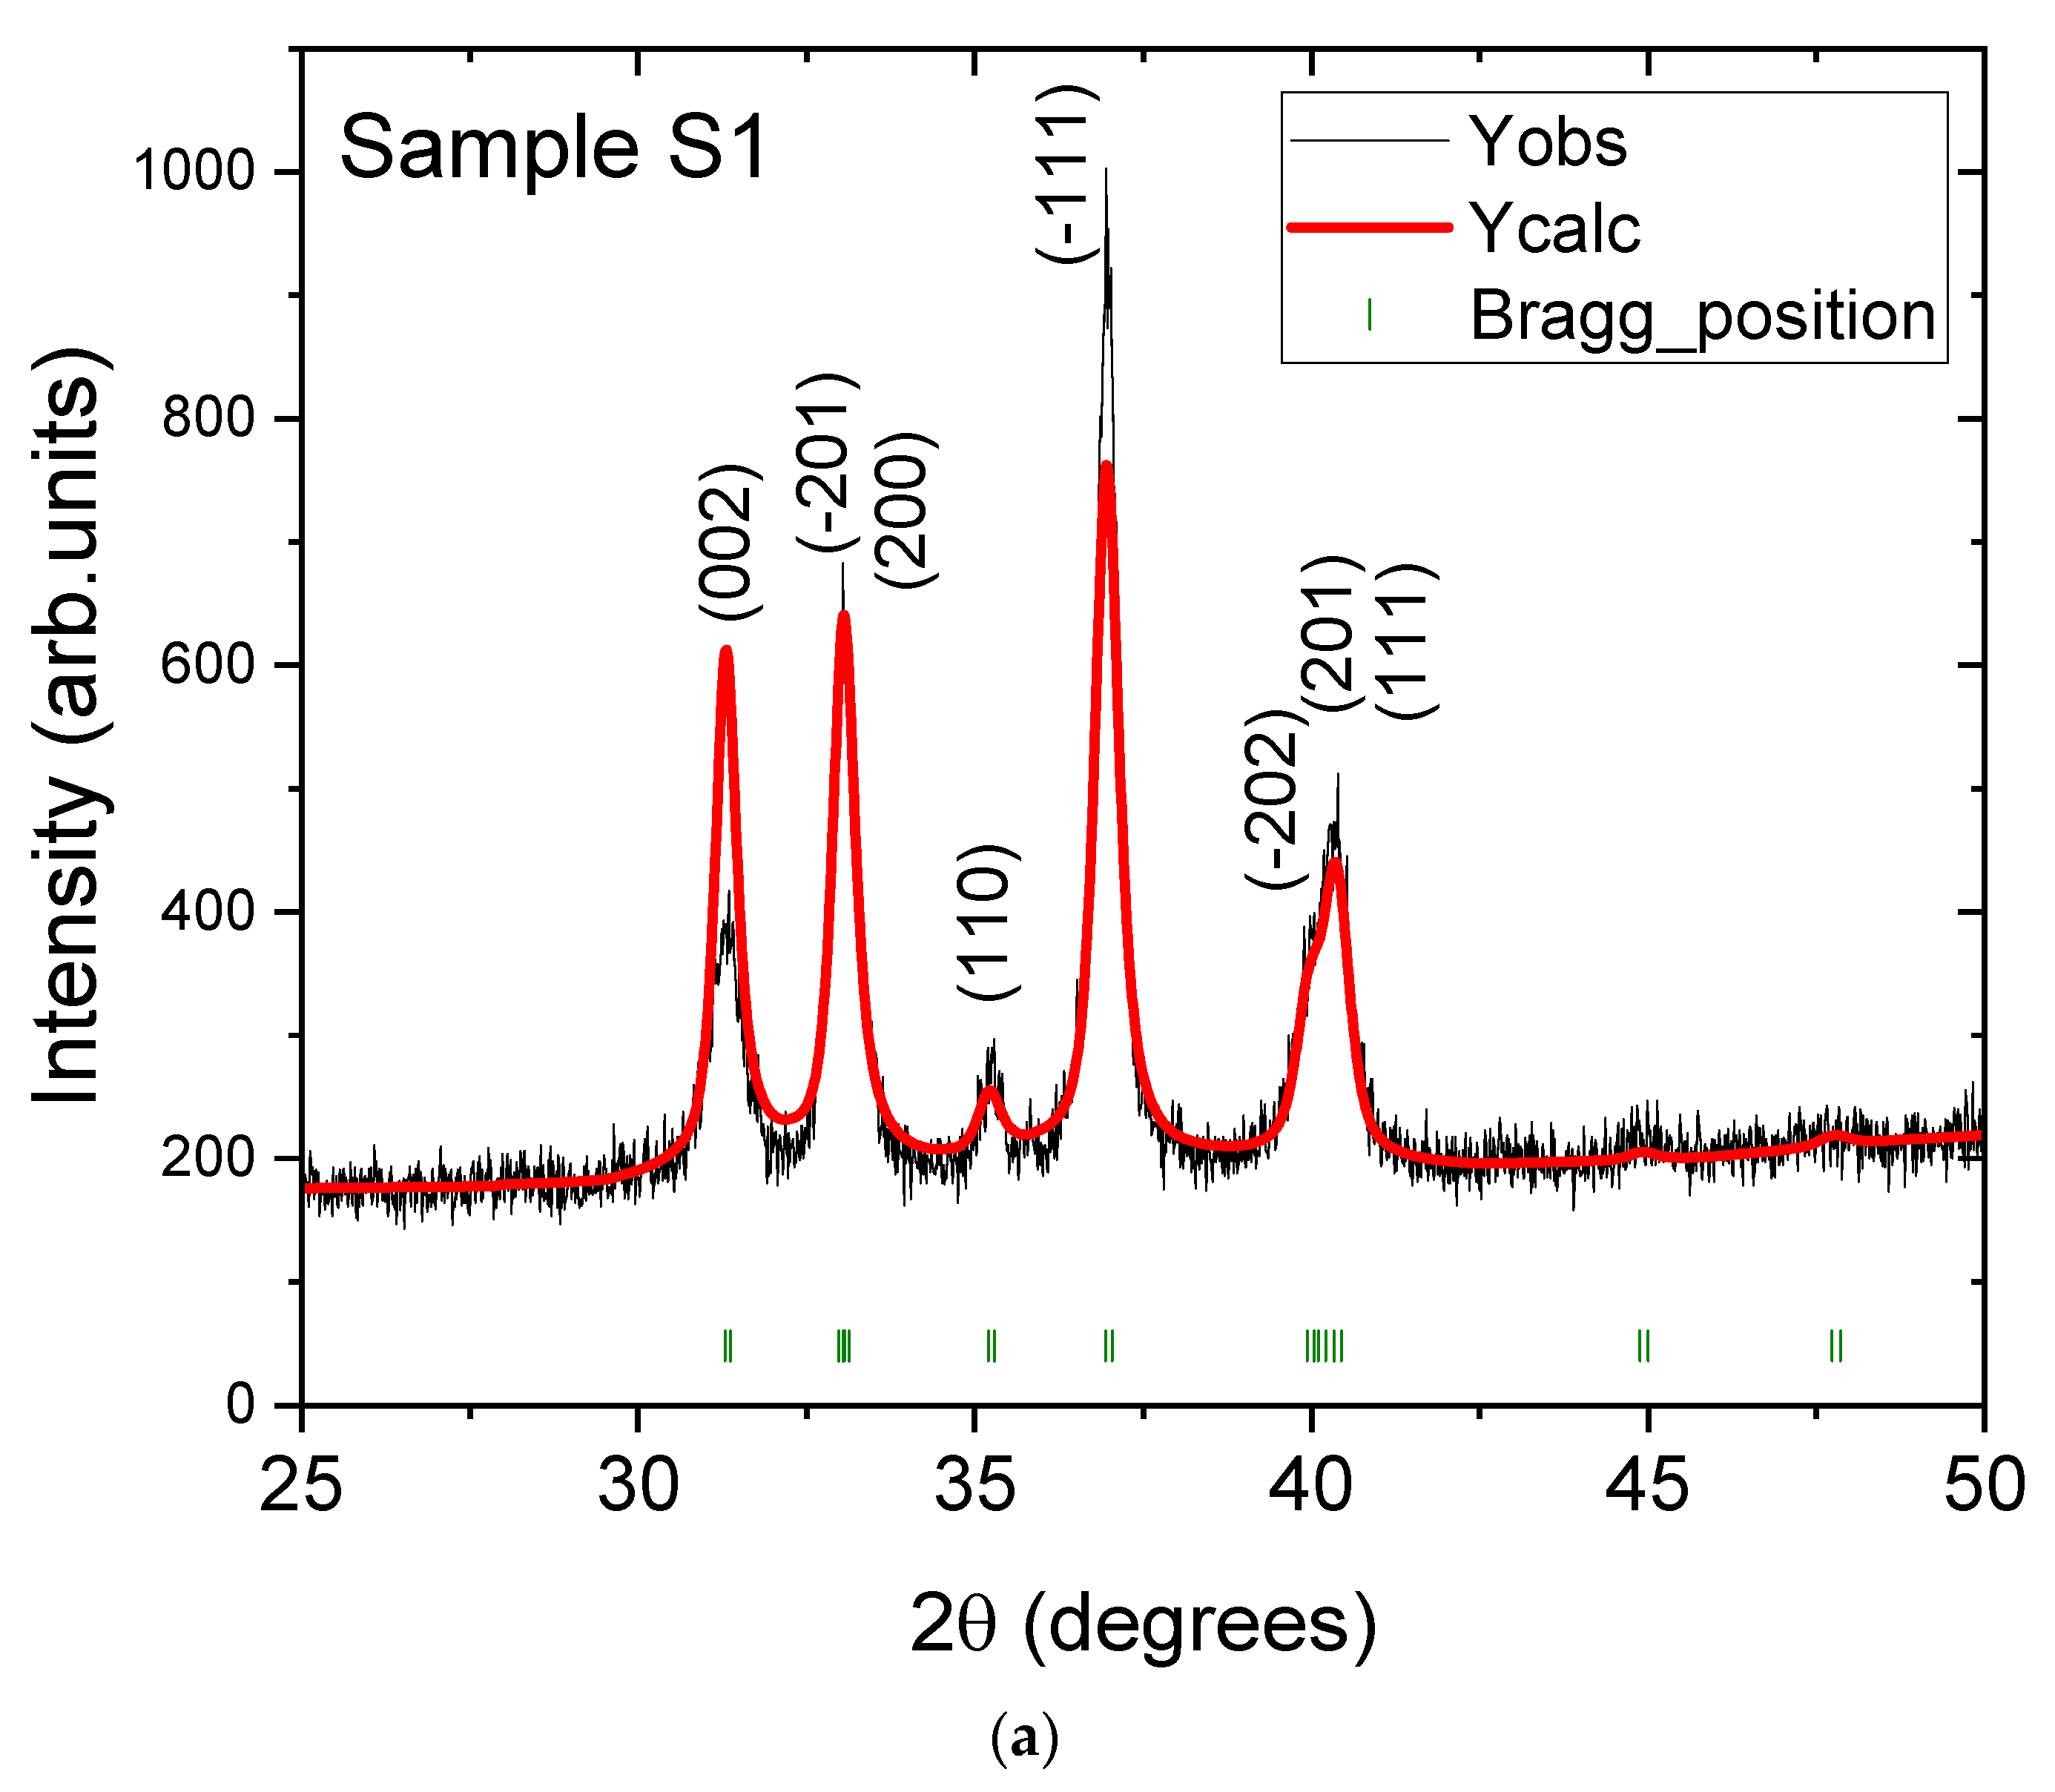
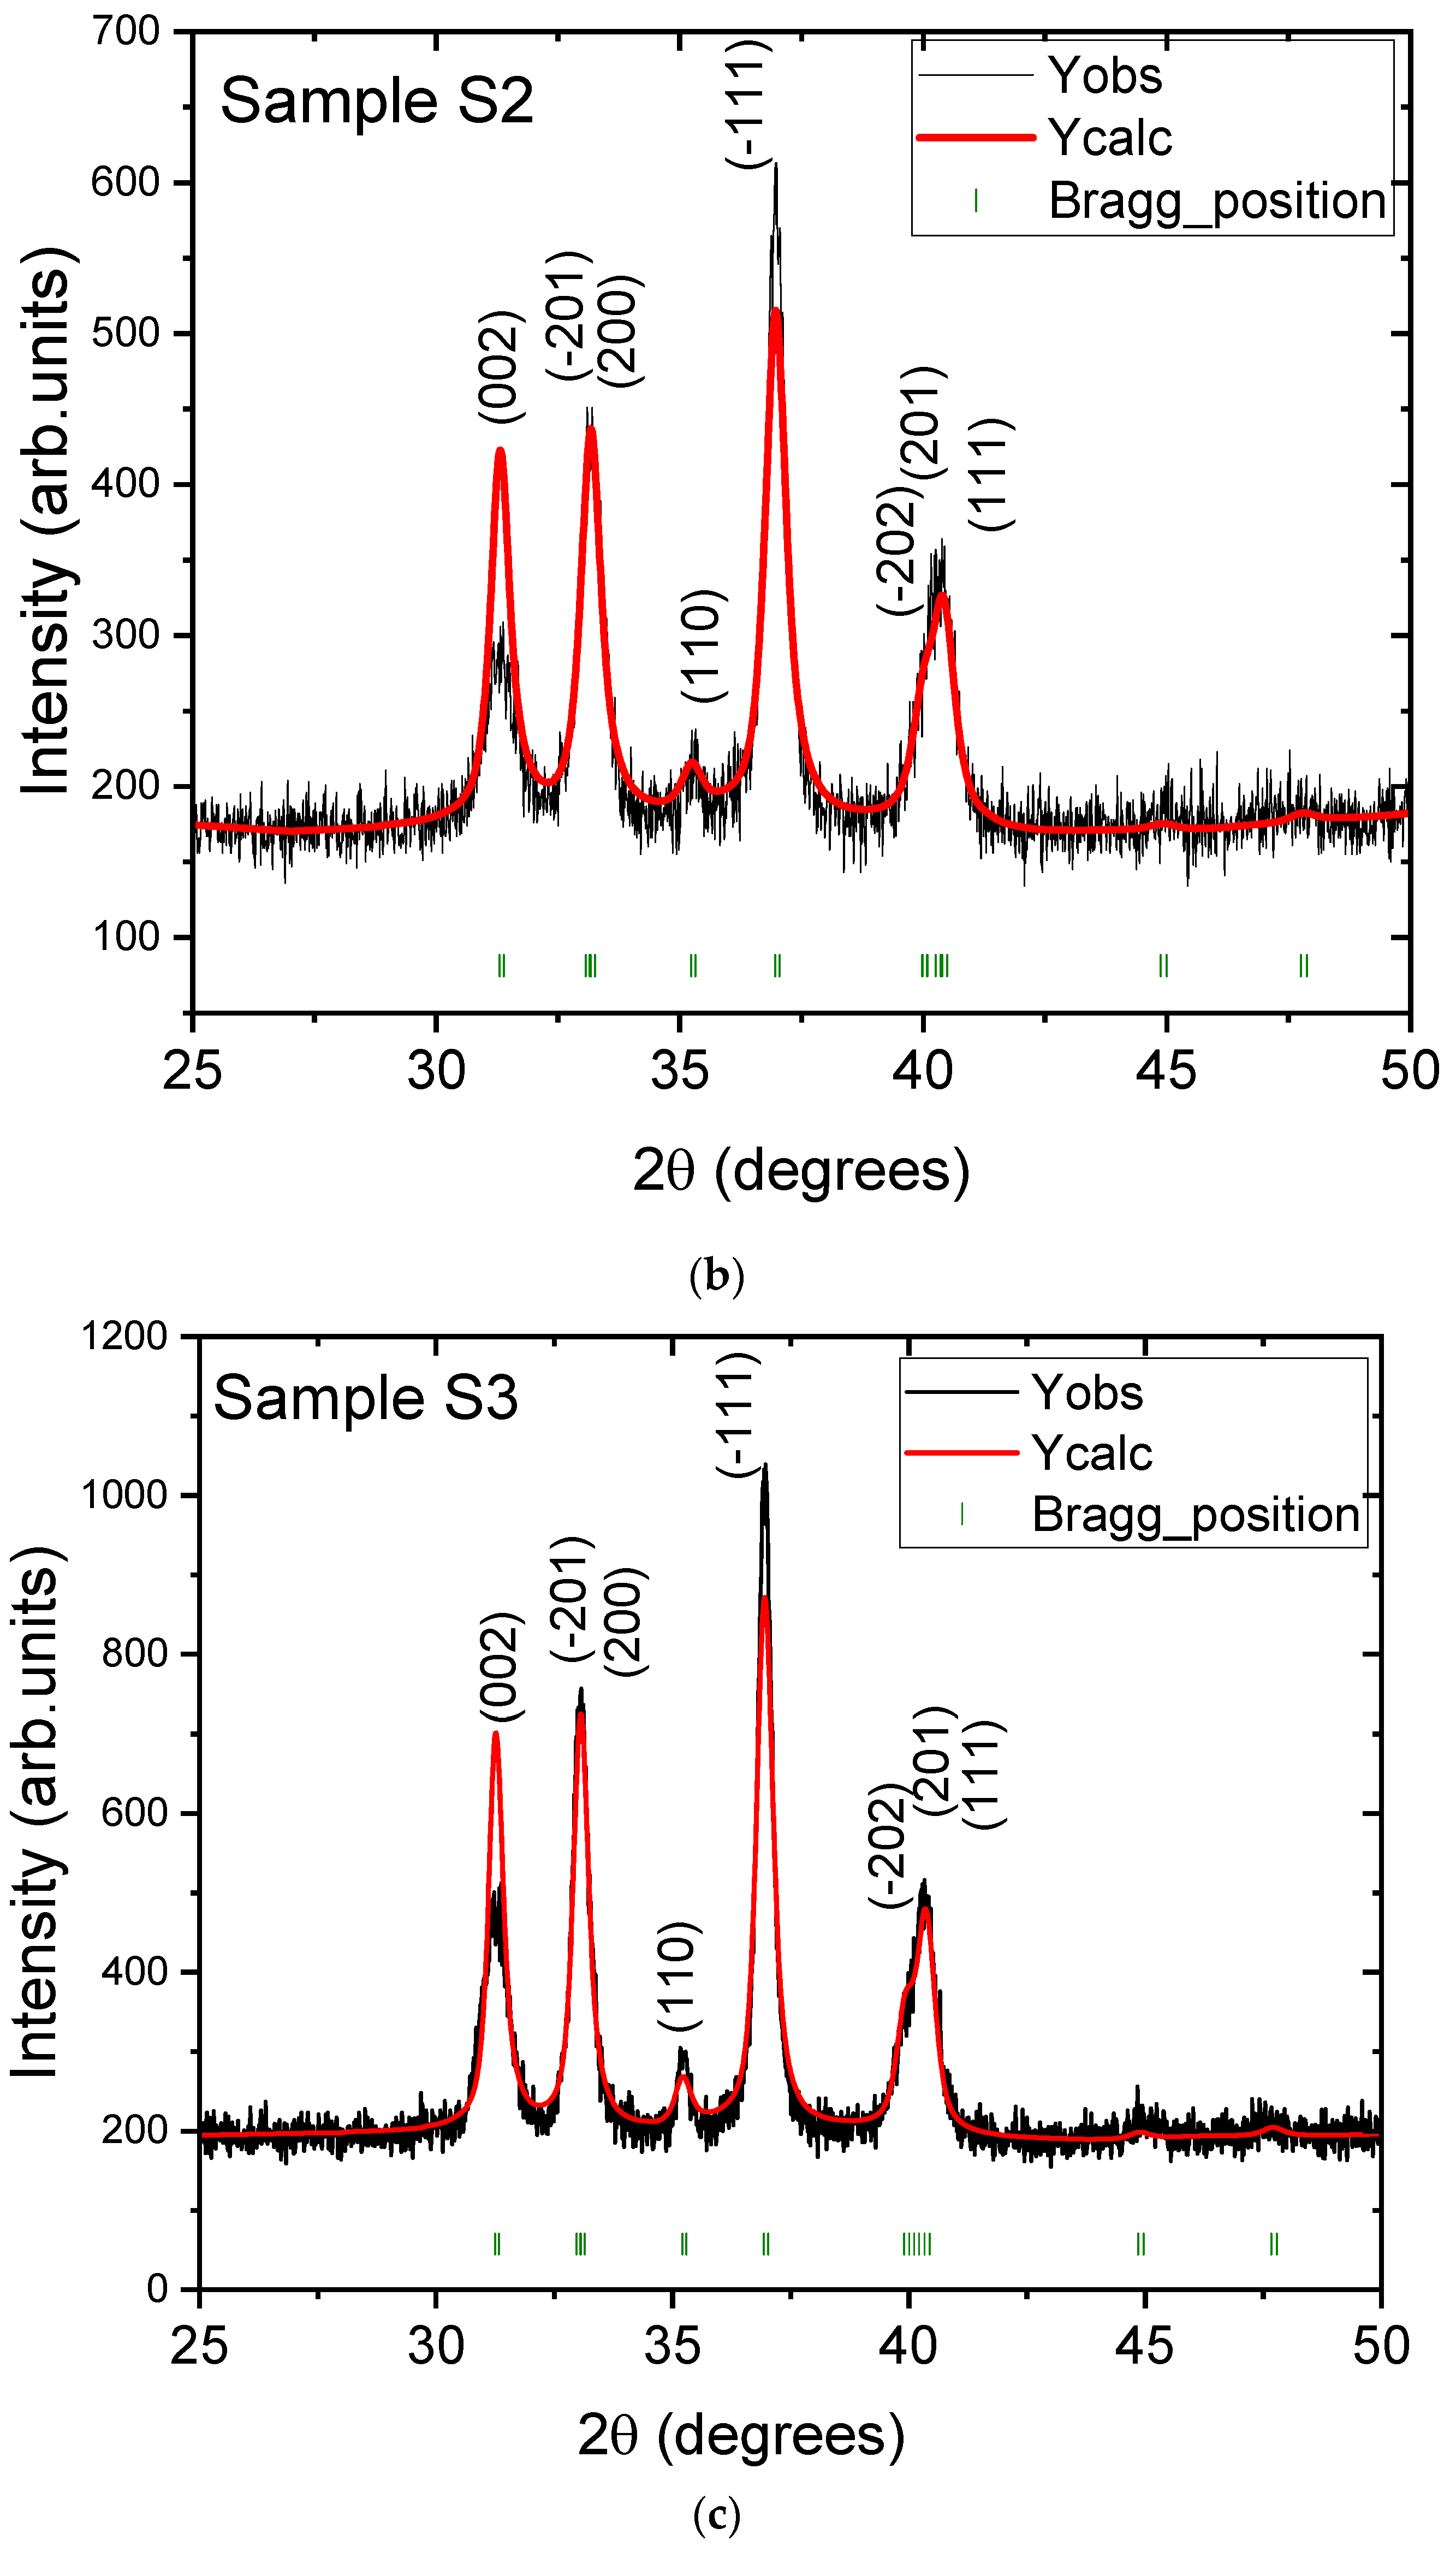
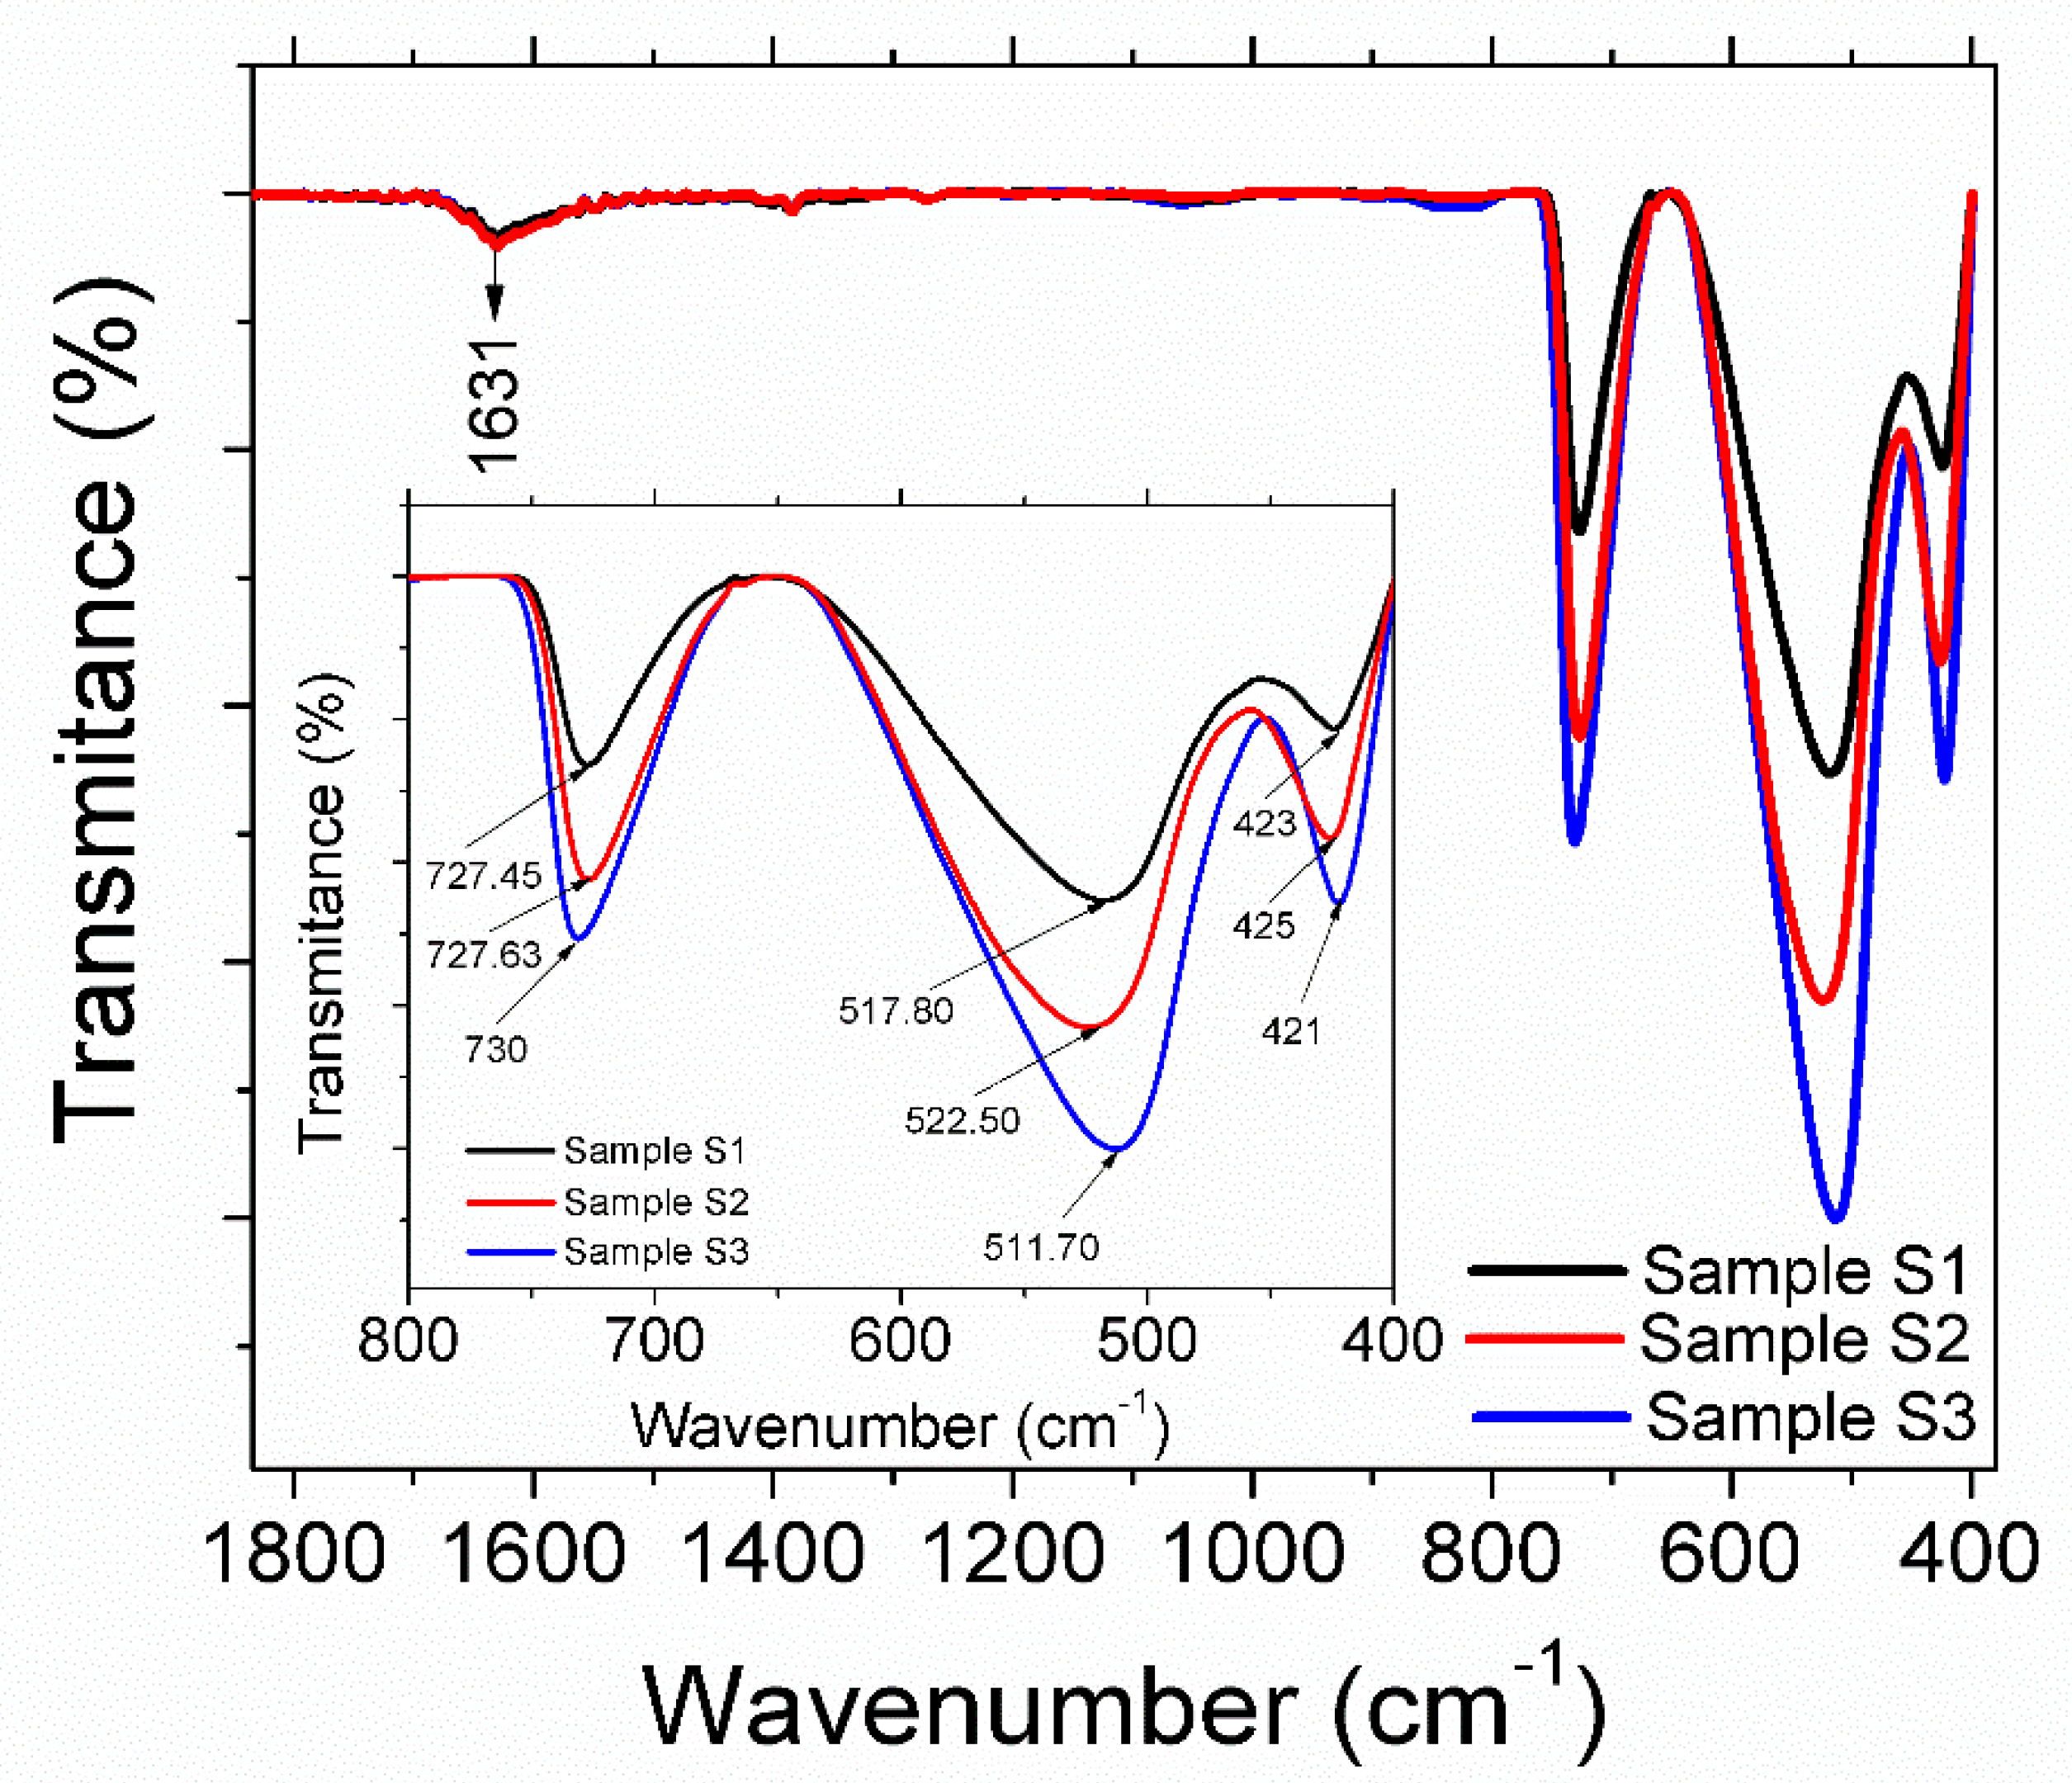
3.1. Structural and Morphological Analysis

As shown in Figure 1, the X-ray diffraction (XRD) pattern recorded for the three CuMnO2 crednerite samples indicates well-crystallized materials with no other secondary phases. XRD analysis indicated that all the materials crystallize within the crednerite type structure, in the C2/m space group (Figure 2a–c) and the unit cell parameters obtained from the Rietveld refinement (see Table 1) agree with those reported for CuMnO2 system [11,32].
As seen in Table 1, increasing the reaction temperature from 80 °C (sample S1) to 120 °C (sample S2) at equal reaction times (5 min), corresponds to a small increase in parameter a, an almost constant value of b and a small decrease in c, while β slightly decreases. Also, in the case of samples S2 and S3, prepared at the same synthesis temperature of 120 °C but with different reaction times (5 min for S2 and 1 h for S3), from Table 1, an almost constant value of parameters a and b and a small increase in parameter c, are observed, while β slightly increases. The unit cell parameters for the CuMnO2 crednerite samples obtained in other papers [20,33], are close to the lattice parameters for the three samples S1, S2 and S3 from this study (Table 1) which allows us to state that the MWH method used in this paper leads to the obtaining of stoichiometric CuMnO2 crednerite compounds [34,35]. Also, from Table 1, one can see that the samples present close values for the volume, maximum difference being −0.446Å between volume S3 and volume S1. At the same time, from Table 1 it is observed that the crystallite size of samples S2 and S3 is approximately the same (18.5 nm respectively 19.5 nm), the difference being probably due to the longer microwave application time for sample S3. Also, the crystallite size in the case of sample S1 is smaller than in the case of samples S2 and S3, which can be correlated with the lower synthesis temperature in the case of sample S1 (80 °C) than the synthesis temperature in the case of the other two samples (120 °C).
For the three samples of CuMnO2 crednerite, the FT-IR spectrum is shown in Figure 3. In the low-frequency region, the bands characteristic of MnO6 octahedral environment are observed [36,37,38], in accord also with the previous study [28] where the bands are at 728 cm−1, 521 cm−1 and 426 cm−1. The band of 1631 cm−1 is attributed to the CO2 absorbed on the surface of the materials. To go deeper in detail, the first band at ~728 cm−1 assigned to the stretching vibration modes of Mn-O-Mn and the band at ~420 cm−1 characteristic to the vibration mode of Mn-O are observed almost at the same wavelength for the three samples. The spectrum displays also a wide band whose maximum is slightly shifted for the three samples: located at 517.8 cm−1 for Sample 1, at 522.5 cm−1 for Sample 2 and 511.7 cm−1 for Sample 3. This difference can be determined by the local structural defects observed in the crednerite structure for the single crystals obtained by hydrothermal method [33] where vacancies in the Mn layer, stacking fault consisting in double Cu layers or twinning along the c-axis were evidenced.
Figure 4 shows images of the synthesized materials recorded by scanning electron microscopy (SEM) measurements. The samples were examined under comparable experimental conditions: working mode—high vacuum, acceleration voltage 15 kV, and magnification 5000×. As can be seen from the qualitative analysis, the synthesis parameters did not significantly affect the morphology of the obtained materials. Thus, strongly agglomerated particles, into asymmetric formations, can be observed.

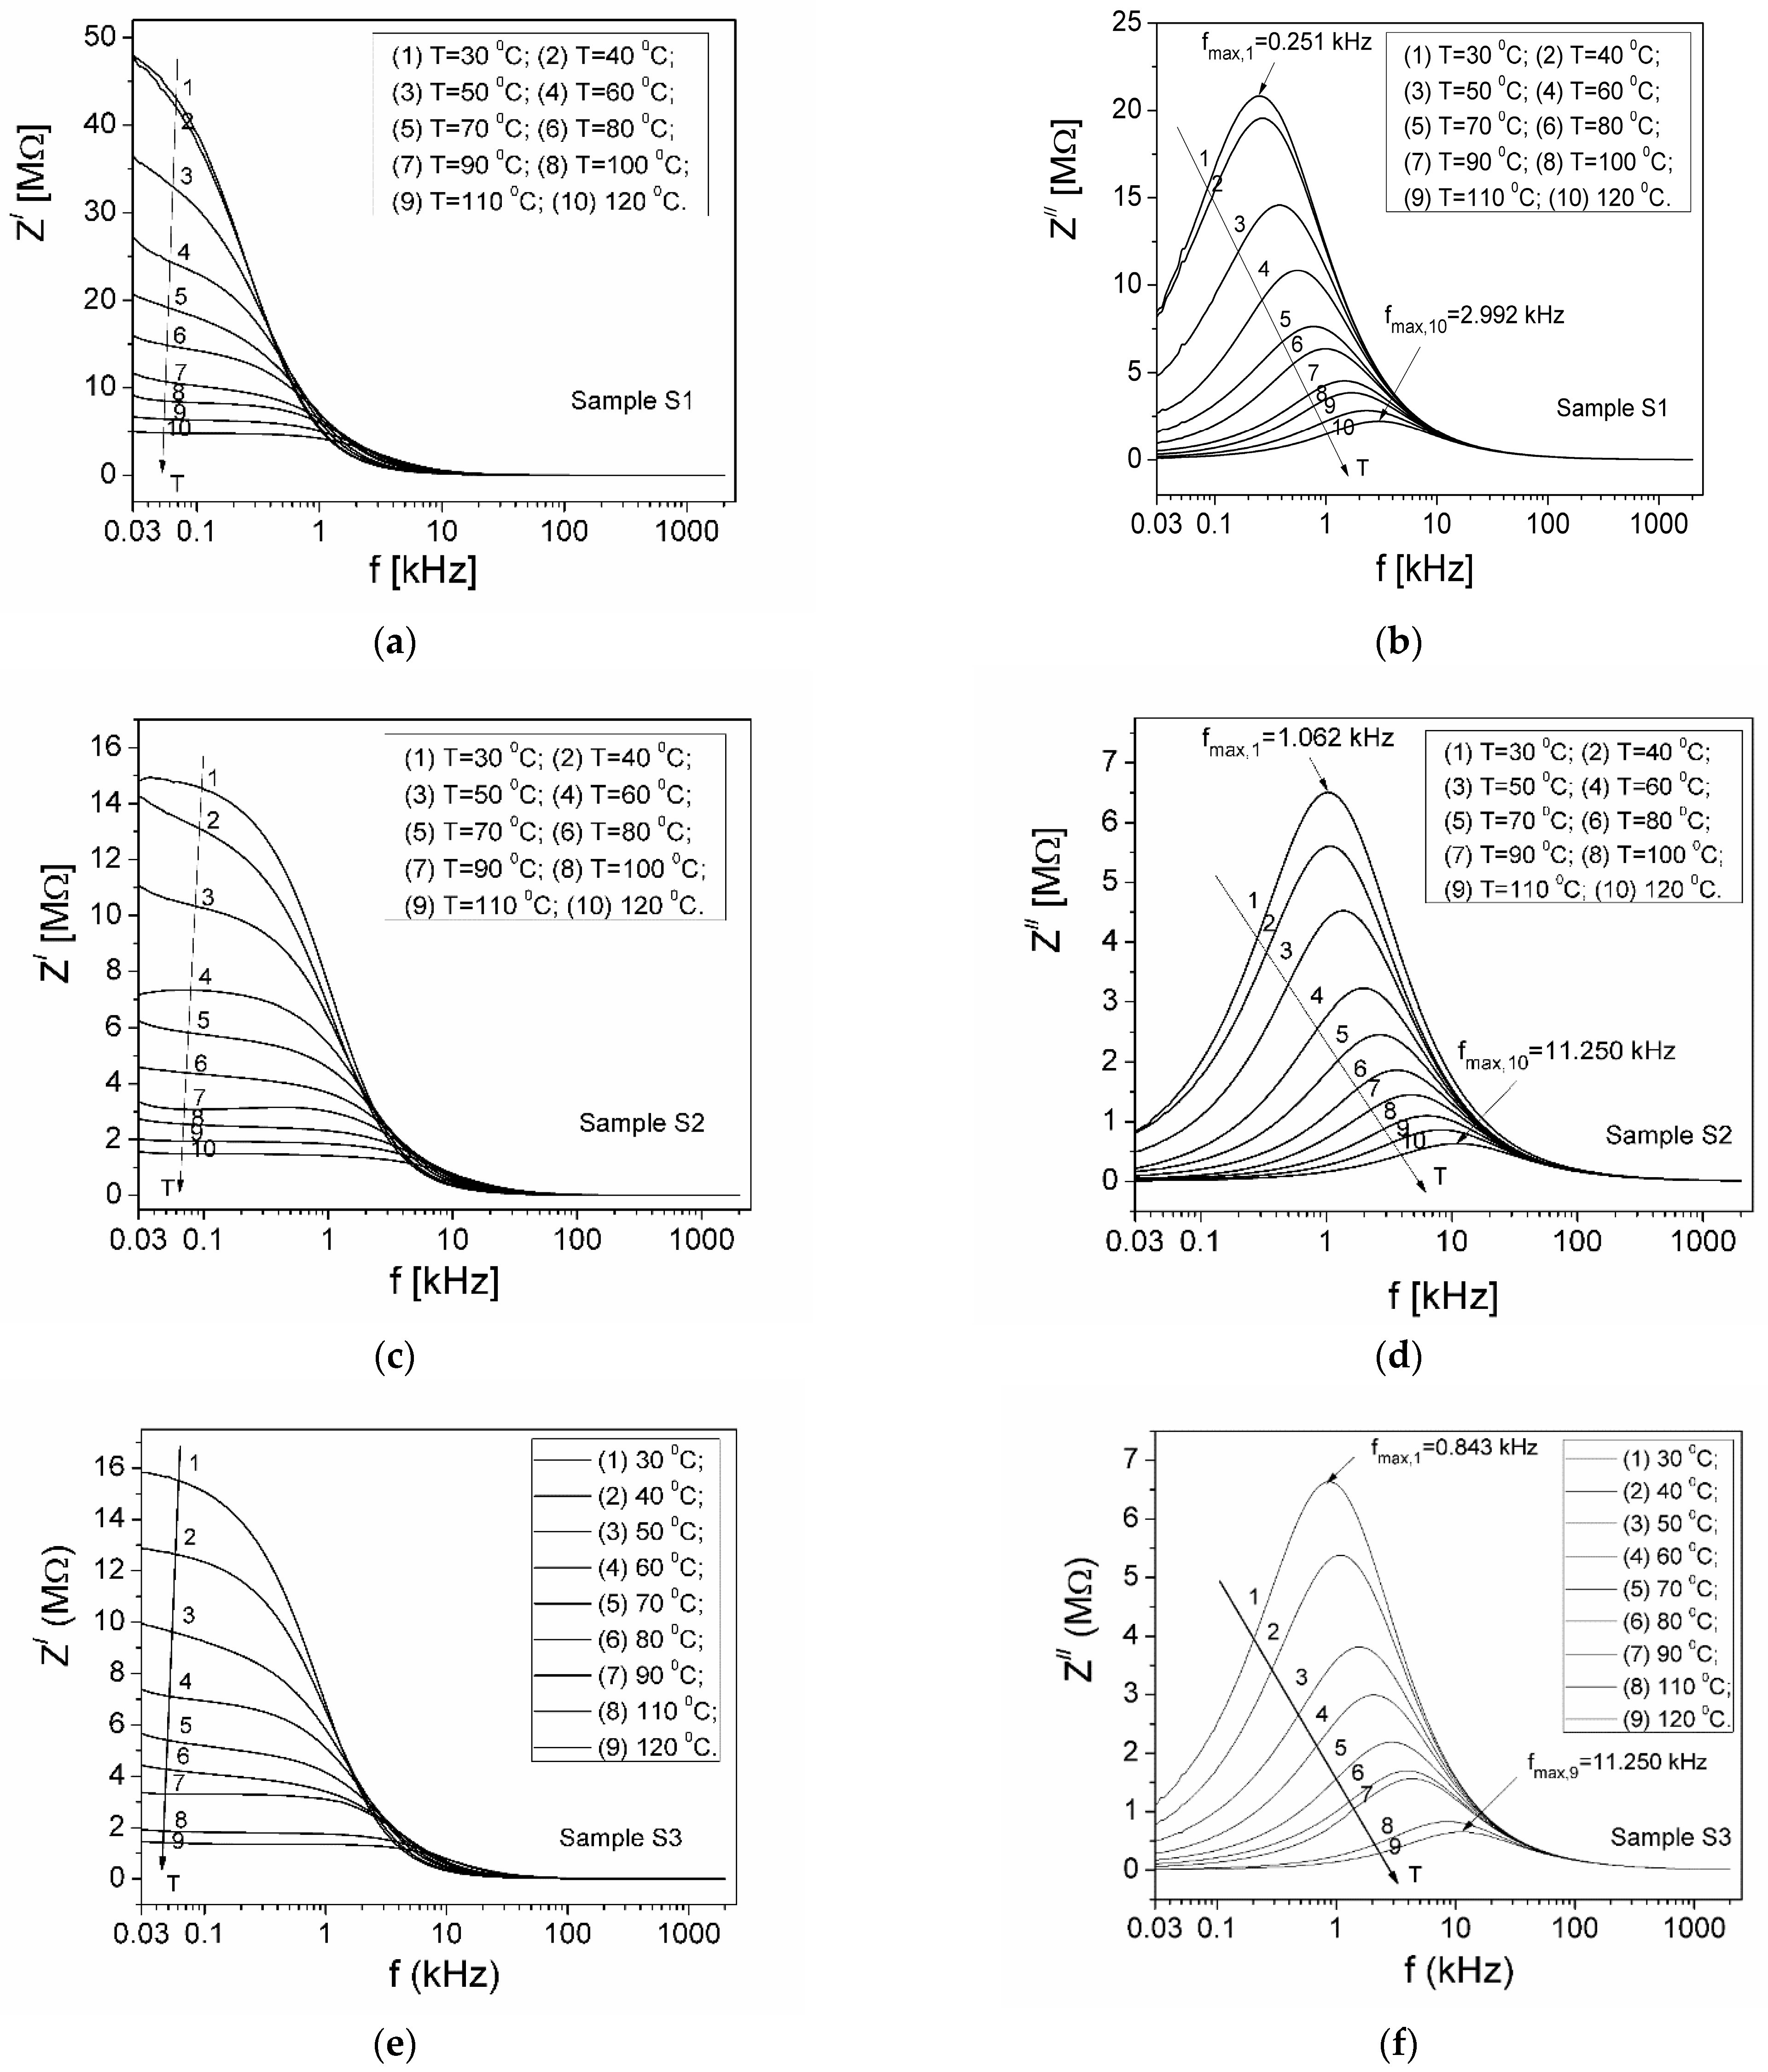
3.2. Complex Impedance

To study the electrical conduction mechanism in the low-frequency field of CuMnO2 crednerite-type materials, obtained by microwave-assisted hydrothermal synthesis, we determined the electrical conductivity of the samples based on complex impedance measurements. Figure 5a–f shows the frequency dependence of the real (Z′) and imaginary (Z″) components of the complex impedance of samples, in the frequency range (30 Hz–2 MHz) and at different temperatures, T, in the range (30–120) °C.
From Figure 5a,c,e, it is observed that Z′ gradually decreases with increasing frequency, and the curves practically overlap in the higher frequency region. The overlapping of the curves at high frequencies (above 10 kHz for our samples) is correlated to the fact that at these frequencies the displacement current is prevalent over the conduction current, a phenomenon also observed by other authors [35,39]. Also, from Figure 5a,c,e, one can see that the component Z′ decreases from approximately 48 MΩ to 5 MΩ (for sample S1), from 15 MΩ to 1.5 MΩ (for sample S2) and from 16 MΩ to 1.6 MΩ (for sample S3) with increasing temperature from 30 °C to 120 °C, which indicates an increase in the conductivity of the samples. In Figure 5b,d,f), the frequency dependence of the imaginary component Z″ of the complex impedance of the samples is shown, at different temperatures T. It is observed that Z″ presents a maximum ( Z m a x ) at a frequency fmax, for all samples, which shifts toward higher values when the temperature T increases. The presence of this maximum indicates the existence of an electrical relaxation process [40] due to the electrical conduction of charge carriers [41,42] in the investigated crednerite samples. Also, the amplitude of Z m a x decreases from approximately 21 MΩ to 2 MΩ (for sample S1), from 6.5 MΩ to 0.65 MΩ (for sample S2) and from 6.7 MΩ to 0.67 MΩ (for sample S3), and the peaks broaden with increasing temperature from 30 °C to 120 °C, suggesting that the electrical conduction and the electrical relaxation process are thermally activated.
Therefore, it should be noted that at a given frequency and temperature, Z′ and Z″ values of samples S2 and S3 are smaller than those for sample S1. This result can be correlated to the fact that the synthesis of samples S2 and S3 was carried out at the same temperature of 120 °C, but the synthesis of sample S1 was performed at 80 °C. Since in the case of samples S2 and S3 only the microwave synthesis time differed, we can say that it is sufficient for the microwave field application time to be at least 5 min to obtain samples whose impedance does not differ too much.
Knowing the fmax values at which Z″ shows a maximum (Figure 5b,d,f)), the relaxation time values (τ), corresponding to each temperature T of the investigated samples, can be determined from the Debye equation, 2πfmaxτ = 1 [43]. For the studied crednerite samples within the temperature range of 30 °C to 120 °C, the relaxation time τ is assumed to follow an Arrhenius-type relationship,
τ = τ 0 exp E A , r e l k T
where τ0 is a pre-exponential factor; k is the Boltzmann constant, and EA,rel denotes the thermal activation energy of the relaxation process of electrical conduction.
Figure 6 shows the dependence of ln(τ) on T−1 of the samples. From the linear fit of the experimental dependence, ln(τ)(T−1) from Figure 6, following the Arrhenius law (Equation (1)), the thermal activation energy of the relaxation process, EA,rel of the samples was determined, yielding the values: EA,rel(S1) = 0.313 eV, EA,rel(S2) = 0.295 eV and EA,rel(S3) = 0.297 eV. The results show that the thermal activation energies of the relaxation process, EA,rel(S2) and EA,rel(S3) for samples S2 and S3 have very similar values. This can also be correlated with the preparation method of these samples.

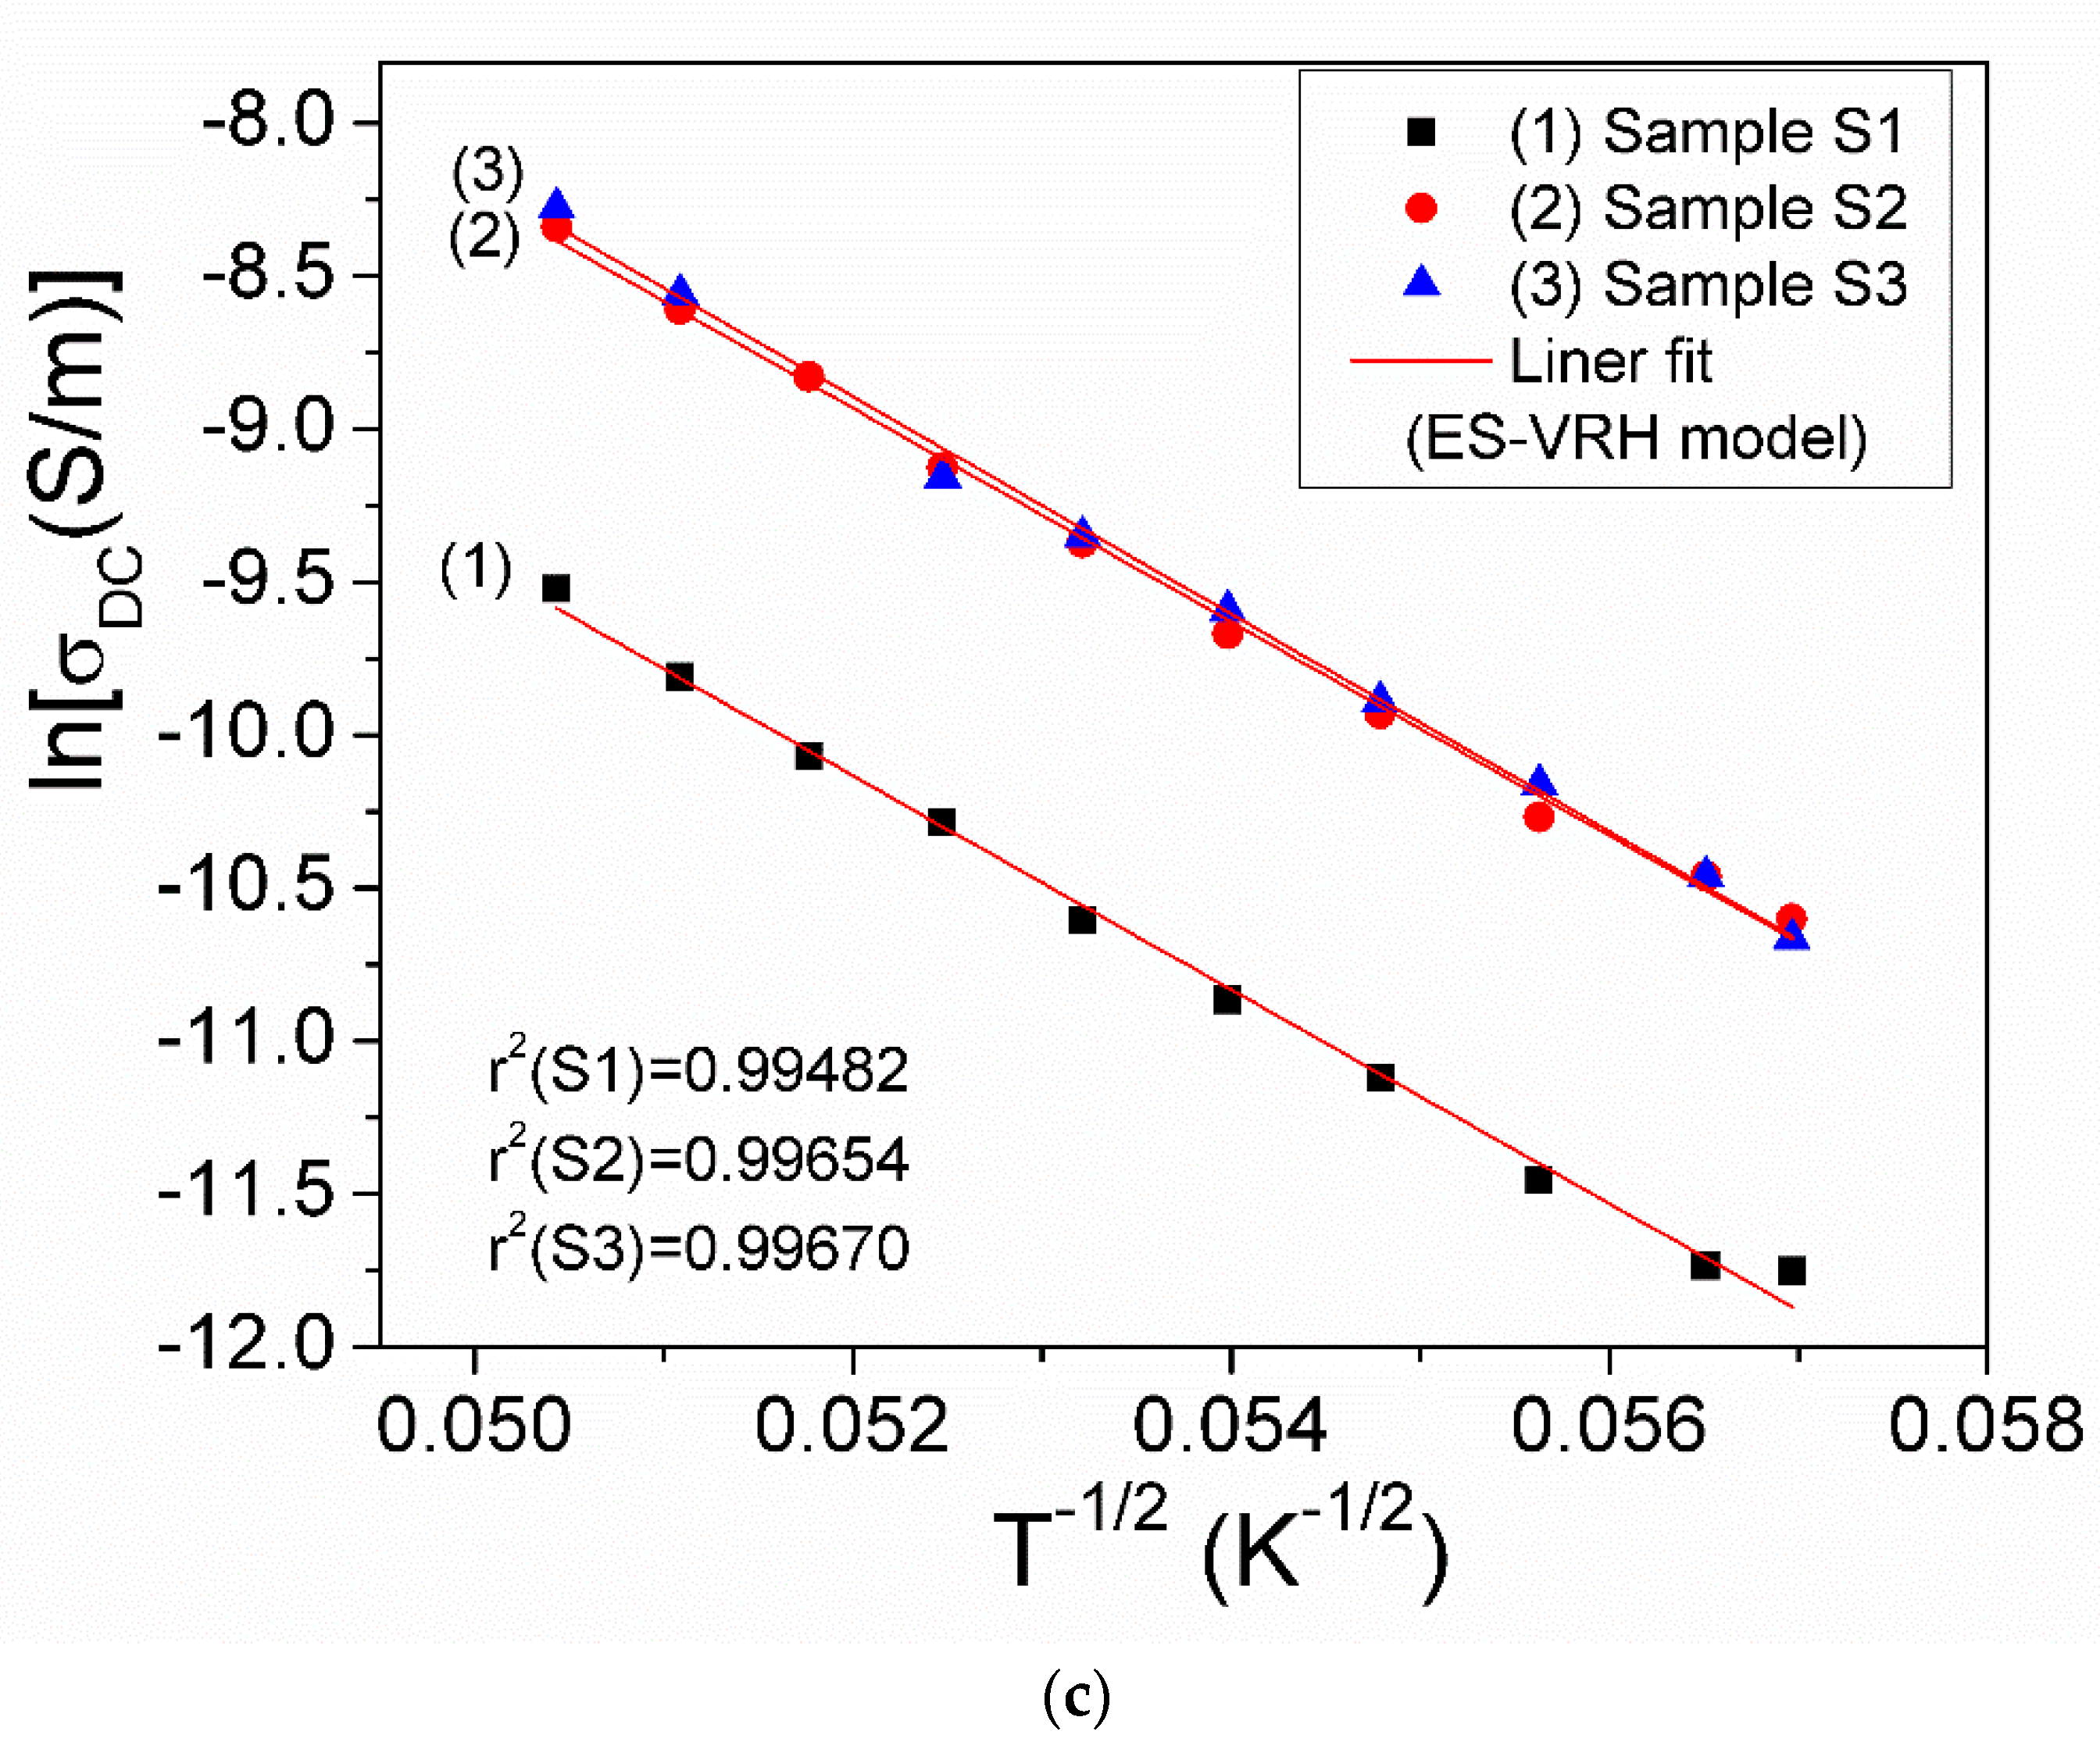
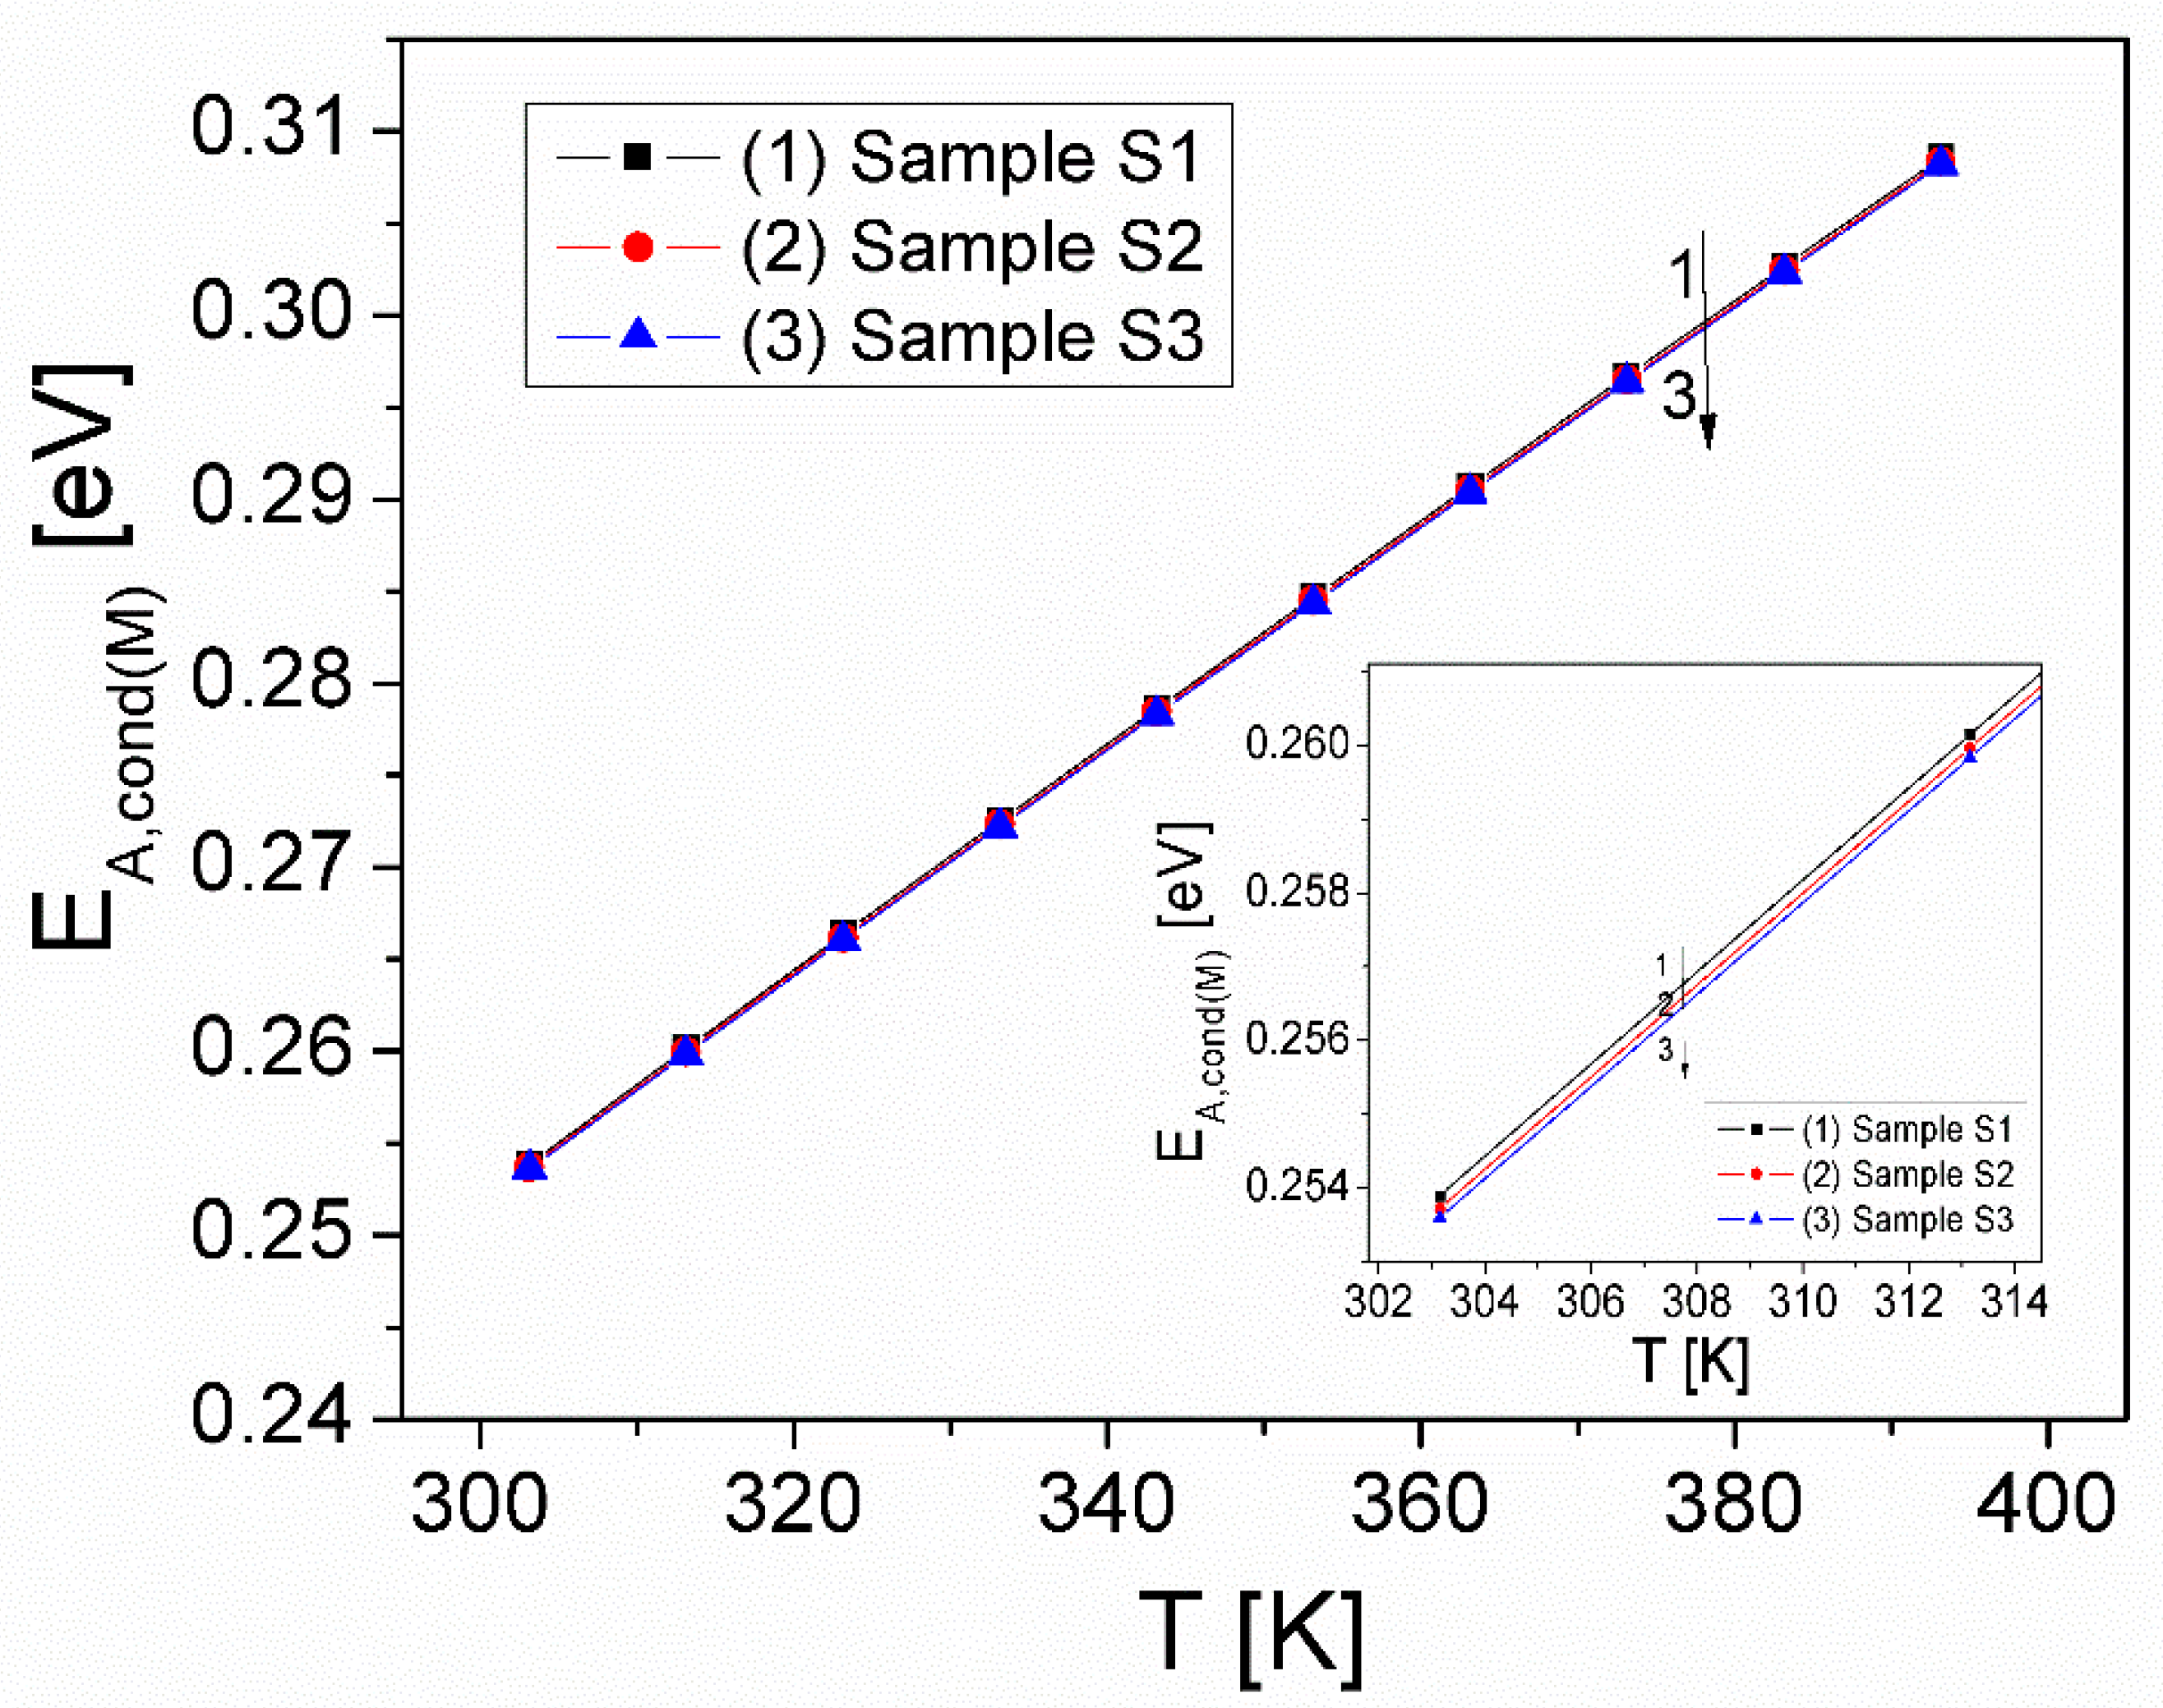
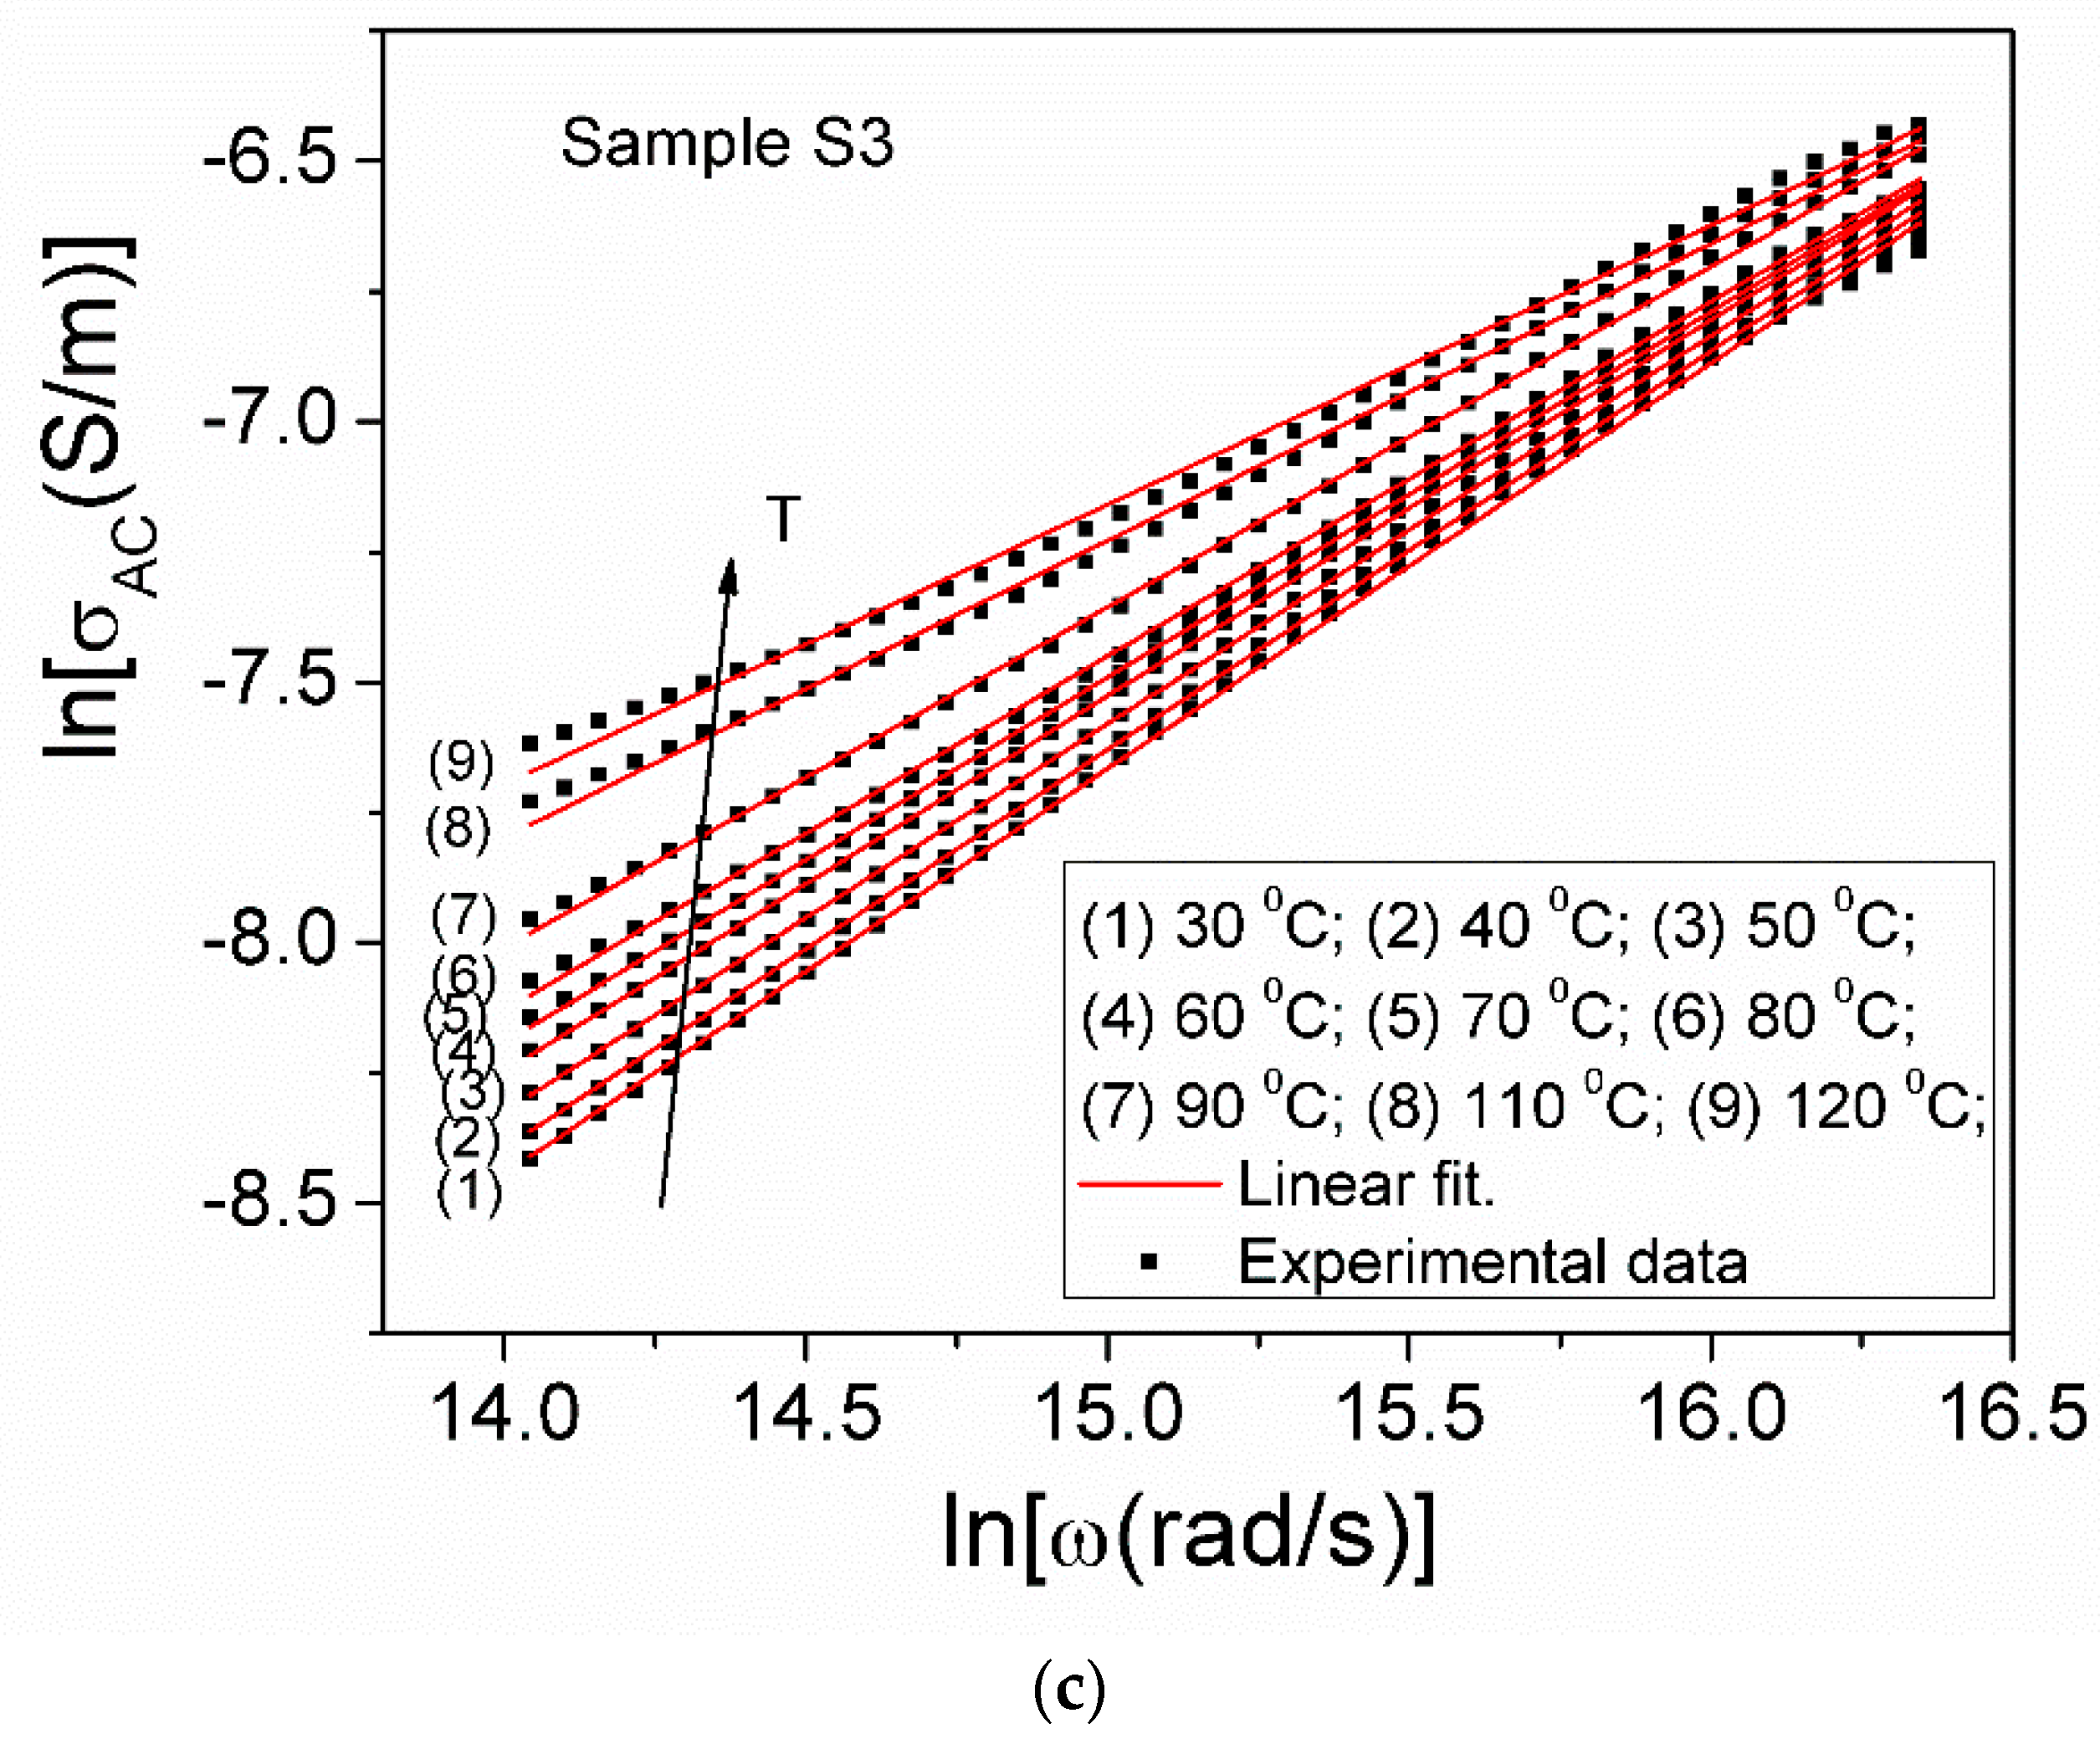
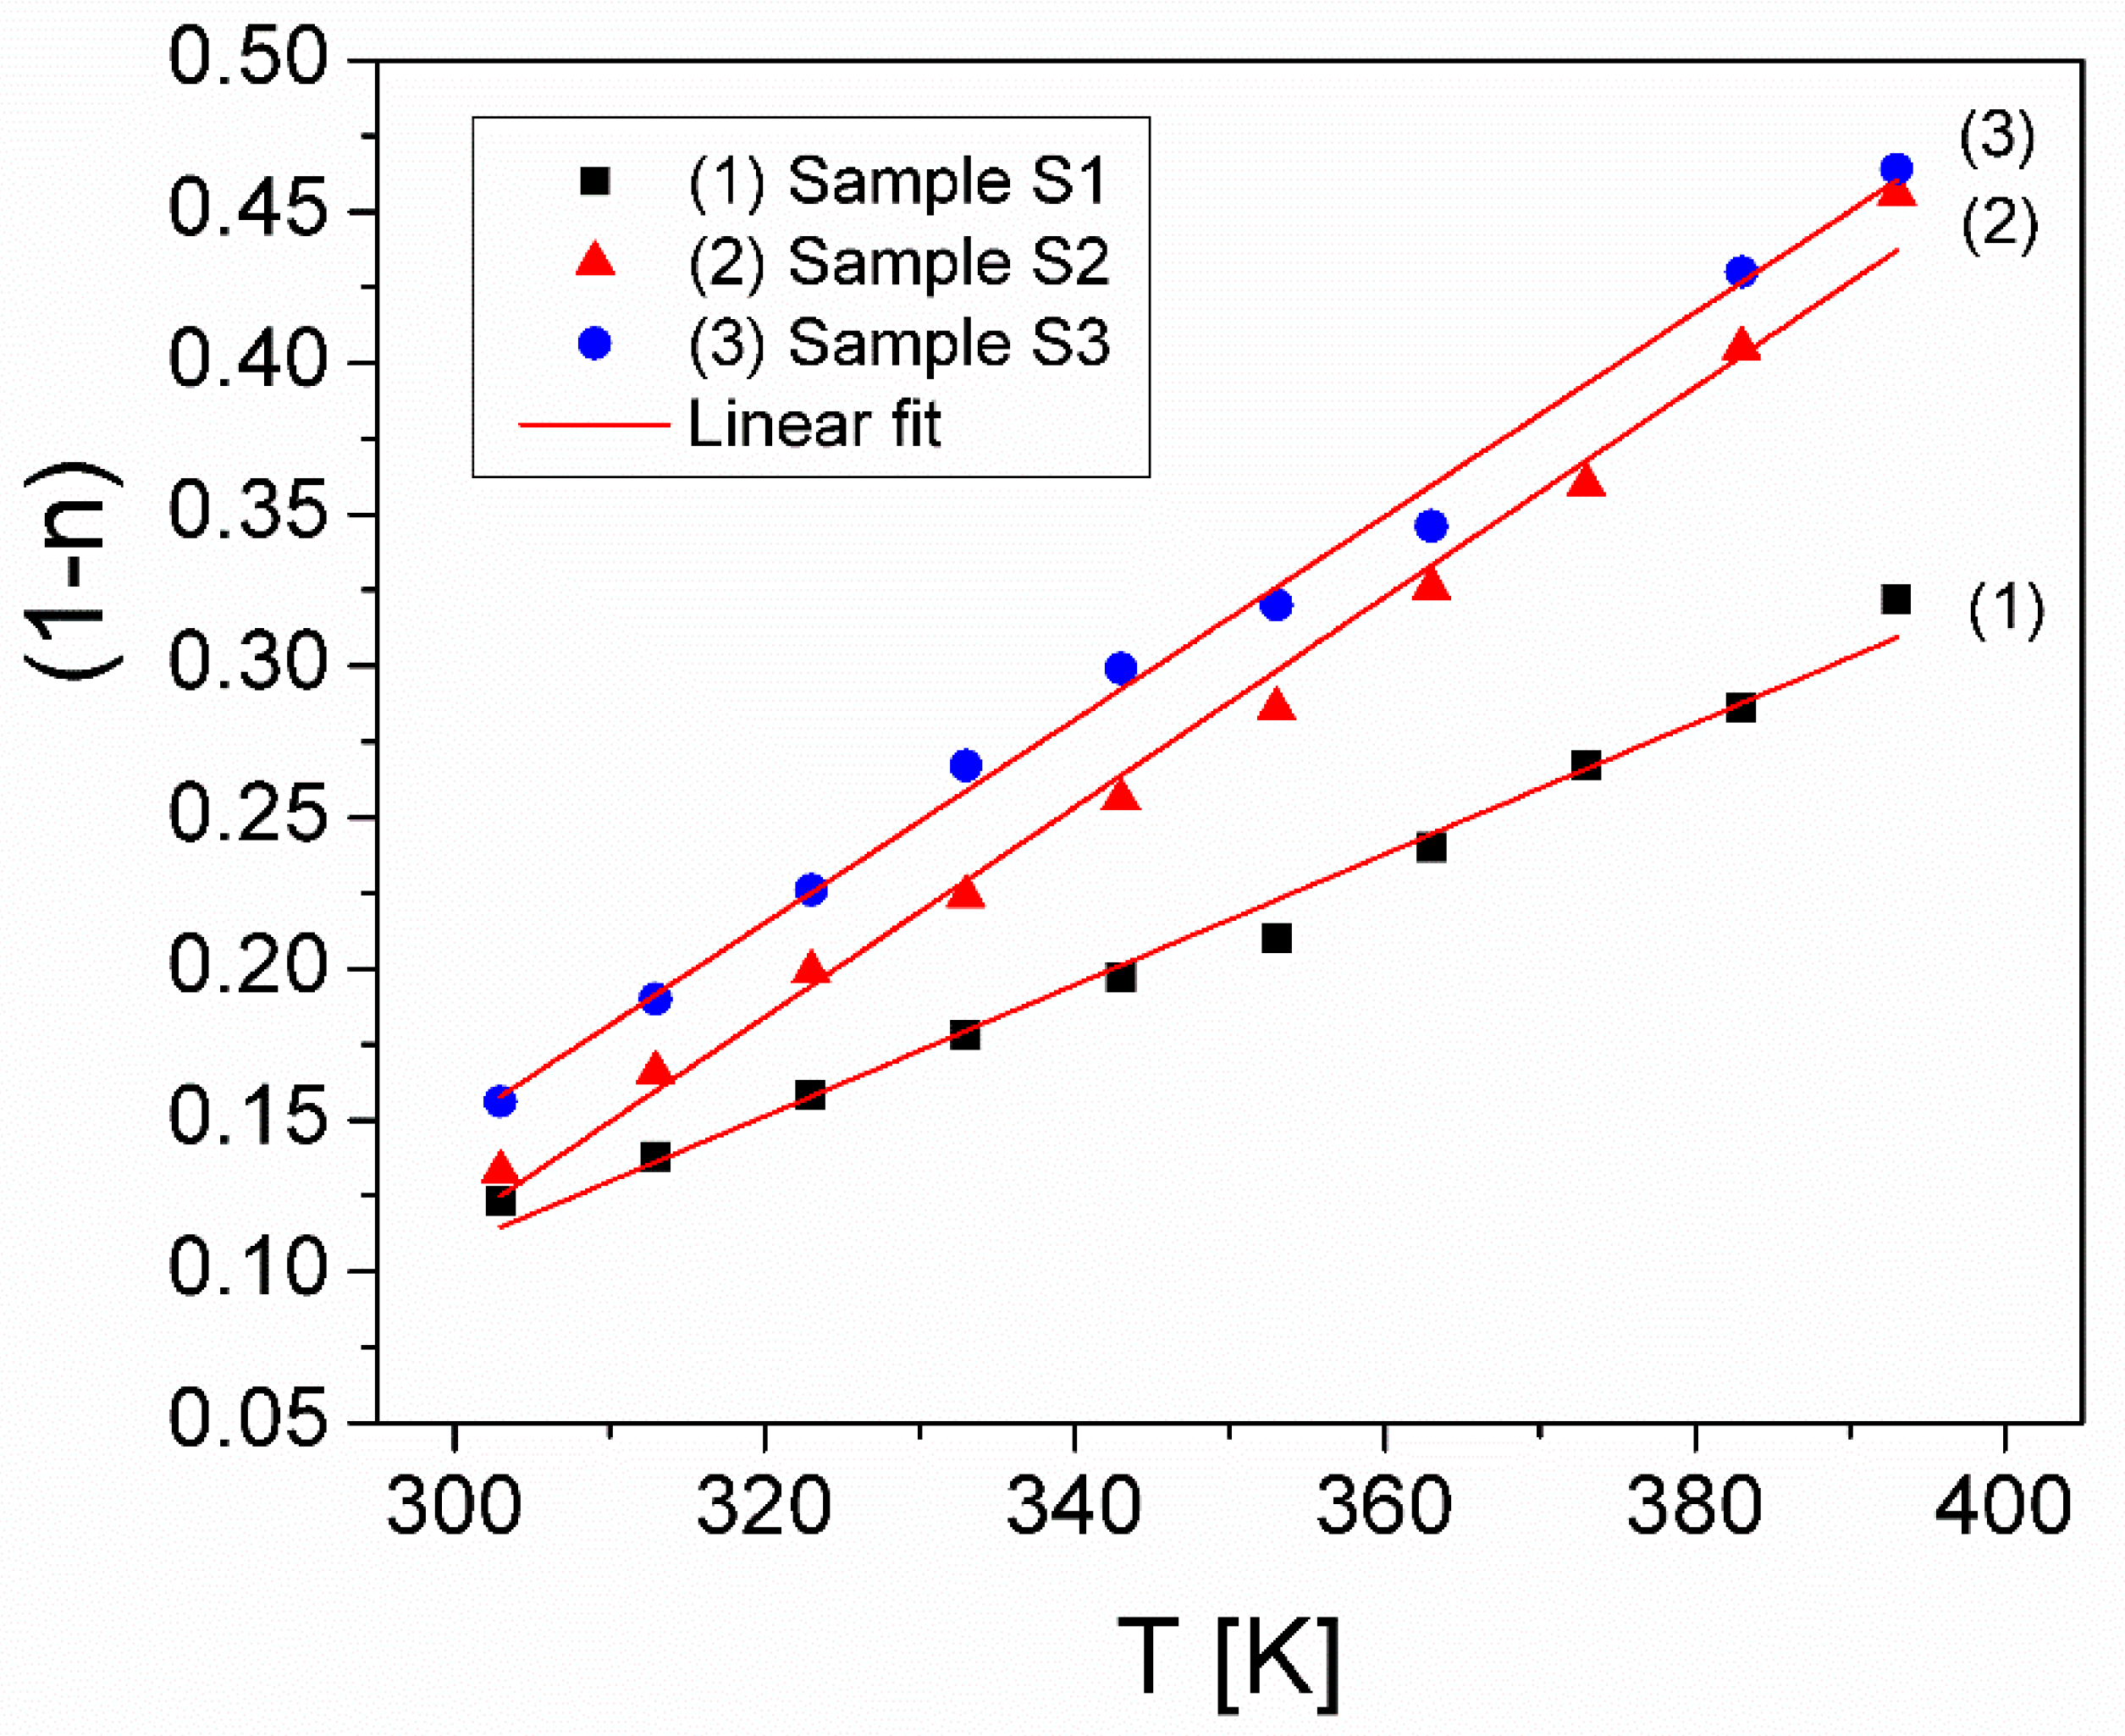
3.3. Electrical Conductivity

The electrical conductivity σ of the samples is determined based on the experimental values of Z′ and Z″ components of the complex impedance in Figure 5, with the relation:
Z = Z Z 2 d A
where Z = Z 2 + Z 2 , is the modulus of complex impedance of the sample; d = 4 mm is the length of the sample and A = 11.34 mm2 is its cross-sectional area. Results of the conductivity are presented in Figure 7, as a function of frequency, across the range of 30 Hz to 2 MHz and at various temperatures ranging from 30 °C to 120 °C.
Figure 7 shows, for all samples, that the frequency dependence of conductivity, σ(f), can be categorized into two regions. In the first, the low-frequency region, the conductivity exhibits a frequency-independent behaviour across all temperatures. In the second, high-frequency region, it is observed that the conductivity increases with frequency. This behaviour follows Jonscher’s power law [44]:
σ ( ω ) = σ D C + σ A C = σ D C + A 0 ω n
In Equation (3), σDC represents the static conductivity, whilst σAC denotes the dynamic conductivity of the sample. σAC is associated with dielectric relaxation processes governed by localized electric charge [45], and is expressed through the following relation:
σ A C ( ω ) = A 0 ω n
where ω is the angular frequency, n is a temperature-dependent exponent (0 < n < 1) representing the degree of interaction between mobile charge carriers with the lattices around them [42,45], and A0 is a pre-exponential factor which can be written in the form [44,46]:
A 0 = σ D C ω h n
where ωh represents the transition frequency from the DC to the AC regime called the hopping (crossover) frequency.
As Figure 7 shows, for each temperature T, the static conductivity σDC remains practically independent of frequency up to about 10 kHz for all investigated samples. The temperature dependence of the static conductivity, σDC(T), of the CuMnO2 crednerite samples is shown in Figure 8.
As can be seen from Figure 8, with the progress of temperature from 30 °C to 120 °C, the σDC conductivities of samples S2 and S3 increase from 0.24 × 10⁻⁴ S/m to 2.5 × 10⁻⁴ S/m, being approximately equal over the measurement range, while the σDC of sample S1 is lower and increases from 0.1 × 10⁻⁴ S/m to 0.6 × 10⁻⁴ S/m. The increase of the static conductivity, σDC, with temperature, indicates a semiconductor behaviour of the samples. Simultaneously, the variation of σDC(T) observed in Figure 8, indicates that the conduction process in the samples is thermally activated within the measured temperature range (30–120) °C, at low frequencies. This thermal activation results in an increase in the drift mobility of electrons, consequently leading to an increase in σDC [46]. We consider that this behaviour of the σDC conductivity of the S2 and S3 samples from Figure 8, could be due to the larger crystallite size and the increased surface-to-volume ratio of these samples compared to that of sample S1, as it resulted from XRD analysis. It can be said that there is a correlation between crystallite size and σDC conductivity; sample S1 with the smallest crystallite size has the lowest σDC conductivity. At the same time, considering only the surface/volume ratio of the samples, the surface defects of samples S2 and S3 (with larger crystallite sizes) will have a smaller proportion than the volume defects, which will determine a higher conductivity in these samples compared to sample S1 [24,47].
The explanation of electrical conduction in semiconductor-like samples typically involves three theoretical models. These models are: (i) the semiconduction (SC) model [25], described by the Arrhenius equation, (ii) the variable range hopping (VRH) model of Mott [26], and (iii) the Efros–Shklovskii (ES-VRH) model [27]. In the SC model, the conductivity is described by the equation:
σ D C ( T ) = σ 0 exp E A , c o n d k T
where EA,cond is the thermal activation energy of conductivity DC, which denotes the semiconducting barrier energy [25], and σ0 is the pre-exponential factor of conductivity, which depends on the number of charge hopping sites [25].
The VRH model of Mott [26] is described by the following equation for σDC conductivity:
σ D C ( T ) = σ 0 M exp T 0 M T 1 / 4
where σ0M is the Mott residual conductivity and T0M is the Mott characteristic temperature coefficient [48], which can be computed with the following relation:
T 0 M 1 / 4 = 4 E A , c o n d ( M ) k T 3 / 4
In this relation, EA,cond(M) is the thermal activation energy of conduction, by Mott’s VRH model. In the VRH model, Mott showed that the conduction mechanism is determined by the hopping of charge carriers between localized states, whose energies are concentrated in a narrow band near the Fermi level, EF.
The Efros–Shklovskii (ES-VRH) model [27] is characterized by the following temperature dependence of σDC conductivity:
σ D C ( T ) = σ 0 E S exp T 0 E S T 1 / 2
where σ0E-S is the ES-VRH residual conductivity and T0E-S is the ES-VRH characteristic temperature coefficient [27]. Unlike Mott’s VRH model, the ES-VRH model is a conduction model in which Efros and Shklovskii [27] consider the Coulomb gap, a small hopping in the density of states near the Fermi level due to the Coulomb interaction between the electrons from localized states [49].
Next, we aimed to determine the most appropriate theoretical model to explain the electrical conduction mechanism in CuMnO2 crednerite samples synthesized by the microwave-assisted hydrothermal method. For this, by taking the logarithm of Equations (6), (7) and (9), we represented graphically for the three investigated samples, the dependence (lnσDC)(1/T) (Figure 9a), the dependence (lnσDC)(1/T1/4) (Figure 9b) and the dependence (lDC)(1/T1/2) (Figure 9c) respectively, corresponding to the three theoretical models.
The experimental dependences in Figure 9a–c were fitted with a linear equation of the form y = A + Bx, thus determining the r2 coefficient, the intercept (A), and the slope (B); the values for the three samples are indicated in Table 2. Knowing the slope (B), the parameters corresponding to the respective theoretical model can be determined.
Table 2 shows that the highest value of the coefficient r2 was obtained when considering Mott’s VRH model, for all three crednerite samples. As a result, to explain the mechanism of electrical conduction in the samples, we will apply the VRH model. This model describes electrical transport as the hopping of charge carriers between occupied and unoccupied localized states. The associated electrical transport parameters, including the hopping distance, Rh, and hopping energy, Wh [26], are defined by the following equations:
R h = 9 8 a k T N ( E F ) 1 / 4
W h = 3 4 π R h 3 N ( E F )
In these equations, a ≈ 109 m−1 represents the degree of localization, and N(EF) is the density of localized states in the vicinity of the Fermi level, EF [48], being determined by the relation:
N ( E F ) = λ a k T 3 ( 4 E A , c o n d ( M ) ) 4
where λ ≈ 16.6 is a dimensionless constant [26].
From relations (10)–(12), it is observed that the parameters of the Mott VRH model can be determined if the value of the conduction activation energy corresponding to the VRH model, EA,cond(M) is known, at the investigated temperatures T. For this, using the T0M values obtained from fitting the experimental dependence ln(σDC)(1/T1/4) corresponding to the VRH model (Figure 9b)), indicated in Table 2, from Equation (8) we determined the temperature dependence of the conduction activation energy corresponding to the Mott model, EA,cond(M)(T), for the three samples, shown in Figure 10.
From Figure 10, EA,cond(M) of all samples increases linearly with increasing temperature, in agreement with the VRH model of Mott, meaning that the electrical conduction in these samples can be explained by the hopping process of charge carriers between the localized states [26]. Also, Figure 10 shows that the EA,cond(M) values for the three samples increase approximately between the same limits, from 0.254 eV to 0.310 eV when the temperature progresses from 30 °C to 120 °C. This result connects well with that related to the thermal activation energies of the relaxation process, EA,rel of the investigated samples (see Figure 6). Also, the results presented in Figure 10 illustrate that the conduction activation energy corresponding to the VRH model, of samples S2 and S3 is lower than that associated with sample S1, and correlates with the σDC values obtained for these samples (see Figure 8).
Using the computed values of the conduction activation energy EA,cond(M) (see Figure 10), corresponding to the VRH model, the density of the localized states near the Fermi level N(EF), of the three CuMnO2 samples, was determined for the first time, with the Equation (10). The obtained values for N(EF), are: N(EF)S1 = 2.78892 × 10¹⁷ eV−1·cm−3, N(EF)S2 = 2.79665 × 10¹⁷ eV−1·cm−3, and N(EF)S3 = 2.80228 × 10¹⁷ eV−1·cm−3, being constant with temperature for the three samples. The slight increase in N(EF) of the samples is attributed to the growth of the hopping distance, Rh, between the localized states of the charge carriers, as shown below. Knowing the N(EF) values, with relations (10) and (11), the hopping distance Rh and the hopping energy Wh of the CuMnO2 crednerite samples were determined for the first time. The obtained values of these parameters at six temperatures, for the three samples, are shown in Table 3.
As shown in Table 3, the hopping distance Rh decreases and the hopping energy Wh increases with increasing temperature for all three samples, which shows that the electrical conduction processes in the samples are thermally activated. It should be noted that at all temperatures T, the values of Rh and Wh are approximately equal for samples S2 and S3, but slightly lower than Rh and Wh of sample S1, in accordance with the obtained values of the density of the localized states near the Fermi level N(EF), of samples.
As shown by Mott and Davis [26,48], the behaviour of the samples according to the VRH model can be validated if two conditions are met. The first condition refers to the fact that the energy Wh of the samples must be much higher than the thermal energy kT, and the second condition is that the product aRh >> 1 [48,50]. From Table 3, one can see that the first condition is met, for all three samples, the values of the thermal energy kT being much lower than the hopping energy, Wh, of the samples. Since a ≈ 109 m−1, and the values of Rh of the samples are of the order of 10−9 m (see Table 3), it follows that the parameter aRh respects the condition aRh >> 1. As a result, the data obtained for the Mott parameters (see Table 3) prove the consistency of the Mott criteria and therefore the validity of using the VRH model in explaining the conduction mechanism in the investigated crednerite samples, CuMnO2.
It is known that in the hopping transport of charge carriers [26], the charge carrier’s mobility μ can be determined using the following relation:
μ = σ D C e N C
where NC is the number density of effective charge carriers. Considering that N(EF) and NC are connected by the relationship, NC = kT N(EF) [26,51], from Equation (13), results:
μ = σ D C e k T N ( E F )
Knowing the conductivity σDC of the samples (Figure 8), the thermal energy values kT (Table 3), as well as the values of the density of the localized states near the Fermi level N(EF), using Equation (14), the charge carrier’s mobility μ was determined. In Figure 11, the temperature dependence of the charge carrier mobility, μ(T), of the three samples is shown.
From Figure 11, an increase in μ is observed as the temperature increases from 30 °C to 120 °C, for all three samples. At the same time, the mobility μ of samples S2 and S3 is approximately the same at all temperatures but is higher than the mobility μ of sample S1. This behaviour could be due to the larger crystallite size and smaller surface/volume ratio of samples S2 and S3 compared to those of sample S1, as obtained from XRD analysis. As a result, there is a correlation between crystallite size and charge carrier mobility; sample S1 with the smallest crystallite size has the lowest μ mobility. On the other hand, considering only the surface/volume ratio of the samples, the surface defects of samples S2 and S3 (with larger crystallite sizes) will have a smaller proportion than the volume defects, which will determine a higher mobility of charge carriers in these samples compared to sample S1 (see Figure 11).
In the high-frequency region, as can be seen in Figure 9, the dynamic conductivity, σAC, increases rapidly with frequency following the Jonscher universal law, given by Equation (4). Logarithmizing Equation (4) shows a linear dependence between lnσAC and lnω for each temperature, graphically represented in Figure 12, for the investigated samples.
By fitting the experimental dependence ln(σAC)(ln(ω)), from Figure 12, with a straight line of the form y = A + Bx, the intercept (A) = lnA0 and the slope (B) = n, corresponding to each temperature T of samples, were determined. The obtained values are shown in Table 4. Knowing the values of A0 and n (Table 4), as well as the σDC conductivity (Figure 8), from Equation (5), the hopping frequency, ωh, corresponding to each temperature T of CuMnO2 samples was determined; the obtained values ωh, are listed in Table 4.
Taking into account the ωh values in Table 4, the transition frequency, fh = ωh/2π, can be computed for all samples, which increases from the value of 2.75 kHz to 25.6 kHz (sample S1), from 8.76 kHz to 52.2 kHz (sample S2) and respectively from 4.62 kHz to 65 kHz (sample S3), by the temperature increase, from 30 °C to 120 °C. As a result, the transition from the DC regime to the AC regime of conductivity for the three CuMnO2 samples is made at increasingly higher frequencies with increasing temperature T (see Figure 9). Also, from Table 4 one can see a decrease of the exponent n by increasing temperature for all samples, this behaviour being due to the increase in interactions between neighbouring charge carriers [52]. At the same time, the values of exponent n corresponding to samples S2 and S3 are lower than the n values of sample S1. This behaviour of samples S2 and S3 can be correlated with the increase in the size of the crystallites in these samples (18.5 nm and 19.5 nm) compared to the size of the crystallites of sample S1 (13.8 nm), as determined from XRD analysis. At the same time, the relatively high value obtained for the exponent n (n > 0.5) of the samples investigated (see Table 3) indicates a single hop of the charge carriers between the nearest neighbouring states [53]. The correlation of the conduction mechanism of the σAC conductivity with n(T) behaviour can be achieved using several theoretical models [51,54,55]. The decrease of n with temperature in the case of the three CuMnO2 samples (see Table 4) corresponds to the correlated barrier hopping (CBH) model, proposed by Pike [56]. In the first approximation, according to the CBH model, the exponent n is given by the relation:
n = 1 6 k T W m
where Wm represents the maximum barrier height (equal to the electrical bandgap energy) [57].
Figure 13 shows the temperature dependence of the deviation (1-n) from the unity of the exponent n, which results from Equation (15).
From the linear fitting of the experimental dependence (1-n)(T) (shown in Figure 13), the electrical bandgap energy Wm of the crednerite samples was determined for the first time, resulting in the following values: Wm (S1) = 0.239 eV, Wm (S2) = 0.150 eV and Wm (S3) = 0.154 eV. As a result, the same hydrothermal sintering temperature of samples S2 and S3 (120 °C) higher than that of sample S1 (80 °C) and different microwave application times (5 min and one hour, respectively), leads to a decrease in the bandgap energy, Wm of samples S2 and S3, respectively, compared to Wm of sample S1, these values being correlated with the increase in the static conductivity (σDC) values of samples S2 and S3, with respect to S1.
The experimental data analyzed based on three theoretical models showed that the most suitable theoretical model to explain the electrical conduction mechanism of charge carriers in CuMnO2 crednerite samples prepared by a new microwave-assisted hydrothermal method is the VRH model of Mott. The study significantly contributes to the clear understanding of the electrical conduction mechanism by the hopping of charge carriers between the localized states, being useful in applications involving the photoelectrochemical processes or charge carrier transport phenomena.

4. Conclusions

The polycrystalline CuMnO2 crednerite materials have been prepared by microwave-assisted hydrothermal synthesis (MWH), and their structural and morphological properties were characterized by XRD and SEM analysis. The samples were obtained at two synthesis temperatures and different reaction times t of the microwave application: 80 °C, t = 5 min (sample S1); 120 °C, t = 5 min (sample S2), and 120 °C, t = 1 h (sample S3), respectively.
From the measurements of complex impedance, across the frequency range from 30 Hz to 2 MHz and at various temperatures ranging from 30 °C to 120 °C, the electrical conductivity σ of the crednerite samples was determined. The conductivity spectrum of the samples presents two regions corresponding to the σDC conductivity (at low frequency) and σAC conductivity (at high frequency), following the Jonscher universal law. The σDC values of samples S2 and S3 are approximately equal but larger than the σDC of sample S1. The results show that the MWH synthesis controlled by thermal treatment is an original method for obtaining CuMnO2-type crednerite samples with similar electrical properties.
The experimental data of electrical conductivity of samples were analysed based on three theoretical models, and it was demonstrated that Mott’s VRH model is the most suitable for explaining the electrical conduction mechanism in the investigated crednerite samples. Based on this model, the values of the Mott conduction activation energy EA,cond(M) were determined for the three samples, which increase between the same limits, from 0.254 eV to 0.310 eV, when the temperature increases from 30 °C to 120 °C. Also, the density of localized states in the vicinity of Fermi level, N(EF), the hopping distance, Rh(T), the hopping energy, Wh(T) and the charge carrier’s mobility (μ), were determined for the first time for the CuMnO2 crednerite samples obtained by MWH synthesis. The higher mobility of charge carriers in samples S2 and S3 compared to the mobility of sample S1, was correlated with the larger crystallite size of samples S2 and S3, compared to that of sample S1, as obtained from XRD analysis.
The experimental results allowed the determination, for the first time, of the electrical band gap energy, Wm for the three samples: Wm(S1) = 0.239 eV, Wm(S2) = 0.150 eV and Wm(S3) = 0.154 eV, the results agreeing with the increase of the static conductivity (σDC) values of samples S2 and S3, in relation to S1.
The findings presented in this study enable a comprehensive understanding of the electrical conduction mechanisms in CuMnO2 crednerite samples synthesized via a microwave-assisted hydrothermal method. These results have significant implications not only for elucidating transport phenomena involving charge carrier hopping between localized states in such systems but also for advancing applications in photo-electrochemical and photocatalytic processes, as well as in photovoltaic devices.

Author Contributions

Conceptualization, I.M., C.N.M. and M.P.; methodology, I.M. and C.N.M.; software, A.L., P.S. and C.C.; validation, M.P., P.S. and C.N.M.; formal analysis, C.N.M., A.L. and C.C.; investigation, A.L., M.P., C.C. and P.S.; writing—original draft preparation, I.M.; writing—review and editing, I.M., C.N.M. and M.P.; supervision, C.N.M. and I.M. All authors have read and agreed to the published version of the manuscript.

Funding

This research received no external funding.

Data Availability Statement

The data presented in this study are available upon request from the corresponding author.

Acknowledgments

The author MP is thankful for the financial support they received from the project Start Grant from West University of Timisoara.

Conflicts of Interest

The authors declare no conflicts of interest.

References

  1. Zhang, J.X.; Zhao, Z.Y. A comprehensive review on the preparation and applications of delafossite CuAlO2 optoelectronic functional materials. Mat. Sci. Semicond. Proces. 2023, 167, 107819. [Google Scholar] [CrossRef]
  2. Moreira, M.; Afonso, J.; Crepelliere, J.; Lenoble, D.; Lunca-Popa, P. A review on the p-type transparent Cu–Cr–O delafossite materials. J. Mater. Sci. 2022, 57, 3114–3142. [Google Scholar] [CrossRef]
  3. Seki, S.; Onose, Y.; Tokura, Y. Spin-Driven Ferroelectricity in Triangular Lattice Antiferromagnets ACrO2 (A = Cu, Ag, Li, or Na). Phys. Rev. Lett. 2008, 101, 067204. [Google Scholar] [CrossRef]
  4. Zhu, W.; Wang, P.; Zhu, H.; Zhu, H.; Li, X.; Zhao, J.; Xu, C.; Xiang, H. Mechanism of Type-II Multiferroicity in Pure and Al-Doped CuFeO2. Phys. Rev. Lett. 2025, 134, 066801. [Google Scholar] [CrossRef]
  5. Nandjou, F.; Haussener, S. Degradation in photoelectrochemical devices: Review with an illustrative case study. J. Phys. D Appl. Phys. 2017, 50, 124002. [Google Scholar] [CrossRef]
  6. Ketir, W.; Bouguelia, A.; Trari, M. Visible light induced NO2-removal over CuCrO2 catalyst. Water. Air. Soil. Pollut. 2009, 199, 115–122. [Google Scholar] [CrossRef]
  7. Younsi, M.; Manaa, S. Synthesis and characterization of rich delafossite CuYO2+x: Application for solar energy conversion. Energy Procedia 2013, 36, 638–641. [Google Scholar] [CrossRef]
  8. Xiong, D.; Zhang, W.; Zeng, X.; Xu, Z.; Chen, W.; Cui, J.; Wang, M.; Sun, L.; Chen, Y.B. Enhanced performance of p-type dye-sensitized solar cells based on ultra-small Mg-doped CuCrO2 nanocrystals. Chem. Sustain. Chem. 2013, 6, 1432–1437. [Google Scholar] [CrossRef]
  9. Aakash Hossain, H.S.; Sarkar, S.; Bose, S.; Das, P. Synthesis, characterization, and application of delafossites as catalysts for degrading organic pollutants and degradation mechanisms: A detailed insight. Surf. Interf. 2023, 42, 103281. [Google Scholar] [CrossRef]
  10. Zheng, S.Y.; Jiang, G.S.; Su, J.R.; Zhu, C.F. The structural and electrical property of CuCr1−xNixO2 delafossite compounds. Mater. Lett. 2006, 60, 3871–3873. [Google Scholar] [CrossRef]
  11. Kondrashev, I.D. The crystal structure and composition of crednerite, CuMnO2. Sov. Phys. Crystallogr. 1959, 3, 703–706. [Google Scholar]
  12. Benreguia, N.; Barnabe, A.; Trari, M. Preparation and characterization of the semiconductor CuMnO2 by sol-gel route. Mater. Sci. Semicond. Process. 2016, 56, 14–19. [Google Scholar] [CrossRef]
  13. Benreguia, N.; Abdi, A.; Mahroua, O.; Trari, M. Photoelectrochemical properties of the credneriteCuMnO2 and its application to hydrogen production and Mn+ reduction (Mn+ = Cd2+, Pd2+, Zn2+, Ni2+, and Ag+). J. Mater. Sci. Mater. Electron. 2021, 32, 10498–10509. [Google Scholar] [CrossRef]
  14. Bessekouad, Y.; Gabes, Y.; Bouguelia, A.; Trari, M. The physical and photo electrochemical characterization of the crednerite CuMnO2. J. Mater. Sci. 2007, 42, 6469–6476. [Google Scholar] [CrossRef]
  15. Amrute, A.P.; Łodziana, Z.; Mondelli, C.; Krumeich, F.; Perez-Ramirez, J. Solid-state chemistry of cuprous delafossites: Synthesis and stability aspects. Chem. Mater. 2013, 25, 4423–4435. [Google Scholar] [CrossRef]
  16. Ma, C.; Pan, J.; Chen, C.; Dong, Y.; Yao, F.; Wang, F.; Song, M. Investigation into the roles of interfacial H2O structure in catalytic oxidation of HCHO and CO over CuMnO2 catalysts. J. Environ. Sci. 2024, 137, 310–320. [Google Scholar] [CrossRef]
  17. Chen, Y.C.; Kuo, Y.H.; Vincent, K.S.; Hsiao, H.; Huang, C.Y. Enhancement of seebeck coefficient in CuGaO2 thin films by optimization of sol-gel processing parameters. Mater. Chem. Phys. 2025, 339, 130769. [Google Scholar] [CrossRef]
  18. He, H.; Chen, Y.; Wang, F.; Liu, X.; Guo, Y. Nitrite sensing behaviors of tailored bimetallic oxide CuMnO2 nanostructures. J. Mater. Sci. Mater. Electron. 2022, 33, 1140–1153. [Google Scholar] [CrossRef]
  19. Zhang, L.; Gao, C.; Wang, Y.; Yu, W.; Zhang, S.; Zhang, B.; Li, X. Insights into atomic arrangement in CuMnO2 with tailored exposed crystal facets for effectively micropollutant oxidation via peroxymonosulfate activation. J. Cleaner Prod. 2024, 458, 142517. [Google Scholar] [CrossRef]
  20. Trari, M.; Töpfer, J.; Dordor, P.; Grenier, J.C.; Pouchard, M.; Doumerc, J.P. Preparation and physical properties of the solid solutions Cu1+xMn1−xO2 (0 ≤ x ≤ 0.2). J. Solid State Chem. 2005, 178, 2751–2758. [Google Scholar] [CrossRef]
  21. Xiong, D.; Gao, H.; Deng, Y.; Qi, Y.; Du, Z.; Zeng, X.; Li, H. Impact of Mg doping on the optical and electrical properties of p-type CuMnO2 ultrathin nanosheets. J. Mat. Sci. Mater. Electron. 2020, 31, 5452–5461. [Google Scholar] [CrossRef]
  22. Poienar, M.; Sfirloaga, P.; Martin, C.; Ursu, D.; Vlazan, P. Hydrothermal synthesis of crednerite CuMn1−xMxO2 (M = Mg, Al; x = 0–0.08): Structural characterization and magnetic properties. J. Mater. Sci. 2018, 53, 2389–2395. [Google Scholar] [CrossRef]
  23. Malaescu, I.; Lungu, A.; Marin, C.N.; Sfirloaga, P.; Vlazan, P.; Brindusoiu, S.; Poienar, M. Temperature dependence of the dynamic electrical properties of Cu1+xMn1-xO2 (x = 0 and 0.06) crednerite materials. Ceram. Int. 2018, 44, 11610–11616. [Google Scholar] [CrossRef]
  24. Malaescu, I.; Poienar, M.; Marin, C.N. Investigation of the Electrical Properties of Polycrystalline Crednerite CuMn1−xMgxO2 (x = 0–0.06) Type Materials in a Low-Frequency Field. Crystals 2025, 15, 184. [Google Scholar] [CrossRef]
  25. Ogale, S.B.; Talyansky, V.; Chen, C.H.; Ramesh, R.; Greene, R.L.; Venkatesan, T. Unusual Electric Field Effects in Nd0. 7Sr0.3MnO3, Phys. Rev. Lett. 1996, 77, 1159–1162. [Google Scholar] [CrossRef]
  26. Mott, N.F.; Davis, E.A. Electronic Processes in Non-Crystalline Materials; Clarendon: Oxford, UK, 1979. [Google Scholar]
  27. Shklovskii, B.I.; Efros, A.L. Electronic Properties of Doped Semiconductors; Springer: Berlin/Heidelberg, Germany, 1984. [Google Scholar]
  28. Poienar, M.; Banica, R.; Sfirloaga, P.; Ianasi, C.; Mihali, C.V.; Vlazan, P. Microwave-assisted hydrothermal synthesis and catalytic activity study of crednerite-type CuMnO2 materials. Ceram. Intern. 2018, 44, 6157–6161. [Google Scholar] [CrossRef]
  29. Carvajal, J.R. Recent advances in magnetic structure determination by neutron powder diffraction. Phys. B Cond. Matter. 1993, 192, 55–69. [Google Scholar] [CrossRef]
  30. Lungu, A.; Malaescu, I.; Marin, C.N.; Vlazan, P.; Sfirloaga, P. The electrical properties of manganese ferrite powders prepared by two different methods. Phys. B Cond. Matter. 2015, 462, 80–85. [Google Scholar] [CrossRef]
  31. ASTM D150-98; Standard Test Methods for AC Loss Characteristics and Permittivity (Dielectric Constant) of Solid Electrical Insulation. ASTM International: West Conshohocken, PA, USA, 2017.
  32. Damay, F.; Poienar, M.; Martin, C.; Maignan, A.; Rodriguez-Carvajal, J.; André, G.; Doumerc, J.P. Spin-lattice coupling induced phase transition in the S=2 frustrated antiferromagnet CuMnO2. Phys. Rev. B. 2009, 80, 094410–094417. [Google Scholar] [CrossRef]
  33. Poienar, M.; Martin, C.; Lebedev, O.I.; Maignan, A. Advantage of low-temperature hydrothermal synthesis to grow stoichiometric crednerite crystals. Solid State Sci. 2018, 80, 39–45. [Google Scholar] [CrossRef]
  34. Poienar, M.; Vecchini, C.; Andre, G.; Daoud-Aladine, A.; Margiolaki, I.; Maignan, A.; Lappas, A.; Chapon, L.; Hervieu, M.; Damay, F.; et al. Substitution effect on the inter -plane coupling in crednerite: The Cu1.04Mn0.96O2 case. Chem. Mat. 2011, 23, 85–94. [Google Scholar] [CrossRef]
  35. Ushakov, A.V.; Streltsov, S.V.; Khomskii, D.I. Orbital structure and magnetic ordering in stoichiometric and doped crednerite CuMnO2. Phys. Rev. B. 2014, 89, 024406. [Google Scholar] [CrossRef]
  36. Julien, C.M.; Massot, M.; Poinsignon, C. Lattice vibrations of manganese oxides Part I. Periodic structures. Spectrochim. Acta Part A 2004, 60, 689–700. [Google Scholar] [CrossRef]
  37. Gillot, B.; El Guendouzi, M.; Laarj, M. Particle size effects on the oxidation–reduction behavior of Mn3O4 hausmannite. Mater. Chem. Phys. 2001, 70, 54–60. [Google Scholar] [CrossRef]
  38. Liu, C.; Nan, J.; Zuo, X.; Xiao, X.; Shu, D. Synthesis and electrochemical characteristics of an orthorhombic LiMnO2 cathode material modified with poly(vinyl-pyrrolidone) for lithium ion batteries. Int. J. Electrochem. Sci. 2012, 7, 7152–7164. [Google Scholar] [CrossRef]
  39. Costa, M.M.; Pires Junior, G.F.M.; Sombra, A.S.B. Dielectric and impedance properties’ studies of the of lead doped (PbO)-Co2Y type hexaferrite (Ba2Co2Fe12O22 (Co2Y)). Mat. Chem. Phys. 2010, 123, 35–39. [Google Scholar] [CrossRef]
  40. Valente, M.A.; Peres, M.; Nico, C.; Monteiro, T.; Graça, M.P.F.; Sombra, A.S.B.; Silva, C.C. Morphological, structural, optical and dielectric properties of 91SiO2:4Li2O:4Nb2O5:1Dy2O3 (% mole) glass prepared by sol–gel. Opti. Mat. 2011, 33, 1964–1969. [Google Scholar] [CrossRef]
  41. Barsoukov, E.; Ross Macdonald, J. Impedance Spectroscopy Theory, Experiment and Applications, 2nd ed.; Wiley Interscience: New York, NY, USA, 2005. [Google Scholar]
  42. Lily, K.; Kumari, K.; Prasad, R.; Choudhary, N.P. Impedance spectroscopy of (Na0.5Bi0.5)(Zr0.25Ti0.75)O3 lead-free ceramic. J. Alloys Compd. 2008, 453, 325–331. [Google Scholar] [CrossRef]
  43. Debye, P. Polar Molecules; Chemical Catalog Company, Inc.: New York, NY, USA, 1929. [Google Scholar]
  44. Jonscher, A.K. Universal Relaxation Law, 1st ed.; Chelsea Dielectrics Press: London, UK, 1996; pp. 198–200. [Google Scholar]
  45. Funke, K. Jump relaxation in solid electrolytes. Prog. Solid State Chem. 1993, 22, 111–195. [Google Scholar] [CrossRef]
  46. Malaescu, I.; Sfirloaga, P.; Marin, C.N.; Bunoiu, M.O.; Vlazan, P. Experimental Investigations on the Electrical Conductivity and Complex Dielectric Permittivity of ZnxMn1−xFe2O4 (x = 0 and 0.4) Ferrites in a Low-Frequency Field. Crystals 2024, 14, 437. [Google Scholar] [CrossRef]
  47. Iqbal, M.J.; Yaqub, N.; Sepiol, B.; Ismail, B. A study of the influence of crystallite size on the electrical and magnetic properties of CuFe2O4. Mat. Research Bull. 2011, 46, 1837–1842. [Google Scholar] [CrossRef]
  48. Davis, E.A.; Mott, N.F. Conduction in non-crystalline systems. Philos. Mag. 1970, 22, 903–922. [Google Scholar] [CrossRef]
  49. Efros, A.L.; Shklovskii, B.I. Coulomb gap and low temperature conductivity of disordered systems. J. Phys. C Solid State Phys. 1975, 8, L49–L51. [Google Scholar] [CrossRef]
  50. Plugaru, R.; Sandu, T.; Plugaru, N. First principles study and variable range hopping conductivity in disordered Al/Ti/Mn-doped ZnO. Results in Phys. 2012, 2, 190–197. [Google Scholar] [CrossRef]
  51. Lalanne, M.; Barnabé, A.; Mathieu, F.; Tailhades, P. Synthesis and thermostructural studies of a CuFe(1-x)Cr(x)O(2) delafossite solid solution with. Inorg. Chem. 2009, 48, 6065–6071. [Google Scholar] [CrossRef]
  52. Dyre, J.C.; Schroder, T.B. Universality of ac conduction in disordered solids. Rev. Mod. Phys. 2000, 72, 873–892. [Google Scholar] [CrossRef]
  53. Lalanne, M.; Demont, P.; Barnabe, A. Ac conductivity and dielectric properties of CuFe1−xCrxO2:Mg delafossite. J. Phys. D Appl. Phys. 2011, 44, 185401. [Google Scholar] [CrossRef]
  54. Okuda, T.; Jufuku, N.; Hidaka, S.; Terada, N. Magnetic, transport, and thermoelectric properties of the delafossite oxides CuCr1−xMgxO2 (0 < x < 0.04). Phys. Rev. B. 2005, 72, 144403. [Google Scholar]
  55. Nagarajan, R.; Draeseke, A.D.; Sleight, A.W.; Tate, J. p-type conductivity in CuCr1−xMgxO2 films and powders. J. Appl. Phys. 2001, 89, 8022–8025. [Google Scholar] [CrossRef]
  56. Pike, G.E. AC conductivity of scandium oxide and a new hopping model for conductivity. Phys. Rev. B. 1972, 6, 1572–1580. [Google Scholar] [CrossRef]
  57. Elliott, S.R. A theory of a.c. conduction in chalcogenide glasses. Philos. Mag. B. 1977, 36, 1291–1304. [Google Scholar] [CrossRef]
Figure 1. The XRD patterns of the three CuMnO2 crednerite samples.
Crystals 15 00497 g001
Figure 2. Measured X-ray diffraction pattern (black line) and the corresponding patterns calculated using Rietveld method (red line) for CuMnO2 crednerite samples: (a) S1, (b) S2, and (c) S3. The rows of vertical marks indicate the positions of Bragg reflections corresponding to the C2/m space group of the CuMnO2 phase.
Crystals 15 00497 g002aCrystals 15 00497 g002b
Figure 3. FT-IR spectra for CuMnO2 crednerite samples. Inset: FT-IR spectra for samples between (400–800) cm−1.
Crystals 15 00497 g003
Figure 4. SEM images for CuMnO2 crednerite samples: (a) sample S1, (b) sample S2, and (c) sample S3.
Crystals 15 00497 g004
Figure 5. The dependence on the frequency of the real (Z′) part of the complex impedance for sample S1 (a), sample S2 (c) and sample S3 (e), and the imaginary (Z″) part of the complex impedance of sample S1 (b), sample S2 (d) and sample S3 (f) of CuMnO2 crednerite.
Crystals 15 00497 g005
Figure 6. The ln(τ)(T−1) plots for crednerite CuMnO2 samples, obtained by microwave-assisted hydrothermal synthesis (MWH).
Crystals 15 00497 g006
Figure 7. The frequency dependence of the conductivity σ, at different temperatures of the CuMnO2 crednerite samples: (a) S1; (b) S2, and (c) S3, respectively.
Crystals 15 00497 g007aCrystals 15 00497 g007b
Figure 8. Temperature dependence of the σDC conductivity of the CuMnO2 crednerite samples, obtained by microwave-assisted hydrothermal synthesis.
Crystals 15 00497 g008
Figure 9. The ln(σDC)(T−1) plot in agreement with the Arrhenius law (a); the ln(σDC)(T−1/4) plot in agreement with the Mott’s VRH model (b) and the ln(σDC)(T−1/2) plot in agreement with the ES-VRH model (c) of the CuMnO2 crednerite samples.
Crystals 15 00497 g009aCrystals 15 00497 g009b
Figure 10. The dependence on temperature of the conduction activation energy corresponding to the VRH model of CuMnO2 samples.
Crystals 15 00497 g010
Figure 11. The temperature dependence of the charge carrier’s mobility (μ) for the CuMnO2 samples.
Crystals 15 00497 g011
Figure 12. The lnσAC(lnω) dependence at different temperatures for sample S1 (a), sample S2 (b) and sample S3 (c) of CuMnO2 type crednerites.
Crystals 15 00497 g012aCrystals 15 00497 g012b
Figure 13. The dependence on temperature of the deviation (1-n) from unity, of the exponent n, for the CuMnO2 samples.
Crystals 15 00497 g013
Table 1. The unit cell parameters, cell volume, V, and crystallite size for CuMnO2 crednerite samples from Rietveld refinement of X-ray diffraction.
SamplesSample S1Sample S2Sample S3
a (Å)5.56331(1)5.58146(8)5.58113(6)
b (Å)2.88611(5)2.88623(4)2.88616(3)
c (Å)5.88602(2)5.88560(9)5.89400(7)
β (deg)104.054(2)103.956(9)103.988(7)
Volume (Å3)91.679(3)92.014(2)92.125(2)
Crystallite size (nm)13.818.519.5
Table 2. The obtained parameters from fitting with a linear equation of the experimental dependence from Figure 8.
SamplesParametersArhenius LawVRH ModelES-VRH Model
Equation y = A + Bxln(σDC) = ln(σ0) — (EA,cond/k)·(T)−1ln(σDC)= ln(σ0M) — (T0M)1/4 ·(T)−1/4ln(σDC)= ln(σ0E-S) — (T0E-S)1/2 ·(T)−1/2
S2r2 0.994520.997310.99654
Intercept (A)−0.1488427.999179.23323
Slope (B)−3246.2966−161.96251−349.31997
S3r2 0.990270.997230.99670
Intercept (A)−0.3140328.651229.57888
Slope (B)−3173.86645−161.8811−355.24135
Table 3. Mott parameters for crednerite CuMnO2 samples at different temperatures.
T [K]kT [eV]Sample S1Sample S2Sample S3
Rh[nm]Wh[eV]Rh[nm]Wh[eV]Rh[nm]Wh[eV]
3030.026119.8218.9419.8018.9319.7918.92
3230.02780.1100.1260.1100.1250.1100.125
3430.029619.5018.6919.4918.6719.4818.66
3630.03130.1150.1310.1150.1310.1150.131
3830.033019.2118.5719.2018.5519.1918.54
3930.03390.1210.1340.1200.1330.1200.133
Table 4. Electrical parameters of crednerite CuMnO2 samples at different temperatures, determined from conductivity measurements.
Sample S1Sample S1Sample S1
T [K]n109 × A0
(S/msn)
10−4 × ωh
(rad/s)
n109 × A0
(S/msn)
10−4 × ωh
(rad/s)
n109 × A0
(S/msn)
10−4 × ωh
(rad/s)
3030.8771.511.7290.8671.935.5000.8443.992.905
3130.8621.532.0490.8342.567.0990.8105.034.316
3230.8421.753.0960.8013.1611.0960.7747.146.657
3330.8221.915.3690.7764.7614.7150.73310.7710.242
3430.8032.616.4810.7447.9817.3580.70115.0316.447
3530.7903.258.2080.71413.1121.8380.68021.5120.132
3630.7605.1910.5670.67425.2724.6500.65435.1620.693
3730.7338.4111.2080.64045.4030.397---
3830.71411.6413.9740.59599.3430.7280.570141.131.495
3930.67821.6216.0880.544238.832.7850.536250.440.871
Disclaimer/Publisher’s Note: The statements, opinions and data contained in all publications are solely those of the individual author(s) and contributor(s) and not of MDPI and/or the editor(s). MDPI and/or the editor(s) disclaim responsibility for any injury to people or property resulting from any ideas, methods, instructions or products referred to in the content.

