Article

Growth and Characterization of High Doping Concentration (2.1 at%) Ytterbium (Yb) Doped Lithium Niobate (LiNbO3) Crystal: An Electrically Tunable Lasing Medium

Department of Electrical Engineering, The Pennsylvania State University, University Park, PA 16802, USA
*
Author to whom correspondence should be addressed.
Crystals 2025, 15(5), 486; https://doi.org/10.3390/cryst15050486
Submission received: 29 April 2025 / Revised: 15 May 2025 / Accepted: 19 May 2025 / Published: 21 May 2025
(This article belongs to the Special Issue Rare Earths-Doped Materials (3rd Edition))

Abstract

:
In this paper, we report on the growth and characterization of high doping concentration (2.1 at%) ytterbium (Yb) doped lithium niobate (Yb:LiNbO3) crystal. By using a slightly modified Czochralski method, we have successfully grown a usable size (2 mm × 2 mm × 30 mm) Yb:LiNbO3 single crystal. We also conducted the energy-dispersive X-ray spectroscopy (EDS) and the X-ray diffraction (XRD) analyses, which experimentally confirm that the grown crystal is a Yb:LiNbO3 single crystal. We also measured the absorption and emission spectra of the grown crystal. It was found out that there is a near-flat broad emission within a spectral range of 1004–1030 nm when excited at 980 nm for this high doping concentration Yb:LiNbO3 crystal. Such a near-flat broad emission can be very useful for realizing high slope efficiency ultrafast (femtosecond) lasing in the Yb:LiNbO3 crystal due to the low quantum defect of the Yb:LiNbO3 crystal. We also investigated the electro-optic effect of the Yb:LiNbO3. The experimental result confirms that the electro-optic (EO) effect of a highly doped (2.1 at%) lithium niobate crystal is close to the EO value of the pure lithium niobate. Thus, the highly doped Yb:LiNbO3 crystal can still be an effective electrically tunable lasing medium. It can enable electrically tunable, high slope efficiency femtosecond lasing due to the combined features, including (1) a near flat broad emission spectrum at the spectral range of 1004–1030 nm, (2) a non-compromised electro-optic effect at high doping concentration Yb:LiNbO3 crystal, and (3) a low quantum defect.

1. Introduction

Tunable lasers have a great impact on a variety of applications such as laser spectroscopy and medical diagnosis. Many different types of tunable lasers have been developed, such as tunable optical parametric oscillators, solid-state organic dye lasers, external-cavity semiconductor lasers, tunable fiber lasers, etc. [1]. Although these tunable lasers have been successful in certain applications, there are continuous efforts to improve the performance of tunable lasers, such as how to further reduce the footprint and increase the tuning speed. Unfortunately, the tuning element and the lasing medium are two separate components in most conventional tunable lasers [1], which limits the size, tuning speed, and reliability of tunable lasers. For example, the existence of mechanical movement in external-cavity semiconductor lasers limits the tuning speed within the range of > 1   μ s [1]. On the other hand, although the non-mechanical electro-optic (EO) tuning can enable a faster ( < 1   μ s ) tuning speed, the EO tuning and lasing medium are two separate units [2]. Thus, to achieve a fast-tuning speed while maintaining a minimum size, it is a much more favorable approach if the tuning unit and the lasing medium can be a single unit.
Rare earth (RE) dopants have been widely used in conventional non-electro-optic materials such as amorphous glasses [3] and some crystalline materials such as yttrium aluminum garnet (YAG) [4]. Although high lasing efficiency has been achieved in these lasing media, there are not electrically tunable lasing media. On the other hand, in terms of rare earth-doped electrically tunable lasing medium, there has recently been growing interest in rare earth-doped lithium niobate (LiNbO3) crystal because it can offer both high lasing efficiency and electro-optic tuning capability. Most recent efforts have been focused on thin film and nanocrystal configurations. The following are just examples. Huang et al. developed an on-chip tunable microcavity laser on Yb3+ doped thin-film lithium niobate [5]. An output power of 1.5 mW was reported. Liu et al. developed a low-threshold erbium-doped lithium niobate nanocavity laser [6]. A low lasing threshold of 1.15 μ W was realized. Zhu et al. provided a comprehensive review on integrated photonics on thin film lithium niobate [7]. Zhang et al. reported a microring laser based on ytterbium-doped lithium niobate thin film [8]. Guo et al. realized ultrafast mode-locked lasing in nanophotonic lithium niobate with a pulse width of 4.8 ps [9]. Bredillet et al. achieved second harmonic generation and up-conversion photoluminescence emission in rare-earth-doped lithium niobate nanocrystals [10]. Note that thin film and nanocrystal structures do offer certain advantages. For example, it can be readily integrated into photonic circuits. However, the output power is limited, which is usually on the order of a mW or less.
On the other hand, the rare-earth-doped bulk lithium niobate crystal has great potential to provide high-power tunable lasing capability. Thus, there have also been continuous efforts to investigate the rare-earth-doped bulk lithium niobate crystals. Different types of rare earth elements have been investigated. For example, the properties and characterizations of erbium-doped lithium niobate bulk crystal were recently reported [11]. Among different types of rare earth elements, ytterbium-doped lithium crystal attracts particular attention due to its low (<10%) quantum defect efficiency [12,13]. Sokolska et al. reported the growth and spectroscopic properties of Yb:LiNbO3 single crystals at a doping concentration of 0.5 at% [14]. Tsuboi et al. discussed influences from other rare-earth ions as well as γ -irradiation on a Yb:LiNbO3 single crystal at the doping concentration of 0.5 wt% [15]. Bodziony et al. addressed the low symmetry centers of Yb:LiNbO3 single crystal at a doping concentration of 1 at% [16]. Bodziony et al. also discussed the temperature dependence of the electron paramagnetic resonance (EPR) of Yb:LiNbO3 at a doping concentration of 1 wt% [14,15,16,17,18,19]. Boulon also addressed the importance (i.e., low quantum defect) of Yb3+-doped optical inorganic materials [19]. Although the absorption and emission spectra were reported in these previous references [16,17,18], the reported absorption and emission data were at the doping concentration level of 1   a t % . Boudour et al. reported the growth of higher concentration (up to 5 at%) Yb:LiNbO3 by the laser heated pedestal growth (LHPG) method [20]. The X-ray diffraction (XRD) and Raman analyses were provided. However, the absorption and emission spectra were not reported in ref. [20]. Furthermore, the electro-optic coefficients of Yb:LiNbO3 were not reported in these previous references [14,15,16,17,18,19,20] when the concentration levels of Yb3+ ions were larger than 1 at%.
Recently, we reported the growth of Yb:LiNbO3 crystalline fibers by combining the slowly cooling and laser-heated pedestal growth (LHPG) methods [21]. The Yb3+ doping concentration was >1 at%. The material composition, crystalline structure, and absorption spectrum of Yb:LiNbO3 crystalline fibers were investigated. However, the quality and size of Yb:LiNbO3 crystal were very limited due to the use of a slow cooling method. For example, the maximum size was only around 5 mm. Furthermore, the emission spectrum and electro-optic coefficients could not be investigated and reported due to the limited quality and size of the Yb:LiNbO3 crystal sample in our previous work [21].
In this paper, we report the recent advancements in the growth and characterization of high doping concentration (2.1 at%) Yb:LiNbO3 crystals. The modified Czochralski method was used to replace the slowly cooling method. A higher quality and a larger size (increased from 5 mm to 30 mm) Yb:LiNbO3 was achieved. Furthermore, the emission spectrum when excited at 980 nm and the electro-optic coefficients were measured. It was found out that there was broad emission within a spectral range of 1004–1030 nm, to be described in detail in Section 3.5. Such a broadband emission spectrum could be useful for realizing ultrafast (femtosecond) laser operation in high doping concentration Yb:LiNbO3 crystals. Furthermore, the experimental result also confirmed that the electro-optic coefficient of a highly doped (2.1 at%) Yb:LiNbO3 crystal was close to the pure LiNbO3. Thus, the Yb:LiNbO3 can be an electrically tunable lasing medium even at a high doping concentration level.

2. Materials and Methods

The Yb:LiNbO3 crystals were grown by using a modified Czochralski growth method [22]. First, high-purity 4N lithium niobate powder and ytterbium oxide powder were uniformly mixed in a rotation jar for 24 h. The concentration level of ytterbium oxide powder was around 2.1 at%. Second, the mixed powder was poured into a platinum crucible and placed into a high-temperature furnace. Third, the furnace was slowly heated to a temperature of 1300 °C at a rising rate of 5 °C/min in air. Fourth, to ensure that large ionic radius Yb3+ ions can be uniformly dispersed in the congruent melt, the Czochralski crystal growth method was slightly modified by adding an extra high-temperature holding step. The temperature of the furnace was maintained at 1300 °C for 10 h. Finally, a pure lithium niobate seed was put in contact with the melt, and the Yb:LiNbO3 crystal ingot was slowly pulled out of the melt at a pulling rate of 1 mm/hr. The result and properties of the grown Yb:LiNbO3 crystal will be described in detail in Section 3.

3. Results and Characterization

3.1. Picture of the Grown Yb:LiNbO3 Sample

The Yb:LiNbO3 crystal ingot was grown by using the method and procedure described in Section 2. The grown crystal was then cut/lapped/polished into a rectangularly shaped bar. Figure 1a shows one of the rectangularly shaped Yb:LiNbO3 crystal bars, which has a length of around 30 mm and a cross-section of 2 mm × 2mm. To test the electro-optic property of this grown Yb:LiNbO3 crystal bar, a pair of silver electrodes was coated on the top and bottom surfaces of this bar, as shown in Figure 1b. The bottom of the bar was also mounted on an alumina ceramic substrate so that it could be easily held and handled.

3.2. Measure the Density of the Grown Yb:LiNbO3 Sample

To ensure that the grown crystal was a high-quality Yb:LiNbO3 crystal, we conducted the following experimental verifications on crystal composition and structure. The crystal density was quantitatively determined by the Archimedes method. In the measurement, a crystal sample was prepared. A pioneer high-precision balance, made by Ohaus, was used to measure the weight and volume of the crystal. The measured weight, W, and volume, V, were W = 1.196   g and V = 0.256   c m 3 , respectively. The corresponding density, ρ , is ρ = W / V = 4.67   g / c m 3 . This is slightly higher than the value of a pure lithium niobate crystal ( 4.65   g / c m 3 ). It is speculated that this is due to the existence of heavier ytterbium elements.

3.3. Determine the Material Composition of the Grown Yb:LiNbO3 Sample

To measure the material composition of the grown Yb:LiNbO3 sample, we conducted energy-dispersive X-ray spectroscopy (EDS) on the crystal sample by using a Thermo Verios G4 scanning electron microscope (SEM) with EDS capability. Figure 2a–d shows SEM images and EDS measurement results of the Yb:LiNbO3 sample. An electron excitation voltage of 10 kV and a current of 6.4 nA were used for the measurement. The measured element percentage compositions are O: 70.83 at%, Nb: 27.07 at%, and Yb: 2.11 at%, respectively. Note that lithium (Li) is not shown in the EDS image due to its small atomic weight. The oxygen-to-niobate ratio is close to 3:1, which is consistent with the theoretical ratio. This experimental result confirmed that a sufficient amount (>2 at%) of ytterbium could indeed be doped into the lithium niobate crystal.

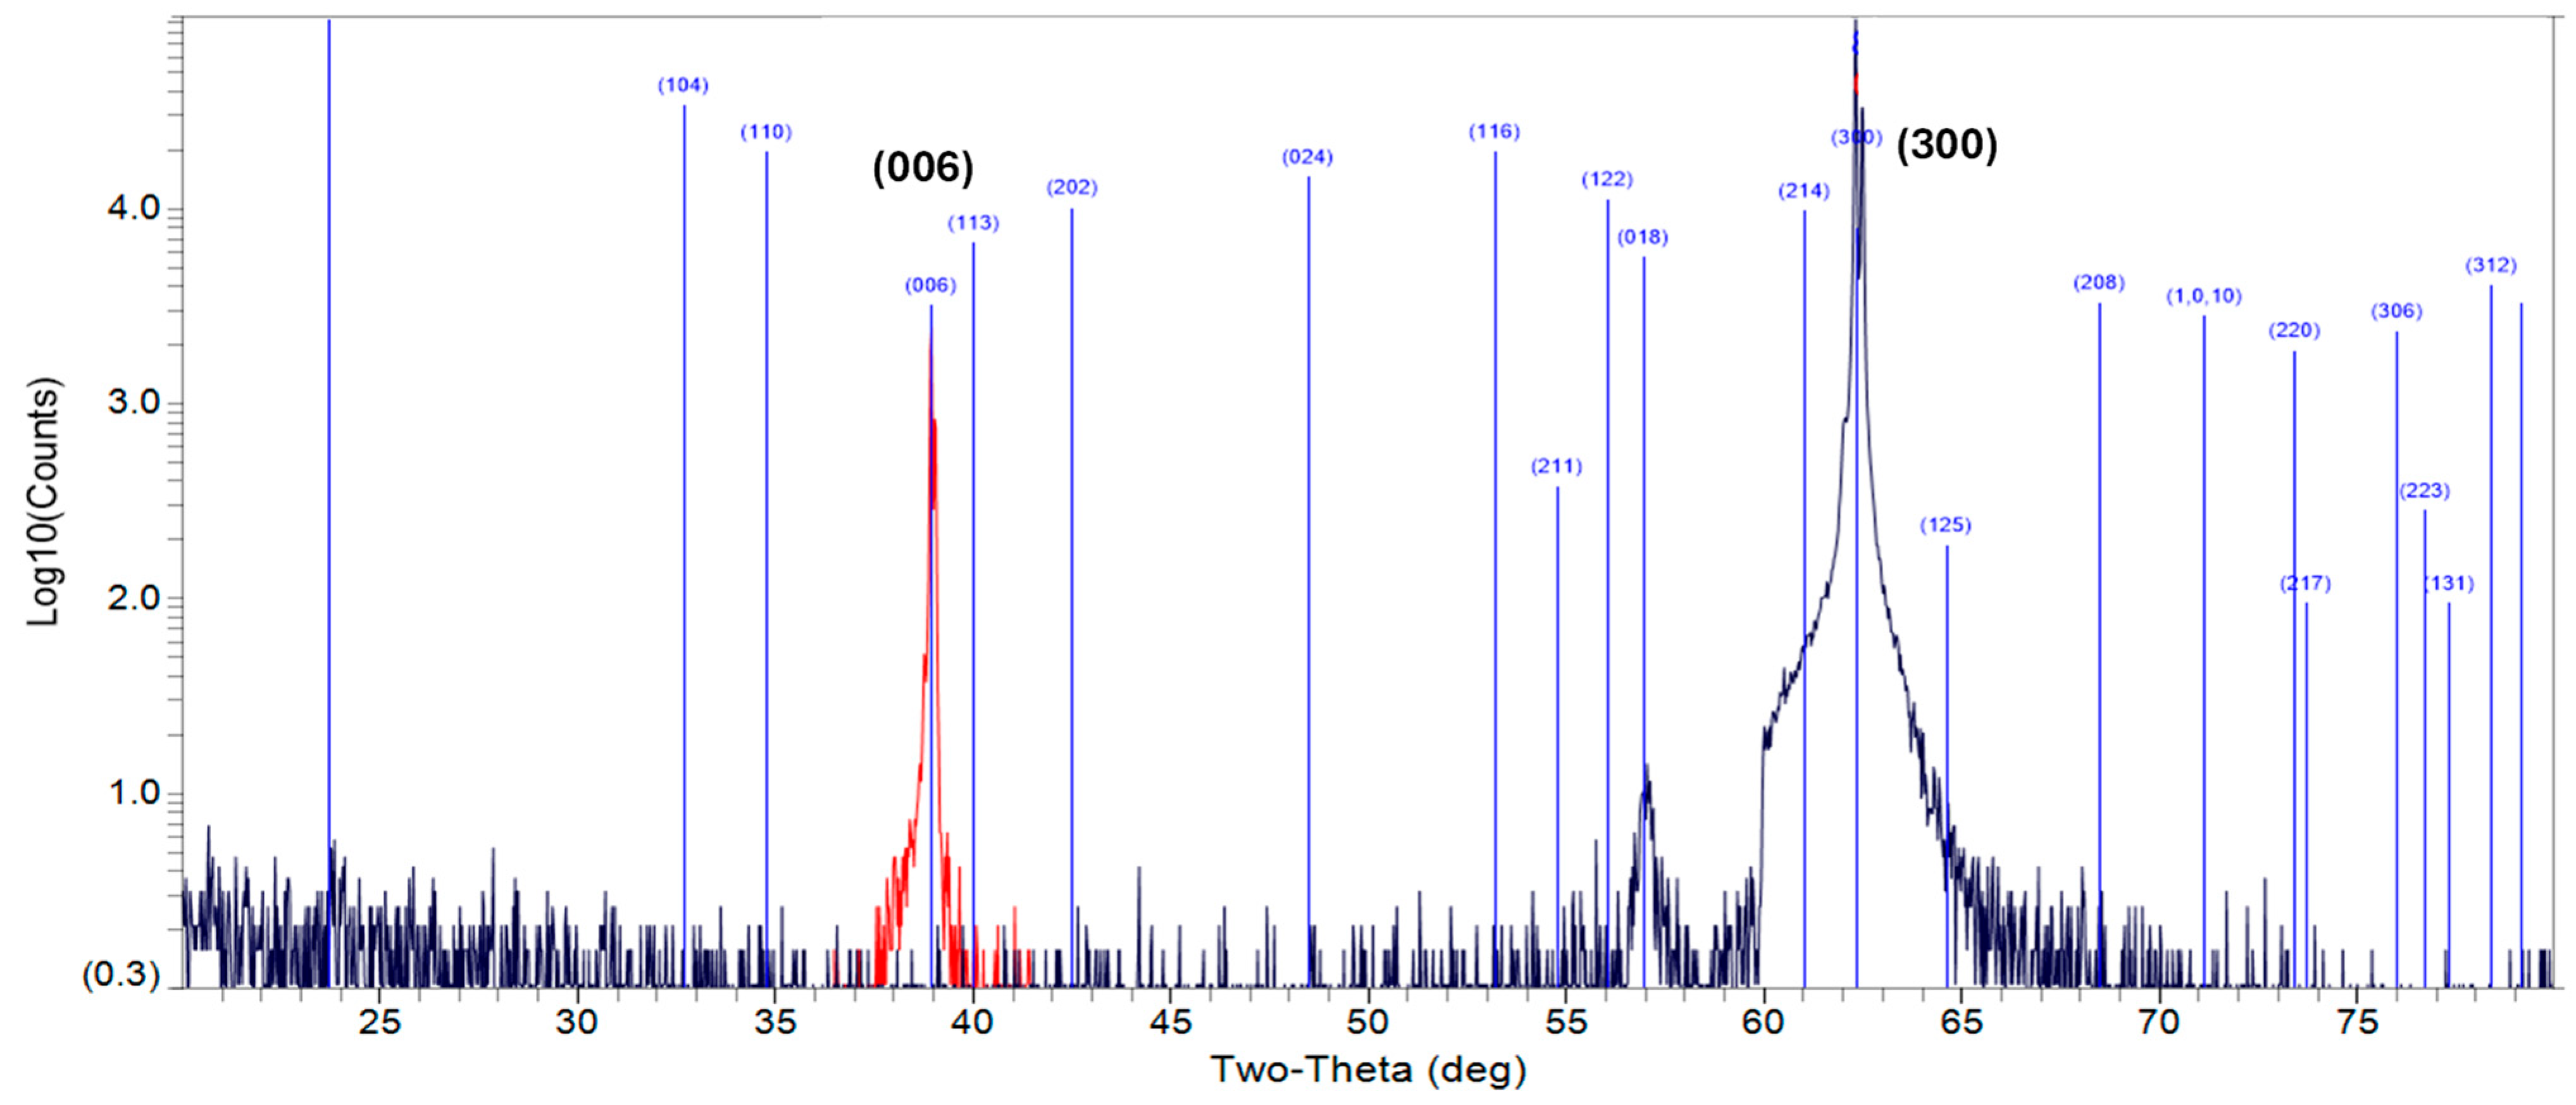
3.4. Determine the Crystalline Structure of the Grown Yb:LiNbO3 Sample

To determine the crystalline structure of the grown Yb:LiNbO3 sample, a Yb:LiNbO3 crystal bar with dimensions of 2 mm × 2 mm × 30 mm was prepared. The c-axis of the sample was along the long 30 mm direction. The conventional X-ray diffraction (XRD) method was used to determine the structure of the Yb:LiNbO3 sample [23]. The crystalline structure was measured in the directions of parallel and perpendicular to the long dimension of the sample by using a Malvern Panalytical Empyrean X-ray diffraction (XRD) instrument, made by Spectris Inc., located in Malvern, United Kingdom, available at Penn State Univ. Figure 3 shows the XRD result. The red curve of Figure 3 shows an XRD peak in the (006) direction when measured in the direction parallel to the long dimension of the sample. This confirms that the crystal axis is along the long 30 mm direction. The second XRD peak is in the (300) direction when measured in the direction perpendicular to the long dimension of the sample. This is also consistent with the crystal orientation, in which the c-axis of the sample is along the long dimension of the sample. The XRD result also confirms that this is a single-domain single crystal because there are only XRD peaks in the (006) direction when measured parallel to the long axis and in the (300) direction when measured perpendicular to the long axis.

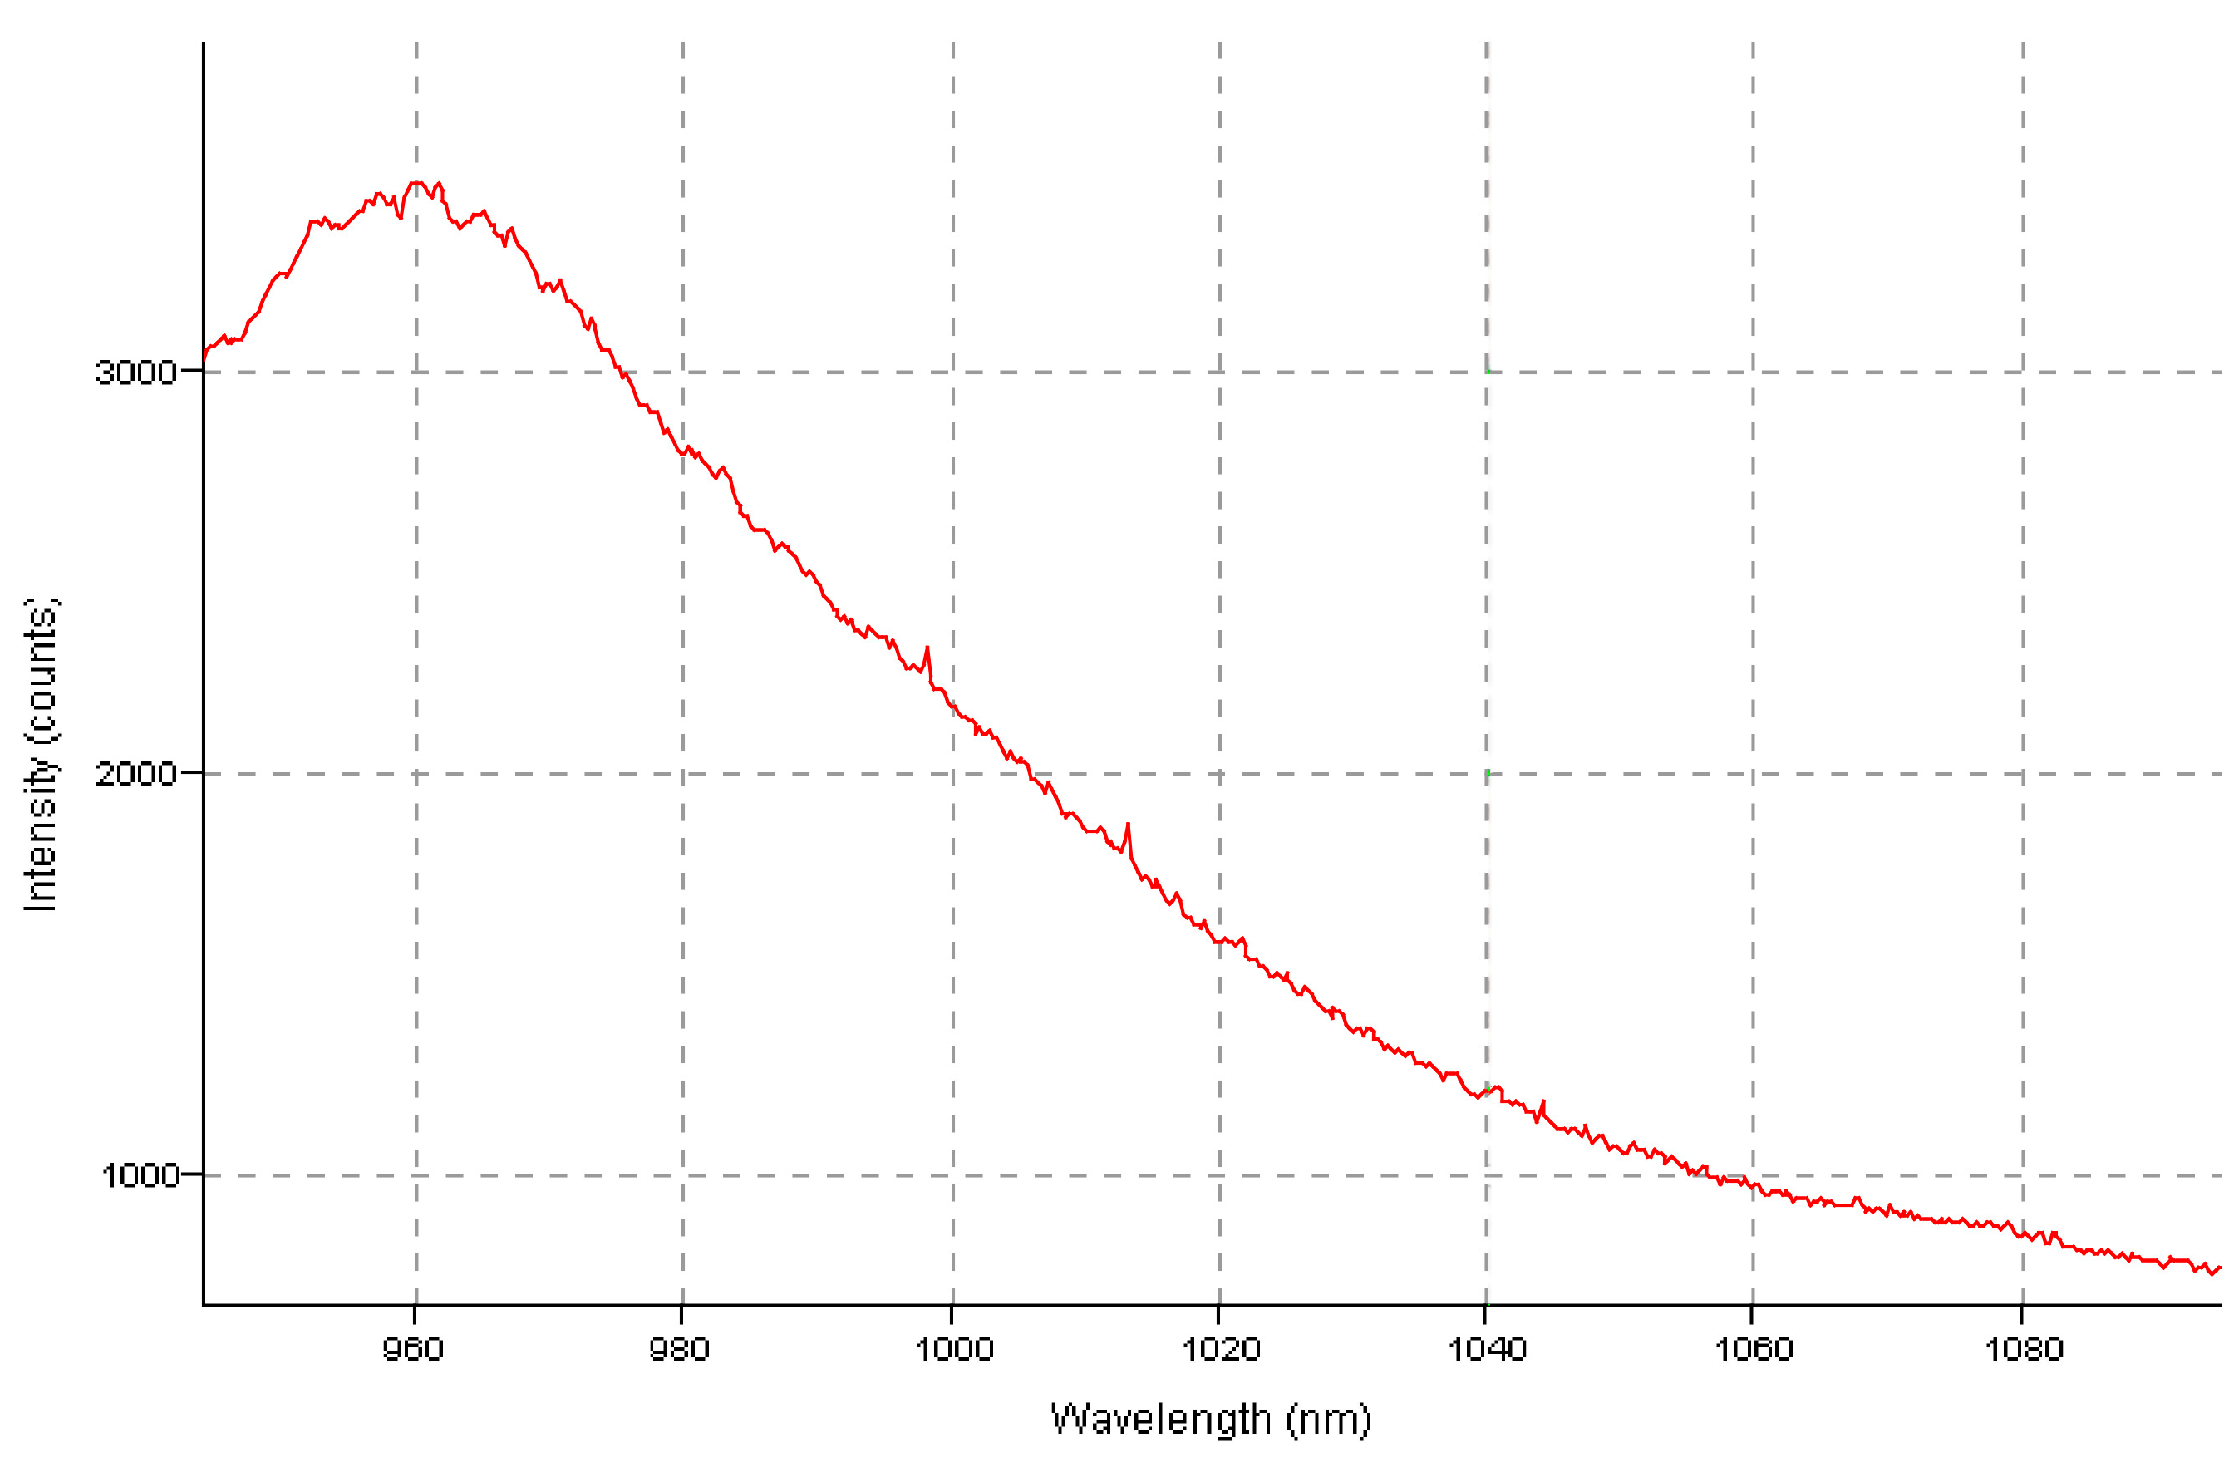
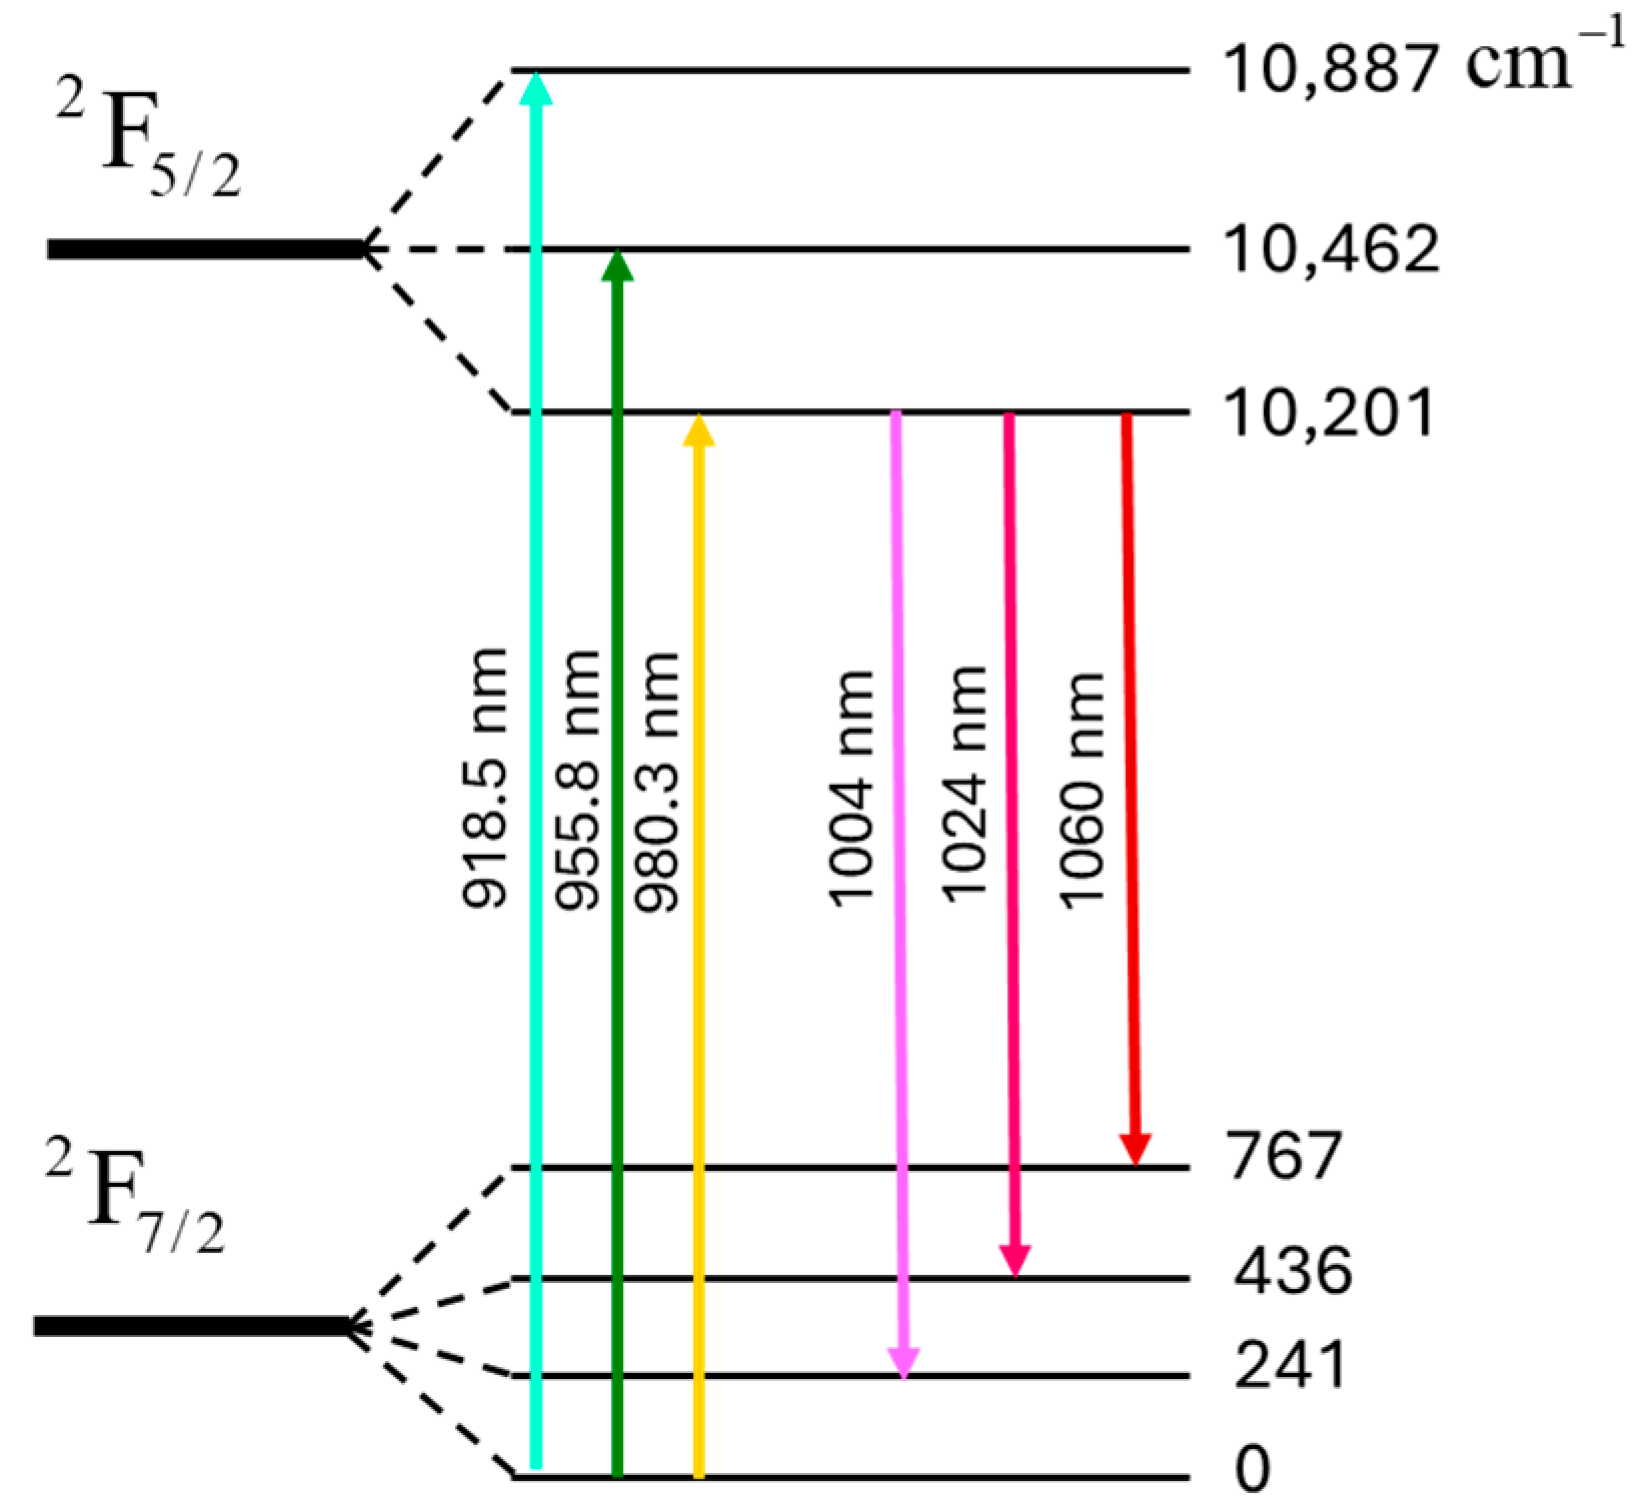
3.5. Measure the Absorption and Emission Spectra of the Grown Yb:LiNbO3 Bar Sample

To ensure the grown Yb:LiNbO3 sample can be a laser medium, the absorption and emission spectra of the grown Yb:LiNbO3 sample were measured. A Yb:LiNbO3 sample with dimensions of 2 mm × 2 mm × 30 mm, as shown in Figure 1, was used for the measurement. The doping concentration of Yb3+ was around 2.11 at%. An Ando AQ-4303B white light source and an HR4000CG-UV-NIR spectrometer from Ocean Optics were used as the light source and spectrometer, respectively, for measuring the absorption spectrum of the Yb:LiNbO3 crystalline bar. Figure 4 shows the experimentally measured spectral profile of the white light source. One can see that it has a broad emission range, covering 940–1100 nm. To measure the absorption spectrum, the output light beam from this white light source was coupled into the input 2 mm × 2 mm end surface of the Yb:LiNbO3 bar by a 5× microscopic objective. The exit light from the output 2 mm × 2 mm end surface of this Yb:LiNbO3 bar was coupled into the HR4000CG-UV-NIR spectrometer. Figure 5 shows the experimentally measured absorption spectrum. One can clearly see that there are two absorption peaks. One is a relatively broad absorption peak, centered at 955 nm. This corresponds to the transition from 0 cm−1 of F 7 / 2 2 to 10,462 cm−1 of F 5 / 2 2 , as illustrated in Figure 6 [16]. The other one is centered at 980 nm, which corresponds to the transition from 0 cm−1 of F 7 / 2 2 to 10,201 cm−1 of F 5 / 2 2 . In comparison with the previous literature data, Figure 1 of ref. [16], the locations of absorption peaks matched the previous data. However, the absorption at 955 nm is broader. We speculate that this is due to the higher doping concentration (2.1 at%) of our Yb:LiNbO3 sample.
To measure the emission spectrum of the grown Yb:LiNbO3 crystalline bar, a narrow spectral width 976 nm laser diode (LD) source, model no.: L980P200, made by Thorlabs, located in New Jersey, USA, was selected as the excitation light source because its output wavelength was close to the absorption peak of the Yb:LiNbO3 bar. A rectangularly shaped Yb:LiNbO3 crystal bar, as shown in Figure 1a, was used as the measurement sample. Figure 7a shows the measured spectral profile of the L980P200 laser diode. One can see that it covers 980 nm exciting wavelength; although, it is centered at 976 nm wavelength. To distinguish the excitation and emission light beams, a notch filter centered at 980 nm with a spectral width of 5 nm was inserted before the HR4000 spectrometer. Furthermore, for the purpose of comparison, we measured the emission spectra under different cases with the same intensity of exciting light. First, we measured the emission spectrum without any sample. Figure 7b shows the experimental emission spectrum. There is no emitted light within the range of 980–1100 nm. Second, we measured the emission spectrum of a pure LiNbO3 crystalline bar with the same length (~30 mm) as the Yb:LiNbO3 bar. Figure 7c shows the measured emission spectrum of the pure LiNbO3 crystalline bar. One can see that there is only slightly emitted light near 1005 nm. It is speculated that this is due to the existence of impurities within the “pure” LiNbO3 crystalline bar. Third, we measured the emission of a Yb:LiNbO3 crystalline bar. Figure 7d shows the measured emission spectrum of the Yb:LiNbO3 crystalline bar. One can clearly see the emission within the spectral range of 1005–1040 nm. In particular, there is a near-flat emission from 1004–1030 nm. There are two emissions within this spectral range. One is the transition from 10,201 cm−1 of F 5 / 2 2 to 241 cm−1 of F 7 / 2 2 , generating an emission centered at 1004 nm, as illustrated in Figure 6. The other one is the transition from 10,201 cm−1 of F 5 / 2 2 to 436 cm−1 of F 7 / 2 2 , generating an emission centered at 1024 nm. In comparison with the previous literature data, Figure 2 of ref. [16]. The emission spectrum of our sample, as shown in Figure 7d, is similar to the value of the previous literature data, i.e., Figure 2 of ref. [16]. However, the emission dent at 1015 nm is no longer obvious. The combined emission from these two transitions makes a near-flat emission from 1004–1030 nm. We speculate that this is due to the higher doping concentration level of our sample. The high doping concentration makes each emission spectrum become wider due to increased concentration quenching and reabsorption effects. Such a near-flat broad (25 nm spectral width) emission can be very useful for realizing high lasing slope efficiency and ultrafast (femtosecond) lasing in a highly doped Yb:LiNbO3 crystal. Furthermore, the weaker 1060 nm emission, reported in ref. [16], corresponding to the transition from 10,201 cm−1 of F 5 / 2 2 to 767 cm−1 of F 7 / 2 2 , is not observed in our measurement. We speculate that this is because our exciting source has a low power (~200 mW) and the center of our exciting wavelength is at 976 nm, not at 980 nm. This makes the weaker emission at 1060 nm undetectable.

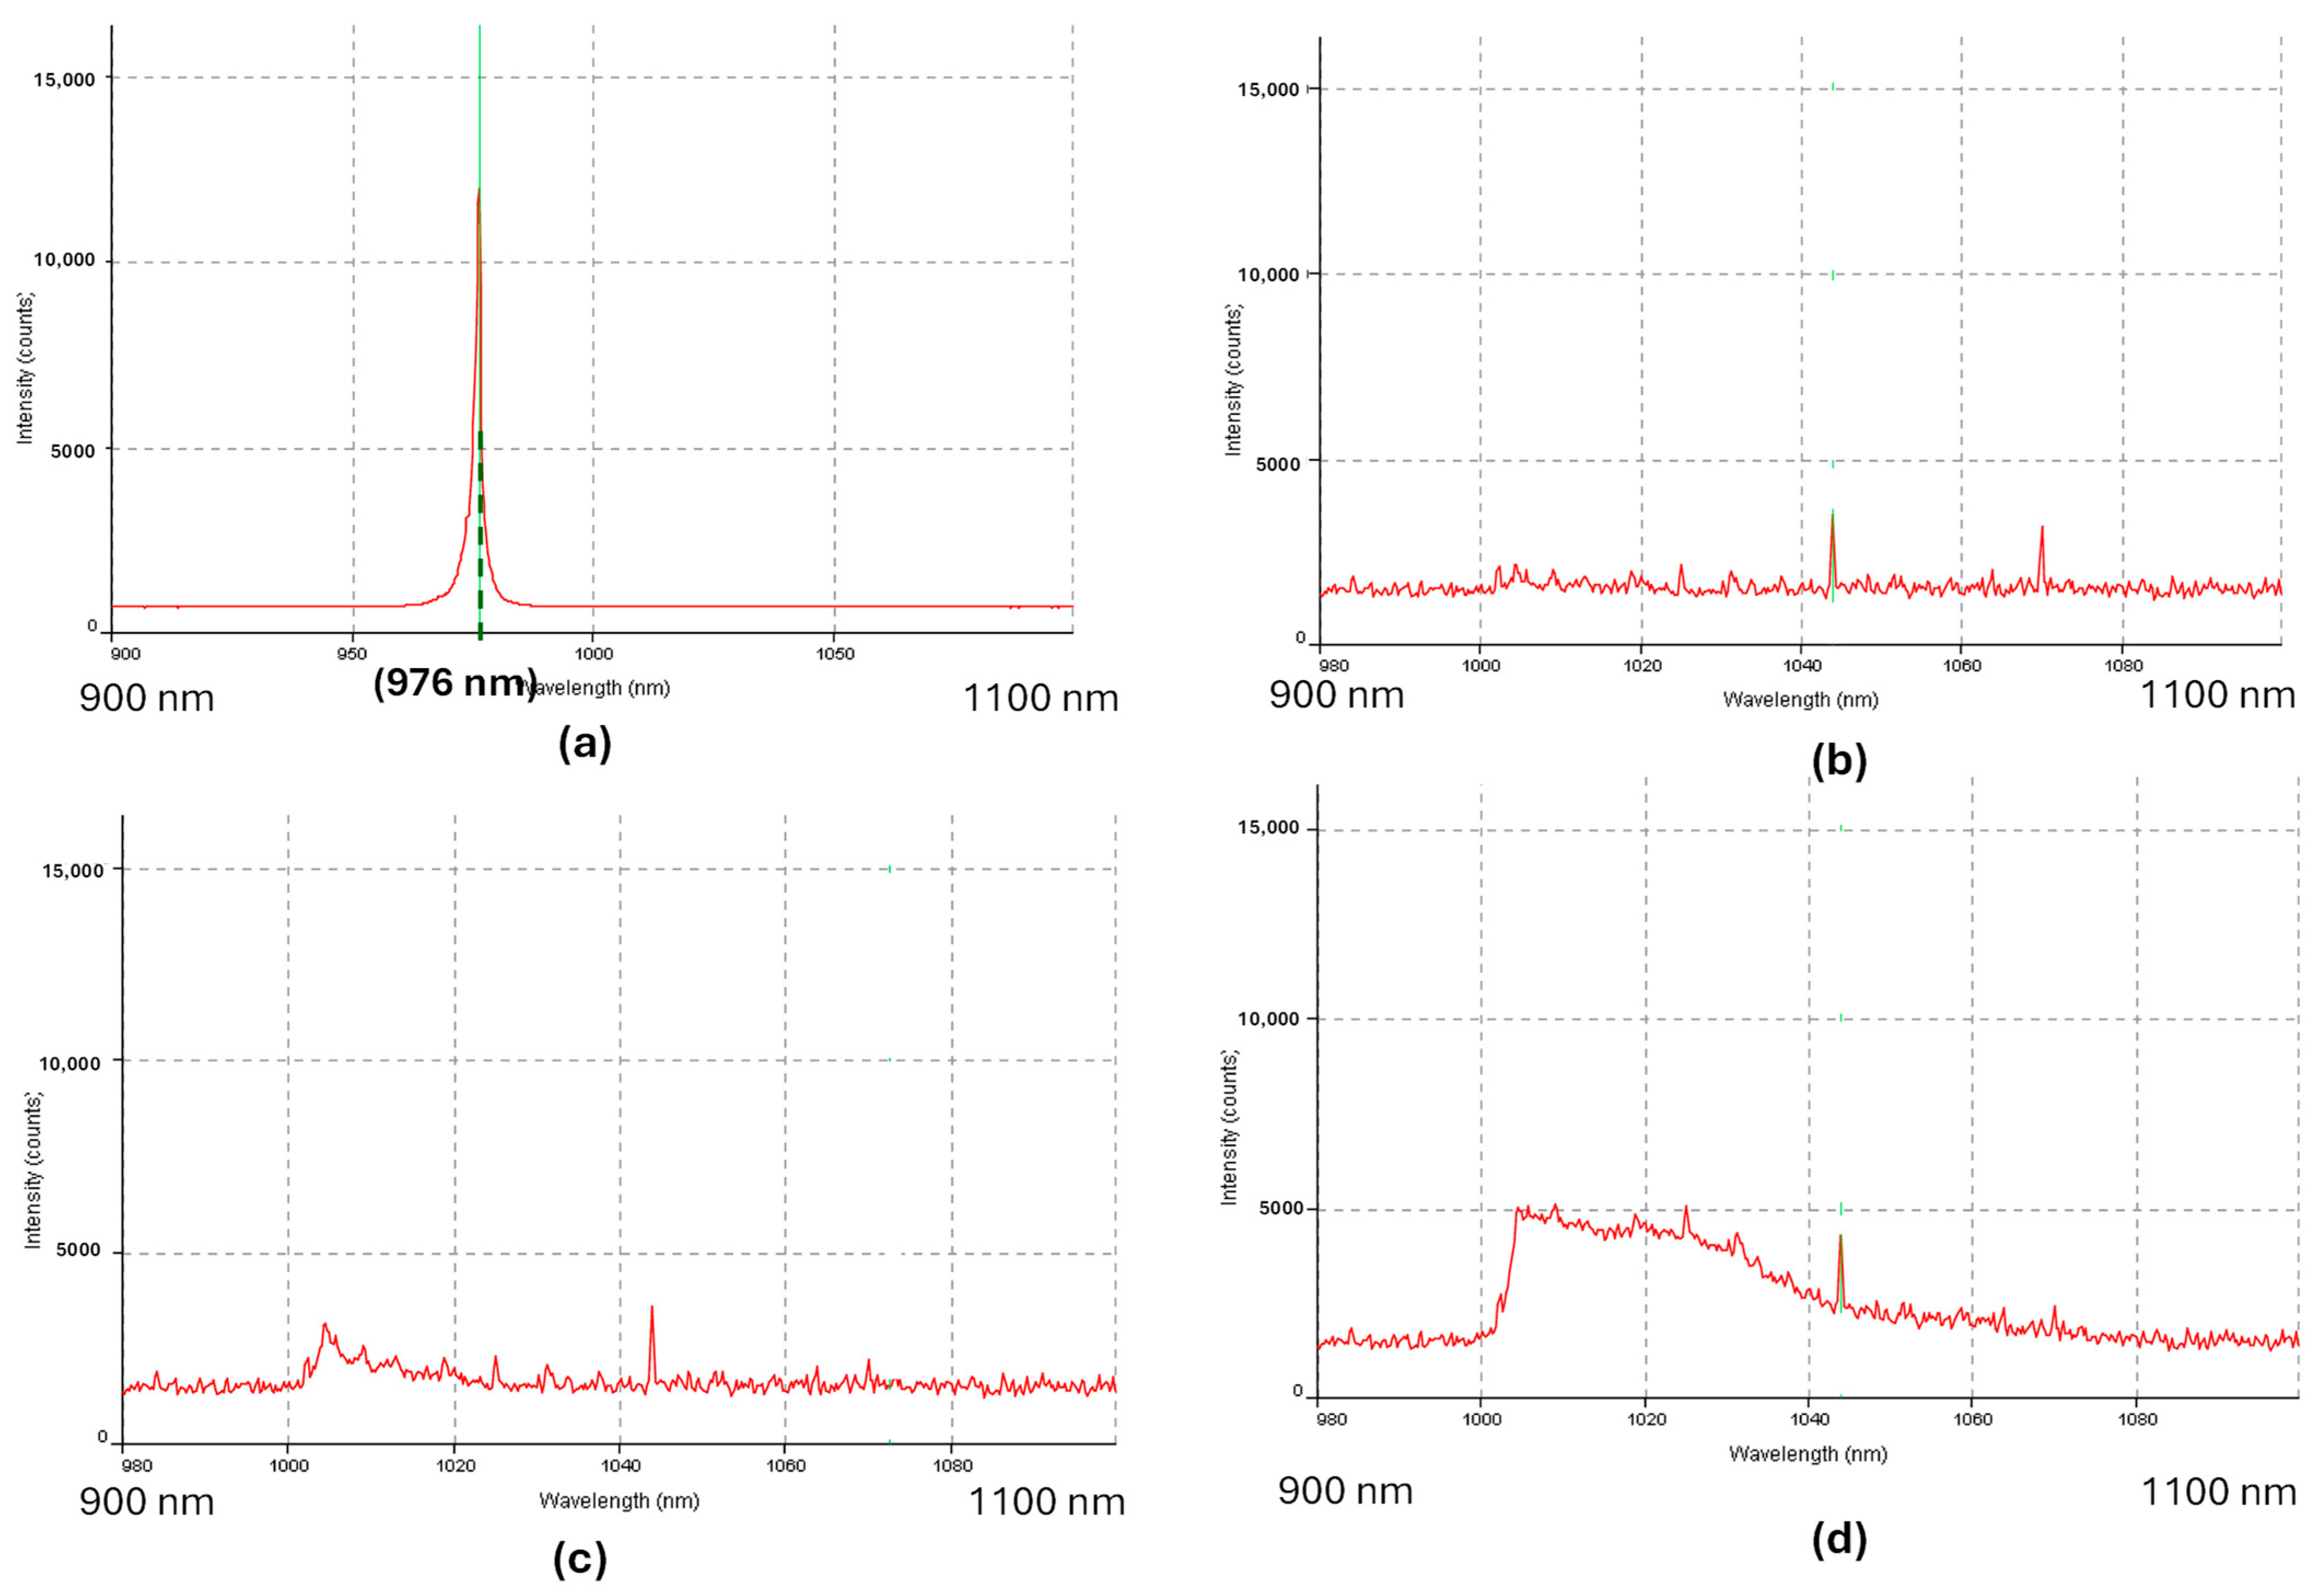
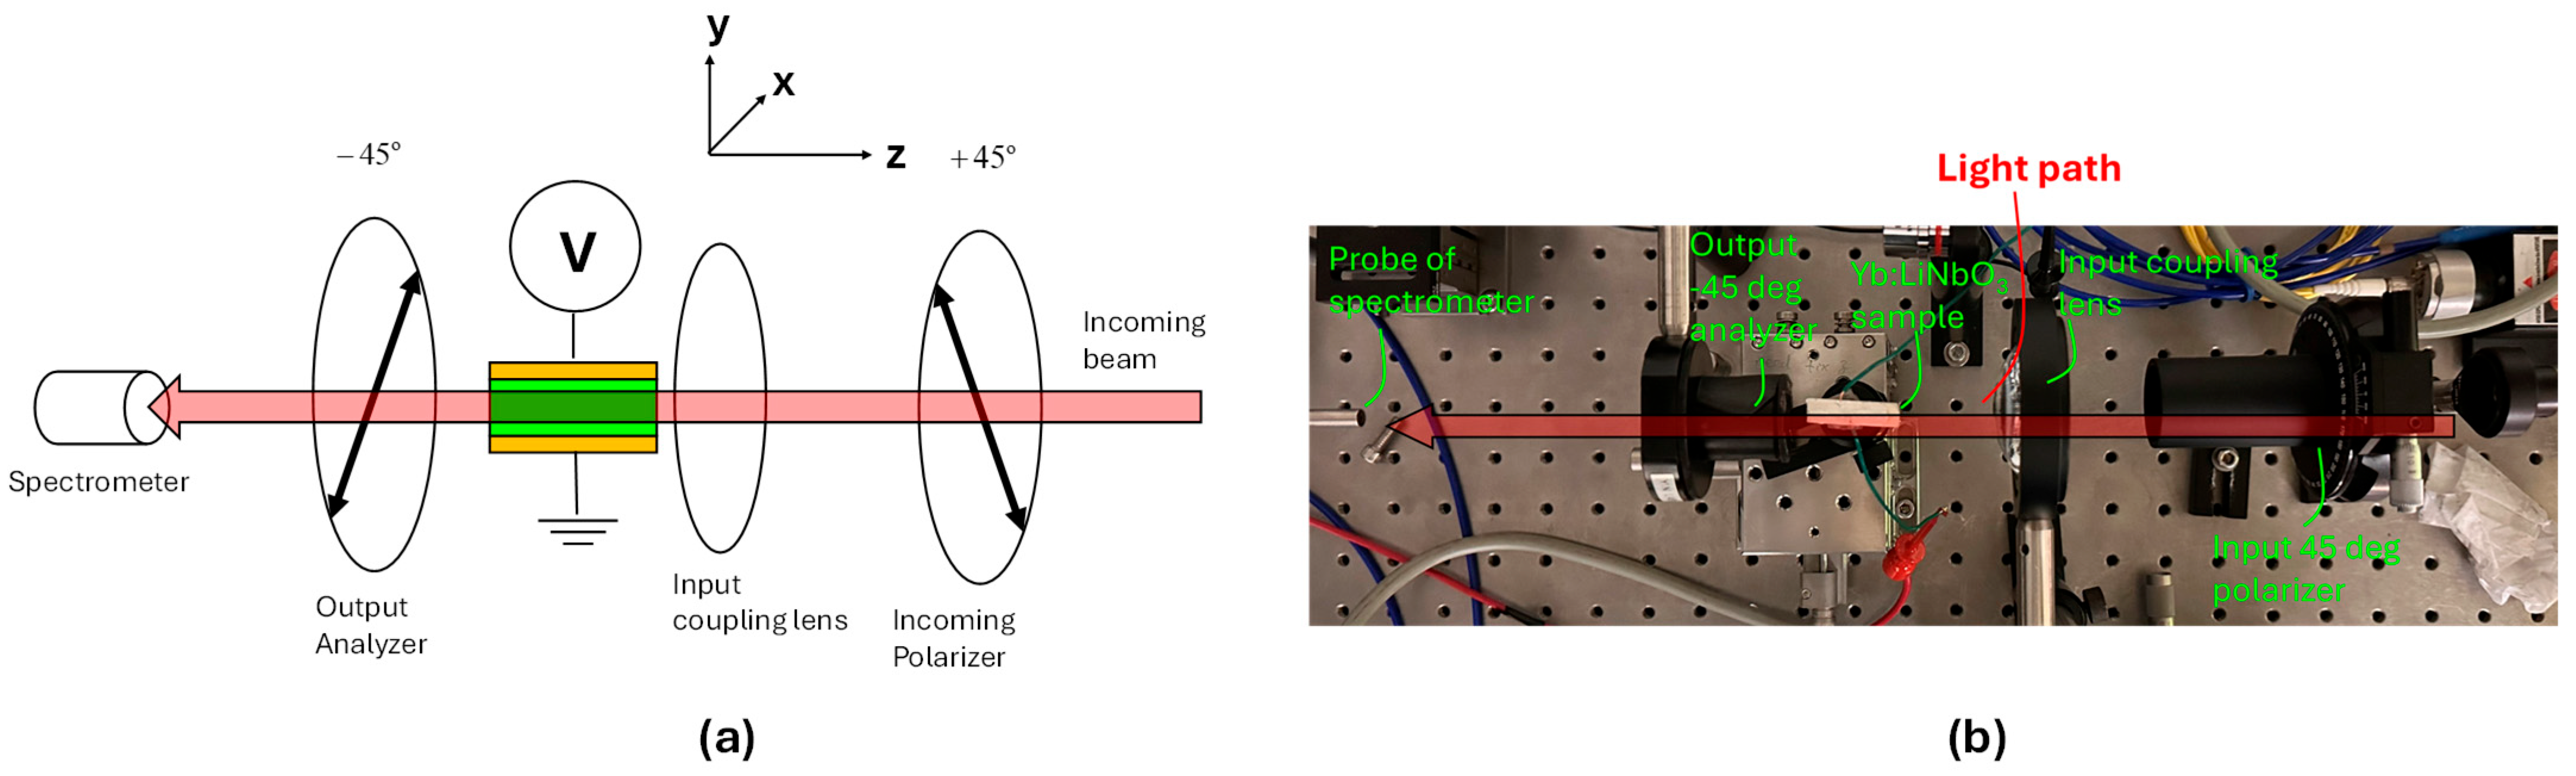
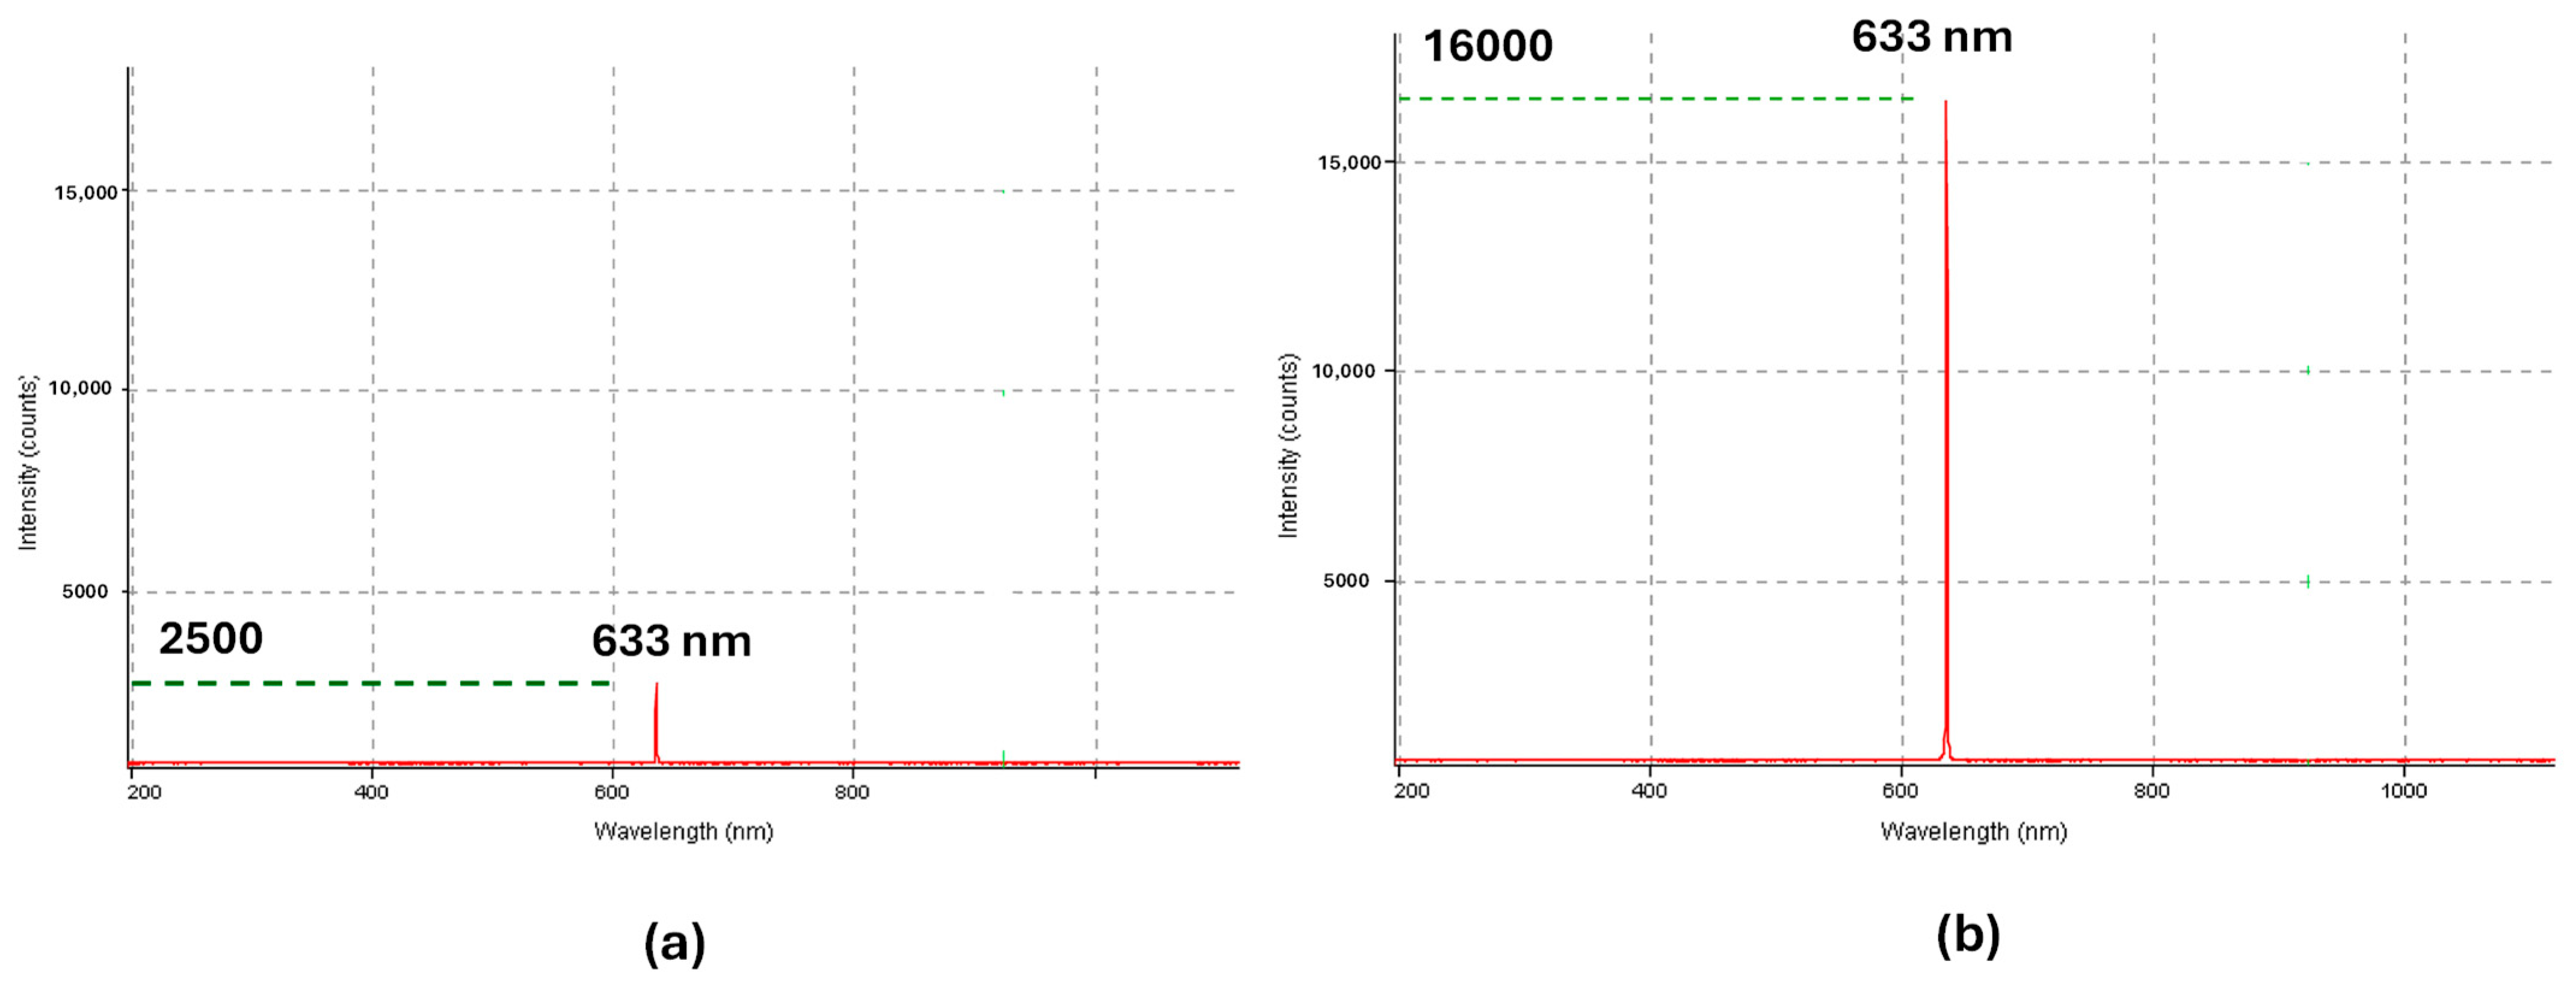
3.6. Investigate the Electro-Optic Effect of the Grown Yb:LiNbO3 Crystal Sample

To ensure that the Yb:LiNbO3 crystal can be an electrically tunable lasing medium, we investigated the electro-optic effect of the grown Yb:LiNbO3 crystal sample. Figure 8a,b shows the diagram and corresponding picture of the setup for measuring the electro-optic effect of the grown Yb:LiNbO3 crystal sample, which is composed of (1) a 633 nm laser diode, model MCLS635 made by Thorlabs, (2) an input polarizer with a 45 deg orientation, (3) an input coupling objective, (4) a Yb:LiNbO3 crystalline bar with dimensions of 2 mm × 2 mm × 30 mm, (5) an output analyzer with a −45 deg orientation, (6) a HR4000 spectrometer, and (7) a PS350 high voltage power supply source, made by Stanford Research System. A pair of silver electrodes was coated on the top and bottom of the Yb:LiNbO3 crystalline bar. The c-axis of the crystalline bar was along the long direction (i.e., in the z-direction). The input light is also coupled in the long direction of the Yb:LiNbO3 crystalline bar. The electric voltage/field was applied in the y-direction, as shown in Figure 8a.
In this case, the refractive index changes as a function of applied electric field can be described by the following electro-optic matrix [24].
Δ 1 / n x 2 Δ 1 / n y 2 Δ 1 / n z 2 Δ 1 / n y z 2 Δ 1 / n x z 2 Δ 1 / n x y 2 = 0 r 22 r 13 0 r 22 r 13 0 0 r 33 0 r 51 0 r 51 0 0 r 22 0 0 0 E y 0 ,
where rij are the linear electro-optic coefficients and Ey is the magnitude of the electric field applied in the y-direction. Based on Equation (1), the refractive index changes for the x and y-polarized light beams can be derived as
Δ n x = 1 2 r 22 n o 3 E y = 1 2 r 22 n o 3 V d ,
Δ n y = 1 2 r 22 n o 3 E y = 1 2 r 22 n o 3 V d ,
where n o is the ordinary refractive index without the applied electric field, V is the applied voltage, and d is the distance between the two electrodes. Based on Equations (2) and (3), the half-wave voltage, V π , for introducing a π phase difference between the x and y polarized light beams can be derived as
V π = λ · d 2 · r 22 · n o 3 · L ,
where λ is the wavelength of the light and L is the length of the Yb:LiNbO3 crystalline bar. Substituting λ = 633   n m ,   d = 2   m m ,   r 22 = 6.8   p m / V ,   n o = 2.286 and L = 30   m m into Equation (4), we obtain V π = 260   V .
To verify this electro-optic effect, first, we measured the output light intensity without the applied electric field, as shown in Figure 9a. One can see that the light intensity is very low at the wavelength of 633 nm. The light is not totally canceled out by the +45 deg and −45 deg polarizers because the beam is not a perfectly collimated beam. The beam coupled into the Yb:LiNbO3 bar is a focused beam with divergence. Then, we applied an electric voltage to the sample. The output light intensity increases as the voltage increases. The maximum light intensity is achieved when 250 V is applied, which is close to the computed half-wave voltage. Figure 9b shows the experimentally measured light intensity when a 250 V voltage was applied. One can clearly see a significant increase, from 2500 counts to 16,000 counts. This experimental result confirms that the electro-optic coefficients of high doping concentration (2.1 at%) Yb:LiNbO3 is close to the value of pure LiNbO3. Thus, the high concentration Yb:LiNbO3 can still be an electrically tunable lasing medium.

4. Discussion

As discussed in detail in Section 3, the grown Yb:LiNbO3 has both the anticipated absorption/emission spectra as well as the expected electro-optic effect. Since absorption and emission spectra are close, it can be a low quantum defect electrically tunable lasing medium, as discussed below.
The quantum defect, η q d , is defined as the percentage of energy loss due to the difference in the photon energies between the excitation photon and emission photon, as given by
η q d = 1 λ e x λ e m ,
where λ e x and λ e m are the excitation and emission wavelengths, respectively. In Yb:LiNbO3, λ e x = 976   n m , corresponding to the wavelength of the exciting pump source, as shown in Figure 7a; and λ e m = 1020   n m , corresponding to the central wavelength of the emission peak, as shown in Figure 7d. The quantum defect becomes η q d = 1 976 / 1020 4.3 % , which is considered low.
This low quantum defect electrically tunable lasing medium can be very useful for a variety of laser applications. One example is an electrically wavelength-tunable laser, as illustrated in Figure 10. In this case, a pair of volume Bragg gratings can be inscribed in the Yb:LiNbO3 crystal (e.g., via femtosecond laser inscription). By applying the voltage, the resonant wavelength of the Bragg grating can be tuned. The amount of the resonant wavelength shift can be derived as
Δ λ B = 2 Λ · Δ n ( E ) m ,
where Λ is the grating period, Δ n ( E ) is the electric field-induced refractive index change, and m denotes the order of Bragg diffraction. Since external wavelength tuning devices are not needed, the Yb:LiNbO3-based wavelength tunable laser offers many advantages, including fast tuning speed, small footprint, and high robustness.
The other examples are compact electrically tunable phase and/or amplitude tunable lasers. Figure 11 shows a compact laser, in which the phase can be electrically tuned. This compact laser is composed of (1) a Yb:LiNbO3 crystalline bar, (2) a pair of electrodes and corresponding voltage source, (3) a dichroic filter that transmits pump beam and reflects lasing beam, (4) an output coupler that partially reflects laser beam, and (5) corresponding pump laser source. By applying an electric field, the phase of the laser beam can be tuned via the electro-optic effect, as given by Equation (1).
Figure 12 shows a compact laser, in which the output amplitude and intensity can be electrically tuned. This compact laser is composed of (1) a Yb:LiNbO3 crystalline bar, (2) a pair of electrodes and corresponding voltage source, (3) a dichroic filter that transmits pump beam and reflects lasing beam, (4) an output coupler that partially reflects laser beam, (5) corresponding pump laser source, and (6) a pair of polarizers mounted on the input and output end surfaces. The input polarizer is at +45 deg and the output polarizer is at −45 deg. By applying a half-wave voltage on and off, as given by Equation (3), the amplitude/intensity of the output lasing beam can be controlled/modulated.

5. Conclusions

In conclusion, high-quality, high doping concentration (2.1 at%) ytterbium-doped lithium niobate crystals (Yb:LiNbO3) could be grown by the Czochralski crystal growth method. To ensure that ytterbium ions could be uniformly dispersed into the melt, the temperature of the melt was maintained at a temperature of 1300 °C, which was about 50o C higher than the melting temperature of the lithium niobate. We also quantitatively characterized the major properties of the grown Yb:LiNbO3 crystal, including the density, the material composition, the crystal structure, the absorption and emission spectra, and the electro-optic effect. The experimental results confirmed that the grown Yb:LiNbO3 crystal had all the theoretically predicted properties. For example, it had strong absorptions at 955 nm and 980 nm, respectively. It also had a near-flat broad emission within the spectral range of 1004–1030 nm when excited at 980 nm wavelength. Such a near-flat broad emission can be very helpful for realizing ultrafast (femtosecond) lasing. Thus, it could be used as a low-quantum defect ultrafast lasing medium. Furthermore, the experimentally measured electro-optic effect of the grown Yb:LiNbO3 crystal was close to the theoretical value that was calculated based on the pure lithium niobate. This experimental result confirmed that the ytterbium doping did not affect the electro-optic effect of the lithium niobate crystal even at a high doping concentration (2.1 at%) level. Thus, a highly doped Yb:LiNbO3 crystal could also be an effective tunable lasing medium, which could be very useful for a variety of applications such as small footprint, fast tuning speed, high robustness phase, amplitude, and wavelength tunable lasers.

Author Contributions

Conceptualization, S.Y.; methodology, K.W. and S.Y.; validation, K.W., M.A.K., and K.-t.C. All authors have read and agreed to the published version of the manuscript.

Funding

This research received no external funding.

Informed Consent Statement

This research does not involve humans.

Data Availability Statement

The original contributions presented in this study are included in the article. Further inquiries can be directed to the corresponding author.

Conflicts of Interest

The authors declare no conflicts of interest.

References

  1. Duarte, F.J. Tunable Laser Applications, 3rd ed.; CRC Press: Boca Raton, FL, USA, 2016; pp. 1–428. [Google Scholar]
  2. Ren, Y.; Xiong, B.; Yu, Y.; Lou, K.; Chu, T. Widely and fast tunable external cavity laser on the thin film lithium niobate platform. Opt. Commun. 2024, 559, 130415. [Google Scholar] [CrossRef]
  3. Pisarski, W.A. Rare earth doped glasses/ceramics: Synthesis, structure, properties and their optical applications. Materials 2022, 15, 8099. [Google Scholar] [CrossRef] [PubMed]
  4. Brenier, A.; Boulon, G. Overview of the best Yb3+-doped laser crystals. J. Alloy Compd. 2001, 323–324, 210–213. [Google Scholar] [CrossRef]
  5. Huang, Q.; Fang, Z.; Wang, Z.; Zhu, Y.; Liu, J.; Zhou, Y.; Yu, J.; Wang, M.; Cheng, Y. On-chip tunable single-mode high-power narrow-linewidth Fabry–Perot microcavity laser on Yb3+-doped thin-film lithium niobate. Photon. Res. 2025, 13, 935–940. [Google Scholar] [CrossRef]
  6. Liu, X.; Chen, C.; Ge, R.; Wu, J.; Chen, X.; Chen, Y. Ultralow-Threshold Lithium Niobate Photonic Crystal Nanocavity Laser. Nano Lett. 2025, 25, 6454–6460. [Google Scholar] [CrossRef]
  7. Zhu, D.; Shao, L.; Yu, M.; Cheng, R.; Desiatov, B.; Xin, C.; Hu, Y.; Holzgrafe, J.; Ghosh, S.; Shams-Ansari, A.; et al. Integrated photonics on thin-film lithium niobate. Adv. Opt. Photon. 2021, 13, 242–352. [Google Scholar] [CrossRef]
  8. Luo, Q.; Yang, C.; Hao, Z.; Zhang, R.; Ma, R.; Zheng, D.; Liu, H.; Yu, X.; Gao, F.; Bo, F.; et al. Integrated ytterbium-doped lithium niobate microring lasers. Opt. Lett. 2022, 47, 1427–1430. [Google Scholar] [CrossRef]
  9. Guo, Q.; Gutierrez, B.; Sekine, R.; Gray, R.; Williams, J.; Ledezma, L.; Costa, L.; Roy, A.; Zhou, S.; Liu, M.; et al. Ultrafast Mode-Locked Laser in Nanophotonic Lithium Niobate. Science 2023, 382, 708–713. [Google Scholar] [CrossRef]
  10. Bredillet, K.; Riporto, F.; Guo, T.; Dhouib, A.; Multian, V.; Monnier, V.; Figueras Llussà, P.; Beauquis, S.; Bonacina, L.; Mugnier, Y.; et al. Dual second harmonic generation and up-conversion photoluminescence emission in highly-optimized LiNbO3 nanocrystals doped and co-doped with Er3+ and Yb3+. Nanoscale 2024, 16, 6739–6747. [Google Scholar] [CrossRef]
  11. Palatnikov, M.N.; Kadetova, A.V.; Aleshina, L.A.; Sidorova, O.V.; Sidorove, N.V.; Biryukova, L.V.; Makarova, O.V. Growth, structure, physical and chemical characteristics in a series of LiNbO3:Er crystals of different composition grown in one technological cycle. Opt. Laser Technol. 2022, 147, 107671. [Google Scholar] [CrossRef]
  12. Bruesselbach, H.; Sumida, D.S. A 2.65-kW Yb:YAG single-rod laser. IEEE J. Sel. Top. Quantum Electron. 2005, 11, 600–603. [Google Scholar] [CrossRef]
  13. Yoshikawa, A.; Boulon, G.; Laversenne, L.; Canibano, H.; Lebbou, K.; Collombet, A.; Guyot, Y.; Fukuda, T. Growth and spectroscopic analysis of Yb3+-doped Y3Al5O12 fiber single crystals. J. Appl. Phys. 2003, 94, 5479–5488. [Google Scholar] [CrossRef]
  14. Sokolska, I.; Pracka, I.; Lukasiewicz, T. Growth and spectroscopic properties of LiNbO3 single crystals doped with Nd3+ and Yb3+ ions. J. Cryst. Growth 1999, 198–199, 521–525. [Google Scholar] [CrossRef]
  15. Tsuboi, T.; Kaczmarek, S.; Boulon, G. Spectral properties of Yb3+ ions in LiNbO3 single crystals: Influences of other rare-earth ions, OH− ions, and γ-irradiation. J. Alloy Compd. 2004, 380, 196–200. [Google Scholar] [CrossRef]
  16. Bodziony, T.; Kaczmarek, S. New low symmetry centres of Yb3+ impurities in lithium niobate single crystal. Opt. Mater. 2007, 29, 1440–1446. [Google Scholar] [CrossRef]
  17. Bodziony, T.; Kaczmarek, S.; Hanuza, J. EPR and optical studies of LiNbO3: Yb and LiNbO3: Yb, Pr single crystals. J. Alloy Compd. 2008, 451, 240–247. [Google Scholar] [CrossRef]
  18. Bodziony, T.; Kaczmarek, S.; Rudowicz, C. Temperature dependence of the EPR lines in weakly doped LiNbO3:Yb—Possible evidence of Yb3+ ion pairs formation. Phys. B Condens. Matter 2008, 403, 207–218. [Google Scholar] [CrossRef]
  19. Boulon, G. Why so deep rearch on Yb3+—Doped optical inorganic materials? J. Alloy Compd. 2008, 451, 1–11. [Google Scholar] [CrossRef]
  20. Boudour, B.; Boumaiza, Y.; Boudour, A. Growth of Yb3+ doped LiNbO3 crystals using laser heated pedestal growth method. Am. J. Appl. Sci. 2014, 11, 759–763. [Google Scholar] [CrossRef]
  21. Wu, K.; Kabir, M.; Chou, K.; Yin, S. Growth of Multifunctional Electro-Optic Yb:LiNbO3 Crystalline Fibers by Laser Heated Pedestal Growth (LHPG) Method. In Photonic Fiber and Crystal Devices: Advances in Materials and Innovations in Device Applications XVIII; Proc. SPIE: San Diego, CA, USA, 2024; Volume 1314007. [Google Scholar]
  22. Lee, S.; Kim, Y.; Cho, S.; Yoon, E. The Influence of the Czochralski Growth Parameters on the Growth of Lithium Niobate Single Crystals. J. Cryst. Growth 1992, 125, 175–180. [Google Scholar] [CrossRef]
  23. Abrahams, S.; Reddy, S.; Bernstein, J. Ferroelectric lithium niobate. Single crystal X-ray diffraction study at 24 °C. J. Phys. Chem. Solids 1966, 27, 997–1012. [Google Scholar] [CrossRef]
  24. Yariv, A.; Yeh, P. Optical Waves in Crystals: Propagation and Control of Laser Radiation; Wiley-Interscience: New York, NY, USA, 1984; pp. 1–604. [Google Scholar]
Figure 1. Pictures of grown Yb:LiNbO3 crystals: (a) A rectangularly shaped Yb:LiNbO3 crystal bar with dimensions of 2 mm × 2mm × 30 mm; (b) The corresponding Yb:LiNbO3 crystal bar with added top and bottom electrodes. The bottom electrode is mounted on an alumina ceramic bar for ease of handling.
Crystals 15 00486 g001
Figure 2. EDS results of the grown Yb:LiNbO3 sample: (a) EDS image of the grown Yb:LiNbO3 sample; (b) The element mapping of O, Nb, and Yb; (c) Map sum spectrum; (d) Element percentage distribution of Yb:LiNbO3 sample.
Crystals 15 00486 g002
Figure 3. The XRD result of the grown Yb:LiNbO3 crystal with dimensions of 2 mm × 2 mm × 30 mm. The c-axis of the crystal bar is along the long 30 mm direction.
Crystals 15 00486 g003
Figure 4. The output spectral profile of the broadband Ando AQ-4303B white light source.
Crystals 15 00486 g004
Figure 5. The experimentally measured absorption spectrum of the Yb:LiNbO3 crystalline bar exhibits an absorption peak centered at 980 nm and a relatively broad absorption peak centered at 955 nm.
Crystals 15 00486 g005
Figure 6. A sketch of energy levels of Yb:LiNbO3 [16].
Crystals 15 00486 g006
Figure 7. The measured emission spectrum of Yb:LiNbO3 crystalline bar: (a) The output spectral profile of exciting laser diode source centered at 976 nm with an output power of 200 mW; (b) The measured emission spectrum of air; (c) The measured emission spectrum of a pure LiNbO3 crystalline bar, and (d) The measured emission spectrum of the Yb:LiNbO3 crystalline bar.
Crystals 15 00486 g007
Figure 8. The experimental setup for measuring the electro-optic (EO) effect of the Yb:LiNbO3 (Yb:LN) crystal. (a) A sketch of the experimental setup and (b) the corresponding picture of the experimental setup.
Crystals 15 00486 g008
Figure 9. The experimentally measured light intensities with and without applied voltage: (a) Without applied voltage and (b) With 250 V applied voltage.
Crystals 15 00486 g009
Figure 10. An illustration of a possible configuration of an electrically wavelength-tunable laser based on Yb:LiNbO3 crystal.
Crystals 15 00486 g010
Figure 11. An illustration of a possible configuration of a compact laser based on the Yb:LiNbO3 crystalline bar, in which the phase of the output laser beam can be modulated by the applied electric field.
Crystals 15 00486 g011
Figure 12. An illustration of a possible configuration of a compact laser Yb:LiNbO3 crystalline bar, in which the amplitude/phase of the output laser beam can be modulated by the applied electric field.
Crystals 15 00486 g012
Disclaimer/Publisher’s Note: The statements, opinions and data contained in all publications are solely those of the individual author(s) and contributor(s) and not of MDPI and/or the editor(s). MDPI and/or the editor(s) disclaim responsibility for any injury to people or property resulting from any ideas, methods, instructions or products referred to in the content.

