Article

A Rare Yellow Diamond: Reconstruction of the Possible Geological History

by
Isabella Pignatelli
1,* and
Cristiano Ferraris
2
1
CNRS, Centre de Recherches Pétrographiques et Géochimiques (CRPG), Université de Lorraine, 54000 Nancy, France
2
Institut de Minéralogie, de Physique des Matériaux et de Cosmochimie, UMR 7590, Museum National d’Histoire Naturelle, CP 52, 61 rue Buffon, 75005 Paris, France
*
Author to whom correspondence should be addressed.
Crystals 2025, 15(5), 461; https://doi.org/10.3390/cryst15050461
Submission received: 29 April 2025 / Revised: 11 May 2025 / Accepted: 13 May 2025 / Published: 14 May 2025
(This article belongs to the Section Mineralogical Crystallography and Biomineralization)

Abstract

:
In this study, a rare 3.49-carat yellow diamond was analyzed to reconstruct the geological processes that led to its distinctive form. The diamond exhibits growth and dissolution features, indicating a complex history. To preserve the sample’s integrity, non-destructive analytical techniques—including VIS, UV–Vis–NIR, and IR spectroscopy—were employed. The yellow coloration of the diamond is attributed to the presence of N3 and N2 defects. Additionally, other defects such as N3VH0 centers and platelets were detected; however, the latter do not contribute to the coloration. The observations of the etch pits and surface microreliefs suggest that the diamond underwent size reduction due to dissolution events, which also altered its crystal habit over time. The diamond’s initial mixed-habit morphology evolved into a more complex one through a series of growth and dissolution processes that began during mantle storage. Furthermore, the presence of brown surface stains indicates radiation damage, likely acquired during its residence in alluvial deposits at the Earth’s surface.

1. Introduction

The diverse morphologies of natural diamonds reflect their complex geological history. Consequently, numerous studies have examined diamonds’ features to better understand the growth and dissolution processes that occur from crystallization in the mantle until transport to the surface. Over time, differing interpretations of certain features—most notably trigons and the origin of dodecahedral diamond—have led to scientific debate. However, experimental studies have significantly contributed to resolving these controversies by providing deeper insights into the observed characteristics. These experimental investigations have been conducted under a range of conditions, including variations in pressure, temperature, redox state, and water content, to assess the influence of chemical and physical parameters on diamonds’ features. While many studies have focused on the morphological evolution of diamonds [1], others have concentrated on surface microrelief [2,3]. These efforts have enabled the development of dissolution pathways that trace the journey of natural diamonds from their mantle source to the Earth’s surface under varying environmental conditions [4].
Thus, the existing literature provides valuable insights for reconstructing a diamond’s geological history, even in cases where its exact provenance remains unknown. This approach was applied in the present study to investigate a rare and exquisite yellow diamond from a private collection.

2. Materials and Methods

This 3.49-carat yellow diamond is part of a private American collection. Its provenance remains unknown and it resurfaced in early 2020, just before the global pandemic, from a private vault in Antwerp—the heart of the world’s diamond trade in Belgium’s Flemish Region. It was subsequently acquired by a private collector in India before making its way to the United States in 2024.
The yellow diamond has a rounded form with a diameter of ~0.7 cm and it is characterized by particular surface micrographs (Figure 1). No solid inclusions were observed. These features make it an interesting and unique sample. We had the opportunity to analyze it over a very short period of time with non-destructive techniques in order to preserve its integrity. The used techniques are described below.
Absorption spectra in the ultraviolet to near infrared (UV–Vis–NIR) range were recorded with a Shimadzu 3600 spectrometer (Shimadzu Co., Kyoto, Japan) over a range of 280–1200 nm at room temperature. The measurements were carried out with a spectral slit width of 2 nm and a sampling interval of 0.2 nm.
Infrared absorption spectra were recorded in the mid-infrared (7000–400 cm−1) range at room temperature with a Thermo Nicolet 5600 Fourier-transform infrared (FTIR) spectrometer (Thermo Scientific Co., Waltham, MA, USA), equipped with a KBr beam splitter.
For both techniques, the spectra were recorded in transmission mode. In order to obtain best possible spectra, the sample was mounted such that two parallel flat faces were oriented perpendicular to the probe beam. The resulting rather large beam path through the sample amounted to 7 mm.
Vertical scanning interferometry (VSI) was used to analyze the surface topography of this diamond. This technique allows for the rapid digitizing and processing of the interference patterns to obtain two-dimensional (2D) and three-dimensional (3D) topographical maps of a surface with nanometric resolution (up to 0.1 nm in the z-direction [5]). VSI has already been used for gemological samples, such as rubies, emeralds and gold [6,7]. A Zygo ZeGage Pro HR interferometer (Zygo Corporation, Middlefield, CT, USA) was used to collect images in both unstitched and stitched modes, with a scan length of 100 μm and an acquisition time of 8 section/image. The instrument was fitted with a 5× Michelson objective (numerical aperture = 0.15), 20× and 50× Mirau objectives (NA = 0.4 and 0.55, respectively). The setup permitted the visualization of images with a scanning area between ~0.19 and 2.43 mm2.

3. Results and Discussion

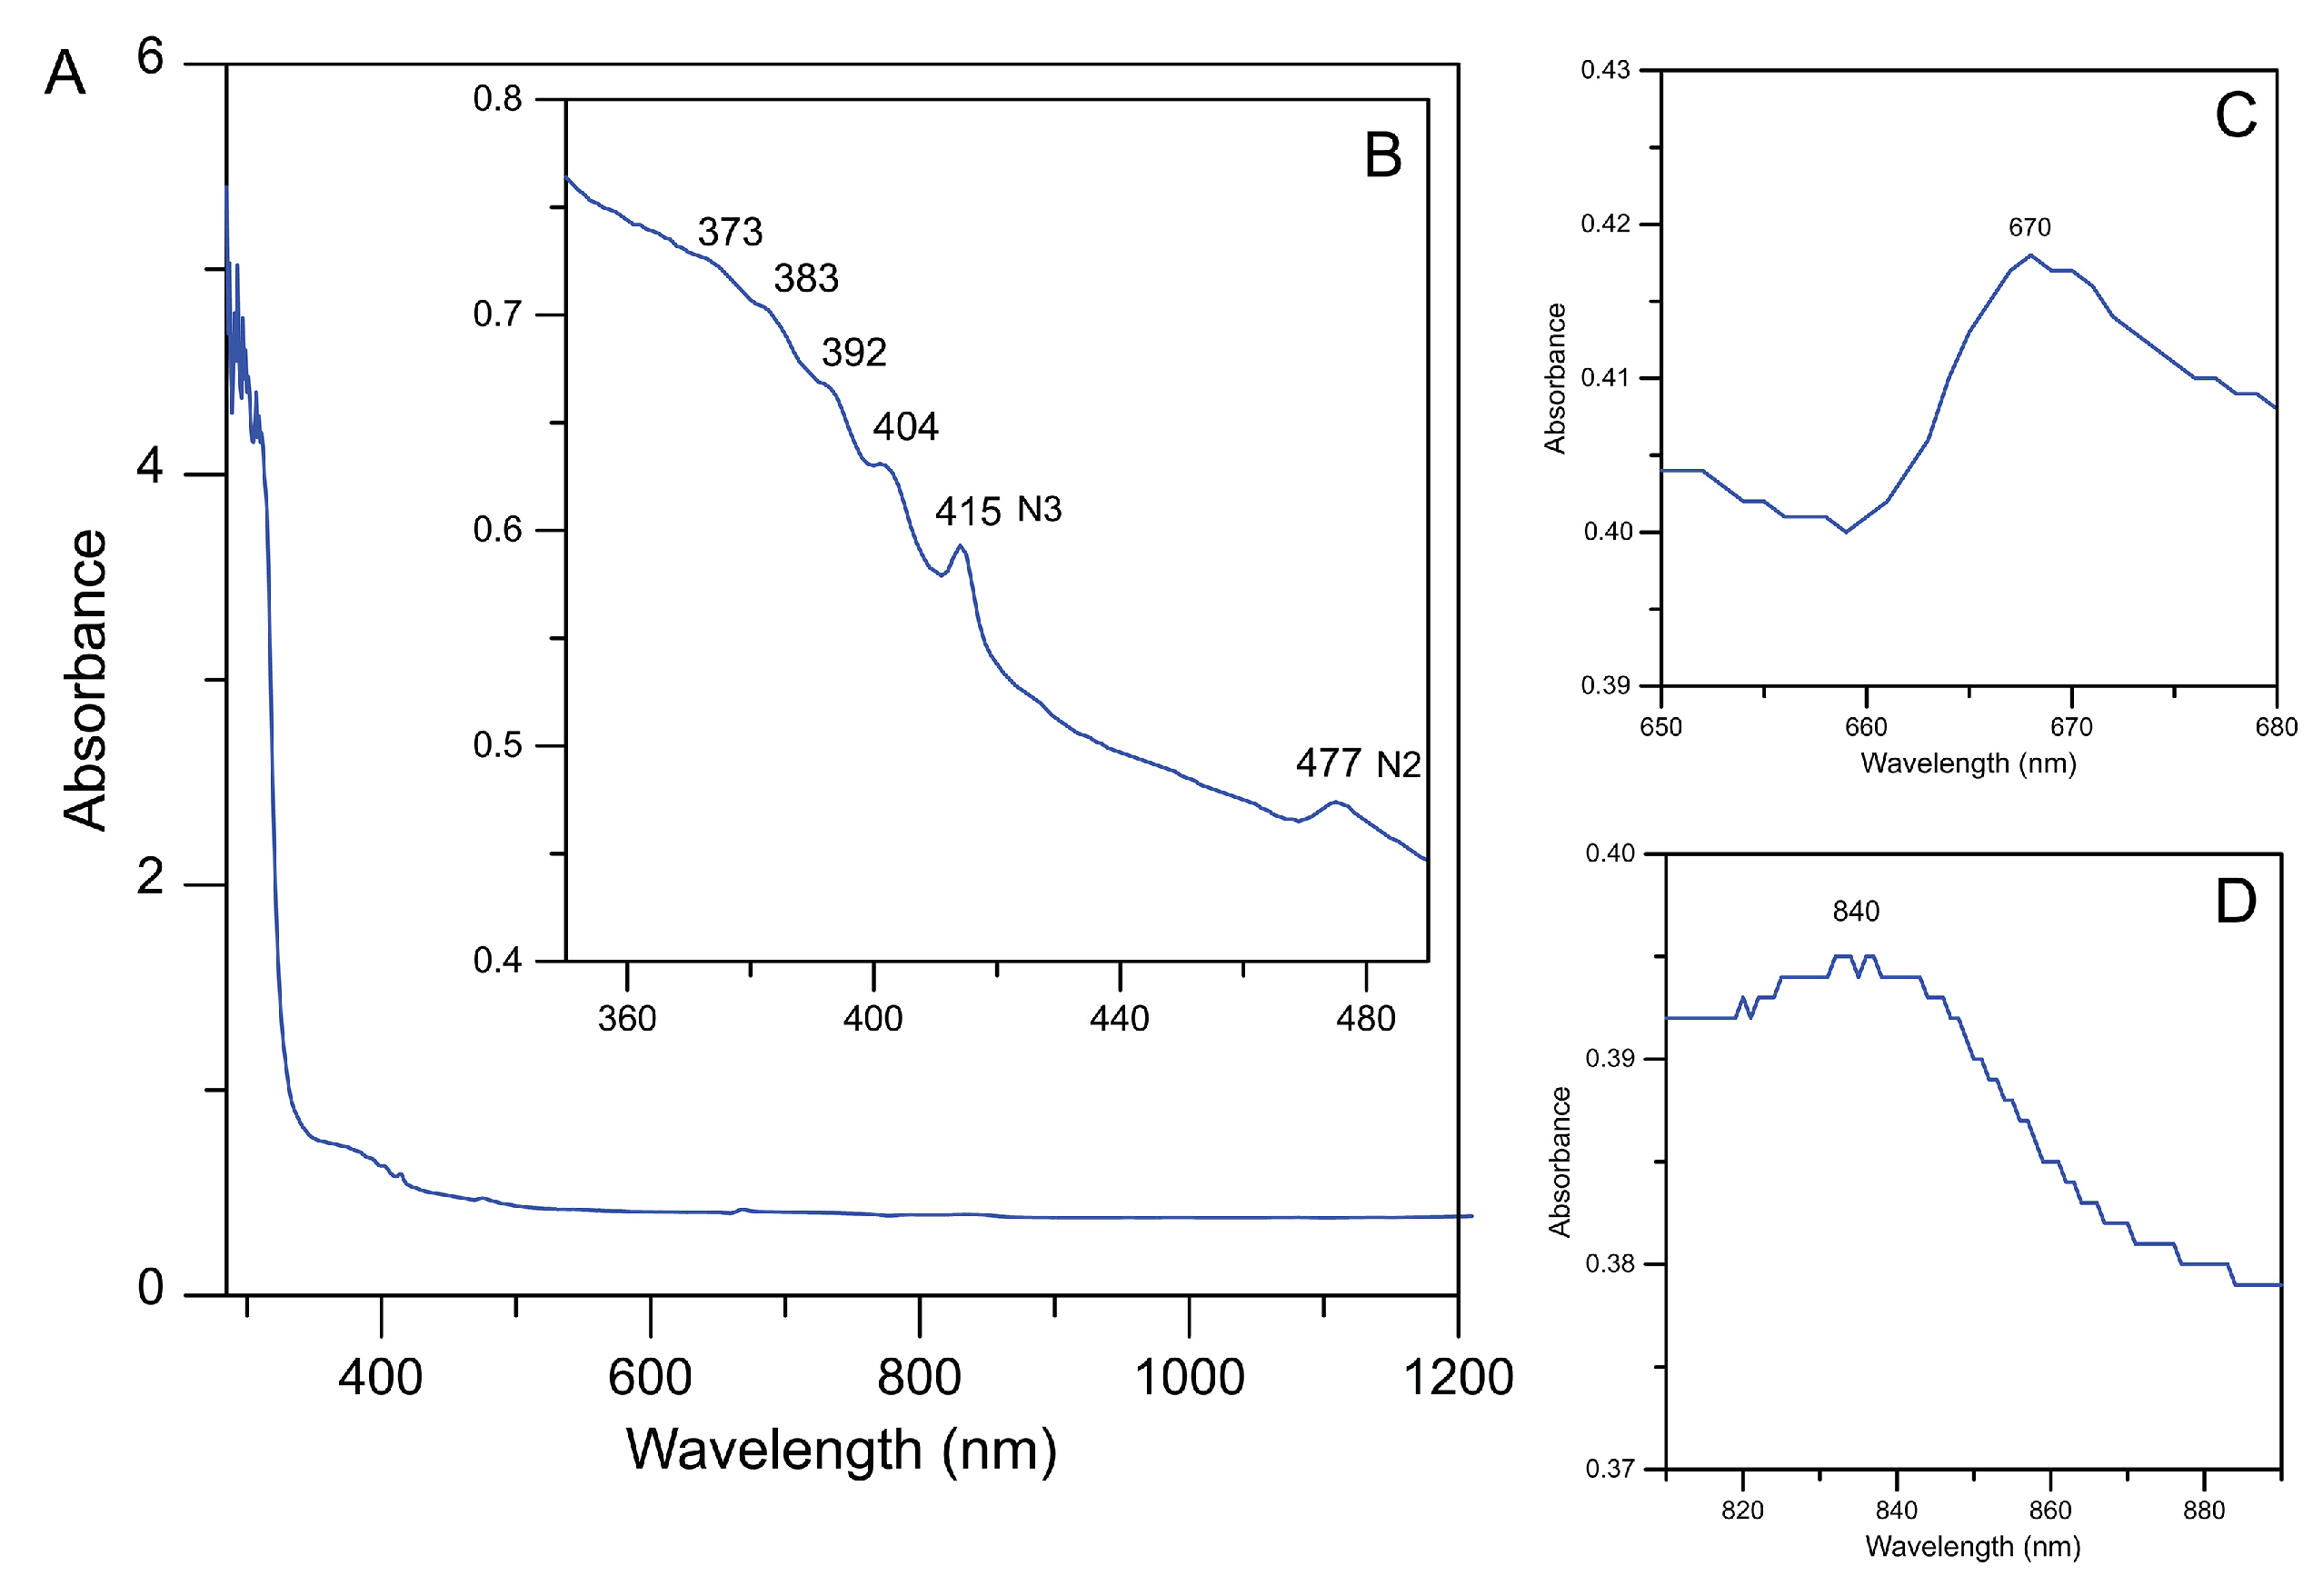
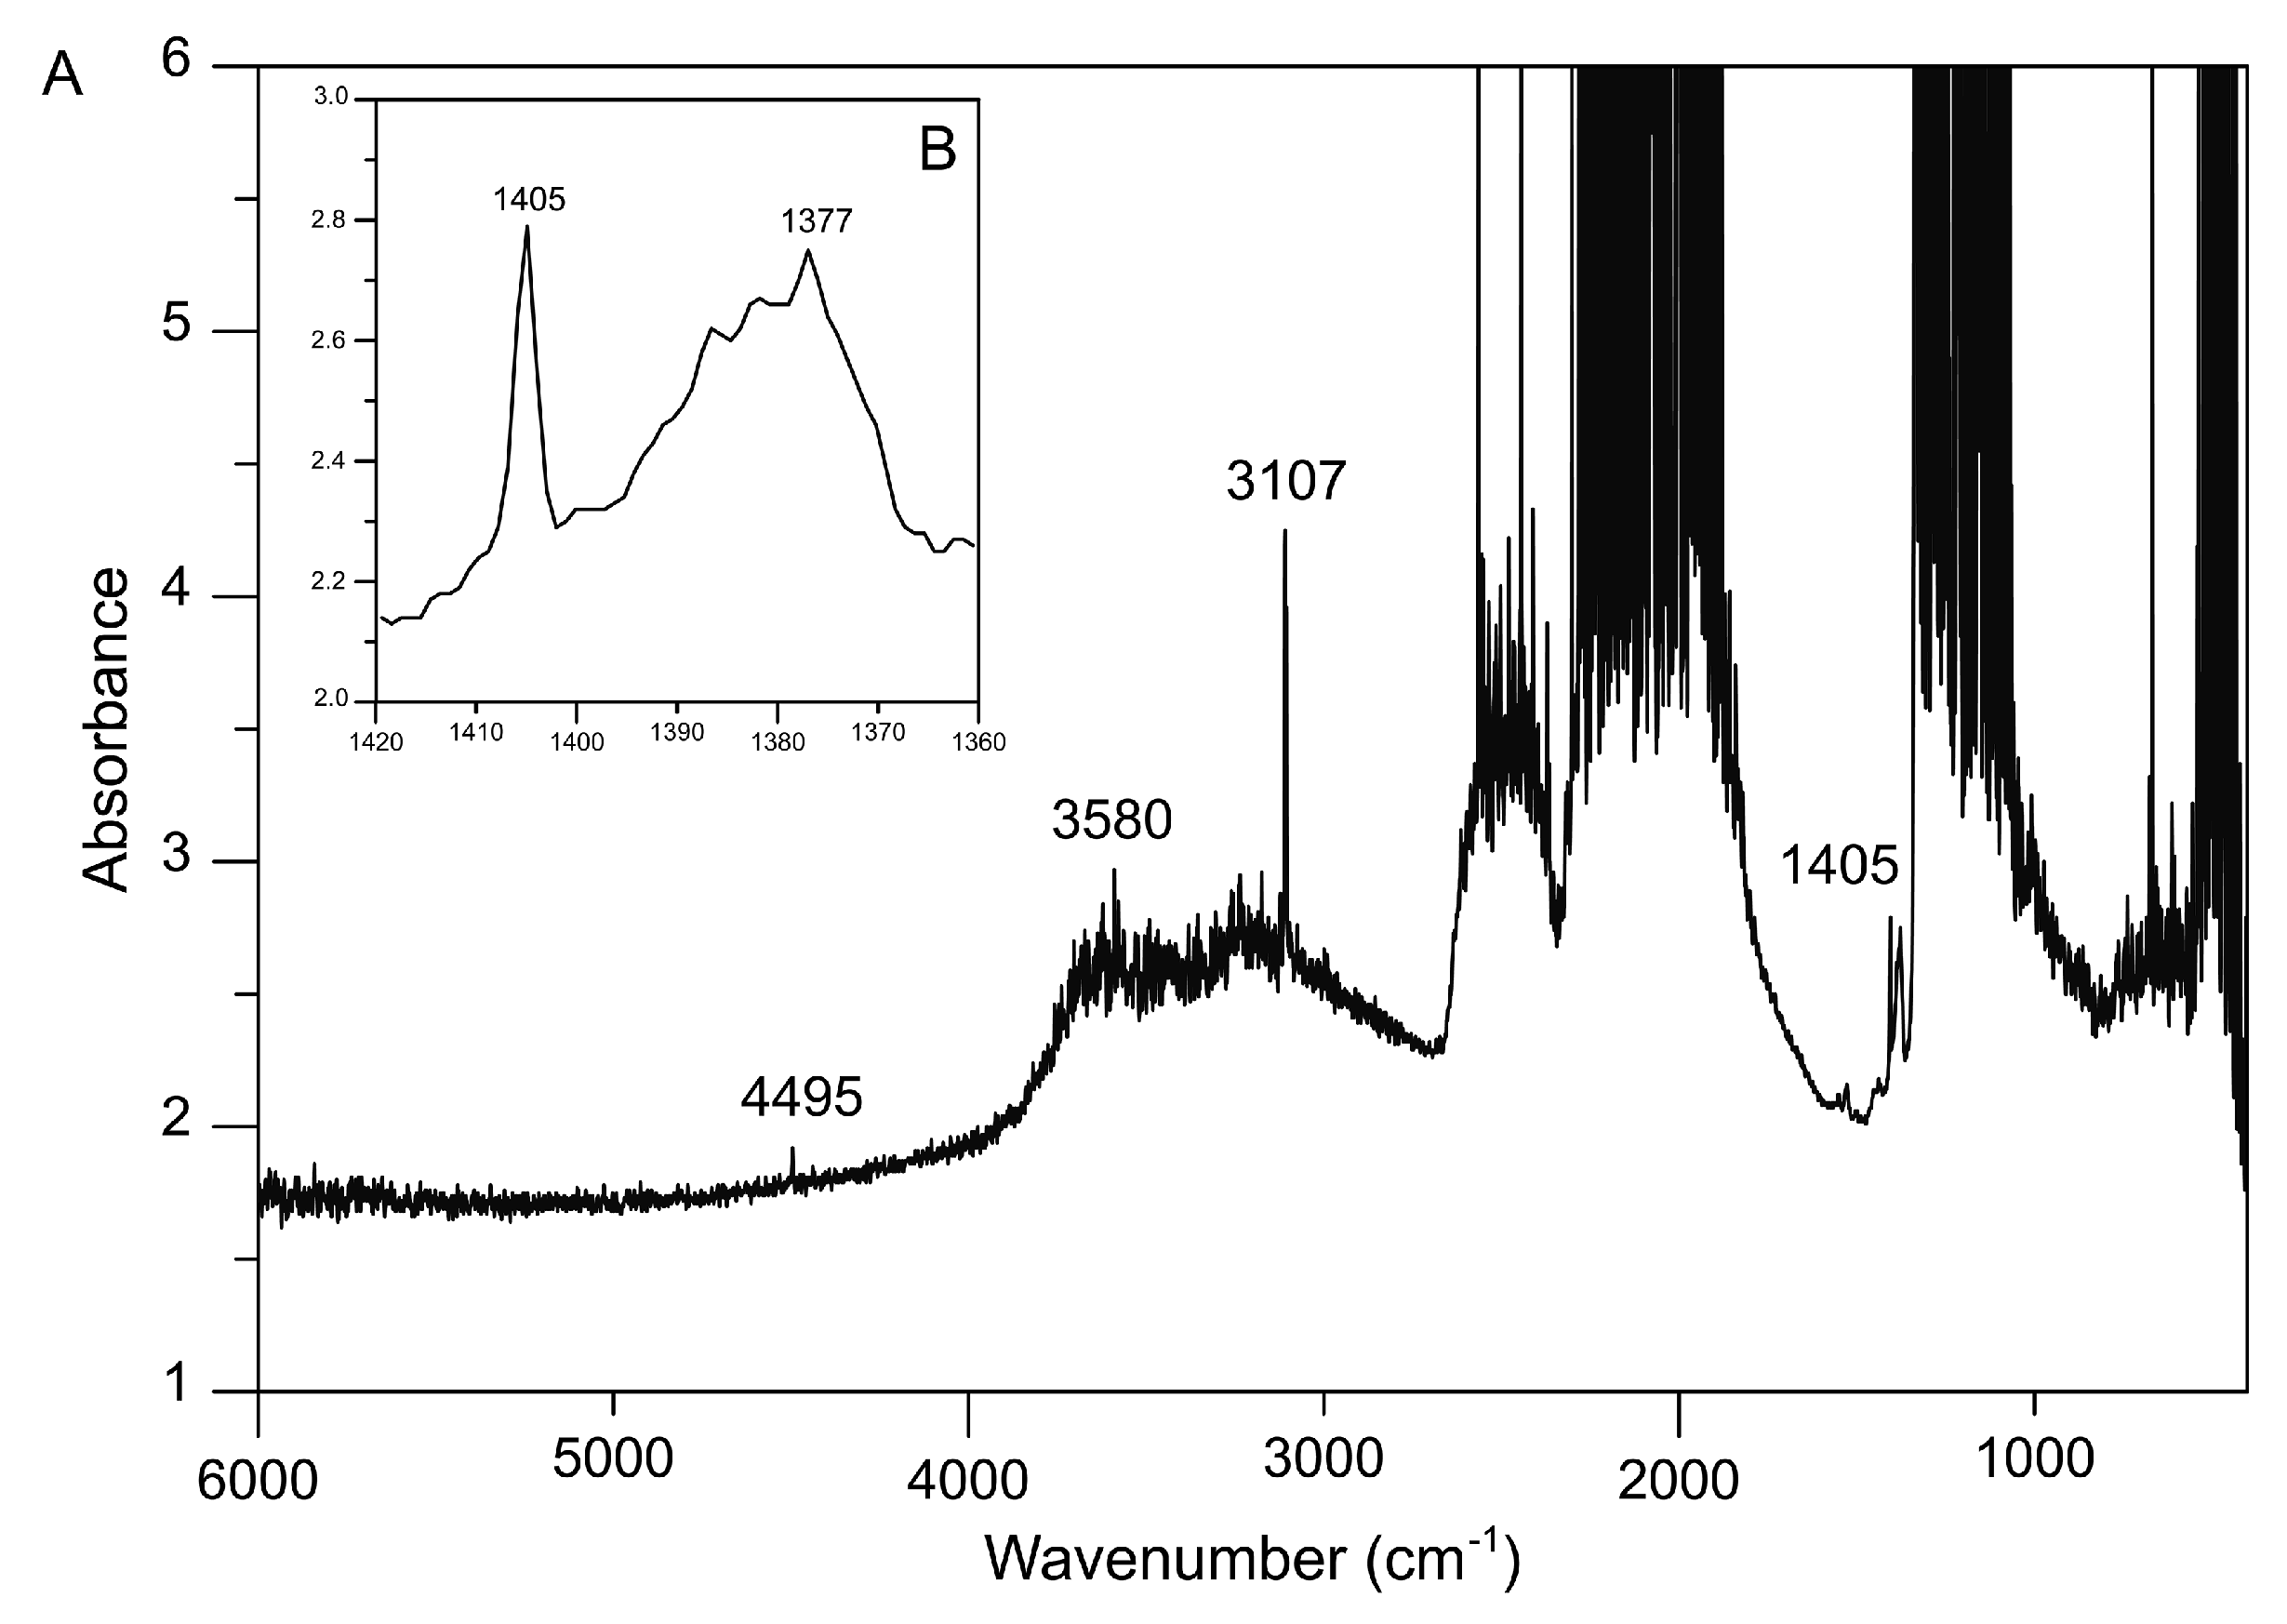
3.1. Spectroscopic Features and Cause of Color
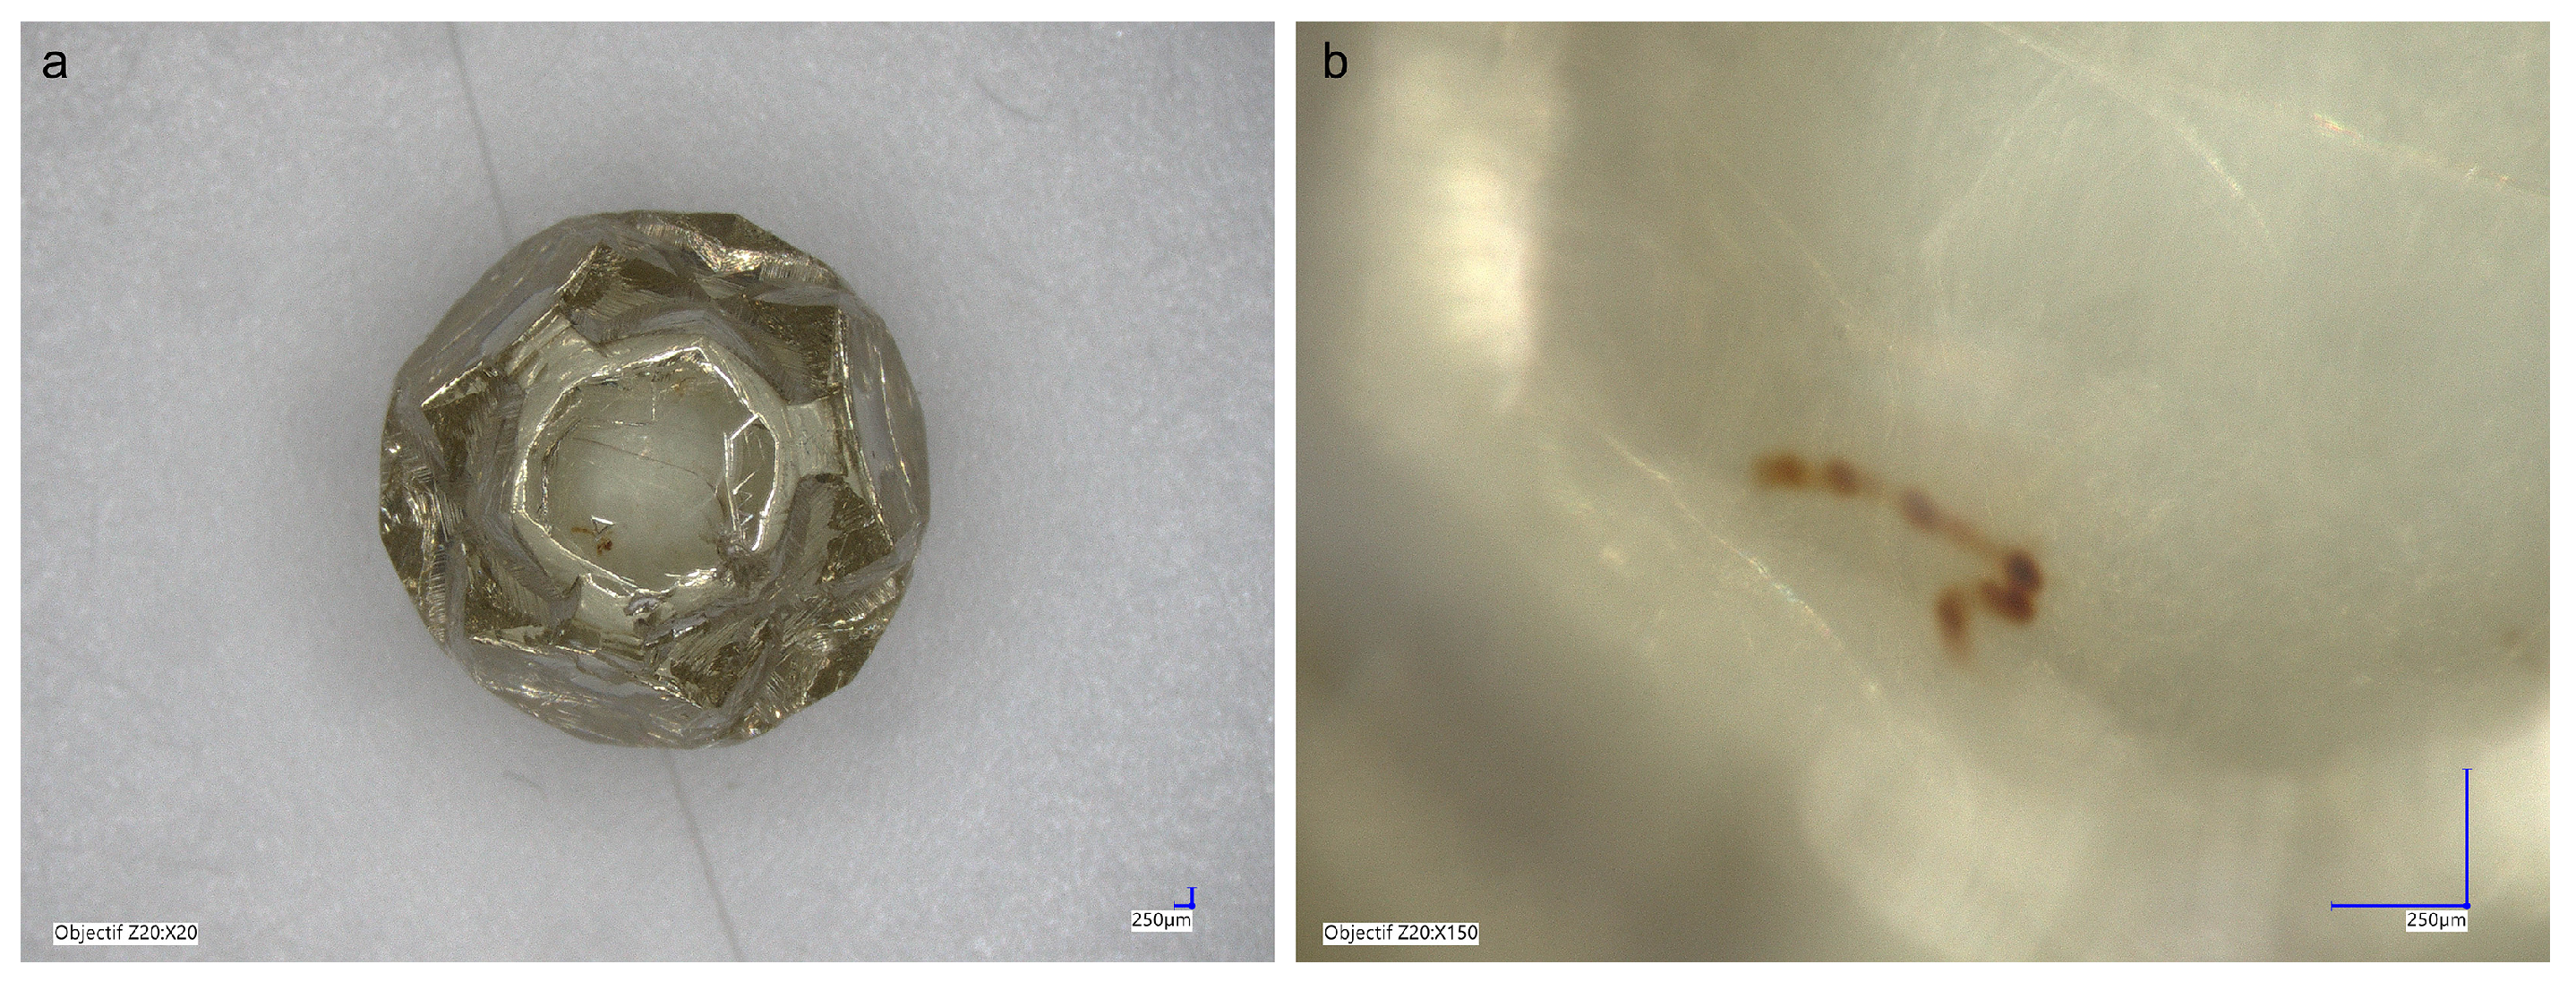
The yellow color of the analyzed diamond arises from absorption in the blue region of the visible spectrum, specifically at wavelengths below 500 nm, which is attributed to nitrogen-related defects (Figure 2A). The absorption feature at 415 nm, along with its associated sidebands at 373, 383, 392, and 404 nm (Figure 2B), corresponds to the N3 center, which consists of three nitrogen atoms adjacent to a vacancy. This center is consistently accompanied by the N2 center, characterized by an absorption band around 478 nm (Figure 2B). The N2 center is a vibronic transition of N3, and they are both always present on the spectra. They are collectively known as “Cape” defects, and the intensity of the yellow color is directly influenced by their concentration in the crystal (if there are no other defects responsible for the color) [8,9].
At longer wavelengths, weak absorption shoulders are observed at 670 and 840 nm (Figure 2C,D). These features are associated with the defect known as the “1330 nm center”, recently identified by [10]. Although the characteristic 1330 nm band falls outside the recorded spectral range of the UV–Vis-NIR spectrum, the observed peaks at 840 and 670 nm can be interpreted as electronic and vibronic components of this defect. The 1330 nm center were attributed to nickel-nitrogen complexes, with no involvement of hydrogen [10]. In cases where the N3 center dominates, the combination of N3/N2 and the 1330 nm center results in a brownish-yellow or even pure yellow color, when the 1330 nm center gives a weaker absorption in comparison to the very strong N3/N2 one. However, the 670 and 840 nm bands appear significantly weaker compared to the prominent N3 and N2 defects, indicating that the 1330 nm center does not substantially contribute to the diamond’s coloration.
Other possible interpretations should be considered for the bands at 670 and 840 nm (Table 1). The band at 670 nm could be related to the NV center typically introduced during irradiation and annealing or to the CI center [11,12]. CI is an interstitial carbon atom whose aggregates form the platelets associates with high levels of nitrogen aggregation [11]. Both bands at 670 and 840 nm could be due to the Ni-related defects, which occur concurrently with nitrogen impurities or other defects in diamonds [13]. It should be noted that the assignments of these two bands remain speculative because we did not use complementary techniques (e.g., electron paramagnetic resonance or photoluminescence) to characterize the related defects in detail.
The infrared (IR) spectrum of the sample exhibits saturation between 2300 and 1900 cm⁻1 as well as 1400 and 1000 cm⁻1 (Figure 3), which prevented the analysis of this spectral range. While high nitrogen concentrations (>1000 ppm) can lead to absorption peaks exceeding the graph’s vertical scale [8], in this instance, the color saturation and the intensity of the 415 nm band in the UV–Vis–NIR spectrum suggest that the saturation is likely due to the sample’s thickness rather than nitrogen concentration. Consequently, normalization to determine nitrogen content was not feasible for this sample. The saturation also hindered an accurate determination of the diamond type; however, the presence of N3/N2 centers requires A to B aggregation, suggesting a classification of type IaAB.
The IR spectrum reveals distinct peaks at 3107 cm⁻1 and 1405 cm⁻1, indicative of hydrogen incorporation (Figure 3). In addition, carbon–hydrogen stretch modes appear between 3300 and 2800 cm⁻1, as commonly observed in other yellow diamonds [8], but this region is quite noisy, as shown in Figure 3A. The 3107 cm⁻1 stretching mode and its corresponding 1405 cm⁻1 bending mode (Figure 3B) are characteristic of the N3VH0 defect, which is frequently found in “Cape” diamonds [14]. According to [15], the IR absorption peak at 3107 cm⁻1 can be used to quantify the N3VH0 defect as follows: [N3VH0] (ppb) = (386 ± 64) I3107 (cm−2), where I3107 is the integrated intensity. This gives a value of around 3.7 ppm of N3VH0 in the analyzed diamond.
When hydrogen is present in sufficient concentrations to produce a sharp peak at 3017 cm⁻1, the diamond is classified as “hydrogen-rich” [9,10]. Hydrogen incorporation is believed to occur during high-temperature annealing processes, which also promote nitrogen aggregation [16].
Additionally, a peak at 1377 cm⁻1 is observed in the IR spectrum (Figure 3B), which aligns with previously reported values for “Cape” diamonds, where this peak typically ranges from 1356 to 1380 cm⁻1 [8,17,18]. This absorption is attributed to extended planar defects known as “platelets”, formed by layers of interstitial carbon and potentially nitrogen atoms [11]. Platelets are by-products of nitrogen aggregation processes [19].

3.2. Habit

The yellow diamond exhibits a rounded equant morphology (Figure 1), characterized by well-developed octahedral {111} faces linked by rounded trisoctahedral {hhl} micro-faces (Figure 1 and Figure 4). The edges of the octahedral faces display a ditrigonal pattern with rounded corners and edges, and their surfaces are marked by the presence of shallow trigons. Between the octahedral faces, stepped microrelief surfaces exist with tetragonal patterns at their center (Figure 1).
Apart from the trigons on octahedral faces and few tetragons at the center of the cube zones, the diamond is a growth form that also displays resorption.
The diamond shape is the result of mixed-habit growth between the octahedral and cube directions, and, in this case, the octahedral direction is clearly dominant. A reconstruction of the diamond’s original habit is presented in Figure 5.
The development of the {111} and {100} faces is influenced by the prevailing pressure–temperature–oxygen fugacity (P-T-fO2) conditions. For instance, cooler temperatures favor the growth of cubic faces on a diamond, whereas higher temperatures and more reducing conditions promote octahedral face formation [20]. Given the prominence of the octahedral faces in the present diamond, it is plausible that, at the initial growth stages, a cubic diamond developed, and the octahedral faces later appeared and became progressively larger, as observed in Siberian diamonds [16]. These authors further noted that cubic growth sectors in diamonds typically exhibit a sharp absorption peak at 3107 cm⁻1 in the FTIR spectra due to the C-H stretch mode, accompanied by additional weaker peaks, such as the one at 1405 cm⁻1, corresponding to the stretch mode of the N3VH0 defect. These spectral features are consistent with those observed in the analyzed sample, reinforcing the hypothesis of an initial cubic growth phase.
According to the growth model proposed by [21] and further refined by subsequent studies, the morphology of the rare yellow diamond likely originated in a hydrous-carbonatitic fluid, where carbon supersaturation was intermediate between the critical supersaturation points σ* and σ**. Under such conditions, a gradual transition from cubic to octahedral growth occurs as carbon supersaturation decreases, leading to the formation of rough cuboid-oriented surfaces and progressively larger octahedral faces [16]. The growth rate of the cubic faces deceased or then stopped, strongly blocked by the adsorption effects of impurities such as N and H [22]. These authors showed that the next stage in diamond shape evolution under the impurity adsorption effect is the inhibition of the ends of the {111} growth layers from the side of edges and vertices of the octahedron and the consequent formation of growing-out pyramids of {111} faces. The side surfaces of these pyramids may correspond to {hhl} faces, as with the present diamond (Figure 1 and Figure 5). The question of the composition of the impurities adsorbed on the diamond surface leading to the morphological changes is still unclear, but the primary cause is the presence of H2O in the growth medium [22].
This growth model does not explain the presence of the microreliefs corresponding to the tetrahexahedral {hk0} faces (Figure 1). In diamonds, this kind of face is usually considered as the result of late-stage dissolution [23]. In fact, they have been observed only during the growth of P-doped HPHT synthetic diamonds [24]. In H2O-bearing melts, progressive dissolution leads to the formation of negative trigons on the {111} faces. If dissolution continues, rounded tetrahexahedral {hk0} can develop, resulting in weight loss and the overall size reduction in the crystal [25]. In the present diamond, the tetrahexahedral faces have been entirely dissolved, as demonstrated by the microrelief surfaces. Experimental studies indicate that tetrahexahedral faces in natural diamonds can form at temperatures of 1100–1450 °C and pressures of 1.0–5.7 GPa through the dissolution of the octahedral and dodecahedral faces in carbonate and silicate melts but only in the presence of water [1].

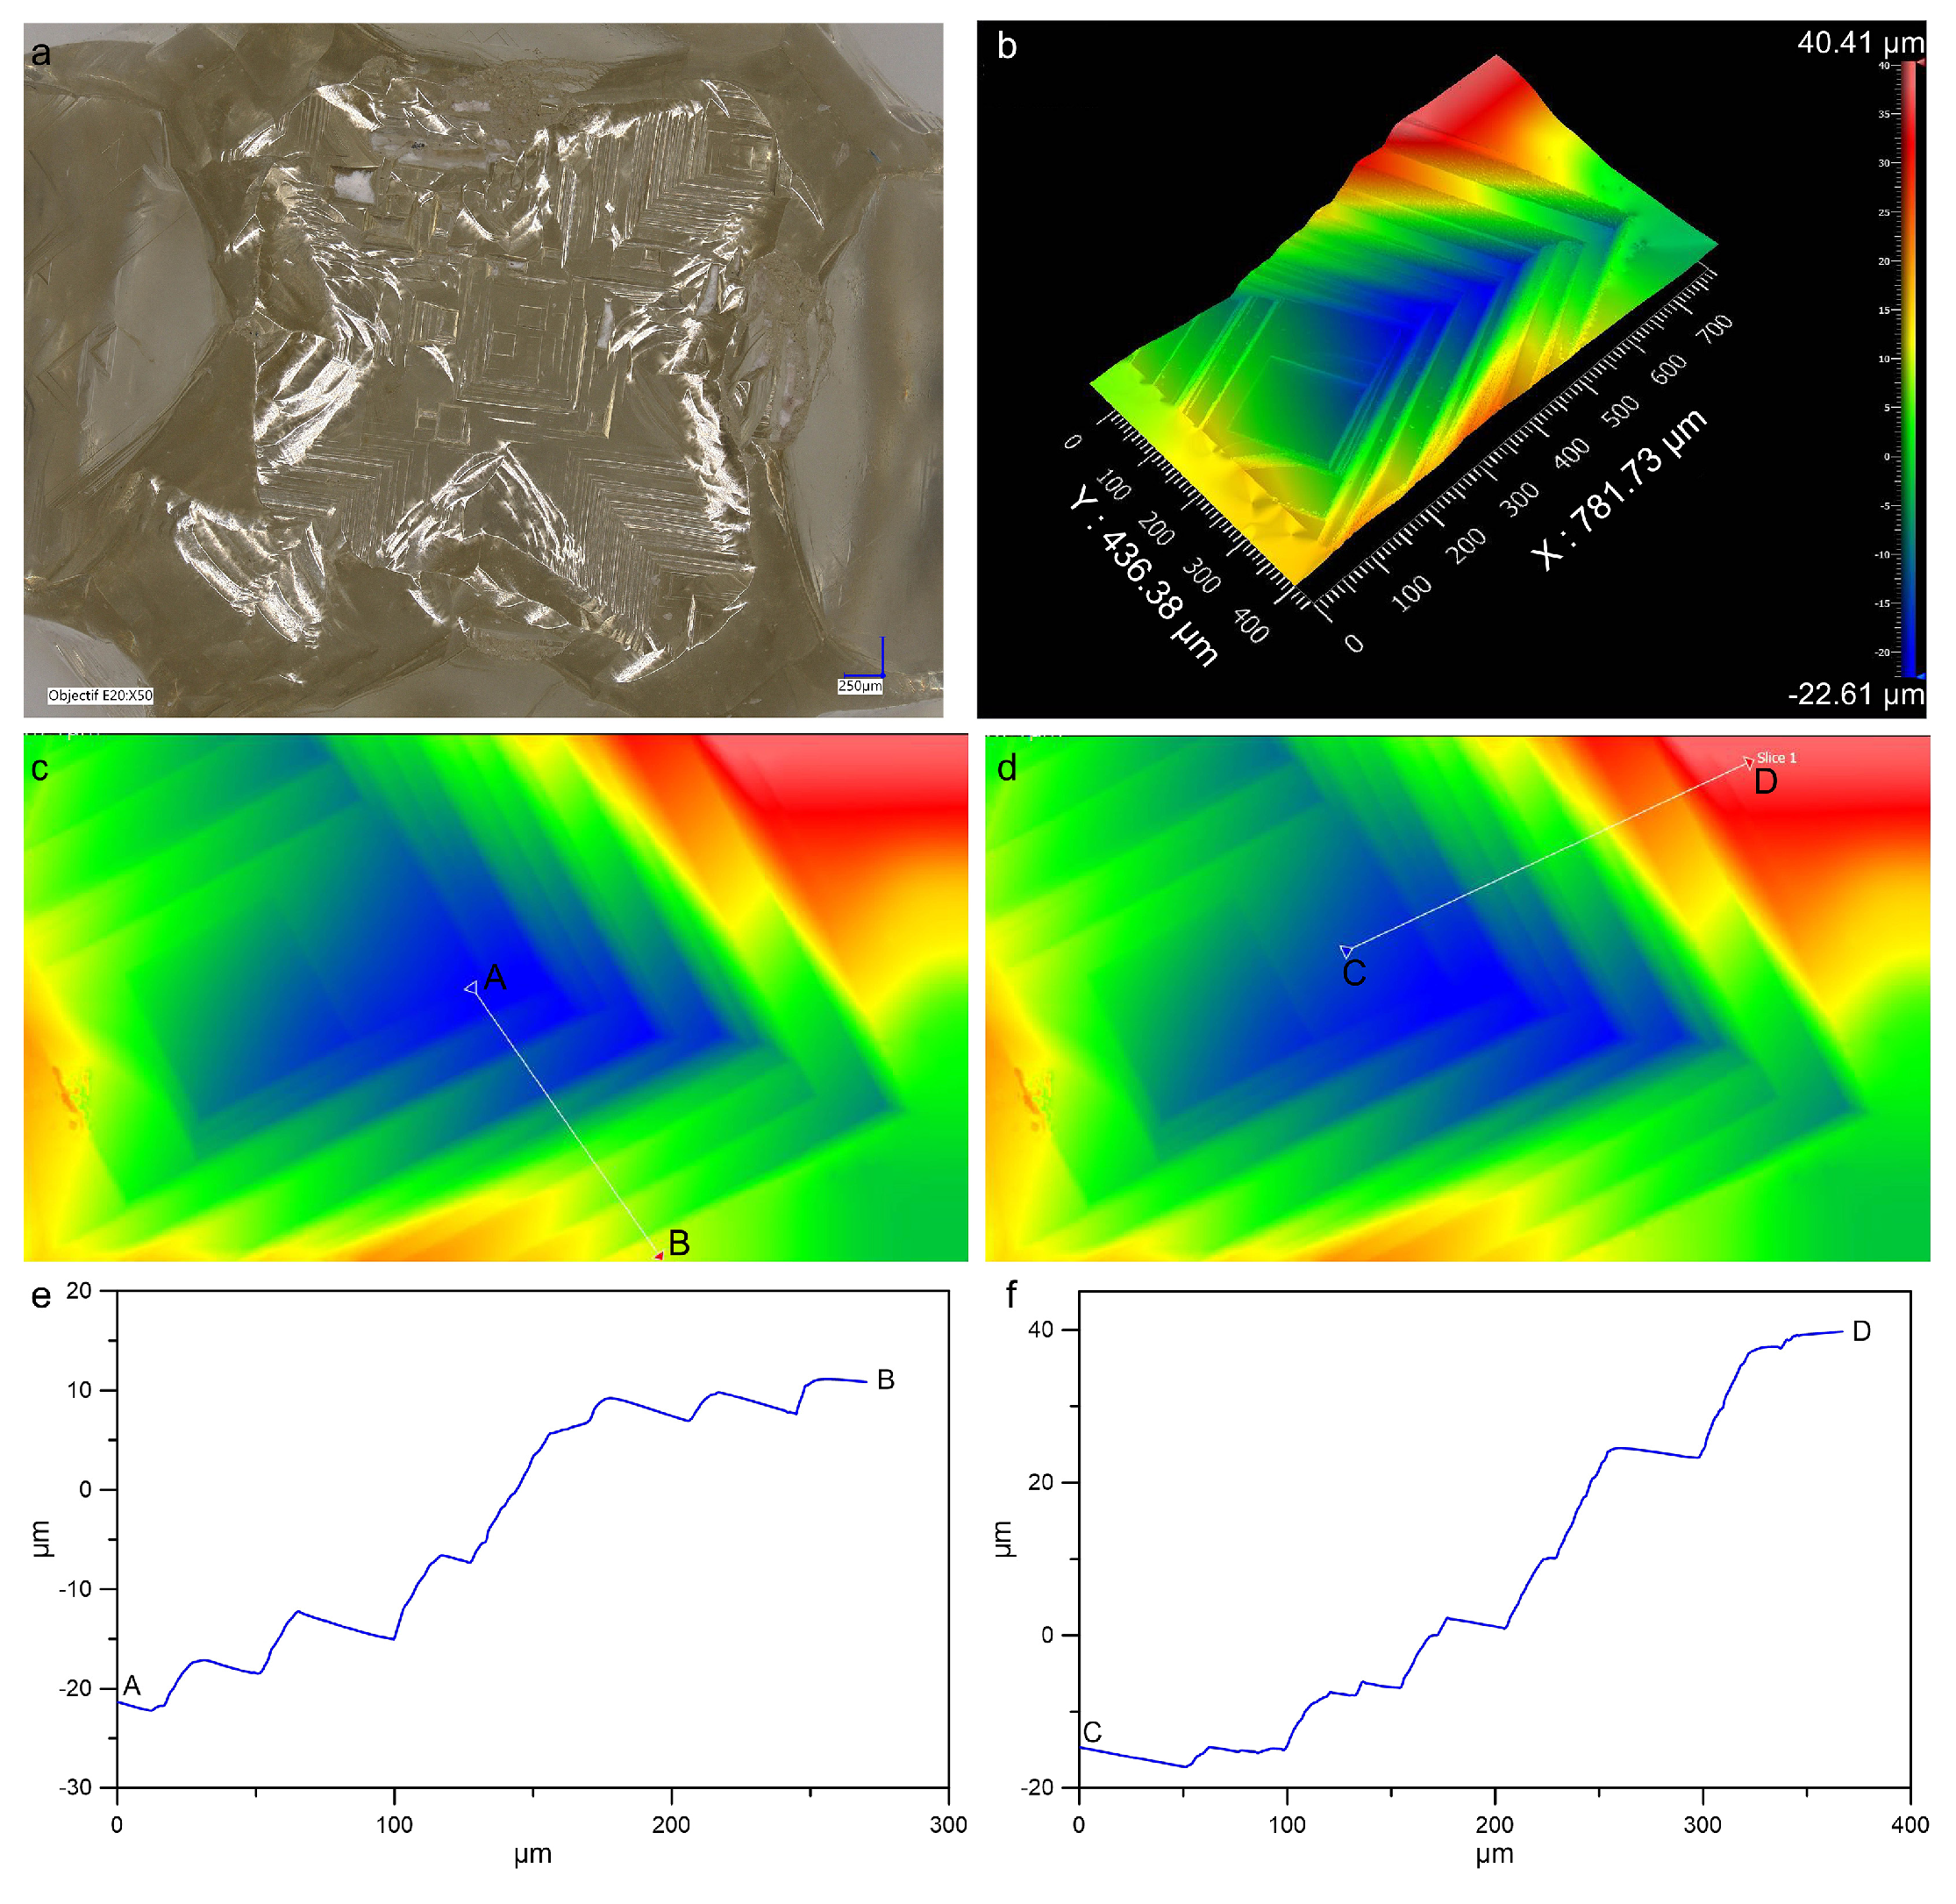
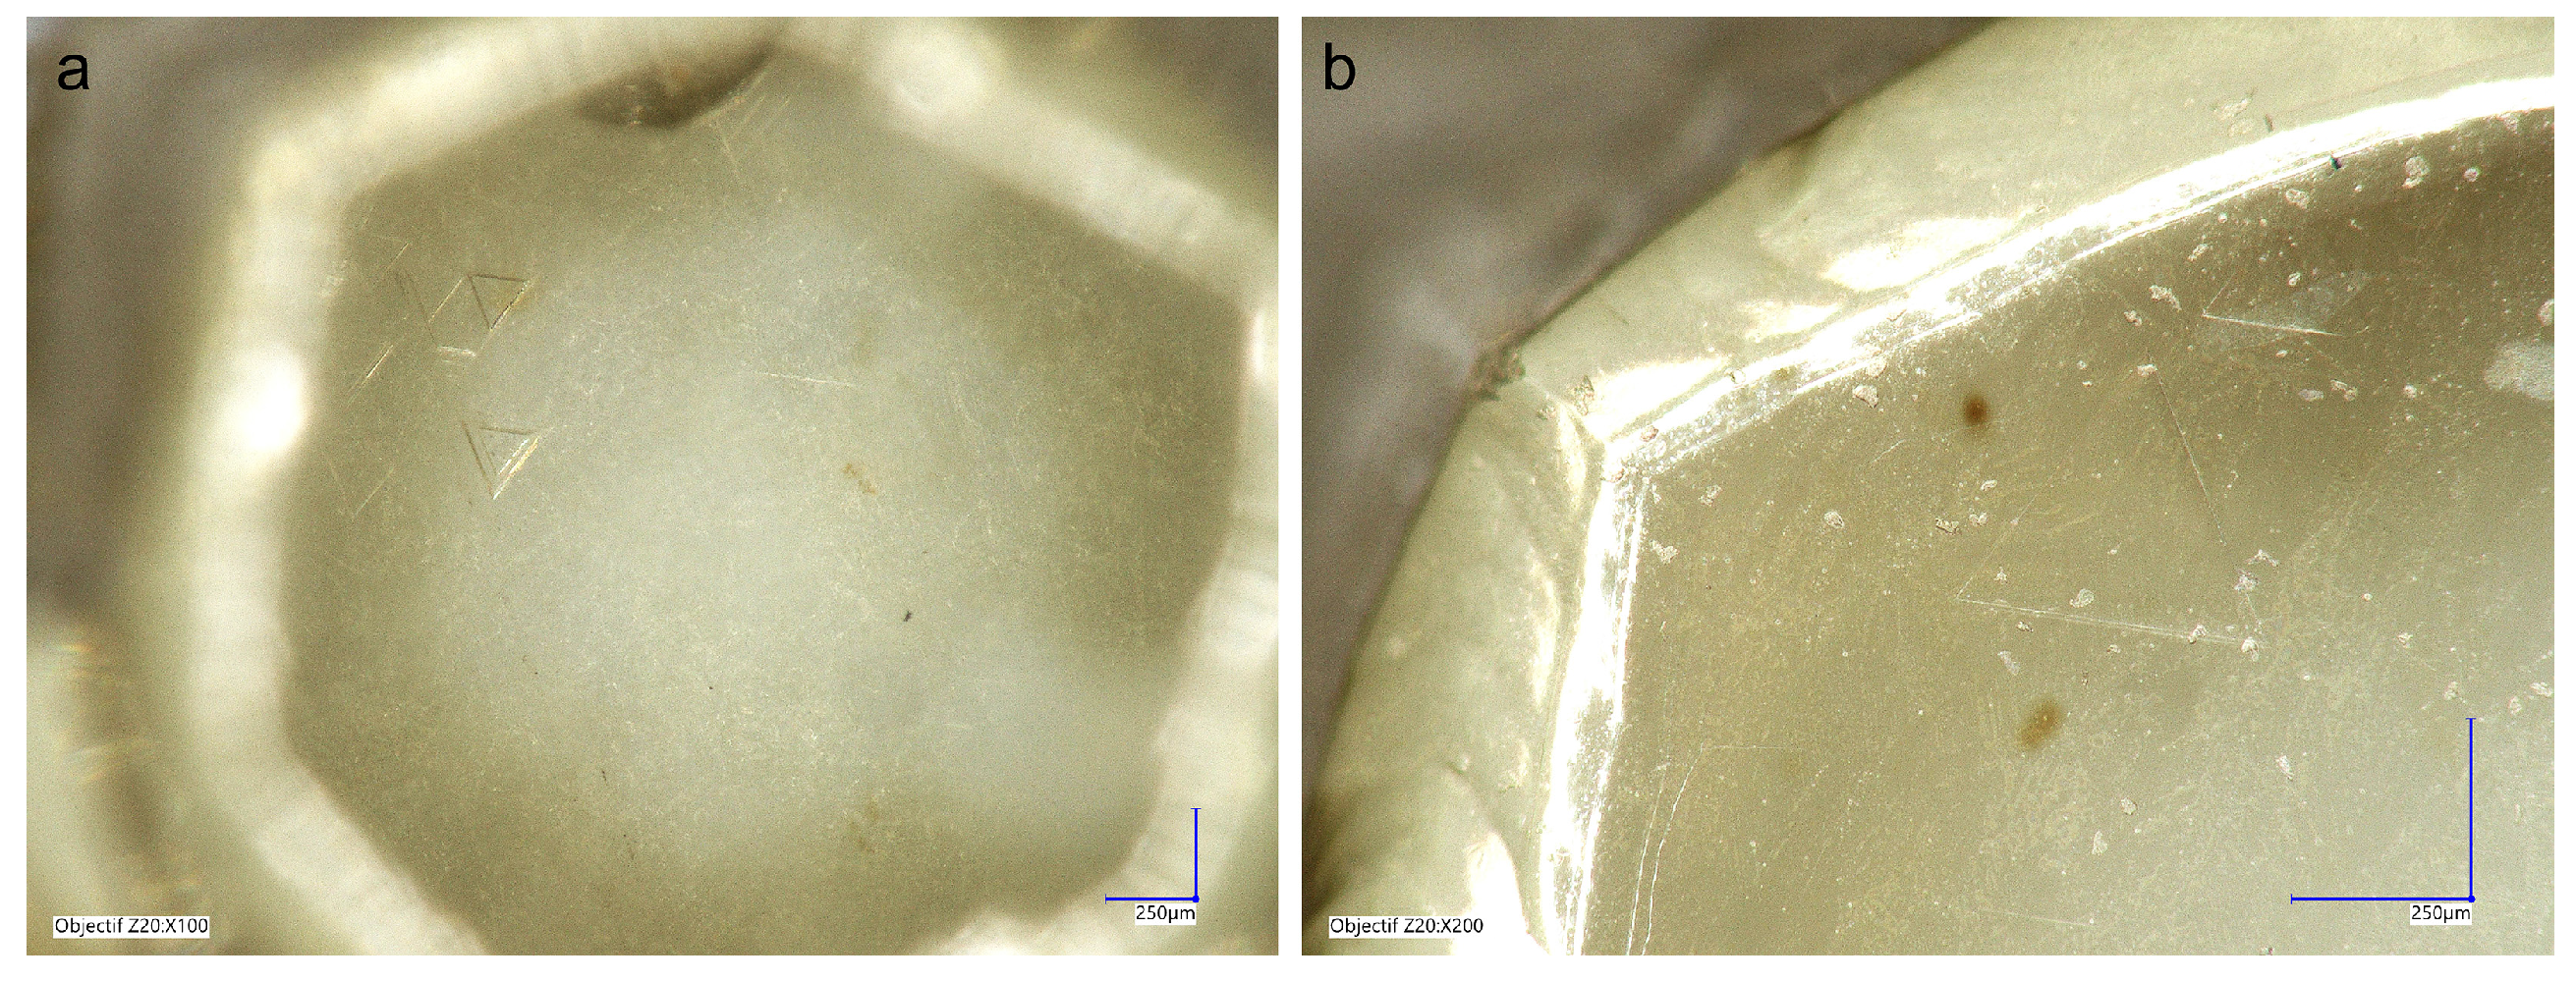
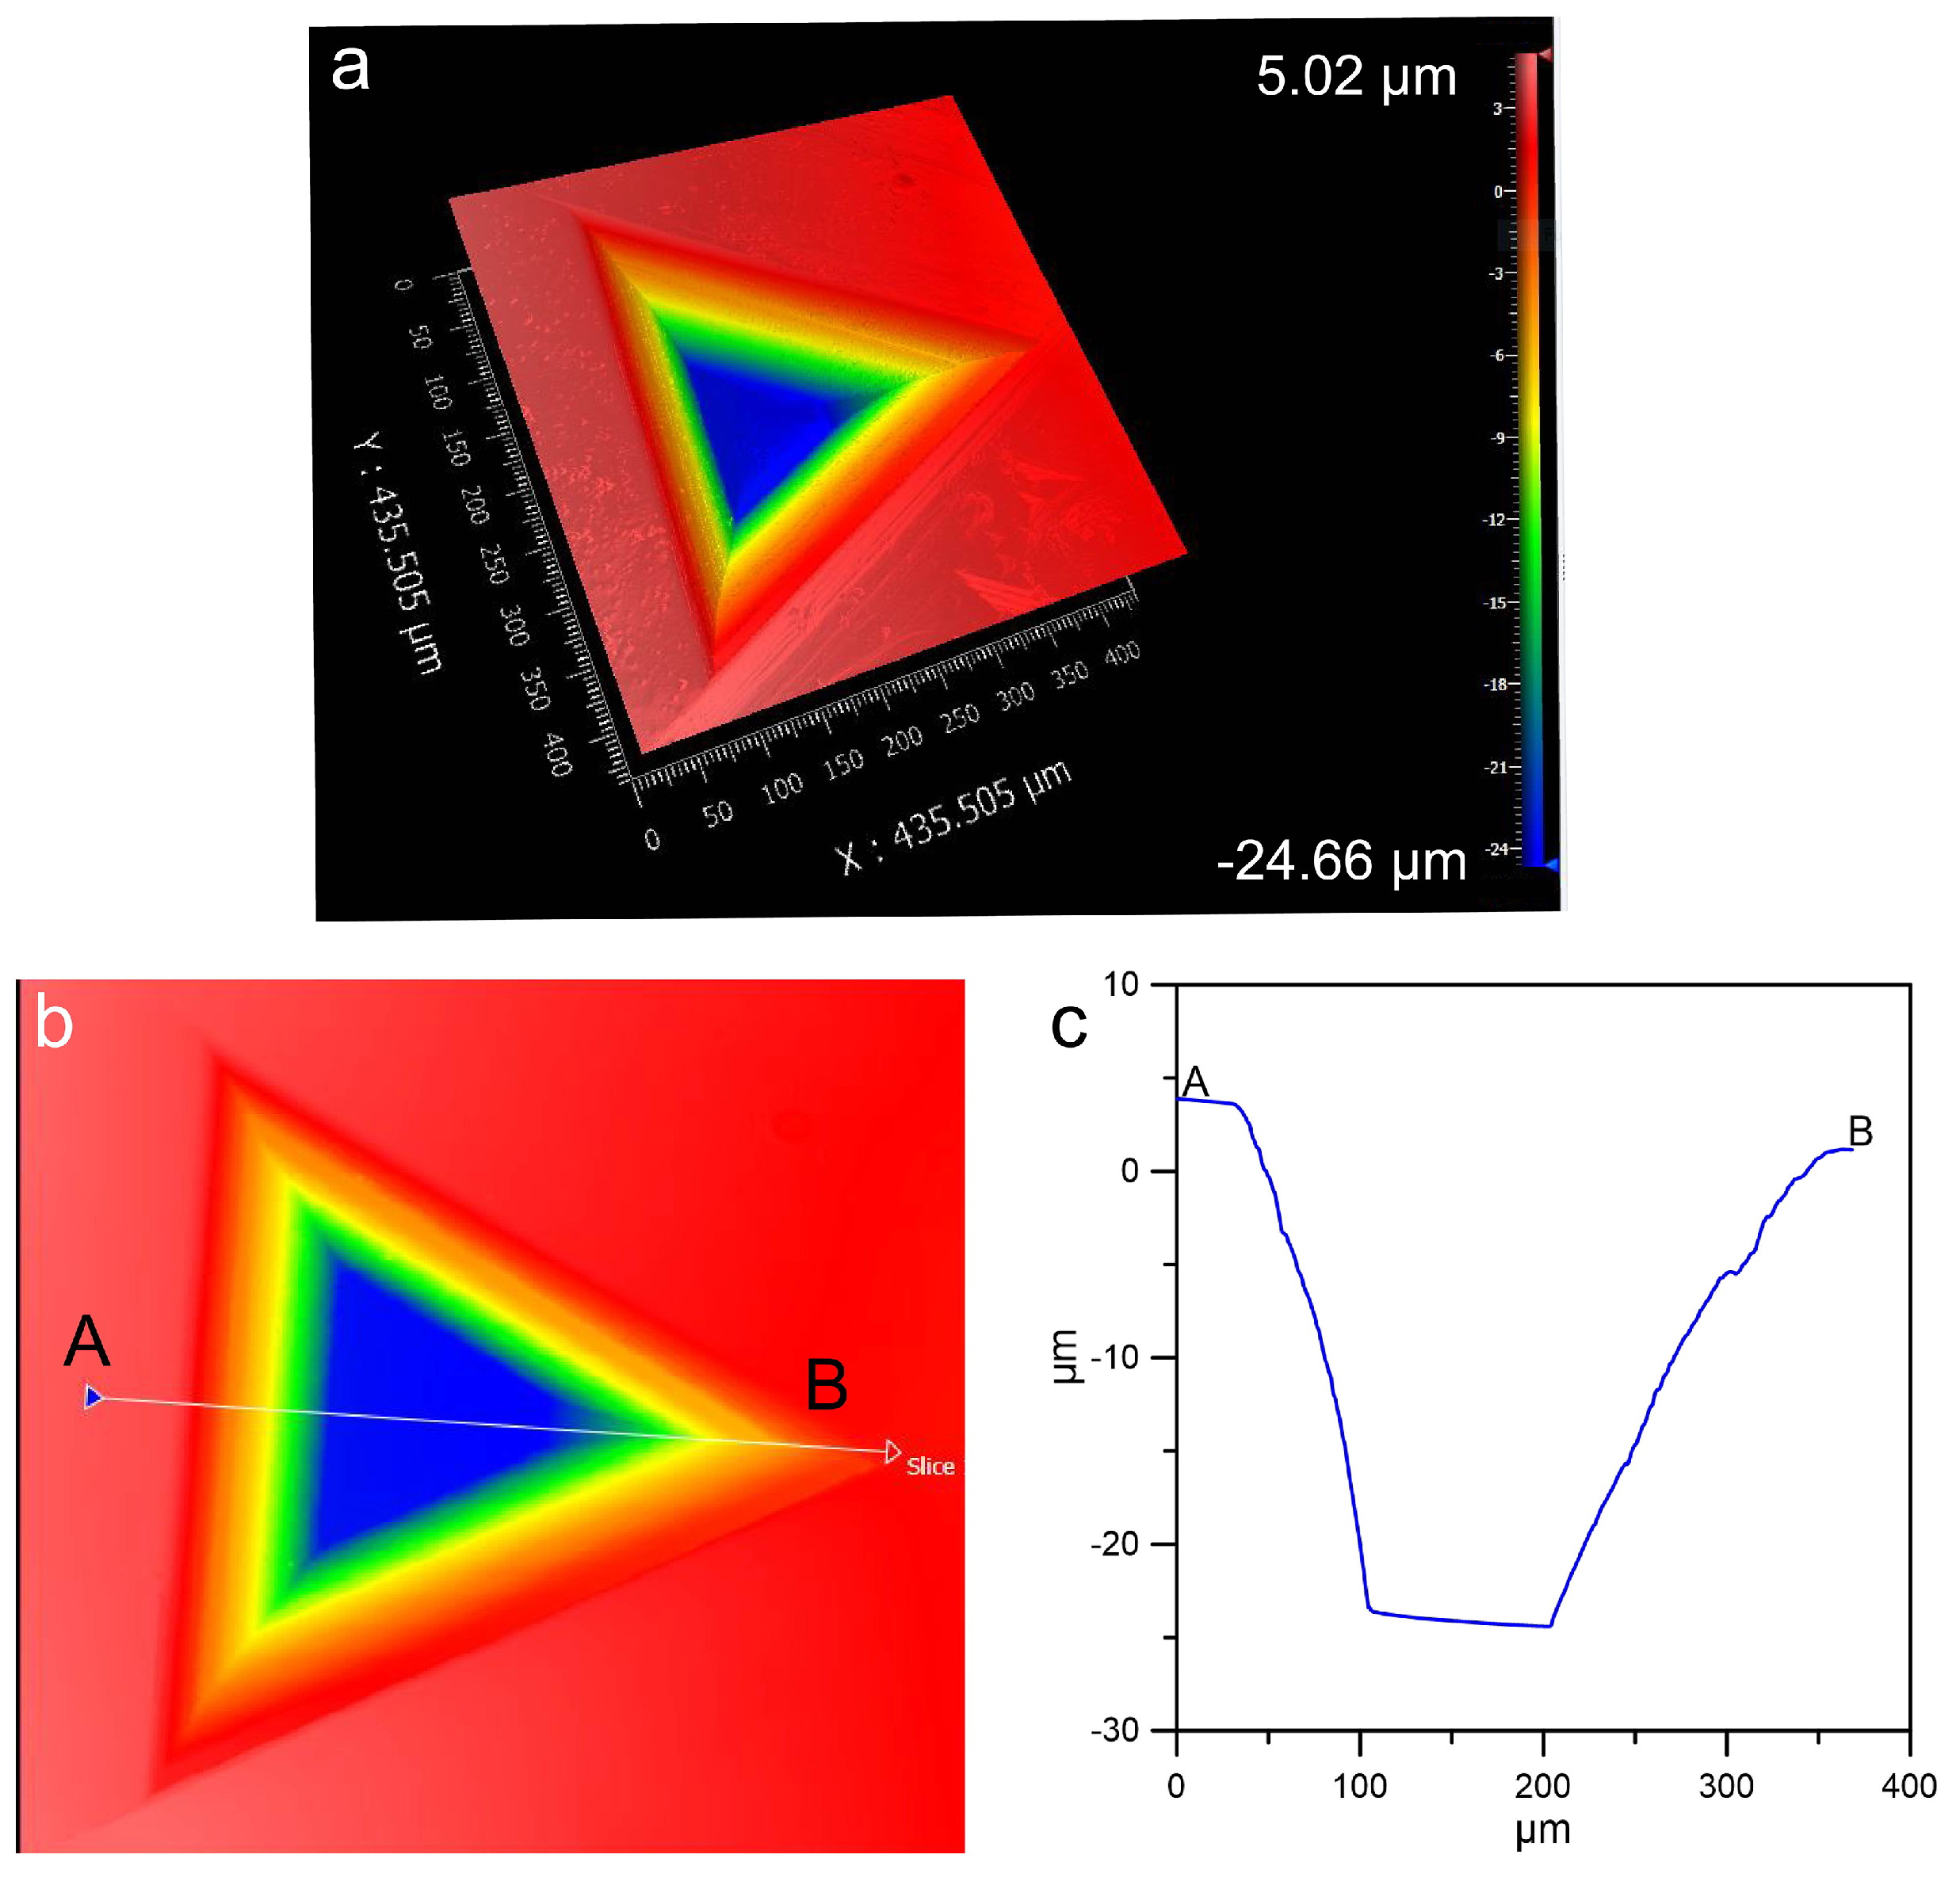
3.3. Tetragonal Etch Pits and Microrelief of Stepped Surfaces

The morphology of etch pits is governed by the symmetry of the corresponding crystal faces. The presence of tetragonal etch pits in the analyzed diamond provides evidence of cubic growth sectors (Figure 6). The cross-sectional profiles of a tetragonal etch pit are presented in Figure 6, revealing that the pit walls are stepped, with individual step heights measuring from a few up to fifteen microns. However, the specific formation conditions of these etch pits remain uncertain due to the limited number of systematic studies on this subject [2]. Most prior research has predominantly focused on the formation mechanisms of trigons, leaving tetragonal etch pit formation relatively underexplored. Tetragonal etch pits of cubic faces were reported by [26] for mixed-habit diamonds from Botswana, in addition to stepped surfaces of cubic faces called by these authors “re-entrant cubes”. Both features have been related to dissolution. The hypothesis of dissolution is supported by the fact that stepped patterns due to the development of growth layers have never been observed on the {100} faces of diamond [27].
The microrelief observed on the stepped surfaces, which replaced the tetrahexahedral {210} faces, exhibits a complex texture. This microrelief consists of a central rectangular etch pit located near the rounded trisoctahedral micro-faces, followed by a series of well-defined steps. These steps extend outward in an arrowhead-like pattern, oriented toward the cubic faces. Notably, in proximity to the corners of the tetragonal etch pits on the cubic faces, the stepped surfaces display a distinct texture resembling two opposing herringbone patterns (Figure 7). In such regions, the step heights range between 1 and 11.5 microns.

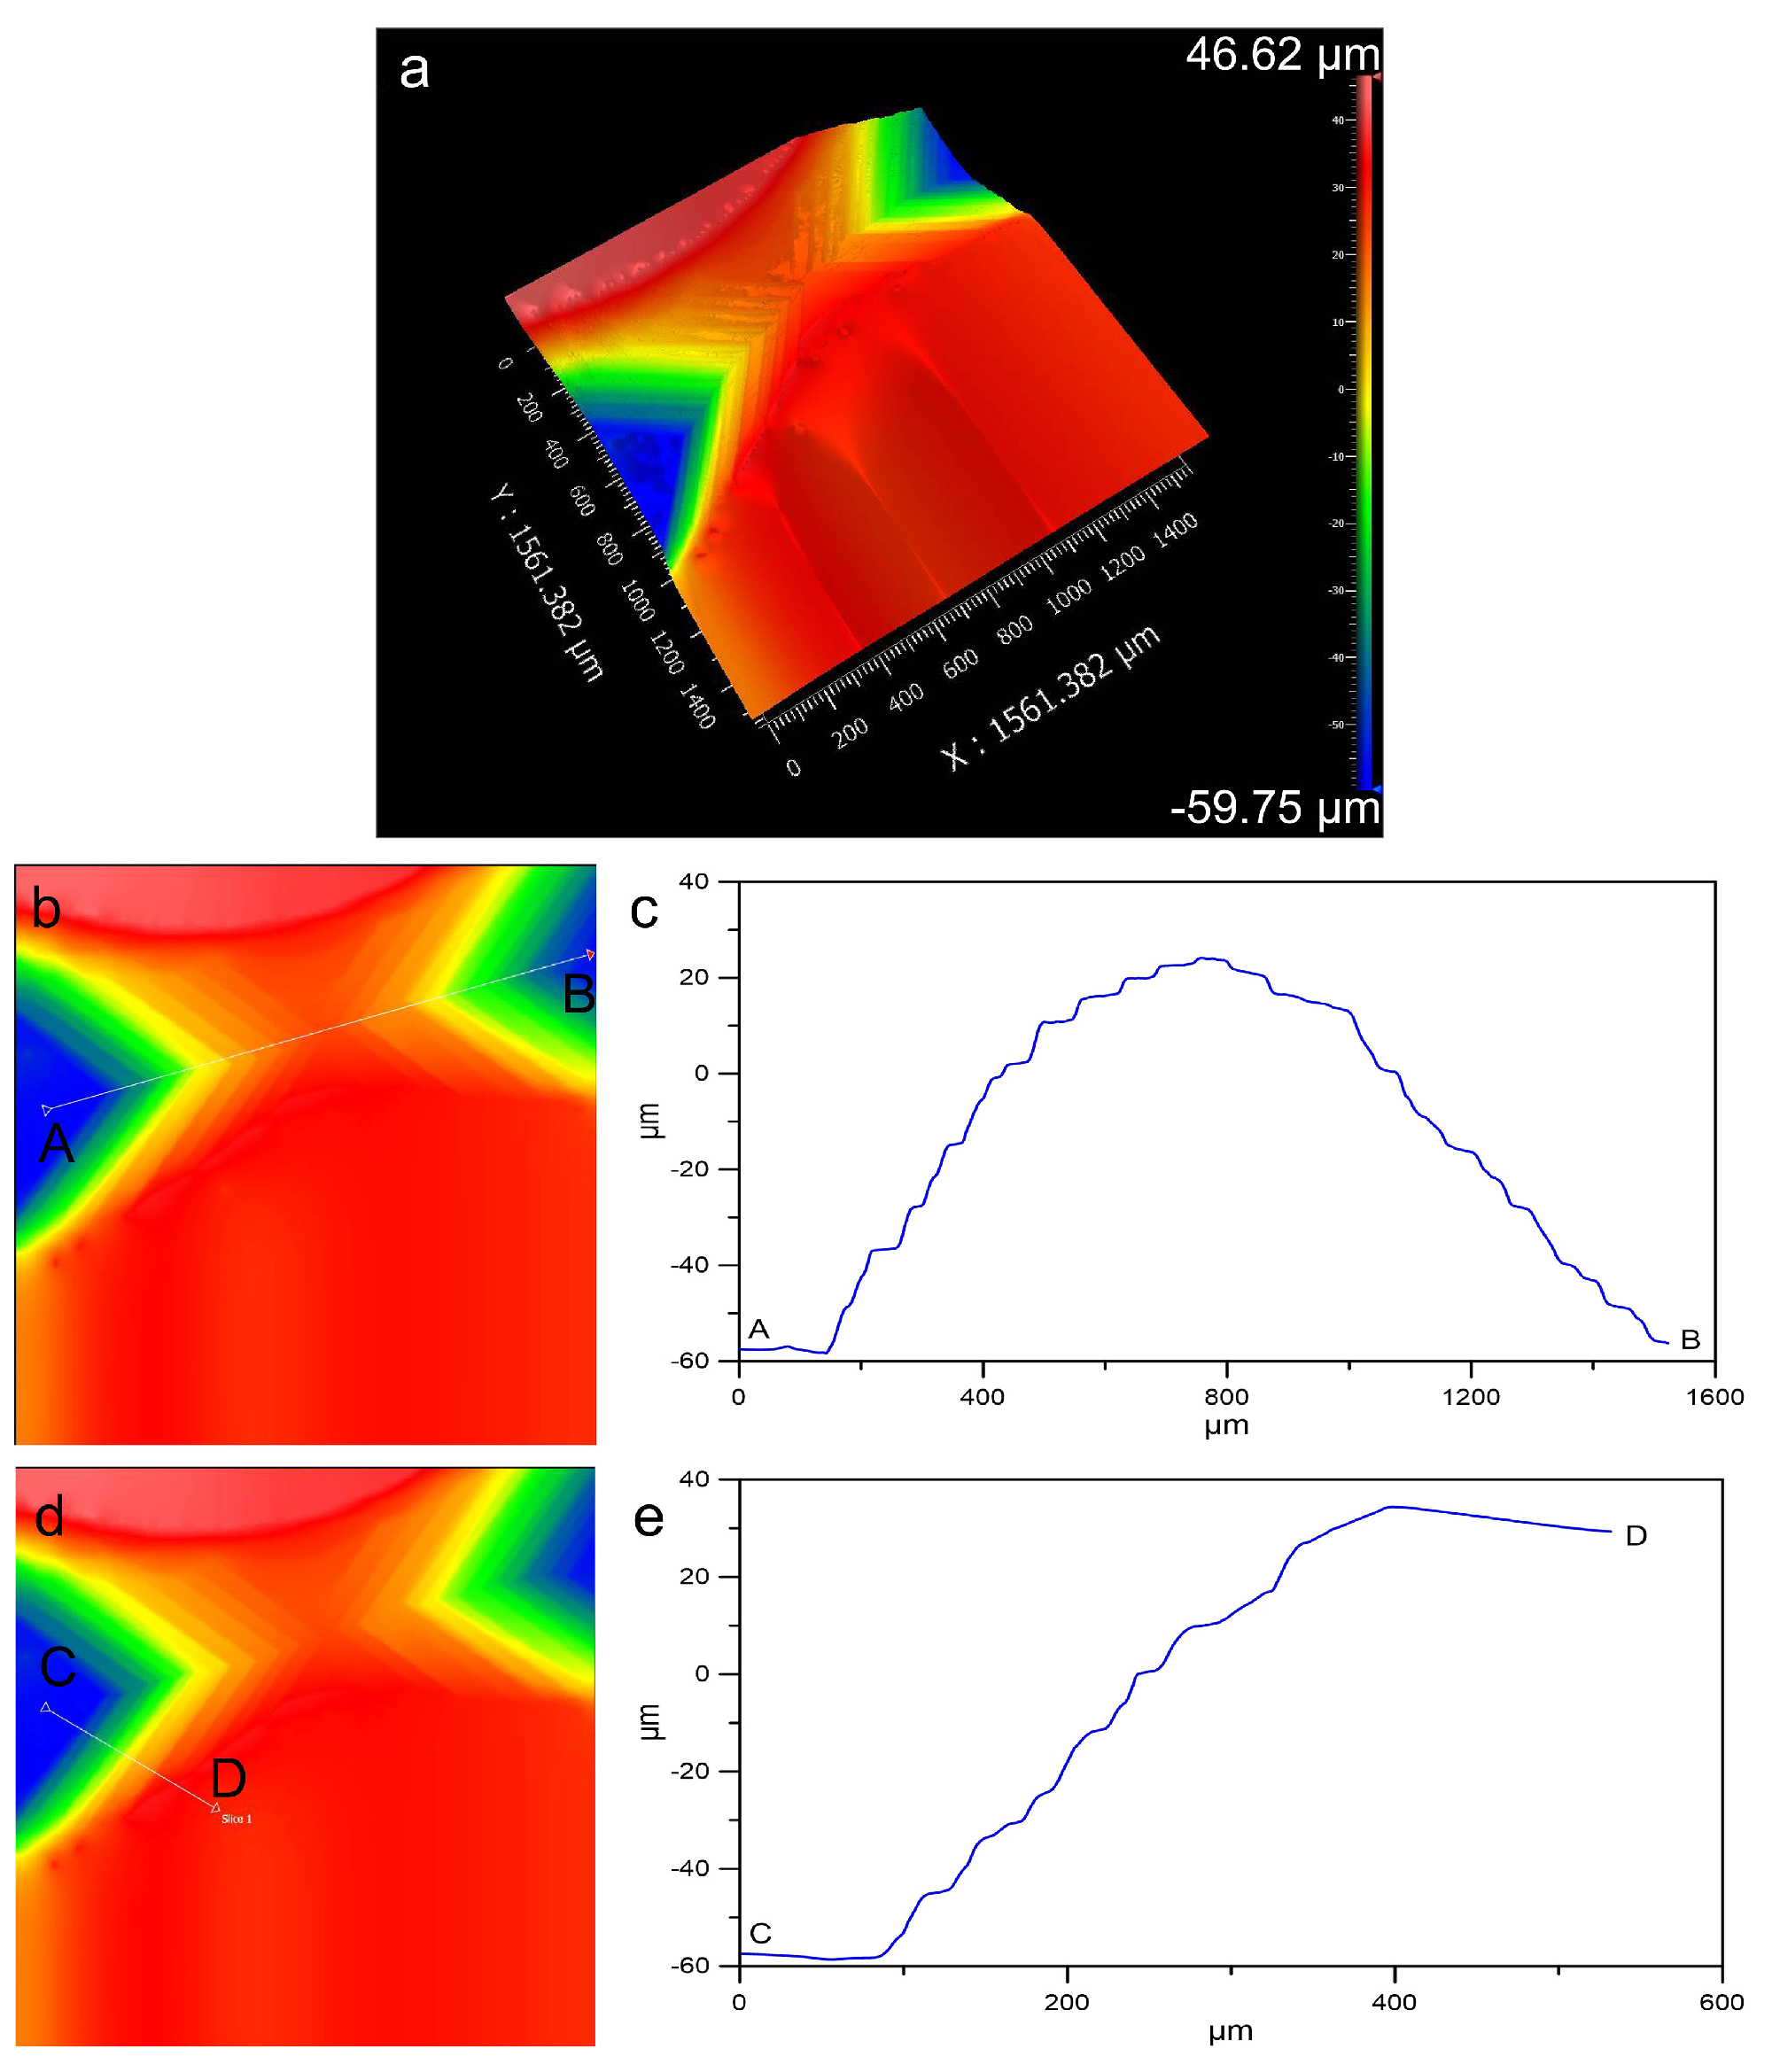
3.4. Negative Trigons

The negative trigons observed on the octahedral {111} faces exhibit edge lengths ranging from approximately 160 to 625 μm (Figure 8). Larger trigons display asymmetric stepped features, with step heights varying between 0.2 and 18 μm (Figure 9). The inclination of these steps relative to the {111} faces vary, with measured angles of 15°, 20°, 27°, 35°, 40°, and 55°. Given the measurement accuracy, these angles may correspond to the orientations of specific micro-surfaces, including {553}, {331}, {551}, {114}, {210}, and {190} (Figure 9). However, the trigons are very shallow, which indicates that resorption on these faces is slight.
The size, shape, and depth of the trigons are influenced by the concentration of H2O and CO2 in the dissolution fluid, as well as by temperature conditions [28]. Vertical scanning interferometry (VSI) data indicate that the trigons exhibit a flat-bottomed morphology (F-type) with no evidence of truncated corners (Figure 9 and Figure 10). According to previous studies, flat-bottomed trigons can form under two distinct conditions: (1) in CO2-poor fluids or (2) through the transformation of point-bottomed trigons into flat-bottomed ones during dissolution in H2O-rich fluids [29]. Distinguishing between these scenarios is possible by analyzing trigon geometry, which provides insights into fluid composition [28]. The trigons observed in this study suggest formation in H2O-rich fluids or melts, with an estimated XCO2 value of less than 0.5 mol% [where XCO2 = XCO2/(XCO2 + XH2O)], probably during mantle metasomatism at T > 1250 °C [30,31].
The growth in trigon size correlates with increased etching time and temperature [32]. The larger dimensions of the flat-bottomed trigons in the analyzed sample suggest that they are pre-kimberlitic in origin. This interpretation is supported by the fact that mantle metasomatism occurs at higher temperatures compared to dissolution within kimberlite magmas, leading to more pronounced resorption features [4]. However, the conditions of the trigons’ formation could be reconstructed only on the basis of experimental data, because we had no information about the geological context or the geographic provenance of this diamond.

3.5. Brown Stains

A few brown stains were detected near the surface of the sample (Figure 11), indicating natural irradiation. These stains are caused by alpha particles emitted from nearby radioactive minerals or fluids [33,34]; Nasdala et al. [35] attributed to GR1 defects, initially manifesting as green and subsequently turning brown due to annealing processes.
The transition temperature for the green-to-brown conversion has been estimated at approximately 500 °C [33,35,36], implying that diamonds must reside at depths greater than 12 km following the initial formation of green stains. As the reaction is kinetic, recent experimental findings suggest that the transformation of green stains to brown can occur at lower temperatures and over relatively short geological timescales within the paleo placer conditions near the Earth’s surface [33]. Examples of diamonds with brown radiation stains have been reported from placer deposits in South Africa, Brazil, Venezuela, and Zimbabwe [37,38,39,40].

4. Conclusions

This unique yellow diamond is the result of a complex history marked by growth and dissolution events. An initial mixed-habit diamond formed in hydrous-carbonatitic fluids, where changes in carbon supersaturation led to the formation of both cubic and octahedral growth sectors and faces, as well as the development of large protruding octahedral faces in the final step growth. The tetragonal etch pits and microrelief surfaces replacing the tetrahexahedral faces indicated that this diamond was also affected by resorption, which contributed to modifying its final form. The spectroscopic data show that the yellow color of this diamond is due to N3 and N2 defects, although other kind of defects were detected, i.e., N3VH0 defects and platelets. The incorporation of H and defects resulting from the nitrogen aggregation are related to high-temperature formation, supporting the hypothesis that growth started at depths compatible with mantle conditions.

Author Contributions

Conceptualization, I.P. and C.F.; methodology, I.P. and C.F.; investigation, I.P. and C.F.; writing—original draft preparation, I.P. and C.F.; writing—review and editing, I.P. and C.F. All authors have read and agreed to the published version of the manuscript.

Funding

This research received no external funding.

Data Availability Statement

The original contributions presented in the study are included in the article.

Acknowledgments

The authors thank Dominik Schaniel for the help in the acquisition and treatment of the IR and UV–Vis–NIR spectra at the Laboratoire de Cristallographie, Résonance Magnétique et Modélisation (CRM2), Université de Lorraine (France). We also thank Jeff Harris for the useful discussion and comments which helped us to improve this manuscript, as well as the three anonymous referees whose critical comments allowed an improvement of this paper. This is CRPG contribution #2870.

Conflicts of Interest

The authors declare no conflicts of interest.

References

  1. Khokhryakov, A.F.; Pal’Yanov, Y.N. The evolution of diamond morphology in the process of dissolution: Experimental data. Am. Min. 2007, 92, 909–917. [Google Scholar] [CrossRef]
  2. Fedortchouk, Y.; Liebske, C.; McCammon, C. Diamond destruction and growth during mantle metasomatism: An experimental study of diamond resorption features. Earth Planet. Sci. Lett. 2019, 506, 493–506. [Google Scholar] [CrossRef]
  3. Khokhryakov, A.F.; Nechaev, D.V.; Sokol, A.G. Microrelief of rounded diamond crystals as an indicator of the redox conditions of their resorption in kimberlite melt. Crystals 2020, 10, 233. [Google Scholar] [CrossRef]
  4. Fedortchouk, Y.; Li, Z.; Chinn, I.; Fulop, A. Geometry of dissolution trigons on diamonds: Implications for the composition of fluid and kimberlite magma emplacement. Lithos 2024, 470, 107526. [Google Scholar] [CrossRef]
  5. Kumar, A.; Reed, J.; Sant, G.; Biernacki, J. Vertical scanning interferometry: A new method to measure the dissolution dynamics of cementitious minerals. J. Am. Ceram. Soc. 2013, 96, 2766–2778. [Google Scholar] [CrossRef]
  6. Pignatelli, I.; Giuliani, G.; Morlot, C.; Pardieu, V. The ‘Star of David‘ Pattern and Presence of Macrosteps on Ruby and Sapphire Crystals from Aappaluttoq, Greenland. J. Gemol. 2022, 38, 364–375. [Google Scholar] [CrossRef]
  7. Pignatelli, I.; Giuliani, G.; Morlot, C.; Bayle, L.D. Unraveling a Rare Polygonal Gold–Pyrite Assemblage: Insights from the Lena Province, Bodaibo Mining District (Russia). Crystals 2025, 15, 4. [Google Scholar] [CrossRef]
  8. King, J.M.; Shigley, J.E.; Gelb, T.H.; Guhin, S.S.; Hall, M.; Wang, W. Characterization and grading of natural-color yellow diamonds. Gems Gemol. 2005, 41, 88–115. [Google Scholar] [CrossRef]
  9. Breeding, C.M.; Eaton-Magaña, S.; Shigley, J.E. Naturally colored yellow and orange diamonds: The nitrogen factor. Gems Gemol. 2020, 56, 194–219. [Google Scholar] [CrossRef]
  10. Hainschwang, T.; Notari, F.; Pamies, G. A defect study and classification of brown diamonds with non-deformation-related color. Minerals 2020, 10, 914. [Google Scholar] [CrossRef]
  11. Green, B.L.; Collins, A.T.; Breeding, C.M. Diamond spectroscopy, defect centers, color, and treatments. Rev. Mineral. Geochem. 2022, 88, 637–688. [Google Scholar] [CrossRef]
  12. Malykhin, S.; Mindarava, Y.; Ismagilov, R.; Orekhov, A.; Jelezko, F.; Obraztsov, A. Formation of GeV, SiV, and NV color center in single crystal diamond needles grown by chemical vapor deposition. Phys. Status Solidi B 2019, 256, 1800721. [Google Scholar] [CrossRef]
  13. Breeding, C.M.; Eaton-Magaña, S.; Shigley, J.E. Natural-color green diamonds: A beautiful conundrum. Gems Gemol. 2018, 54, 2–27. [Google Scholar] [CrossRef]
  14. Gentile, F.S.; Salustro, S.; Causà, M.; Erba, A.; Carbonniére, P.; Dovesi, R. The VN3H defect in diamond: A quantum-mechanical characterization. Phys. Chem. Chem. Phys. 2017, 19, 22221–22229. [Google Scholar] [CrossRef]
  15. Kaminsky, F.V.; Polyakov, V.B.; Ber, B.Y.; Kazantsev, D.Y.; Khachatryan, G.K.; Shilobreeva, S.N. Hydrogen in natural diamond: Quantification of N3VH defects using SIMS and FTIR data. Chem. Geol. 2024, 661, 122185. [Google Scholar] [CrossRef]
  16. Zedgenizov, D.A.; Harte, B.; Edinburgh Ion Microprobe Facility (EIMF); Shatsky, V.S.; Politov, A.A.; Rylov, G.M.; Sobolev, N.V. Directional chemical variations in diamonds showing octahedral following cuboid growth. Contrib. Mineral. Petrol. 2006, 151, 45–57. [Google Scholar] [CrossRef]
  17. Woods, G.S.; Collins, A.T. Infrared absorption spectra of hydrogen complexes in type I diamonds. J. Phys. Chem. Solids 1983, 44, 471–475. [Google Scholar] [CrossRef]
  18. Wang, M.; Shi, G.; Yuan, J.C.C.; Han, W.; Bai, Q. Spectroscopic Characteristics of Treated-Color Natural Diamonds. J. Spectrosc. 2018, 2018, 8153941. [Google Scholar] [CrossRef]
  19. Goss, J.P.; Coomer, B.J.; Jones, R.; Fall, C.J.; Briddon, P.R.; Öberg, S. Extended defects in diamond: The interstitial platelet. Phys. Rev. B 2003, 67, 165208. [Google Scholar] [CrossRef]
  20. Haggerty, S. Diamond genesis in a multiply-constrained model. Nature 1986, 320, 34–38. [Google Scholar] [CrossRef]
  21. Sunagawa, I. Growth and morphology of diamond crystals under stable and metastable conditions. J. Cryst. Growth 1990, 99, 1156–1161. [Google Scholar] [CrossRef]
  22. Pal’yanov, Y.; Khokhryakov, A.; Borzdov, Y.; Kupriyanov, I.N. Diamond growth and morphology under the influence of impurity adsorption. Cryst. Growth Des. 2013, 13, 5411–5419. [Google Scholar] [CrossRef]
  23. Federtchouk, Y.; Zhang, Z. Diamond resorption: Link to metasomatic events in the mantle or record of magmatic fluid in kimberlitic magma? Can. Mineral. 2011, 49, 707–719. [Google Scholar] [CrossRef]
  24. Pal’yanov, Y.; Kupriyanov, I.N.; Khokhryakov, A.; Borzdov, Y.; Gusev, V.; Van Royen, J. Crystal growth and characterization of HPHT diamond from phosphorus-carbon system. Diam. Relat. Mater. 2003, 12, 1510–1616. [Google Scholar] [CrossRef]
  25. Khokhryakov, A.F.; Pal’yanov, Y.N. Influence of the fluid composition on diamond dissolution forms in carbonate melts. Am. Mineral. 2010, 95, 1508–1514. [Google Scholar] [CrossRef]
  26. Welbourn, C.M.; Rooney, M.L.T.; Evans, D.J.F. A study of diamonds of cube and cube-related shape from the Jwaneng Mine. J. Cryst. Growth 1989, 94, 229–252. [Google Scholar] [CrossRef]
  27. Sunagawa, I. Crystals: Growth, Morphology, & Perfection; Cambridge University Press: Cambridge, UK, 2005. [Google Scholar]
  28. Smit, K.V.; Shirey, S.B. Diamonds are not forever! Diamond dissolution. Gems Gemol. 2020, 56, 148–155. [Google Scholar]
  29. Zhang, Z. Diamond Resorption Morphology as a Fluid Proxy in Diamond-Bearing Elements: Constraints from Empirical and Experimental Studies. Ph.D. Thesis, Dalhousie University, Halifax, NS, Canada, 2016. [Google Scholar]
  30. Fedortchouk, Y. A new approach to understanding diamond surface features based on a review of experimental and natural diamond studies. Earth-Sci. Rev. 2019, 193, 45–65. [Google Scholar] [CrossRef]
  31. Fedortchouk, Y.; Canil, D.; Carlson, J.A. Dissolution forms in Lac de Gras diamonds and their relationship to the temperature and redox state of kimberlite magma. Contrib. Mineral. Petrol. 2005, 150, 54–69. [Google Scholar] [CrossRef]
  32. Kanda, H.; Yamaoka, S.; Setaka, N.; Komatsu, H. Etching of diamond octahedrons by high pressure water. J. Cryst. Growth 1977, 38, 1–7. [Google Scholar] [CrossRef]
  33. Eaton-Magaña, S.C.; Moe, K.S. Temperature effects on radiation stains in natural diamonds. Diam. Relat. Mater. 2016, 64, 130–142. [Google Scholar] [CrossRef]
  34. Eaton-Magaña, S.; Breeding, C.M.; Bassoo, R. Low-temperature annealing and kinetics of radiation stains in natural diamond. Diam. Relat. Mater. 2023, 132, 109649. [Google Scholar] [CrossRef]
  35. Nasdala, L.; Grambole, D.; Wildner, M.; Gigler, A.M.; Hainschwang, T.; Zaitsev, A.M.; Harris, J.; Milledge, J.; Schulze, D.J.; Hofmeister, W.; et al. Radio-colouration of diamond: A spectroscopic study. Contrib. Mineral. Petrol. 2013, 165, 843–861. [Google Scholar] [CrossRef]
  36. Vance, E.R.; Harris, J.W.; Milledge, H.J. Possible origins of α-damage in diamonds from kimberlite and alluvial sources. Miner. Mag. 1973, 39, 349–360. [Google Scholar] [CrossRef]
  37. Raal, F.A.; Robinson, D.N. Green for rarity. Nucl. Act. 1980, 13, 5–8. [Google Scholar]
  38. Karfunkel, J.; Chaves, M.L.S.C.; Svisero, D.P.; Meyer, H.O.A. Diamonds from Minas Gerais, Brazil: An update on sources, origin, and production. Int. Geol. Rev. 1994, 36, 1019–1032. [Google Scholar] [CrossRef]
  39. Kaminsky, F.V.; Zakharchenko, O.D.; Griffin, W.L.; Channer, D.M.D.; Khachatryan-Blinova, G.K. Diamond from the Guaniamo area, Venezuela. Can. Mineral. 2000, 38, 1347–1370. [Google Scholar] [CrossRef]
  40. Smit, K.V.; D’Haenens-Johansson, U.F.; Howell, D.; Loudin, L.C.; Wang, W. Deformation-related spectroscopic features in natural Type Ib-IaA diamonds from Zimmi (West African craton). Mineral. Petrol. 2018, 112, 243–257. [Google Scholar] [CrossRef]
Figure 1. Optical images (a,b) of the yellow diamond analyzed in this study.
Crystals 15 00461 g001
Figure 2. (A) UV–Vis–NIR spectrum of the yellow diamond. Inserts (BD) show different spectral features of this sample.
Crystals 15 00461 g002
Figure 3. (A) IR spectrum of the yellow diamond analyzed in this study. (B) Detail of the IR spectrum between 1360 and 1420 cm−1.
Crystals 15 00461 g003
Figure 4. Optical image of the yellow diamond showing the rounded trisoctahedral micro-faces.
Crystals 15 00461 g004
Figure 5. The reconstructed complete habit.
Crystals 15 00461 g005
Figure 6. Tetragonal etch pits: optical image (a); 3D (b) and 2D (c,d) topographic images obtained using VSI. The lines A–B and C–D correspond to the cross-sections profiles shown in (e,f).
Crystals 15 00461 g006
Figure 7. Three-dimensional topographic image (a) obtained using VSI of microrelief formed in place of tetrahexahedral faces. This image shows that the texture resembles two opposite herringbones. Two-dimensional images of the same area shown in (b,d) are marked with the lines A–B and C–D, respectively, corresponding to the cross-section profile in (c,e).
Crystals 15 00461 g007
Figure 8. Images of some negative trigons on {111} faces. The objective and magnification are indicated in the left corner of each image, (a) Objectif Z20:X100; (b) Objectif Z20:X200.
Crystals 15 00461 g008
Figure 9. The 3D (a) and 2D (b) topographic images obtained using VSI of a negative trigon. The line A–B corresponds to the cross-section profile in (c).
Crystals 15 00461 g009
Figure 10. The 2D topographic image (a) and the cross-section profile (b) of an asymmetric trigon.
Crystals 15 00461 g010
Figure 11. Optical images of brown stains near the surface of the diamond, (a) Objectif Z20:X20; (b) Objectif Z20:X150.
Crystals 15 00461 g011
Table 1. Summary of UV–Vis–NIR and IR features in the analyzed sample and their interpretations.
UV–Vis–NIR Bands (nm)Attribution to Structural Defects
415, 373, 383, 392, 404N3
478N2
670CI or NV center
840Ni-related defects
Infrared bands (cm−1)Attribution to structural defects
3107 and 1405N3VH0
1377Platelets
Disclaimer/Publisher’s Note: The statements, opinions and data contained in all publications are solely those of the individual author(s) and contributor(s) and not of MDPI and/or the editor(s). MDPI and/or the editor(s) disclaim responsibility for any injury to people or property resulting from any ideas, methods, instructions or products referred to in the content.

