Abstract
In this study, nanoparticles with a monoclinic crystal structure of Gd0.85−yLayPO4:15%Eu were synthesized through a hydrothermal method. Initial investigations focused on the influence of the precursor on the resulting structure of LaPO4:1%Eu, with variations in synthesis temperature. Various syntheses were conducted using ammonium dihydrogen phosphate (NH4H2PO4) and diammonium hydrogen phosphate ((NH4)2HPO4) as PO43− ion precursors, and the synthesis temperature ranged from room temperature to 200 °C. Based on the synthesis and analysis outcomes, diammonium hydrogen phosphate was selected as the precursor for PO43− ions. Subsequent hydrothermal synthesis was performed at 180 °C to produce nanoparticles with a monoclinic crystal structure. After evaluating the synthesis and analysis results, the decision was made to increase the Eu3+ content from 1% to 15% by replacing La or Gd when a single-phase La0.75Gd0.24PO4:1%Eu with a monoclinic crystal structure was achieved. These structural modifications were carried out in order to stabilize the anhydrous monoclinic structure and improve the luminescence properties of the phosphate. The synthesized samples were characterized using X-ray diffraction and scanning electron microscopy. Luminescence properties were meticulously measured and discussed. The emission intensity of monoclinic structure La0.75Gd0.1PO4:15%Eu was found to be almost twice as high as compared with La0.61Gd0.24PO4:15%Eu. Additionally, magnetization dependence on the applied magnetic field strength was measured, revealing paramagnetic properties in the investigated samples.
1. Introduction
Due to gadolinium’s robust paramagnetic properties, Gd-based materials are widely employed in medicine, particularly as magnetic resonance contrast agents [1,2]. However, the high toxicity of Gd3+ ions, which poses a risk of release even in chelated form, is still a challenging issue [3,4]. Despite the effectiveness of magnetic resonance imaging (MRI) in medical diagnosis, ongoing efforts are directed towards improving imaging quality. Materials are being developed to obtain T1 and T2 MRI simultaneously, as single-mode MRI may not consistently provide sufficient image quality. In this pursuit, multimodal materials suitable for bioimaging and MRI, such as combining MRI with luminescence measurements, are being explored. GdPO4 nanoparticles, considered nontoxic due to reduced Gd3+ ion release, are a notable example [5]. Lanthanoids, especially europium-substituted GdPO4 nanoparticles, are gaining attention as efficient single-phase multimodal nanoprobes with both luminescent and magnetic properties [6,7,8].
The concentration of the light-emitting substituent introduced into the crystal structure significantly impacts luminescence intensity. For europium, this concentration boundary varies based on the initial host matrix. Optimal substitution concentrations for intense photoluminescence and scintillation properties vary depending on the host matrix, such as 10% for single-crystalline scintillator Ca2MgSi2O7 and 2–2.5% for LiCaAlF6:Eu single crystals [9,10]. In the case of Eu3+-substituted GdPO4 nanoparticles, the most intense luminescence occurs at a concentration range of 5–15% [11,12]. Luminescence intensity is also influenced by factors like particle size, length-to-width ratio, particle shape, and crystalline structure [13,14].
As mentioned before, the crystal structure and particle morphology of the host lattice are very important to obtain high-intensity luminescence. Recently, it has been reported that 5% Eu3+-substituted GdPO4 nanoparticles with monoclinic crystalline structures have better luminescence properties than nanoparticles with hexagonal or nanowires with monoclinic and hexagonal crystal structures [15]. Eu3+-substituted GdPO4 samples synthesized in a water medium all exhibited a hexagonal crystalline structure, which is stabilized by incorporating crystalline water. In contrast, the synthesis in an anhydrous medium yielded GdPO4 nanoparticles with a monoclinic structure due to the absence of water. Samples synthesized in the anhydrous medium showed a more intense luminescence, which may have resulted from the difference in the crystal lattice. If the Eu3+-substituted GdPO4 nanoparticle with a hexagonal crystal structure is heated above 700 °C, water is removed, and the crystal structure changes to monoclinic, increasing luminescence intensity. However, in this case, not only is the crystal structure changed but most likely also the crystallinity and the size of the particles of the samples. It is difficult to attribute the improvement of luminescence properties to one of these phenomena, as they all can affect it [16]. Furthermore, in most cases, it is not desirable to anneal the samples, as it leads to particle size growth, and the preparation in anhydrous media can be complicated; as such, ways of changing the crystal structure are needed. Recent studies have further demonstrated that microwave-assisted synthesis offers significant advantages in producing highly crystalline GdPO4 nanoparticles. By controlling reaction conditions, researchers have achieved enhanced luminescence and particle stability, particularly in Eu3+ doping ranges of 5–15% [17,18]. Moreover, nanoparticles synthesized under anhydrous conditions exhibit improved structural properties, leading to better luminescence and potential applications in dual-modal imaging [17]. Furthermore, scientists are engaged in the search for new structures that will yield optimal properties [19].
It is known that lanthanum phosphate can be obtained in two crystalline structures: a hydrated hexagonal rhabdophane type and a monoclinic monazite type [20]. The monazite-type Eu3+, Tb3+ co-substituted LaPO4·nH2O nanorods demonstrate higher photoluminescent efficiency than the LaPO4·nH2O rhabdophane-type nanorods co-substituted with the same amount of Eu3+, Tb3+ [21]. It is known that the most common GdPO4 nanoparticles are the hydrates; meanwhile, LaPO4 is more commonly found in anhydrate. With annealing at higher temperatures, the final products result in the anhydrate forms. Ullah et al. have demonstrated that monoclinic phase compounds of GdxLa1−xPO4:5at.%Eu are obtained by co-precipitation synthesis under calcining at 1000 °C for 5 h in a muffle furnace [22].
The main objective of this work is to stabilize monoclinic anhydrate of GdPO4 by La3+ ions without additional annealing after synthesis.
2. Materials and Methods
The following materials were used for the synthesis of phosphates: Gd(NO3)3·6H2O (99.9%, Glentham, Corsham, UK), Eu(NO3)3·6H2O (99.9%, Alfa Aesar, Kandel, Germany), La(NO3)3·6H2O (99.9%, Alfa Aesar, Kandel, Germany), ammonium dihydrogen phosphate NH4H2PO4 (99%, Reachem, Petrzalka, Slovakia), diammonium hydrogen phosphate (NH4)2HPO4 (99%, Eurochemicals, Vilnius, Lithuania) citric acid C6H8O7 (99.5% Eurochemicals, Vilnius, Lithuania), and concentrated HNO3 (65.0%, Sigma-Aldrich, Steinheim, Germany). Firstly, required amounts of gadolinium, lanthanum, and europium nitrates are dissolved together in 5 mL of distilled water for about 0.5 mmol of the final product (around 0.1 g). Then, a 10 mL solution of citric acid, containing double the moles of citric acid as compared with the metals, is added to the europium and gadolinium solution and stirred for 10 min. Then, a 5 mL water solution of ammonium dihydrogen phosphate or diammonium hydrogen phosphate is added slowly. Then, the solution is diluted to the desired volume (25 mL). The final mixture is stirred for 30 min. Then, the solution is transferred to the Teflon-lined autoclave and left inside a furnace for 18 h. The obtained powders are centrifuged (7000 rpm, 10 min), washed with deionized water and ethanol 3 times, and then dried at 70 °C for 24 h and characterized.
X-ray diffraction (XRD) analysis was performed using a Rigaku MiniFlex II (Rigaku Corporation, Akishima-shi, Japan). The source of the diffractometer radiation was Ni-filtered Cu Kα1. At room temperature, measurements were performed in the 10–80° 2θ range. A glass sample holder was used, on which the sample was placed.
Le Bail fitting was performed using the Match! (v. 3) software in conjunction with the FullProf Suite. Initial structural models for the refinement were based on BiPO4·0.67H2O (trigonal (hexagonal axis); 96–702–3719) or/and LaPO4 (monoclinic structure; 96–153–0457 or 96–152–5731). During the fitting process, several parameters were refined to optimize the model, including the zero-shift, unit cell dimensions, background, profile shape, and the Caglioti half-width parameters (U, V, and W). This approach allowed for a more accurate representation of the experimental diffraction pattern and improved the reliability of the structural analysis. The Hitachi SU-70 scanning electron microscope (SEM) was used for particle morphology and size analyses. The sample was suspended in ethanol, and one drop of the prepared mixture was dropped on a carbon film. Then the SEM sample holder with the sample was dried by blowing with a stream of dry air. The microscope was adjusted, and the appropriate magnification (×5–10 k) was selected. After that, the image was recorded. An open-access program, Fiji (v. 2.14.0), was used for image analysis.
The Edinburgh Instruments FLS980 spectrometer (Edinburgh Instruments Ltd., Livingston, UK) was used to investigate the luminescent properties. The spectrometer is equipped with double excitation and emission monochromators, a 450 W Xe arc lamp, a cooled (−20 °C) single-photon counting photomultiplier (Hamamatsu R928, Hamamatsu City, Japan), and lens optics for powder samples. For excitation and emission measurements, the step size was 0.5 nm, and the dwell time was 0.2 s. Excitation spectra were measured in the range from 250 to 585 nm. Emission spectra were measured in the range from 450 to 800 nm. The photoluminescence emission spectra were corrected using the correction file obtained from a tungsten incandescent lamp certified by NPL (National Physics Laboratory, Teddington, UK). Excitation wavelengths of 393.0 nm were selected, while the emission was monitored at 591 nm.
The magnetization of samples was recorded using a vibrating sample magnetometer consisting of the lock-in amplifier SR510 (Stanford Research Systems, Sunnyvale, CA, USA), the gauss/tesla meter FH–54 (Magnet Physics, Cologne, Germany), and the laboratory magnet supplied by the power source SM 330–AR–22 (Delta Elektronika, Zierikzee, The Netherlands).
3. Results and Discussion
To synthesize the monoclinic structure of Gd0.85−yLayPO4:15%Eu, it was decided to find out the conditions for the synthesis of LaPO4:1%Eu. It was decided to dope LaPO4 with 1 percent of Eu3+ for economic reasons. First, it aimed to clarify the influence of PO43− ions precursor and synthesis temperature on LaPO4:1%Eu structure. XRD was performed in order to determine the crystal structure of the LaPO4:Eu synthesized in the hydrothermal reactor and to assess the purity of the phase. If diammonium hydrogen phosphate (NH4)2HPO4) is used as a precursor of PO43− ions, as shown in Figure 1, it is observed that at different synthesis temperatures, two different crystal structures of LaPO4:1%Eu are formed.
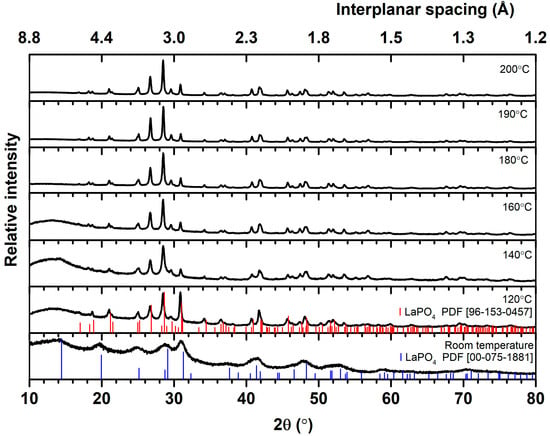
Figure 1.
XRD patterns of LaPO4:1%Eu samples synthesized using (NH4)2HPO4 at different temperatures.
Analysis of the diffractograms and comparison of the data obtained with the reference in the database shows that at a synthesis temperature equal to or higher than 160 °C, the peaks and their relative intensities of the experimental XRD data are in agreement with the standard data of the monoclinic LaPO4 structure (PDF ICCD 96–153–0457) corresponding to P121/n1 space group. The single-phase LaPO4:1%Eu with a monoclinic crystal structure is formed. At a lower synthesis temperature, 140 °C and below, the peaks attributed to the monoclinic phase are still dominant; nevertheless, an observable peak at 14.4° characteristic of the hexagonal crystal structure (P6222 space group) of LaPO4 (PDF ICCD 00–075–1881) and the peak at 28.6° degrees is asymmetric and is broadened towards higher 2θ values, which can be explained by the same hexagonal structure of the peak at 29.1°. Therefore, it can be said that a two-phase crystal structure is formed, the hexagonal and monoclinic crystal structure of LaPO4. Meanwhile, a pure hexagonal phase with low crystallinity is obtained at room temperature. Notably, the synthesis performed at room temperature is not considered a hydrothermal synthesis but rather the LaPO4:1%Eu obtained through the precipitation method.
A broad band ranging from 10° to 20° is also observed. This may be due to the amorphous nature of the synthesized material or the influence of the amorphous glass tray on which the research material was placed. The diffractograms show that the band from 10° to 20° disappears when the synthesis temperature exceeds 180 °C. All materials were prepared in the same way during the XRD analysis. Therefore, the material’s amorphousness itself influences it. In conclusion, a temperature of 120 °C is sufficient to obtain the dominant monoclinic LaPO4:1%Eu phase. Still, the pure monoclinic crystal structure phase is only achieved at 180 °C and higher temperatures when using diammonium hydrogen phosphate ((NH4)2HPO4) as a precursor of PO43− ions. The observations are confirmed by Le Bail fitting of all XRD patterns. The results are presented in Table 1, where lattice parameters of monoclinic and/or trigonal (hexagonal axis) structure product(s) are given. Note that lattice parameter values are very close to those used as a reference. The values of global user-weighted Chi2 (Bragg contrib.) vary from 0.729 to 2.08, indicating good matching between calculated and experimental data.

Table 1.
The values of cell parameters and χ2 of XRD patterns’ Le Bail fitting.
A hydrothermal reactor performed a series of syntheses with ammonium dihydrogen phosphate (NH4H2PO4) as a precursor of PO43− ions. Figure 2 presents the diffractograms of the XRD analysis. The diffractograms show that only at the synthesis temperature of 200 °C, a single-phase of LaPO4:1%Eu with a monoclinic crystal structure is obtained. There are no additional peaks in this diffractogram. At a synthesis temperature lower than 200 °C, a low-intensity peak corresponding to the hexagonal crystal structure of LaPO4 (PDF ICCD 00–075–1881) is visible at 14.4°, and the asymmetry of the peak at 29.1° is also observed. At the synthesis temperature of 140 °C, the peak at 14.4° becomes more prominent, and the peak at 29.1° starts to separate. Therefore, it can be stated that two-phase LaPO4:1%Eu is obtained at a lower synthesis temperature than 200 °C. Similar to the previously synthesized LaPO4:1%Eu series, a broad peak is observed at 10° to 20° at temperatures of 180 °C and below, which may indicate the amorphous nature of the synthesized material.
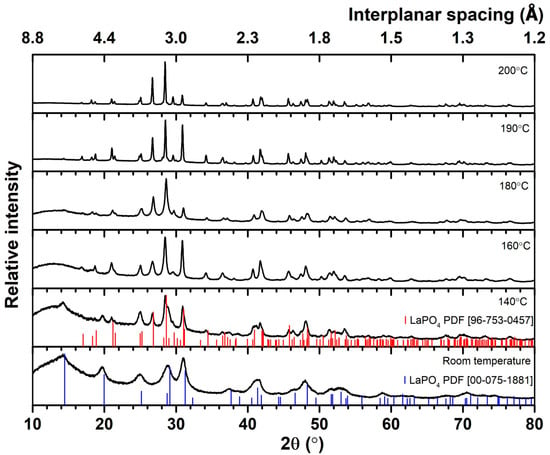
Figure 2.
XRD patterns of LaPO4:1%Eu samples were synthesized using NH4H2PO4 at different temperatures: from room temperature to 200 °C. The red and blue sticks are the data of references.
Therefore, by comparing the diffractograms of the first series synthesis using diammonium hydrogen phosphate as the PO43− ion precursor and the second series synthesis using ammonium dihydrogen phosphate as the PO43− ion precursor, it can be concluded that the ion precursor has an effect on the temperature at which the pure monoclinic crystal structure of the synthesized LaPO4:1%Eu product is formed. The pure monoclinic phase is formed at a lower temperature of 180 °C when using (NH4)2HPO4. However, when using NH4H2PO4, the pure monoclinic phase is only formed at the synthesis temperature of 200 °C, and a hexagonal phase impurity is visible at lower temperatures. The results are additionally confirmed by Le Bail fitting analysis. The calculated values of lattice parameters and Chi2 are presented in Table 2. Again, the calculated values of lattice parameters are close to the reference, and Chi2 values are very low, indicating a good match between calculated and experimental data.

Table 2.
The values of cell parameters and χ2 of XRD patterns’ Le Bail fitting.
Scanning electron microscopy (SEM) was used to investigate the morphological characteristics of LaPO4:1%Eu particles synthesized at different temperatures using two different phosphate precursors: diammonium hydrogen phosphate ((NH4)2HPO4) and ammonium dihydrogen phosphate (NH4H2PO4). The resulting morphologies are shown in Figure 3A,B. At room temperature, both precursor systems gave irregular, agglomerated particles with generally spherical or ill-defined shapes. These morphologies are attributed to limited crystallization and particle growth due to insufficient thermal energy. As the synthesis temperature increased, significant morphological changes were observed. In both systems, particle shapes gradually evolved from irregular shapes to more defined, elongated structures resembling nanorods—particularly noticeable at temperatures above 160 °C. However, the degree of particle uniformity and size varied significantly depending on the precursor used. Samples synthesized with (NH4)2HPO4 produced more diminutive and more uniform particles across all temperatures compared with those synthesized with NH4H2PO4. For example, at 200 °C, the average length and width of particles synthesized with (NH4)2HPO4 were 1227 nm and 224 nm, respectively, whereas those synthesized with NH4H2PO4 reached 2652 nm in length and 609 nm in width—more than twice the size (Table 3 and Table 4). This highlights the remarkable influence of precursor type on particle growth and final morphology. The aspect ratio (length to width) also reflected this trend. The highest aspect ratio of 17.1 was observed for the sample synthesized at 120 °C using (NH4)2HPO4, indicating a brief regime favoring rapid axial growth before further thermal input altered the balance between longitudinal and radial crystal development. In contrast, NH4H2PO4-based samples exhibited more significant but less consistent aspect ratios, with a maximum of 13.6 at 180 °C. These observations suggest that thermal energy plays a key role in controlling anisotropic growth, while the chemical environment provided by the phosphate precursor further governs particle size distribution and morphological uniformity.
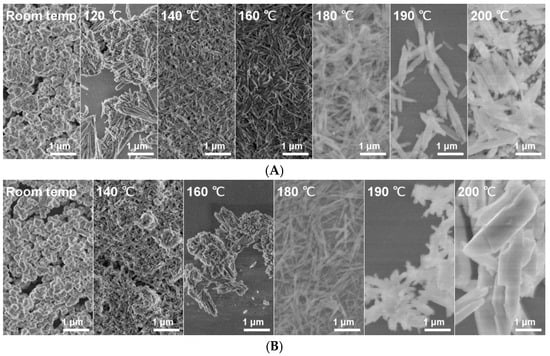
Figure 3.
(A) SEM images of LaPO4:1%Eu samples were synthesized using (NH4)2HPO4 at different temperatures: from room temperature to 200 °C (from left to right). (B) SEM images of LaPO4:1%Eu samples were synthesized using NH4H2PO4 at different temperatures.

Table 3.
The measured particle size of LaPO4:1%Eu samples was synthesized using (NH4)2HPO4 at different temperatures.

Table 4.
Measured particle sizes of LaPO4:1%Eu samples were synthesized using NH4H2PO4 at different temperatures.
In conclusion, SEM analysis shows that both synthesis temperature and phosphate precursor significantly influence the size, shape, and uniformity of LaPO4:1%Eu particles. Higher synthesis temperatures promote nanorod formation, with this effect becoming more pronounced above 160 °C. (NH4)2HPO4 results in more uniform and smaller particles, making it preferable when controlled morphology is desired. Conversely, NH4H2PO4 tends to produce larger and more variable structures, which may be advantageous in applications where higher surface area or specific aspect ratios are desirable.
Diammonium hydrogen phosphate (NH4)2HPO4 was chosen as the precursor of PO43− ions based on these synthesis and analysis results. Monoclinic crystal structure particles were synthesized through hydrothermal synthesis at 180 °C. A series of LaxGd1−xPO4:1%Eu synthesis was performed where x = 1, 0.75, 0.5, 0.25, and 0. The XRD analysis results are presented in Figure 4. The diffractogram shows that the material’s crystal structure obtained at x = 0.5, 0.25, and 0 is hexagonal, corresponding to the reference data of hexagonal Gadolinium Phosphate Hydrate (PDF ICDD 00–039–0232). Meanwhile, La0.75Gd0.24PO4:1%Eu is a mixture of monoclinic and hexagonal phases. The LaPO4:1%Eu sample exhibits only a monoclinic structure, contributing to the Lanthanum Phosphate (PDF ICDD 96–153–0457) reference. Furthermore, Rodriguez–Liviano et al. show that GdPO4 can be a tetragonal system with space group I41/amd [19]. In the present case, however, the tetragonal phase is not observed because the characteristic peaks at 19.5° (the third most intensive peak) or 35.1° 2θ (the second most intensive peak) are missing. In addition, Le Bail fitting was applied for all XRD patterns, confirming the interpretation that only monoclinic and/or tetragonal (with hexagonal axis) ones are formed under the given synthesis conditions. The cell parameter values, which are close to the reference, and the Chi2 values are given in Table 5.
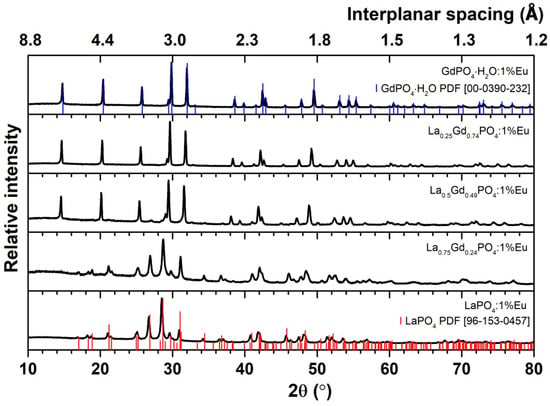
Figure 4.
XRD of LaxGd1−xPO4:1%Eu containing different content of lanthanum synthesized at 180 °C. The red and blue sticks are the data of LaPO4 and GdPO4·H2O references, respectively.

Table 5.
The values of cell parameters and χ2 of XRD patterns’ Le Bail fitting.
A slight increase in the intensity of the background line is observed between 10° and 20° when x = 0.50 and 0.75, indicating the amorphous nature of the synthesized material or the influence of the amorphous glass tray on which the research material was placed. Due to the constant annealing temperature of all samples, it is difficult to determine whether the phase elementary composition or sample preparation gives this effect.
SEM was used to examine the materials obtained during the syntheses. The SEM images of LaxGd1−xPO4:1%Eu obtained at a synthesis temperature of 180 °C reflect the morphology of the particles. The shape and size of the synthesized particles vary depending on the product composition. The sintered LaPO4:1%Eu particles (Figure 5A) have a similar shape, resembling nanorods, with an average length of 727 nm and an average width of 80 nm. The particles of La0.75Gd0.24PO4:1%Eu (Figure 5B) can be described as a precursor to nanorods, but they are shorter than the pure lanthanum phosphate particles mentioned earlier. The average particle length is 216 nm, and the average width is 58 nm. When gadolinium is present in the synthesized phosphate in equal or greater amounts than lanthanum, the particles lose their nanorod shape and become irregular, unevenly sized, cohesive polygons. These can no longer be classified as nanoparticles but rather as microstructures with a size of up to 5 µm, as shown in Figure 5D. The average particle length is 2.7 µm and 5E—1.6 µm.
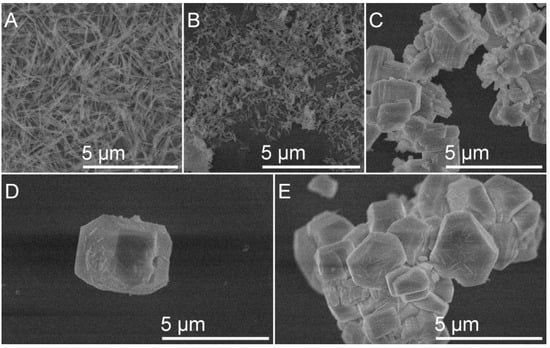
Figure 5.
SEM images of LaxGd1−xPO4:1% x = 1 (A); 0.75 (B); 0.5 (C); 0.25 (D); 0 (E).
Our previous study showed that GdPO4 exhibits the best luminescence properties when the sample is substituted with 15% europium [12]. Therefore, after evaluating the previously described synthesis and analysis results, we decided to increase the Eu3+ concentration from 1% to 15% by replacing La or Gd, resulting in a single-phase La0.75Gd0.24PO4:15%Eu with a monoclinic crystal structure. An XRD study evaluated the crystal structure, phase composition, and sample purity. XRD analyses of both samples have shown that a uniform phase composition was achieved, as shown in Figure 6. The XRD patterns of the samples correspond to the reference data of monoclinic Lanthanum Phosphate (PDF ICDD 96–153–0457), indicating a pure monoclinic phase. The Le Bail fitting analysis confirms the monoclinic structure. The calculated values of cell parameters are given in Table 6.
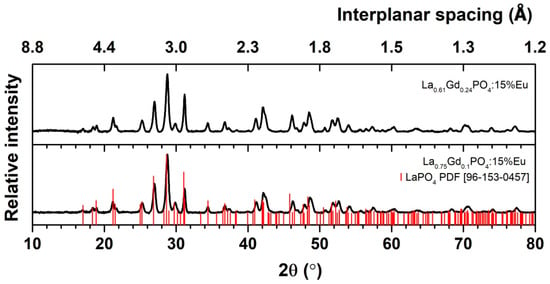
Figure 6.
XRD of La0.61Gd0.24PO4:15%Eu and La0.75Gd0.1PO4:15%Eu synthesized at 180 °C. The red sticks indicate data of LaPO4 reference.

Table 6.
The values of cell parameters and χ2 of XRD patterns’ Le Bail fitting.
SEM analysis was conducted to investigate the morphology and particle size of the materials obtained by hydrothermal synthesis. Nanorod-shaped particles were synthesized in both samples. However, the particles were not uniform in size or shape in either sample, with some particles adhering to one another (see Figure 7). In sample A (La0.75Gd0.1PO4:15%Eu), the particles were slightly shorter and thicker than in sample B (La0.61Gd0.24PO4:15%Eu). The length of La0.75Gd0.1PO4:15%Eu particles range from 45 nm to 150 nm, with very few smaller particles. The particle thickness ranges from 13 nm to 35 nm without measuring agglomerated particles. Sample B synthesized particles have a measured length ranging from 120 nm to 250 nm and a thickness ranging from 10 nm to 40 nm. The particles formed in sample A are slightly shorter but slightly thicker than those in sample B.
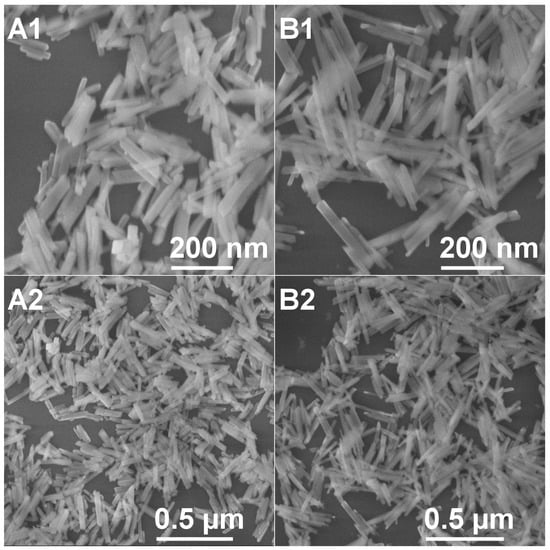
Figure 7.
SEM images of La0.61Gd0.24PO4:15%Eu (A1,A2) and La0.75Gd0.1PO4:15%Eu (B1,B2) under different magnifications.
The luminescent characteristics of La0.61Gd0.24PO4:15%Eu and La0.75Gd0.1PO4:15%Eu samples were examined and are shown in Figure 8 and Figure 9. As the samples appeared pure white, they were expected to exhibit minimal or no absorption within the visible spectrum. The excitation spectra were recorded from 250 nm to 585 nm, with an emission wavelength of λem = 591 nm. The excitation spectra demonstrated broadband at higher energy (ranging from 250 nm to 270 nm), attributable to charge transfer resulting from electron transfer from O2− to Eu3+. The 8S7/2 → 6PJ transitions of the Gd3+ ions were assigned to the narrow peaks at ~298 nm. The presence of these Gd3+ excitation lines in the excitation spectra monitored for Eu3+ ion indicated Gd3+ → Eu3+ energy transfer. The remaining excitation peaks were attributed to the Eu3+ ion. The peaks at ~318 nm were associated with the 7F0 → 5HJ transitions, while a cluster of several peaks was visible in the range of 370 nm to 390 nm, ascribed to the 7F0 →5D4, 7F0 → 5GJ, 7F0 → 5GJ; 5L7 transitions. The most intense peak at 393 nm was related to the transition 7F0 → 5L6. The small peaks at ~415 nm, ~463 nm, and ~527 nm were assigned to the transitions of 7F0 → 5D3, 7F0 → 5D2, and 7F0 → 5D1, respectively.
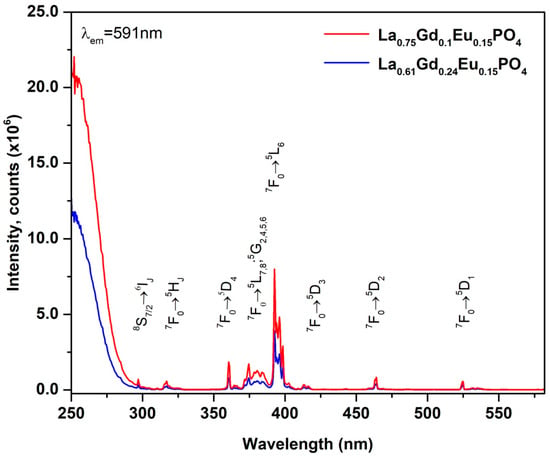
Figure 8.
Excitation spectra of La0.61Gd0.24PO4:15%Eu and La0.75Gd0.1PO4:15%Eu for 591 nm emission wavelength.
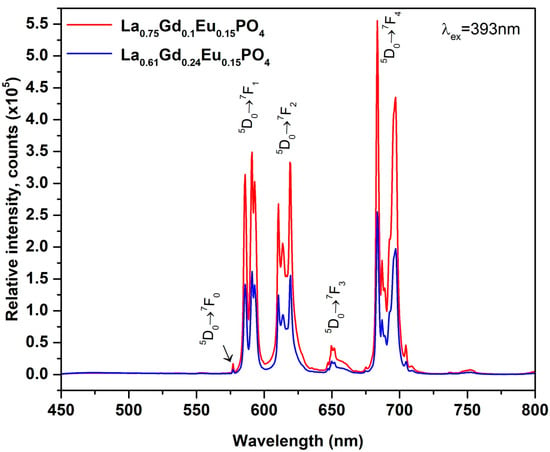
Figure 9.
Emission spectra of La0.61Gd0.24PO4:15%Eu and La0.75Gd0.1PO4:15%Eu under 393 nm excitation.
Figure 8 and Figure 9 show the luminescent characteristics of La0.61Gd0.24PO4:15%Eu and La0.75Gd0.1PO4:15%Eu samples. Since the samples were pure white, it was expected that they would exhibit minimal or no absorption within the visible spectrum. Excitation spectra were recorded from 250 nm to 585 nm, with an emission wavelength of λem = 591 nm. The excitation spectra show a broadband at higher energy (ranging from 250 nm to 270 nm), attributable to charge transfer resulting from electron transfer from O2− to Eu3+. The narrow peaks at ~298 nm were assigned to the 8S7/2 → 6PJ transitions of the Gd3+ ion. These Gd3+ excitation lines in the excitation spectra monitored for Eu3+ ion indicate Gd3+ → Eu3+ energy transfer. The remaining excitation peaks were attributed to the Eu3+ ion. The peaks at approximately 318 nm are associated with the 7F0 → 5HJ transitions, while a cluster of several peaks is visible in the range of 370 nm to 390 nm, ascribed to the 7F0 → 5D4, 7F0 → 5GJ, 7F0 → 5GJ; 5L7 transitions. The most intense peak at 393 nm is related to the transition 7F0 → 5L6. The small peaks at approximately 415 nm, 463 nm, and 527 nm are assigned to the transitions of 7F0 → 5D3, 7F0 → 5D2, and 7F0 → 5D1, respectively.
The luminescence properties of La0.61Gd0.24PO4:15%Eu and La0.75Gd0.1PO4:15%Eu samples were investigated by exciting them with a wavelength of 393 nm and measuring their emission spectra. The emitted radiation was found to be in the red color range, and the emission peaks were attributed to various transitions between energy levels of the Eu3+ ion. The emission spectral peaks at ~577 nm, ~590 nm, ~615 nm, ~650 nm and ~690 nm attributed to 5D0 → 7F0, 5D0 → 7F1, 5D0 → 7F2, 5D0 → 7F3, and 5D0 → 7F4 transitions, respectively. The peak with the highest intensity was observed at 690 nm, which is typical for Eu3+-substituted orthophosphates. As expected, and aimed for, the emission intensity of La0.75Gd0.1PO4:15%Eu is significantly higher and reaches 5.5 × 10⁵ counts compared with the previously synthesized and discussed samples with a hexagonal crystal system, where the maximum emission intensity is 5.5 × 10⁵ counts.
It is interesting to note that, despite both La0.61Gd0.24PO4:15%Eu and La0.75Gd0.1PO4:15%Eu samples exhibiting the same monoclinic crystalline structure, there is a high degree of similarity in terms of particle size (La0.75Gd0.1PO4:15%Eu particles are marginally larger). However, it has been demonstrated that emission can be strongly influenced by the luminescent center environment. Previous studies have shown that 5D0 → 7F4 emission increases with increasing electronegativity [23]. In this instance, further detailed studies are required, and neutron diffraction studies would be particularly valuable in explaining the structure–emission relationship in greater detail.
Figure 10 shows the dependence of magnetization on the strength of the applied magnetic field. For paramagnets, the magnetization is proportional to the applied magnetic field strength, given by M = χH, where the volume magnetic susceptibility χ is determined by the Curie–Weiss law
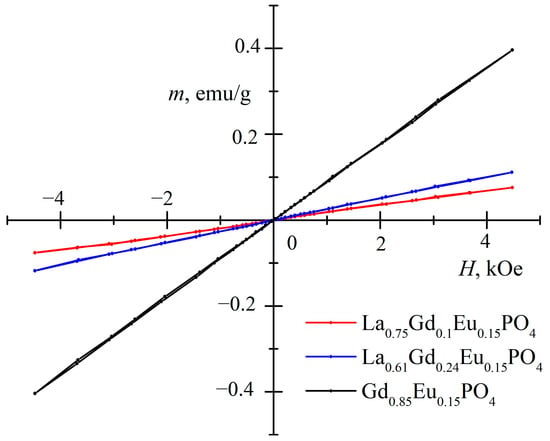
Figure 10.
Dependence of magnetization (m, emu/g) on magnetic field strength (H, kOe) at room temperature.
Here, N represents the number of paramagnetic atoms per unit volume, kB is the Boltzmann constant, and is the Weiss constant. The effective magnetic moment of a paramagnetic atom is given by the formula , where J is the angular momentum quantum number and μB is the Bohr magneton. Although J = 0 for the main state of Eu3+, its first excited state is close to it at room temperature, causing Eu3+ to also contribute to the paramagnetism of the samples [24]. However, the effective magnetic moment is larger for the Gd3+ ion with J = 7/2 and a g-factor of 2. Although magnetic susceptibility depends on the Weiss constant and deviations from the Curie–Weiss law are possible, due to the fact that the GdPO4 magnetic ordering temperature TN is quite close to room temperature at 225 K [25]. As La3+ is diamagnetic, the susceptibility differences for samples can mainly be explained by different amounts of Gd3+.
All three investigated samples exhibited paramagnetic properties and could potentially be used as contrast in magnetic resonance imaging (MRI). However, based on the luminescence measurements of the samples, La0.61Gd0.24PO4:15%Eu monoclinic nanorods showed the highest emission intensity and could potentially be used for multimodal imaging combining magnetic resonance imaging (MRI) and luminescence measurements.
4. Conclusions
The crystal structure of LaPO4:1%Eu was significantly influenced by the choice of the precursor of PO43− ions. The use of (NH4)2HPO4 precursor resulted in distinct crystal structures at lower temperatures compared with NH4H2PO4. A higher concentration of lanthanum in the LaxGd1−xPO4:1%Eu compound led to the formation of a monoclinic phase.
The luminescence emission was enhanced in La0.61Gd0.24PO4:15%Eu and La0.75Gd0.1PO4:15%Eu samples with an increased Eu3+ content. The emission spectra showed clear peaks that corresponded to Eu3+ transitions. The La0.75Gd0.1PO4:15%Eu samples exhibited superior emission intensity compared with the hexagonal counterparts.
The magnetization studies indicated paramagnetic behavior in the synthesized samples, which was influenced by the Gd3+ ions content.
La0.61Gd0.24PO4:15%Eu monoclinic nanorods exhibit paramagnetism and high luminescence emission intensity. This sample has potential for multimodal imaging through the combination of magnetic resonance imaging (MRI) and luminescence measurements.
Author Contributions
Conceptualization, R.S.; methodology, D.B. and E.B.; formal analysis, D.B., E.B. and K.M.; investigation, D.B. and E.B.; data curation, D.B., E.B., K.M. and R.S.; writing—original draft preparation, D.B.; writing—review and editing, R.S.; visualization, D.B. and E.B.; supervision, R.S. All authors have read and agreed to the published version of the manuscript.
Funding
This research received no external funding.
Data Availability Statement
Data available upon request.
Conflicts of Interest
The authors declare no conflict of interest.
References
- Huang, Y.; Boamah, P.O.; Gong, J.; Zhang, Q.; Hua, M.; Ye, Y. Gd (III) complex conjugate of low–molecular–weight chitosan as a contrast agent for magnetic resonance/fluorescence dual–modal imaging. Carbohydr. Polym. 2016, 143, 288–295. [Google Scholar] [CrossRef] [PubMed]
- Jahanbin, T.; Sauriat, H.; Spearman, P.; Benderbous, S.; Korri, H. Development of Gd(III) porphyrin–conjugated chitosan nanoparticles as contrast agents for magnetic resonance imaging. Mater. Sci. Eng. C. 2015, 52, 325–332. [Google Scholar] [CrossRef] [PubMed]
- Atabaev, T.S.; Shin, Y.C.; Song, S.J.; Han, D.W.; Hong, N.H. Toxicity and T2–weighted magnetic resonance imaging potentials of holmium oxide nanoparticles. Nanomaterials 2017, 7, 216. [Google Scholar] [CrossRef] [PubMed]
- Northrop, R.B. Noninvasive Instrumentation and Measurement in Medical Diagnosis; John Wiley & Sons: Hoboken, NJ, USA, 2001; Volume 2565, pp. 1–546. [Google Scholar] [CrossRef]
- Hifumi, H.; Yamaoka, S.; Tanimoto, A.; Citterio, D.; Suzuki, K. Gadolinium–based hybrid nanoparticles as a positive MR contrast agent. J. Am. Chem. Soc. 2006, 128, 15090–15091. [Google Scholar] [CrossRef]
- Golovynskyi, S.; Golovynska, I.; Stepanova, L.I.; Datsenko, O.I.; Liu, L.; Qu, J.; Ohulchanskyy, T.Y. Optical windows for head tissues in near–infrared and short–wave infrared regions: Approaching transcranial light applications. J. Biophotonics 2018, 11, e201800141. [Google Scholar] [CrossRef]
- Ren, W.; Tian, G.; Zhou, L.; Yin, W.; Yan, L.; Jin, S.; Zu, Y.; Li, S.; Gu, Z.; Zhao, Y. Lanthanide ion–doped GdPO4 nanorods with dual–modal bio–optical and magnetic resonance imaging properties. Nanoscale 2012, 4, 3754–3760. [Google Scholar] [CrossRef]
- Xu, Z.; Cao, Y.; Li, C.; Ma, P.; Zhai, X.; Huang, S.; Kang, X.; Shang, M.; Yang, D.; Dai, Y.; et al. Urchin–like GdPO4 and GdPO4:Eu3+ hollow spheres—Hydrothermal synthesis, luminescence and drug–delivery properties. J. Mater. Chem. 2011, 21, 3686. [Google Scholar] [CrossRef]
- Igashira, K.; Nakauchi, D.; Ogawa, T.; Kato, T.; Kawaguchi, N.; Yanagida, T. Effects of dopant concentration in Eu–doped Ca2MgSi2O7 single crystalline scintillators. Mater. Res. Bull. 2021, 135, 111155. [Google Scholar] [CrossRef]
- Yang, M.; Wu, Y.; Shi, J.; Li, H.; Zhao, X.; Ren, G. Effects of different Eu concentrations and Cu, Mg or Ba ions co–doping on optical and scintillation properties of LiCaAlF6:Eu single crystals. Radiat. Meas. 2021, 147, 1350–4487. [Google Scholar] [CrossRef]
- Yaiphaba, N.; Ningthoujam, R.S.; Singh, N.S.; Vatsa, R.K.; Singh, N.R. Probing of inversion symmetry site in Eu3+–doped GdPO4 by luminescence study: Concentration and annealing effect. J. Lumin. 2010, 130, 174–180. [Google Scholar] [CrossRef]
- Budrevičius, D.; Kajimoto, N.; Pakalniškis, A.; Tsuru, K.; Kareiva, A.; Skaudžius, R. Improvement of luminescent properties of GdPO4 doped with optimal europium concentration by Co–doping with lanthanum. Ceram. Int. 2023, 49, 2373–2379. [Google Scholar] [CrossRef]
- Adam, J.; Metzger, W.; Koch, M.; Rogin, P.; Coenen, T.; Atchison, J.; König, P. Light Emission Intensities of Luminescent Y2O3:Eu and Gd2O3:Eu Particles of Various Sizes. Nanomaterials. 2017, 7, 26. [Google Scholar] [CrossRef] [PubMed]
- Lisitsyn, V.M.; Valiev, D.T.; Tupitsyna, I.A.; Polisadova, E.F.; Oleshko, V.I.; Lisitsyna, L.A.; Andryuschenko, L.A.; Yakubovskaya, A.G.; Vovk, O.M. Effect of particle size and morphology on the properties of luminescence in ZnWO4. J. Lumin. 2014, 153, 130–135. [Google Scholar] [CrossRef]
- Hassairi, M.A.; Hernández, A.G.; Kallel, T.; Dammak, M.; Zambon, D.; Chadeyron, G.; Potdevin, A.; Boyer, D.; Mahiou, R. Spectroscopic properties and Judd–Ofelt analysis of Eu3+ doped GdPO4 nanoparticles and nanowires. J. Lumin. 2016, 170, 200–206. [Google Scholar] [CrossRef]
- Sahu, N.K.; Ningthoujam, R.S.; Bahadur, D. Disappearance and recovery of luminescence in GdPO4:Eu3+ nanorods: Propose to water/OH release under near infrared and gamma irradiations. J. Appl. Phys. 2012, 112, 836. [Google Scholar] [CrossRef]
- Rodriguez, S.; Becerro, A.I.; Alcántara, D.; Grazú, V.; Fuente, J.M.; Ocaña, M. Synthesis and Properties of Multifunctional Tetragonal Eu:GdPO4 Nanocubes for Optical and Magnetic Resonance Imaging Applications. Inorg. Chem. 2012, 52, 647–654. [Google Scholar] [CrossRef]
- Meyssamy, H.; Riwotzki, K.; Kornowski, A.; Naused, S.; Haase, M. Wet–Chemical Synthesis of Substituted Colloidal Nanomaterials: Particles and Fibers of LaPO4:Eu, LaPO4:Ce, and LaPO4:Ce,Tb. Adv. Mater. 1999, 11, 840–844. [Google Scholar] [CrossRef]
- Klimkeviciene, L.; Parafjanovic, E.; Klimkevicius, V.; Katelnikovas, A. Synthesis and optical properties of highly efficient Na7Mg13La(PO4)12:Eu3+ powders with excellent thermal stability. Ceram. Int. 2024, 50, 38456–38461. [Google Scholar] [CrossRef]
- Priya, R.; Mariappan, R.; Karthikeyan, A.; Palani, E.; Krishnamoorthy, E.; Gowrisankar, G. Review on rare earth metals doped LaPO4 for optoelectronic applications. Solid State Commun. 2021, 339, 114457. [Google Scholar] [CrossRef]
- Colomer, M.T.; Zur, L.; Ferrari, M.; Ortiz, A.L. Structural–microstructural characterization and optical properties of Eu3+,Tb3+–codoped LaPO4·nH2O and LaPO4 nanorods hydrothermally synthesized with microwaves. Ceram. Int. 2018, 44, 11993–12001. [Google Scholar] [CrossRef]
- Ullah, S.; Feng, Y.; Zhu, M.; Kong, H.; Sun, S.; Dou, C.; Zheng, F.; Tang, J.; Zhong, D.; Teng, B. Co–Precipitation Synthesis and Photoluminescence Properties of (GdxLa1−x) PO4:5 at.%Eu3+ Orange–Red Emitting Phosphors. J. Mater. Sci. Mater. Electron. 2019, 30, 14703–14713. [Google Scholar] [CrossRef]
- Skaudžius, R.; Katelnikovas, A.; Enseling, D.; Kareiva, A.; Jüstel, T. Dependence of the 5D0→7F4 transitions of Eu3+ on the local environment in phosphates and garnets. J. Lumin. 2014, 147, 290–294. [Google Scholar] [CrossRef]
- Kittel, C. Introduction to Solid State Physics, 8th ed.; John Wiley & Sons: Westlake Village, CA, USA, 2004. [Google Scholar]
- Wang, F.F.Y. Magnetic Susceptibilities of Gadolinium Orthophosphate (GdPO4). Phys. Status Solidi 1966, 14, 193–203. [Google Scholar] [CrossRef]
Disclaimer/Publisher’s Note: The statements, opinions and data contained in all publications are solely those of the individual author(s) and contributor(s) and not of MDPI and/or the editor(s). MDPI and/or the editor(s) disclaim responsibility for any injury to people or property resulting from any ideas, methods, instructions or products referred to in the content. |
© 2025 by the authors. Licensee MDPI, Basel, Switzerland. This article is an open access article distributed under the terms and conditions of the Creative Commons Attribution (CC BY) license (https://creativecommons.org/licenses/by/4.0/).