

Tremolite-Asbestos Presence in Roman Archaeological Site of Micia, Romania

 ,
, 
 , , and
Abstract
1. Introduction
2. Materials and Methods
2.1. Materials
2.2. Analytical Techniques
3. Results
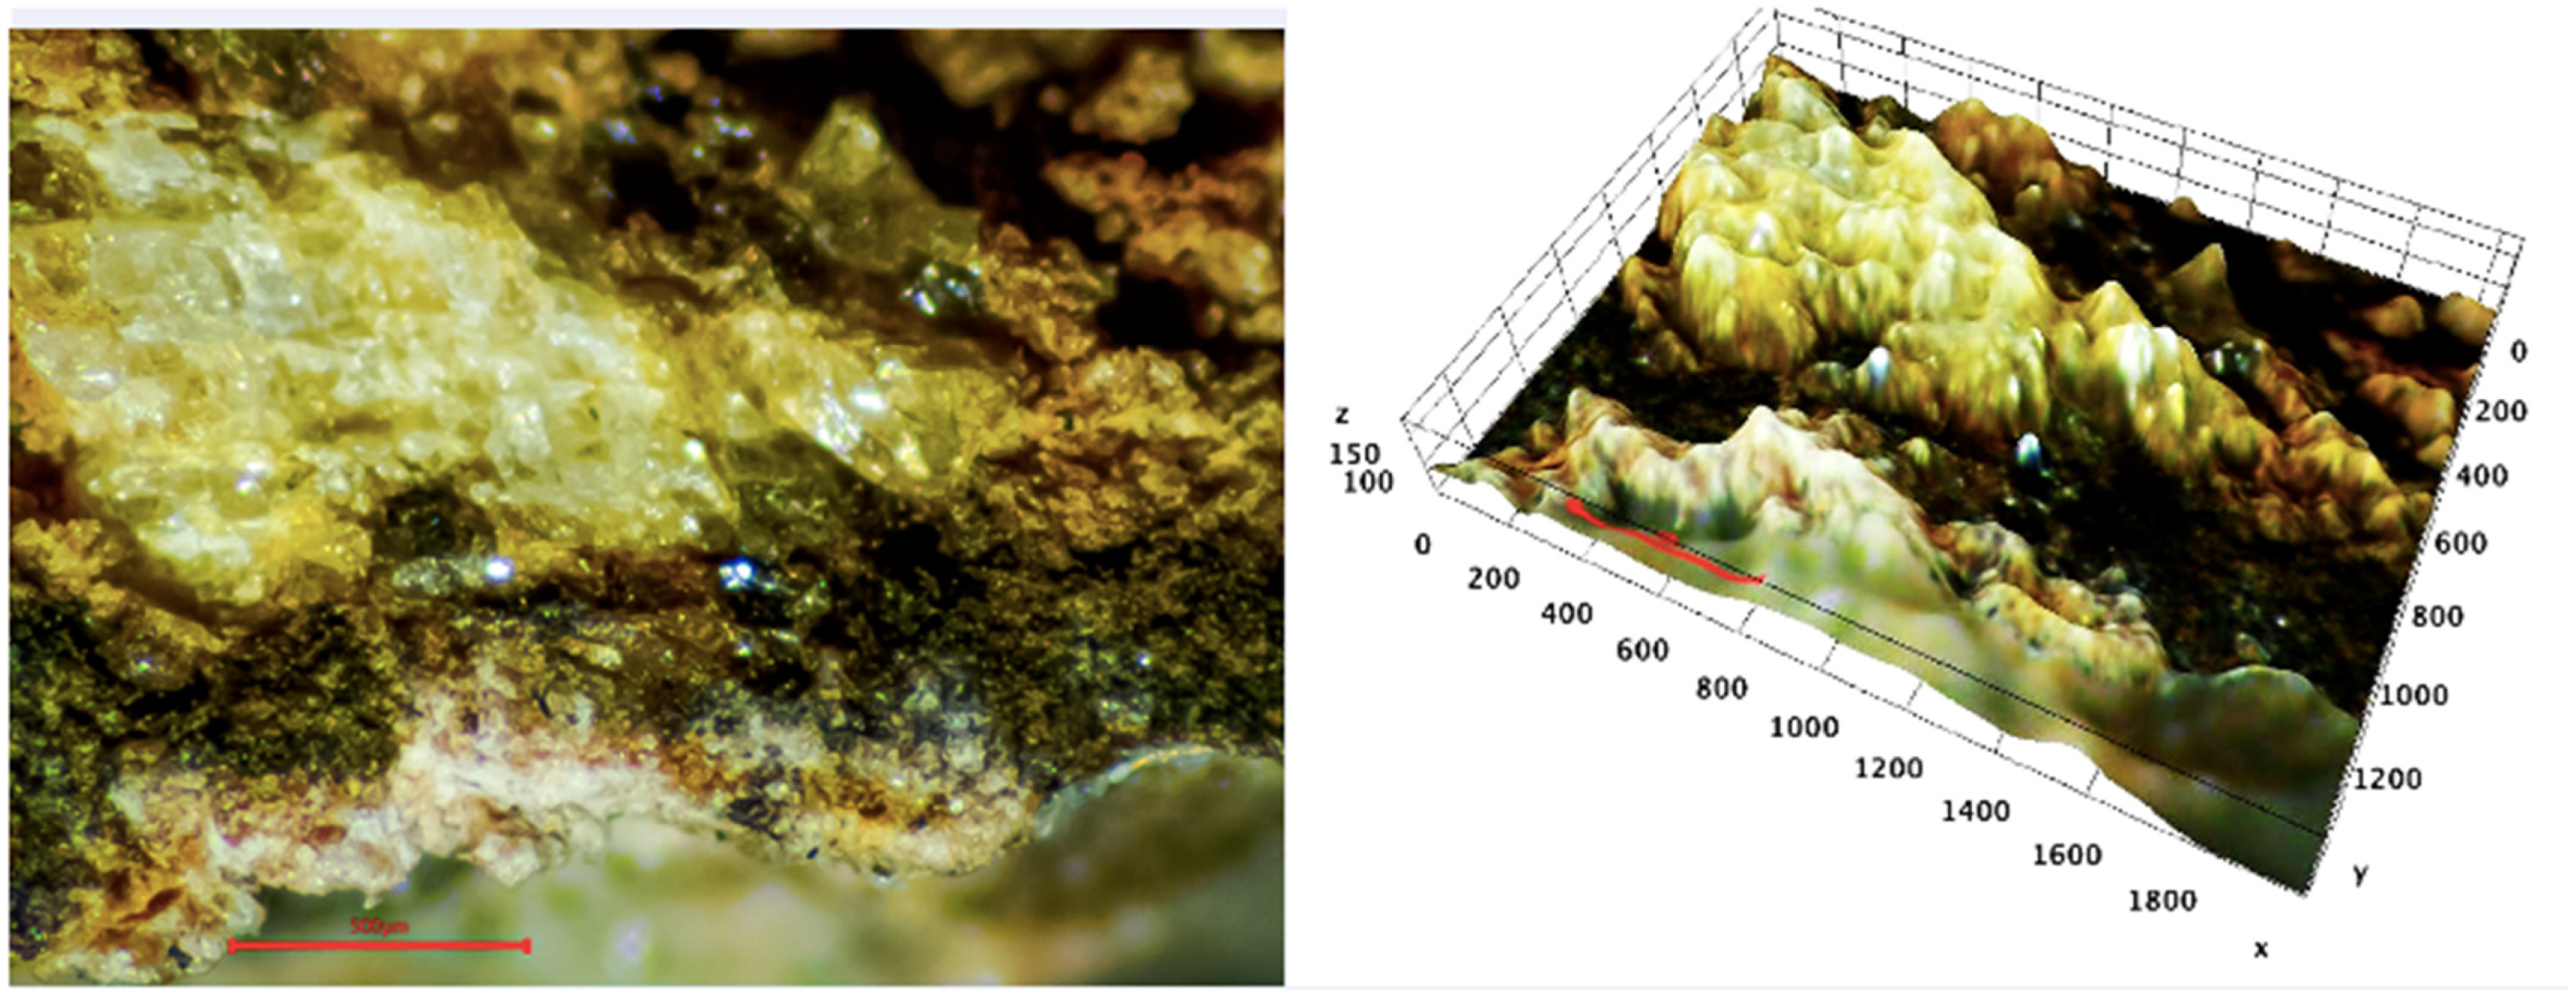
3.1. Optical Microscopy Evidence of Tremolite-Asbestos Fibers
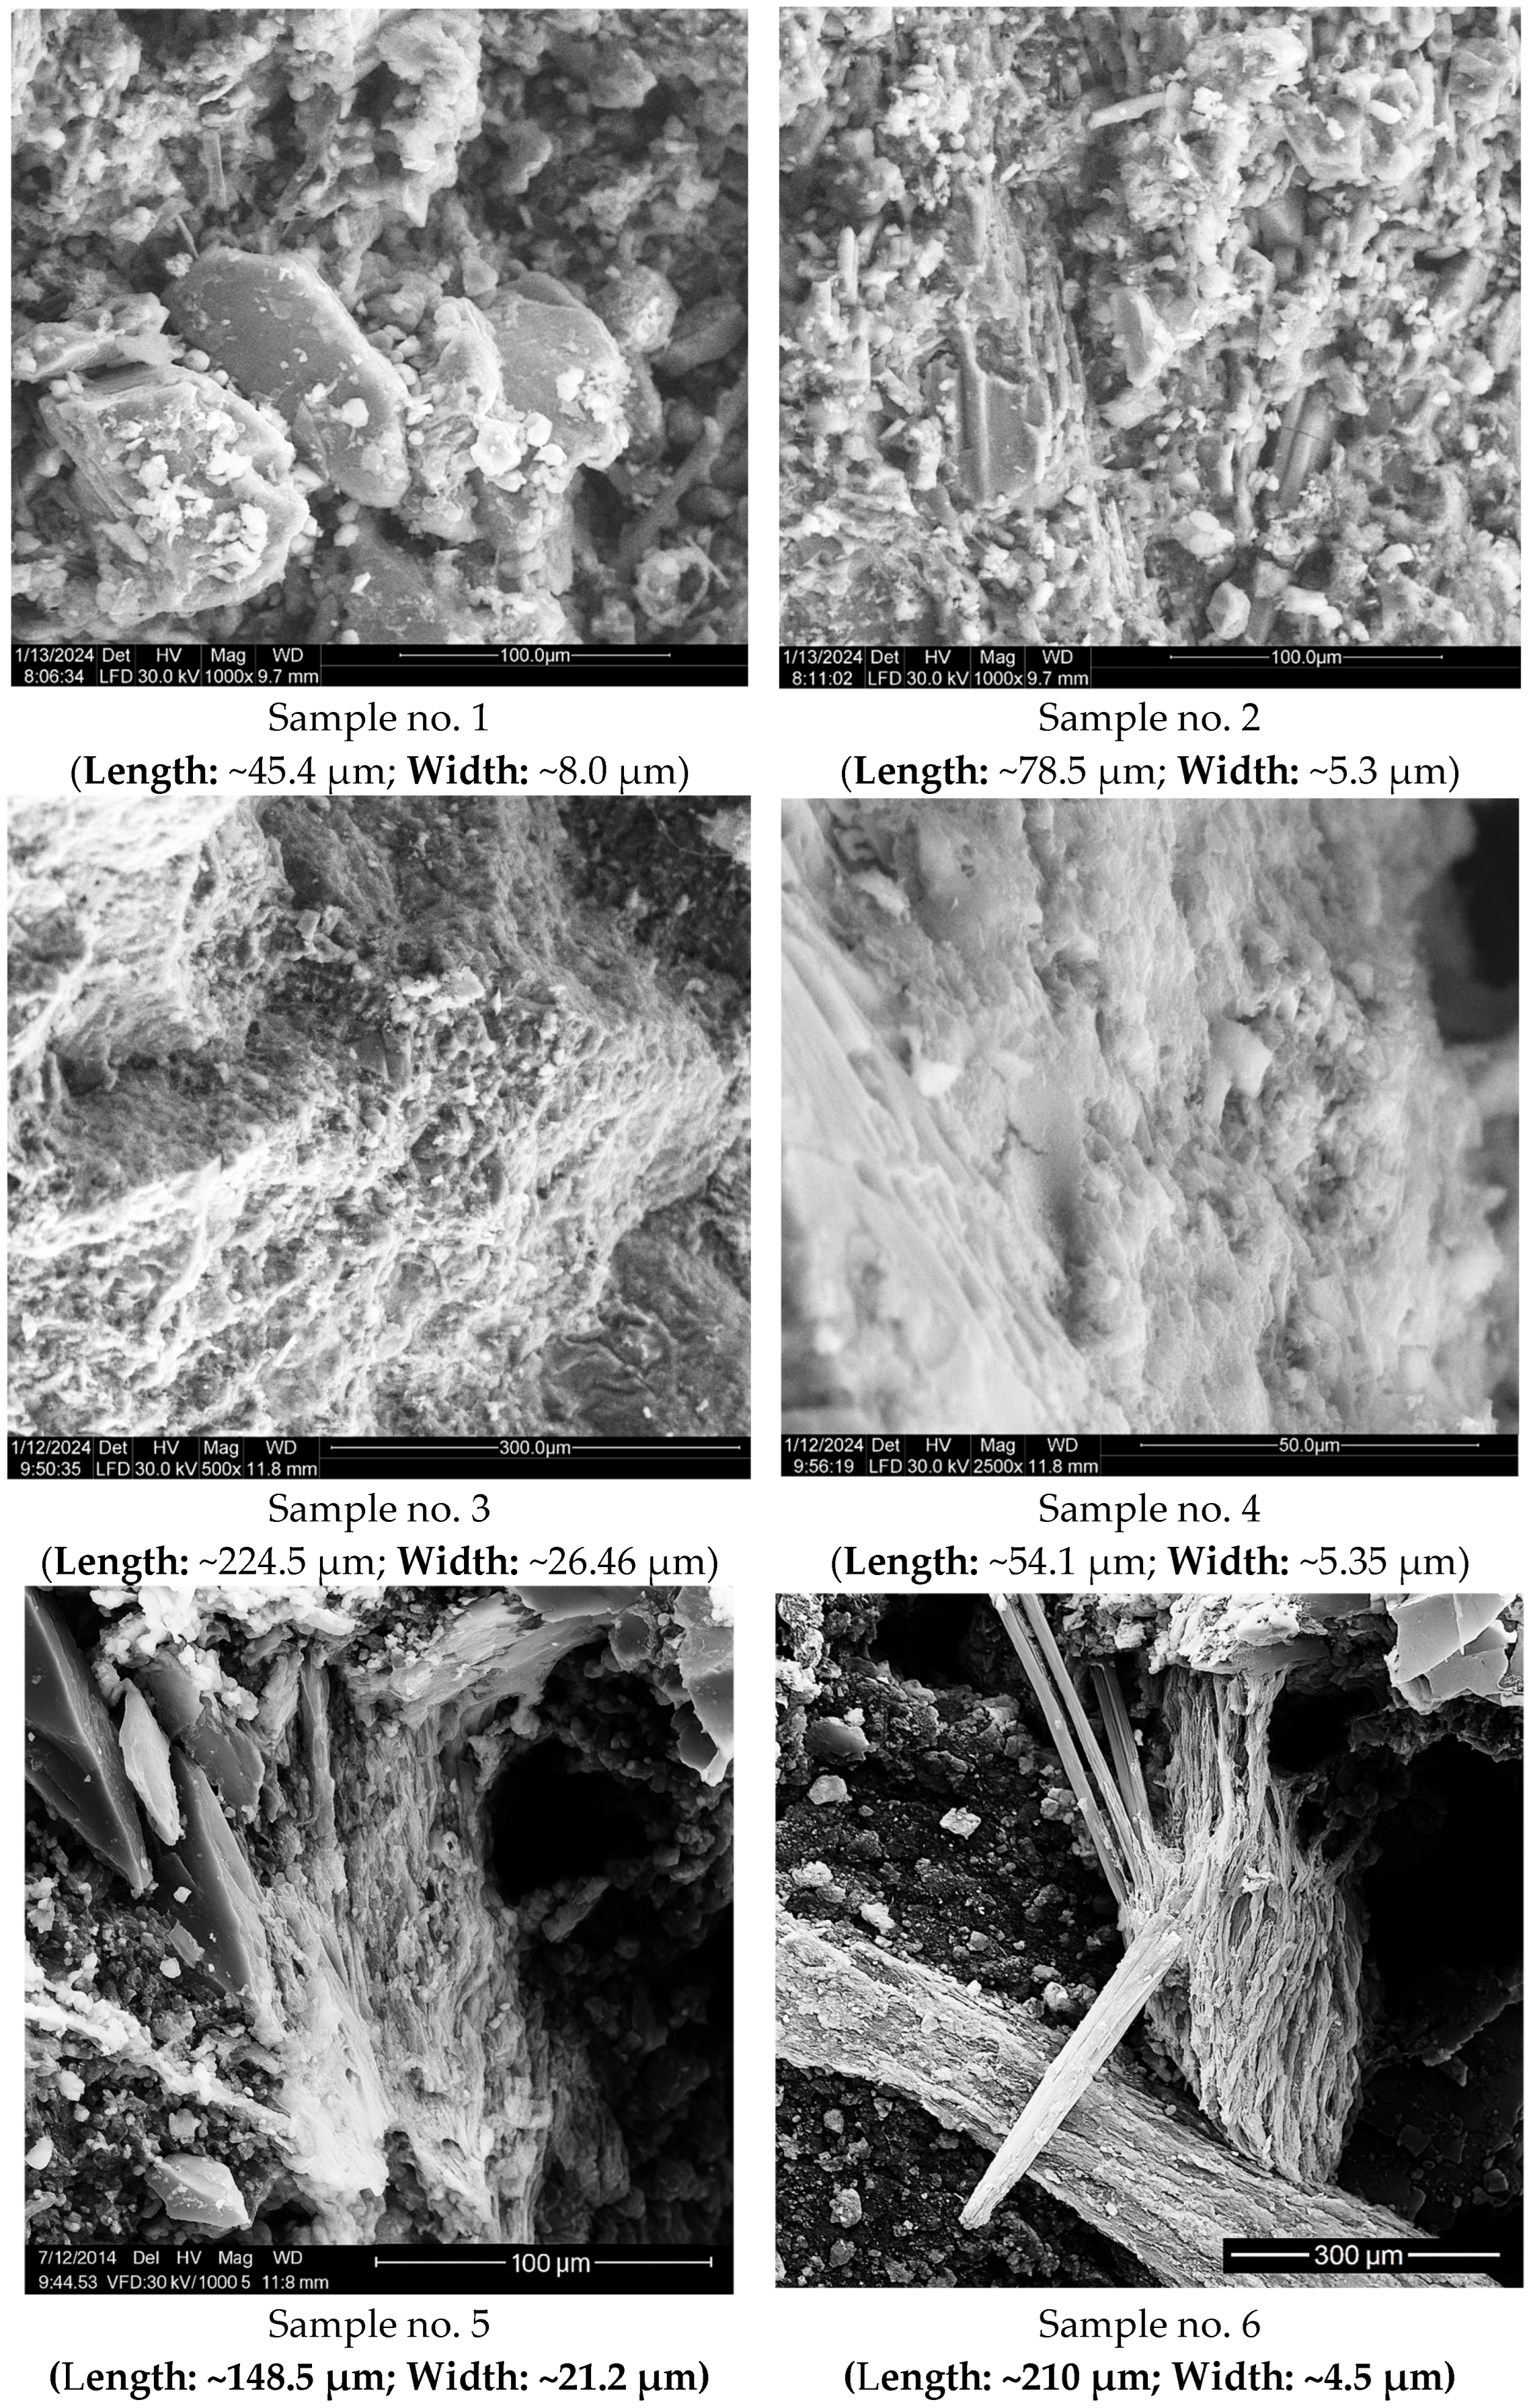
3.2. Scanning Electron Microscopy (SEM)
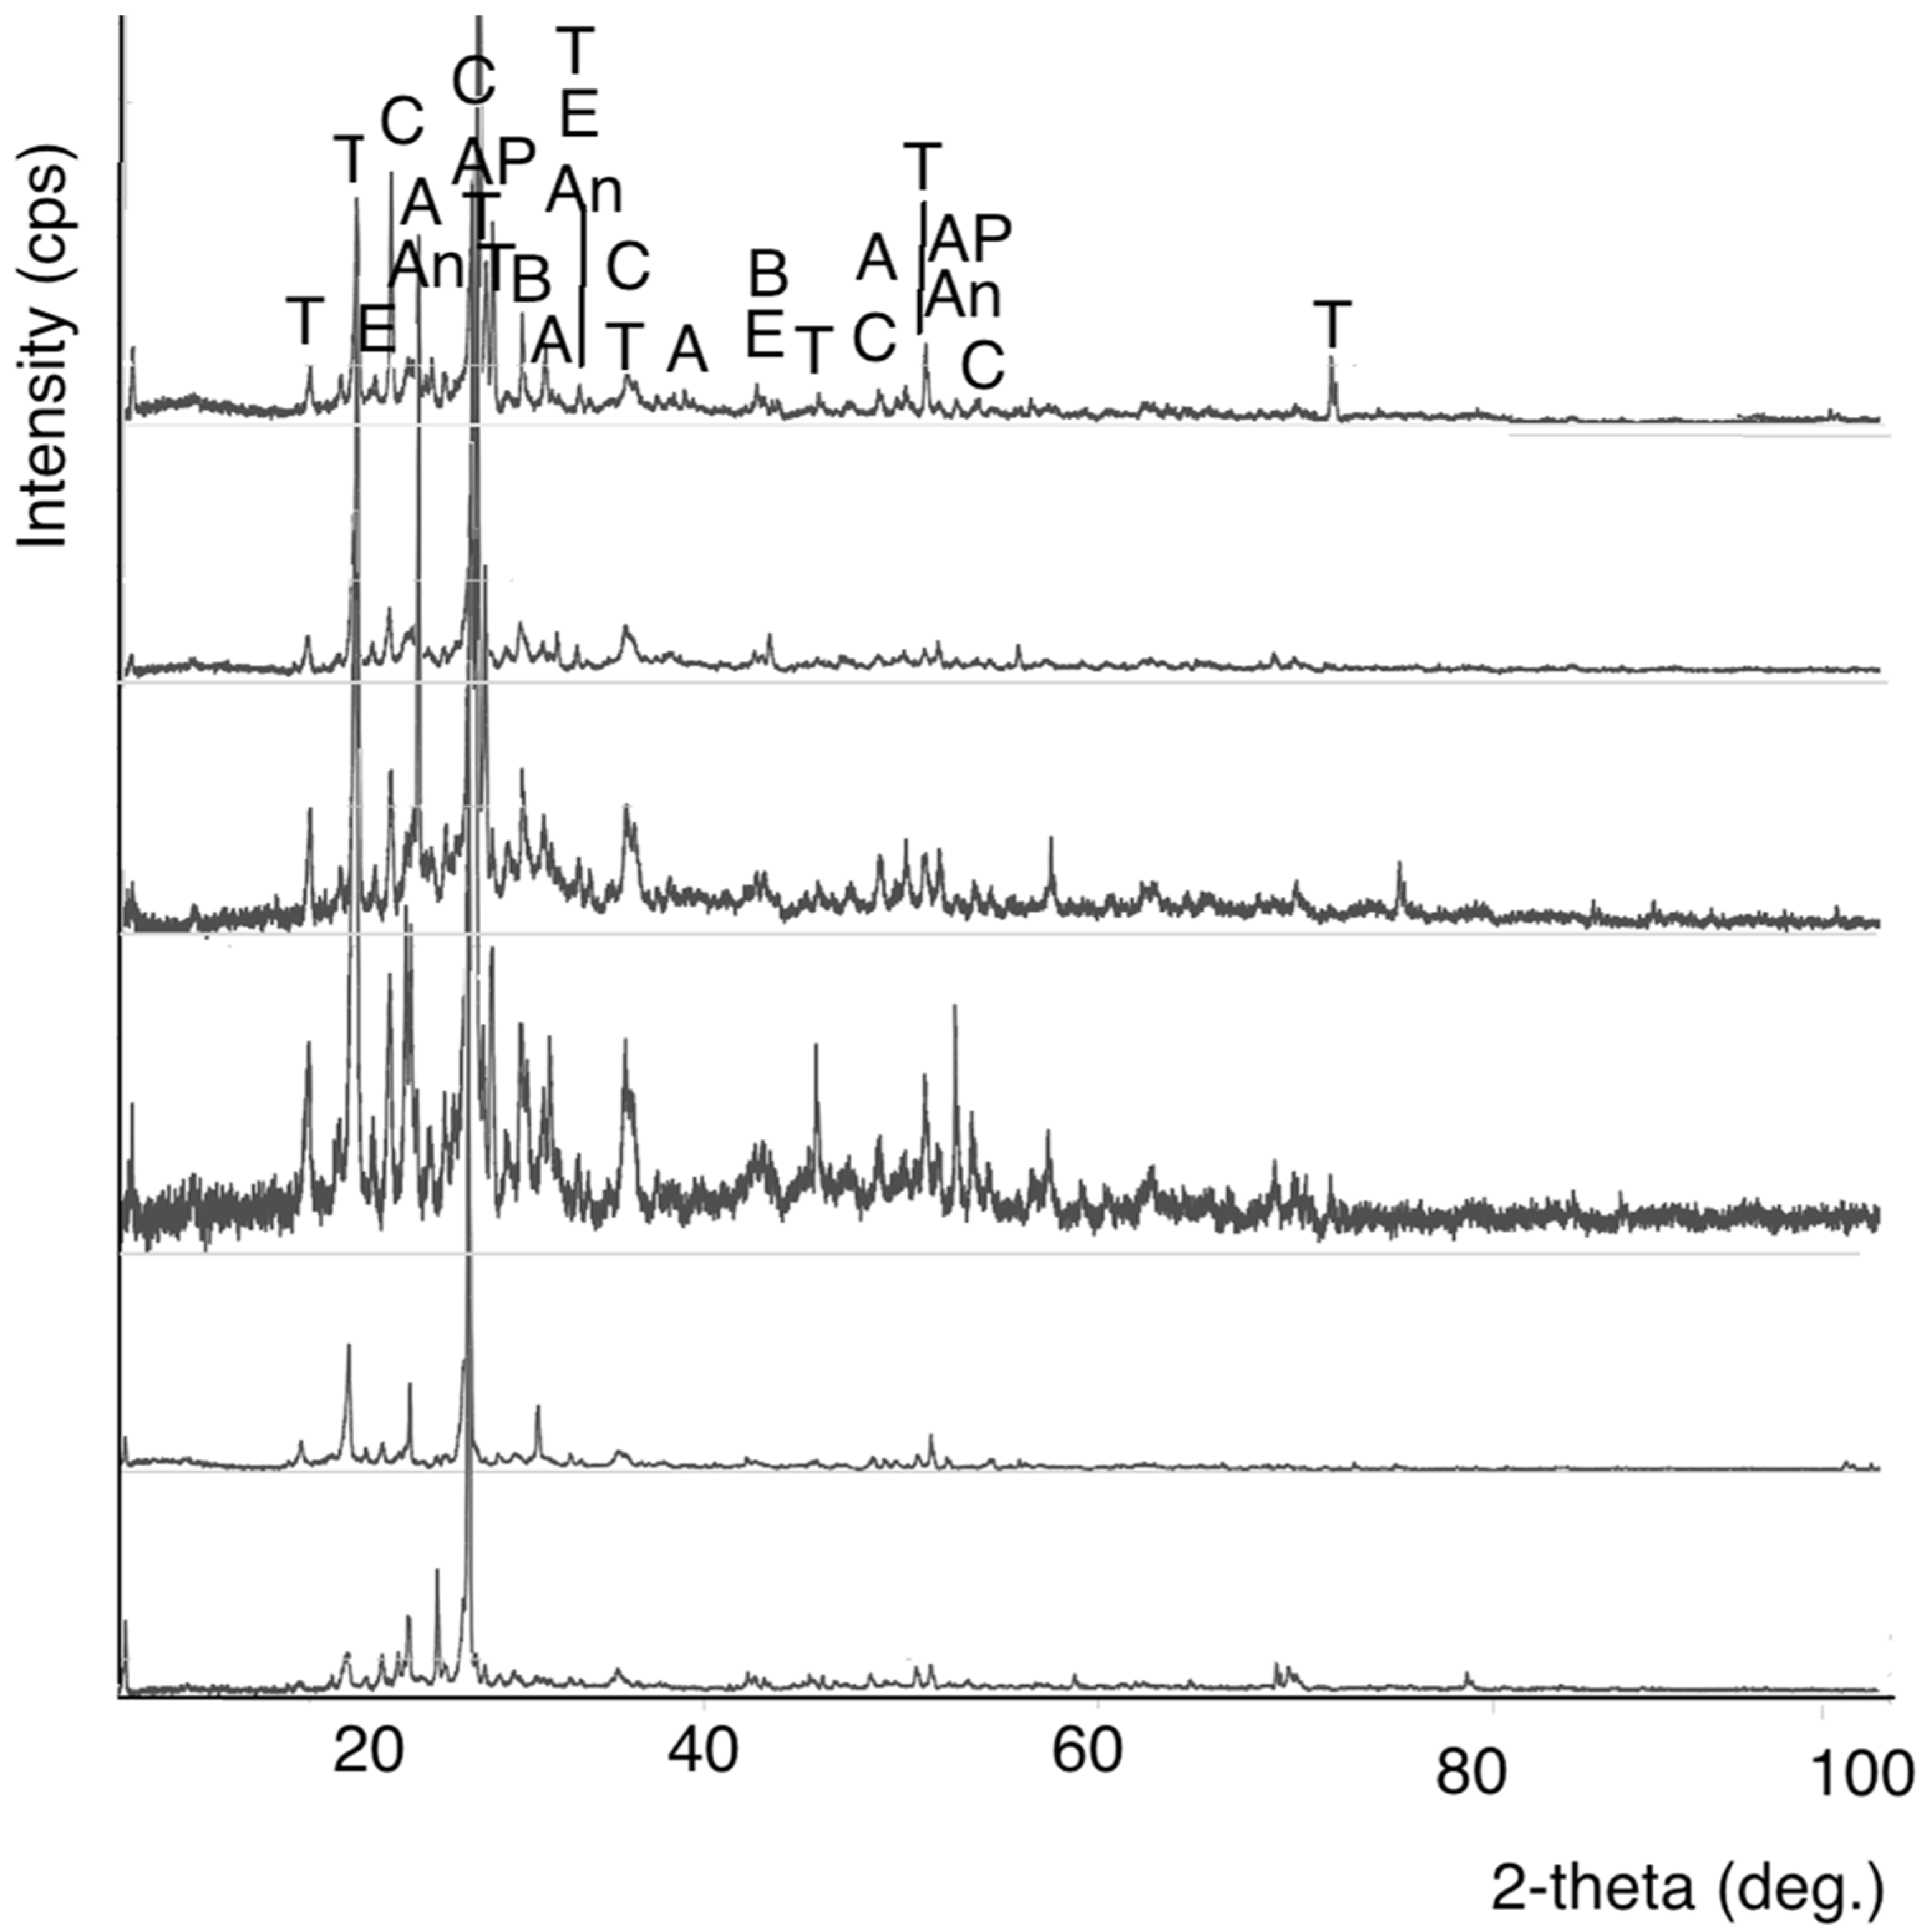
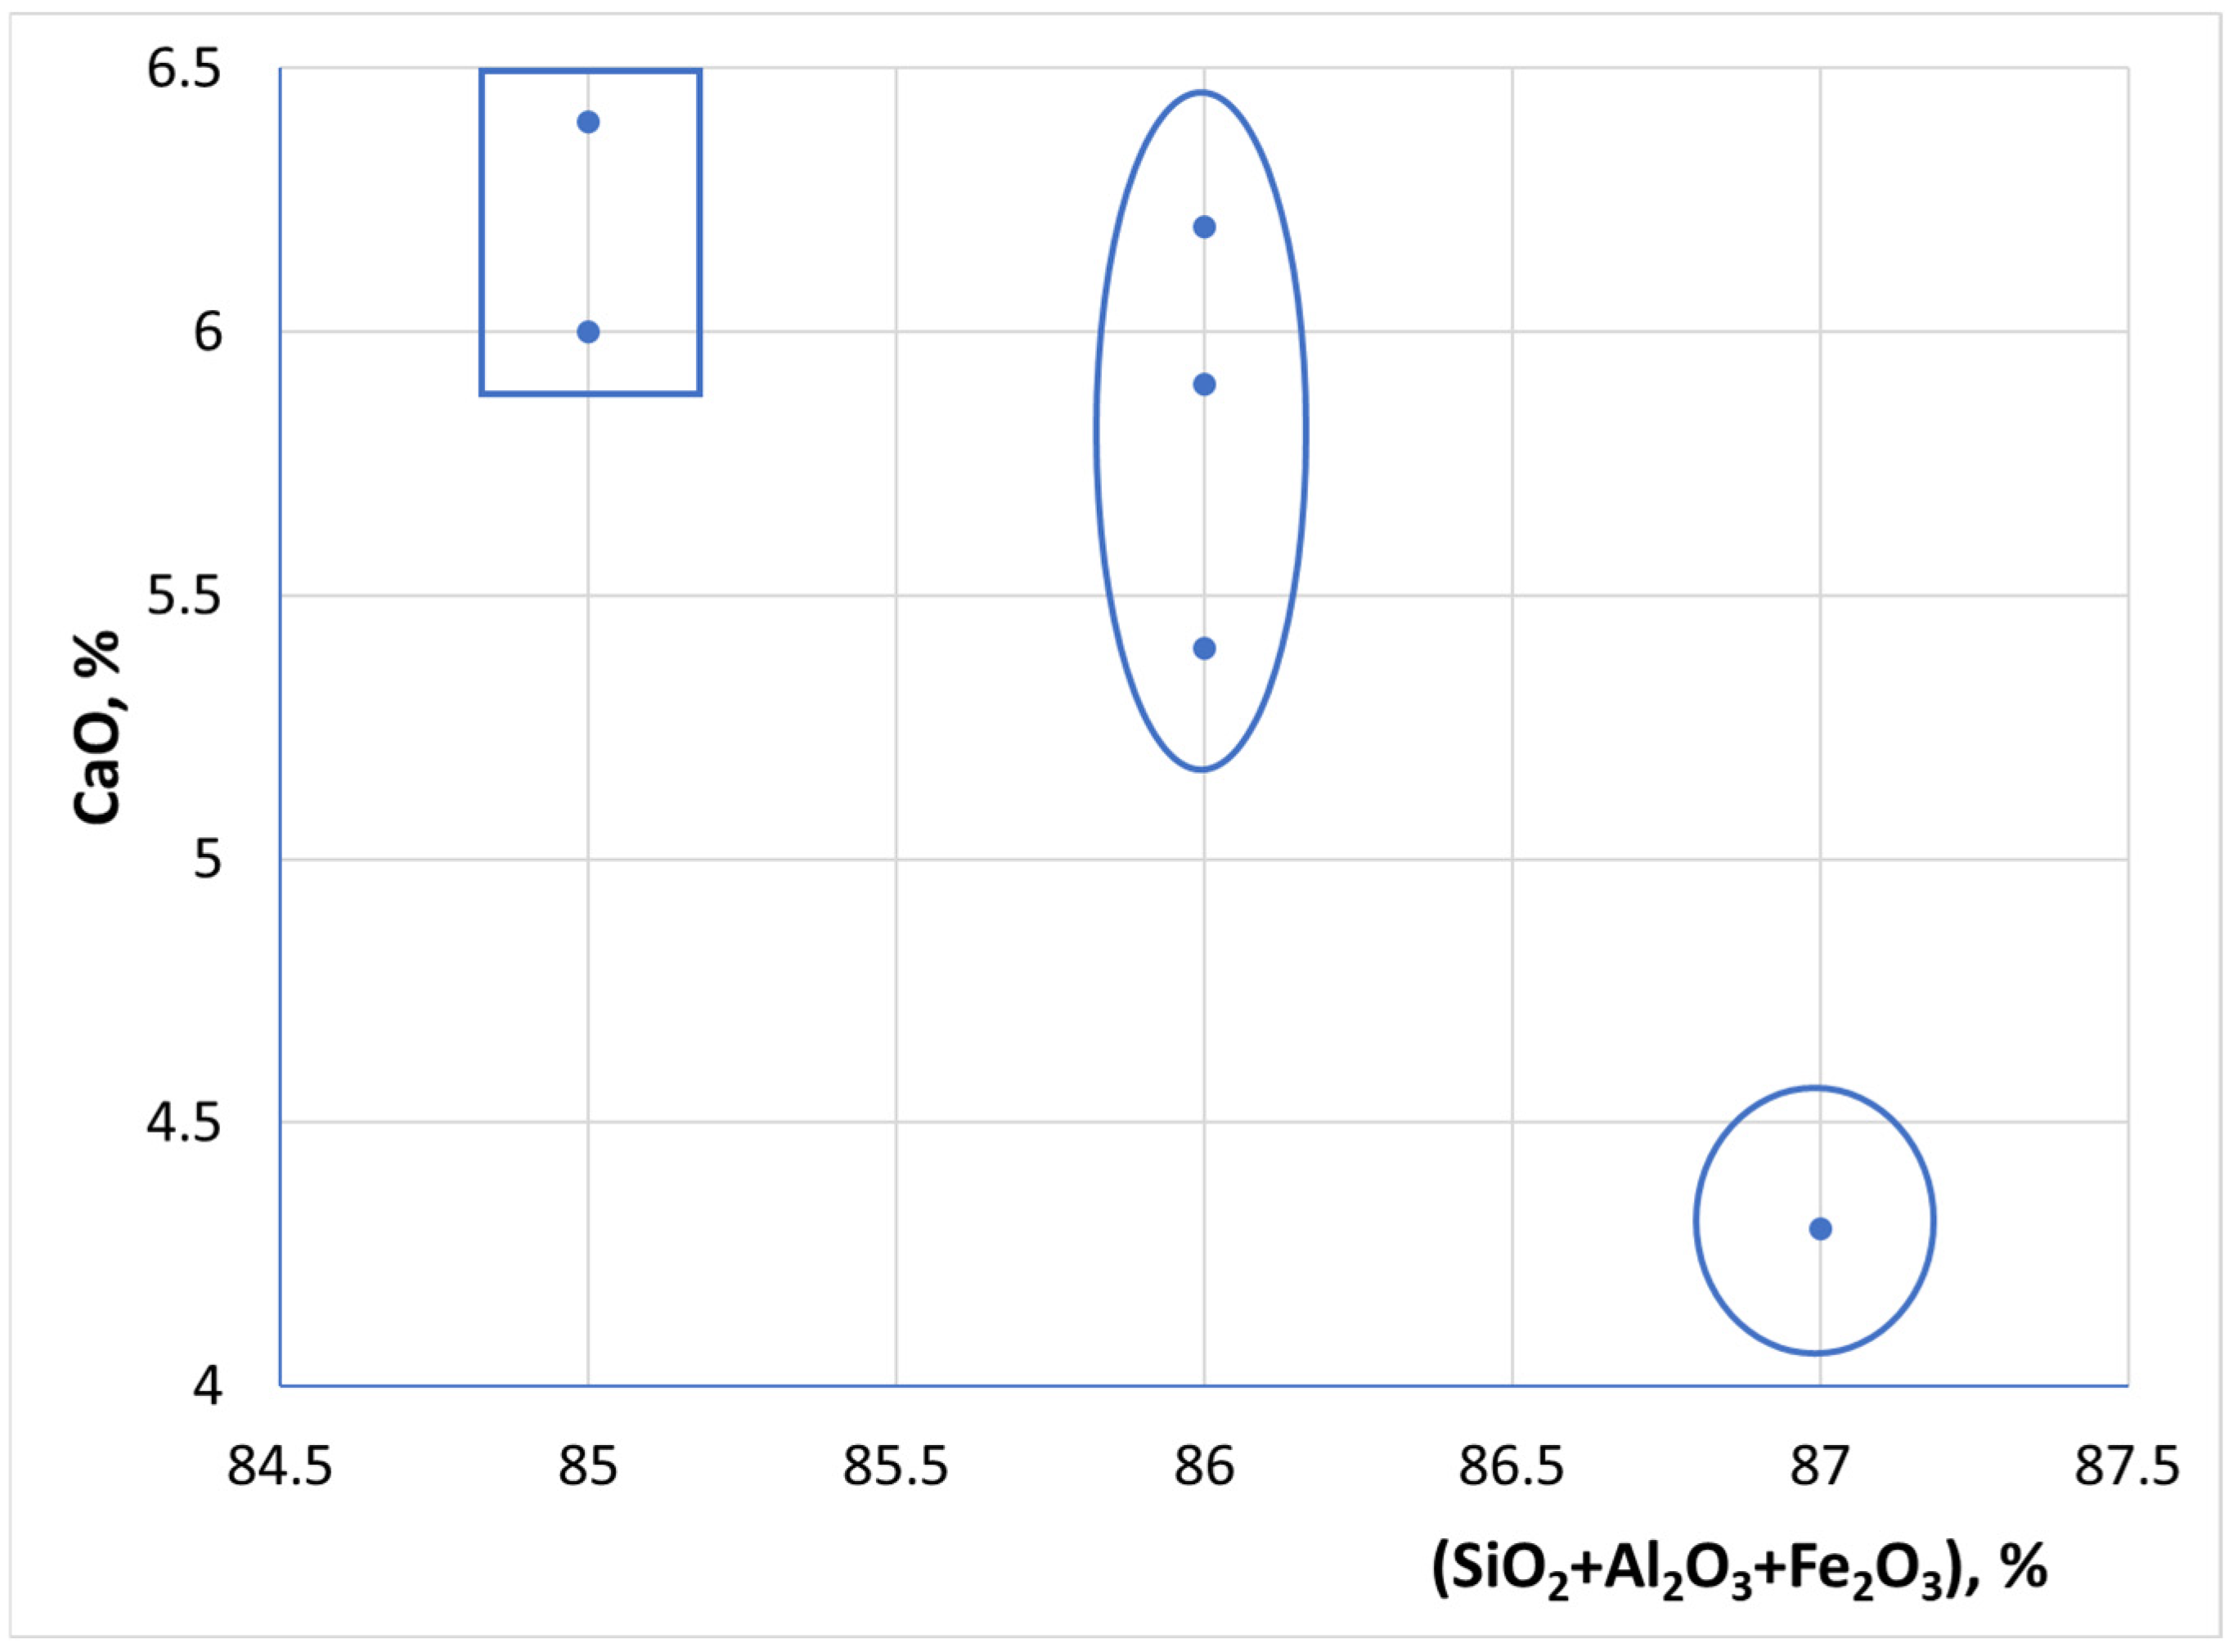
3.3. XRD/WDXRF Investigations
3.4. FTIR
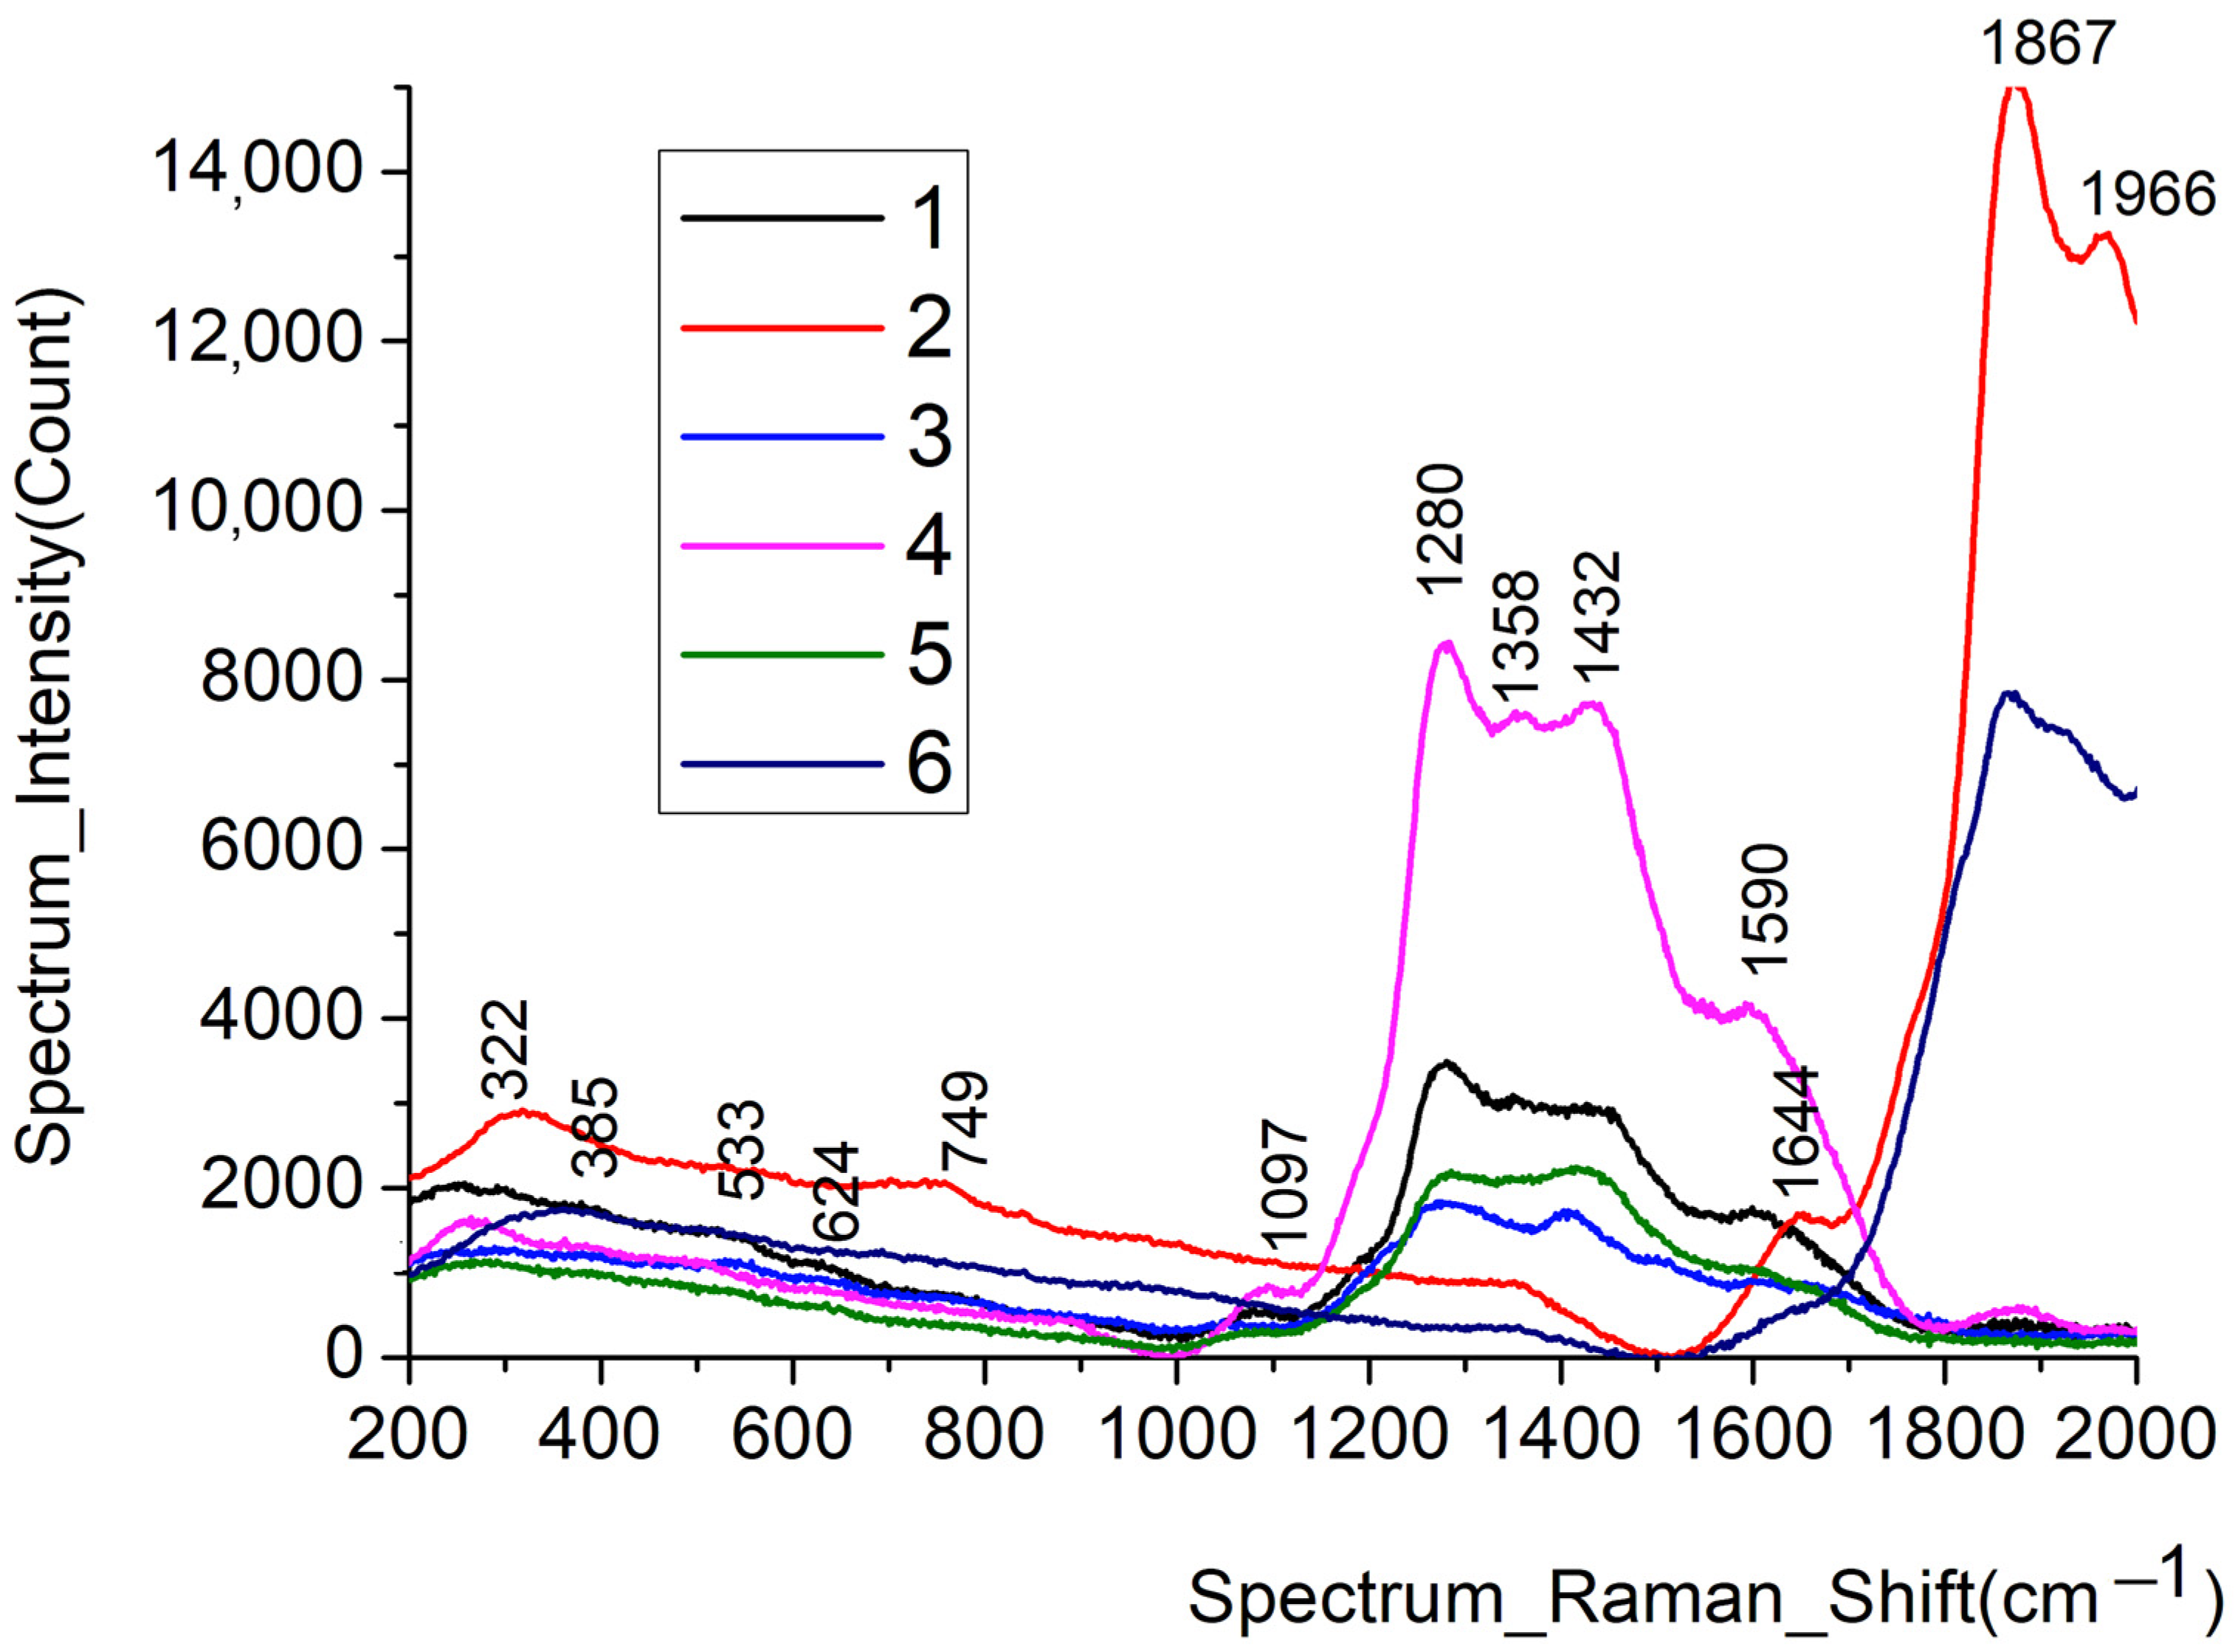
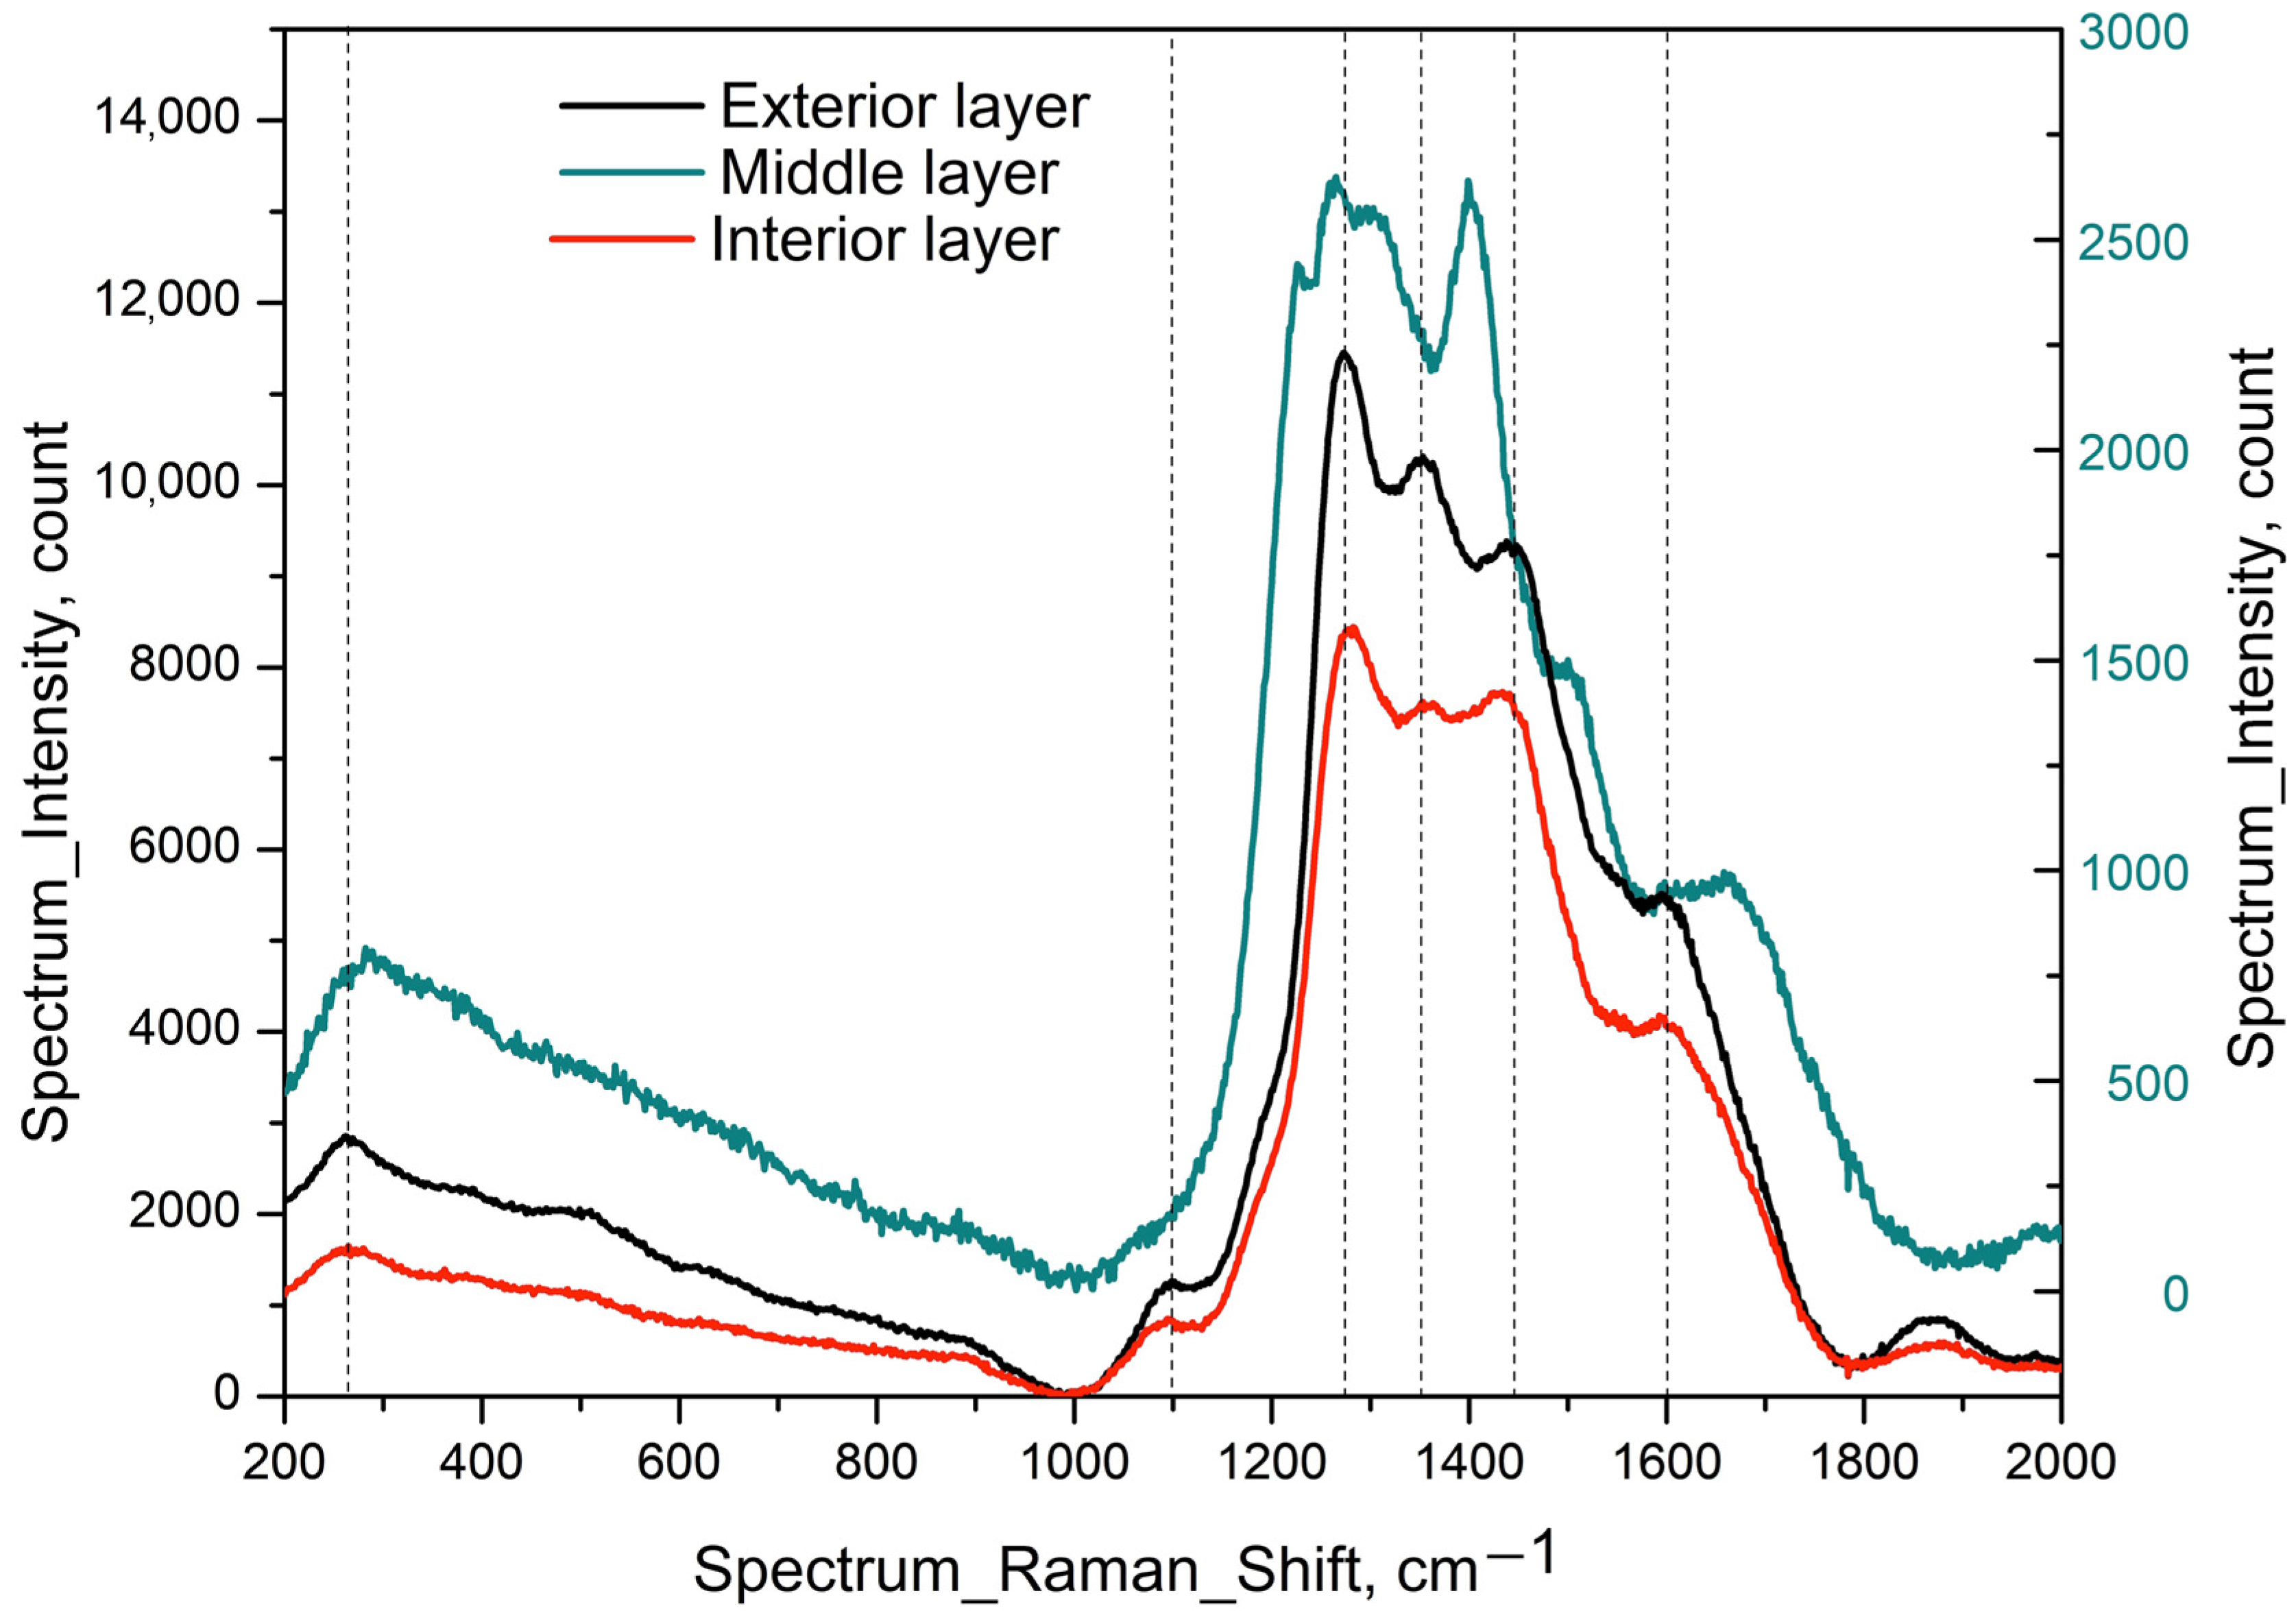
3.5. Raman Spectra
3.6. Thermogravimetric Analysis
4. Discussion
5. Conclusions
Author Contributions
Funding
Data Availability Statement
Conflicts of Interest
References
- Adam, J.P. Roman Building: Materials and Techniques; Taylor & Francis Group: London, UK, 1994. [Google Scholar]
- Ion, R.M.; Bakirov, B.A.; Kichanov, S.E.; Kozlenko, D.P.; Belushkin, A.V.; Radulescu, C.; Dulama, I.D.; Bucurica, I.A.; Gheboianu, A.I.; Stirbescu, R.M. Non-Destructive and micro-invasive techniques for characterizing the ancient Roman Mosaic fragments. Appl. Sci. 2020, 10, 3781. [Google Scholar] [CrossRef]
- Ion, R.-M.; Barbu, M.G.; Gonciar, A.; Vasilievici, G.; Gheboianu, A.I.; Slamnoiu-Teodorescu, S.; David, M.E.; Iancu, L.; Grigorescu, R.M. A Multi-Analytical Investigation of Roman Frescoes from Rapoltu Mare (Romania). Coatings 2022, 12, 530. [Google Scholar] [CrossRef]
- DeLaine, J. Theory and practice of Roman architecture: Studies offered to Pierre Gros. Antiquiti 2006, 80, 1020–1021. [Google Scholar] [CrossRef]
- Barbu, M.G.; Barbat, I.A. New Archaeological Information Regarding the Exploitation of Andesite in Măgura Uroiului (Hunedoara County). Sargetia 2017, 8, 71–121. [Google Scholar]
- Barbu, M.G.; Barbat, I.A.; Tutuianu, C.-D. New Data about the Exploitation of Andesite in Prehistory and Antiquity in the Proximity of Deva City. Terra Sebus 2021, 13, 57–91. [Google Scholar]
- Petculescu, L. Cercetari arheologice in castrul roman de la Micia. Cercet. Arheol. 1979, 3, 111–114. [Google Scholar]
- Petculescu, L.; Nemoianu, A.T.; Anastasiu, R. Raport preliminar asupra săpăturilor arheologice din 1978– 1979 în castrul Micia, co-muna Vetel, jud. Hunedoara. Cercet. Arheol. 1981, 4, 70–75. [Google Scholar]
- Negula, D.I.; Moise, C.; Lazăr, A.M.; Rișcuța, N.C.; Cristescu, C.; Dedulescu, A.L.; Mihalache, C.E.; Badea, A. Satellite remote sensing for the analysis of the Micia and Germisara archaeological sites. Remote Sens. 2020, 12, 2003. [Google Scholar] [CrossRef]
- Petculescu, L. Raport asupra sapaturilor arheologice din castrul Micia. Cercet. Arheol. 1983, 6, 45–50. [Google Scholar]
- Petculescu, L. Sapaturile arheologice din castrul Micia. Cercet. Arheol. 1984, 7, 117–119. [Google Scholar]
- Miriello, D.; Bloise, A.; Crisci, G.M.; Barrese, E.; Apollaro, C. Effects of milling: A possible factor influencing the durability of historical mortars. Archaeometry 2010, 52, 668–679. [Google Scholar] [CrossRef]
- Rietveld, H.M. The Rietveld method. Phys. Scr. 2014, 89, 098002. [Google Scholar] [CrossRef]
- Hawthorne, F.C.; Oberti, R.; Harlow, G.E.; Maresch, W.V.; Martin, R.F.; Schumacher, J.C.; Welch, M.D. Nomenclature of the amphibole supergroup. Am. Mineral. 2012, 97, 2031–2048. [Google Scholar] [CrossRef]
- Leake, B.E.; Woolley, A.R.; Arps, C.E.; Birch, W.D.; Gilbert, M.C.; Grice, J.D.; Hawthorne, F.C.; Kato, A.; Kisch, H.J.; Krivovichev, V.G. Nomenclature of amphiboles; report of the Subcommittee on Amphiboles of the International Mineralogical Association Commission on new minerals and mineral names. Mineral. Mag. 1997, 61, 295–310. [Google Scholar] [CrossRef]
- Langer, A.; Nolan, R.; Pooley, F. Phyllosilicates: Associated fibrous minerals. In Health Related Effects of Phyllosilicates; Springer: Berlin/Heidelberg, Germany, 1990; pp. 59–74. [Google Scholar]
- Gualtieri, A.F. EMU Notes in Mineralogy. Miner. Fibres Cryst. Chem. Chem. -Phys. Prop. Biol. Interact. Toxic. 2017, 18, 7–9. [Google Scholar]
- Di Giuseppe, D.; Perchiazzi, N.; Brunelli, D.; Giovanardi, T.; Nodari, L.; Della Ventura, G.; Malferrari, D.; Maia, M.; Gualtieri, A.F. Occurrence and characterization of tremolite asbestos from the Mid Atlantic Ridge. Sci. Rep. 2021, 11, 6285. [Google Scholar] [CrossRef]
- Rinaudo, C.; Belluso, E.; Gastaldi, D. Assessment of the use of Raman spectroscopy for the determination of amphibole asbestos. Mineral. Mag. 2004, 68, 455–465. [Google Scholar] [CrossRef]
- Pira, E.; Donato, F.; Maida, L.; Discalzi, G. Exposure to asbestos: Past, present and future. J. Thorac. Dis. 2018, 10, S237. [Google Scholar] [CrossRef]
- Rietveld, H. Line profiles of neutron powder-diffraction peaks for structure refinement. Acta Crystallogr. 1967, 22, 151–152. [Google Scholar] [CrossRef]
- Madsen, I.C.; Scarlett, N.V.; Kern, A. Description and survey of methodologies for the determination of amorphous content via X-ray powder diffraction. Z. Für Krist. 2011, 226, 944–955. [Google Scholar] [CrossRef]
- Chancey, R.T.; Stutzman, P.; Juenger, M.C.; Fowler, D.W. Comprehensive phase characterization of crystalline and amorphous phases of a Class F fly ash. Cem. Concr. Res. 2010, 40, 146–156. [Google Scholar] [CrossRef]
- Garcia-Mate, M.; Santacruz, I.; Cuesta, A.; Leon-Reina, L.; Aranda, M.A.; Baco, I.; Morin, V.; Walenta, G.; Gartner, E.; De la Torre, A.G. Amorphous determination in calcium sulfoaluminate materials by external and internal methods. Adv. Cem. Res. 2015, 27, 417–423. [Google Scholar] [CrossRef]
- Winter, J.D. Principles of Igneous and Metamorphic Petrology; Pearson Education: Harlow, UK, 2014; Volume 2. [Google Scholar]
- Chengyu, X.; Weihang, L.; Ziwei, C.; Yabin, W. Study on the infrared dynamic evolution characteristics of different joint inclination phyllite under uniaxial compression. Sci. Rep. 2023, 13, 9867. [Google Scholar] [CrossRef]
- Bailey, S.W. Crystal Structures of Clay Minerals and Their X-Ray Identification; Brindley, G.W., Brown, G., Eds.; Monograph 5 of the Mineralogical Society: London, UK, 1980. [Google Scholar]
- Vitruve. The Ten Books on Architecture; Dover Publications: Mineola, NY, USA, 1960. [Google Scholar]
- Deguara, R. Characterising and Classifying Archaeological Plasters and Mortars from Malta. Master’s Thesis, University of Malta, Msida, Malta, 2015. [Google Scholar]
- Pintea, I.; Udubasa, S.S.; Iatan, E.L.; Berbeleac, I.; Biraoanu, D.; Ciobotea-Barbu, O.C.; Ghinescu, E. Microthermometry and Raman spectroscopy of fluid and melt inclusions in the alpine porphyry copper deposits from Romania: Insights on micrometallogeny. Rom. J. Miner. Depos. 2019, 92, 9–32. [Google Scholar]
- Silva, B.; Rivas, T.; García-Rodeja, E.; Prieto, B. Distribution of ions of marine origin in Galicia (NW Spain) as a function of distance from the sea. Atmos. Environ. 2007, 41, 4396–4407. [Google Scholar] [CrossRef]
- Colomban, P.; Kremenović, A. Asbestos-based pottery from Corsica: The first fiber-reinforced ceramic matrix composite. Materials 2020, 13, 3597. [Google Scholar] [CrossRef] [PubMed]
- Hawthorne, F.C.; Ventura, G.D.; Robert, J.-L.; Welch, M.D.; Raudsepp, M.; Jenkins, D.M. A Rietveld and infrared study of synthetic amphiboles along the potassium-richterite–tremolite join. Am. Mineral. 1997, 82, 708–716. [Google Scholar] [CrossRef]
- Saravanapavan, P.; Hench, L.L. Mesoporous calcium silicate glasses. I. Synthesis. J. Non-Cryst. Solids 2003, 318, 1–13. [Google Scholar] [CrossRef]
- Apopei, A.I.; Buzgar, N. The Raman study of amphiboles. Analele Stiintifice De Univ. AI Cuza Din Iasi. Sect. 2 Geol. 2010, 56, 57. [Google Scholar]
- Bersani, D.; Andò, S.; Scrocco, L.; Gentile, P.; Salvioli-Mariani, E.; Fornasini, L.; Lottici, P.P. Composition of amphiboles in the tremolite–ferro–actinolite series by Raman Spectroscopy. Minerals 2019, 9, 491. [Google Scholar] [CrossRef]
- Leissner, L.; Schlüter, J.; Horn, I.; Mihailova, B. Crystal chemistry of amphiboles by Raman spectroscopy, Periodico di Mineralogia. In Proceedings of the 8th European Conference on Mineralogy and Spectroscopy (ECMS) 2015, Rome, Italy, 9–11 September 2015; pp. 109–110. [Google Scholar]
- Leissner, L.; Schlüter, J.; Horn, I.; Mihailova, B. Exploring the potential of Raman spectroscopy for crystallochemical analyses of complex hydrous silicates: I. Amphiboles. Am. Mineral. 2015, 100, 2682–2694. [Google Scholar] [CrossRef]
- Rispoli, C.; De Bonis, A.; Esposito, R.; Graziano, S.F.; Langella, A.; Mercurio, M.; Morra, V.; Cappelletti, P. Unveiling the secrets of Roman craftsmanship: Mortars from Piscina mirabilis (Campi Flegrei, Italy). Archaeol. Anthropol. Sci. 2020, 12, 8. [Google Scholar] [CrossRef]
- Ergenç, D.; Fort, R.; Varas− Muriel, M.J.; Alvarez de Buergo, M. Mortars and plasters—How to characterize aerial mortars and plasters. Archaeol. Anthropol. Sci. 2021, 13, 197. [Google Scholar] [CrossRef]
- Kostova, B.; Dumanov, B.; Stoyanov, V.; Shivachev, B. Thermal and phase analysis of Roman and Late Antiquity mortars from Bulgarian archaeological sites. J. Therm. Anal. Calorim. 2023, 148, 1543–1555. [Google Scholar] [CrossRef]
- Columbu, S.; Sitzia, F.; Ennas, G. The ancient pozzolanic mortars and concretes of Heliocaminus baths in Hadrian’s Villa (Tivoli, Italy). Archaeol. Anthropol. Sci. 2017, 9, 523–553. [Google Scholar] [CrossRef]
- Columbu, S.; Garau, A.M.; Lugliè, C. Geochemical characterisation of pozzolanic obsidian glasses used in the ancient mortars of Nora Roman theatre (Sardinia, Italy): Provenance of raw materials and historical–archaeological implications. Archaeol. Anthropol. Sci. 2019, 11, 2121–2150. [Google Scholar] [CrossRef]
- Ergenç, D.; Fort, R. Multi-technical characterization of Roman mortars from Complutum, Spain. Measurement 2019, 147, 106876. [Google Scholar] [CrossRef]
- Ergenç, D.; Fort, R. Accelerating carbonation in lime-based mortar in high CO2 environments. Constr. Build. Mater. 2018, 188, 314–325. [Google Scholar] [CrossRef]
- Ion, R.M.; Dumitriu, I.; Fierascu, R.C.; Ion, M.-L.; Pop, S.F.; Radovici, C.; Bunghez, R.I.; Niculescu, V. Thermal and mineralogical investigations of historical ceramic: A case study. J. Therm. Anal. Calorim. 2011, 104, 487–493. [Google Scholar] [CrossRef]
- Ion, R.-M.; Ion, M.-L.; Fierascu, R.; Serban, S.; Dumitriu, I.; Radovici, C.; Bauman, I.; Cosulet, S.; Niculescu, V. Thermal analysis of Romanian ancient ceramics. J. Therm. Anal. Calorim. 2010, 102, 393–398. [Google Scholar] [CrossRef]
- Rispoli, C.; Esposito, R.; Guerriero, L.; Cappelletti, P. Ancient Roman mortars from Villa del Capo di Sorrento: A multi-analytical approach to define microstructural and compositional features. Minerals 2021, 11, 469. [Google Scholar] [CrossRef]
- Gambino, F.; Glarey, A.; Cossio, R.; Appolonia, L.; d’Atri, A.; Borghi, A. SEM-EDS characterization of historic mortar as a tool in archaeometric study: An updated analytical protocol tested on the Roman theatre of Aosta (NW Italy). Archaeol. Anthropol. Sci. 2022, 14, 179. [Google Scholar] [CrossRef]
- Alvarez, J.I.; Martín, A.; Casado, P.G.a.; Navarro, I.; Zornoza, A. Methodology and validation of a hot hydrochloric acid attack for the characterization of ancient mortars. Cem. Concr. Res. 1999, 29, 1061–1065. [Google Scholar] [CrossRef]
- Fort, R.; Varas-Muriel, M.; Zoghlami, K.; Ergenç, D.; Zaddem, A. Analytical characterisation of 1st-and 2nd-century Roman mortars at the Utica archaeological site (Tunisia): Construction phases and provenance of the raw materials. J. Archaeol. Sci. Rep. 2024, 54, 104404. [Google Scholar] [CrossRef]
- Farci, A.; Floris, D.; Meloni, P. Water permeability vs. porosity in samples of Roman mortars. J. Cult. Herit. 2005, 6, 55–59. [Google Scholar] [CrossRef]
- Jackson, M.D.; Logan, J.M.; Scheetz, B.E.; Deocampo, D.M.; Cawood, C.G.; Marra, F.; Vitti, M.; Ungaro, L. Assessment of material characteristics of ancient concretes, Grande Aula, Markets of Trajan, Rome. J. Archaeol. Sci. 2009, 36, 2481–2492. [Google Scholar] [CrossRef]
- Pleuger, E.; Goiran, J.-P.; Mazzini, I.; Delile, H.; Abichou, A.; Gadhoum, A.; Djerbi, H.; Piotrowska, N.; Wilson, A.; Fentress, E. Palaeogeographical and palaeoenvironmental reconstruction of the Medjerda delta (Tunisia) during the Holocene. Quat. Sci. Rev. 2019, 220, 263–278. [Google Scholar] [CrossRef]


| No. | Investigated Sample | Stereomicroscopy Image |
|---|---|---|
| 1 |  | 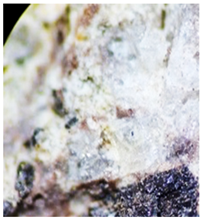 |
| 2 |  |  |
| 3 | 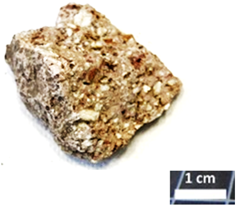 | 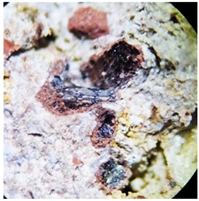 |
| 4 | 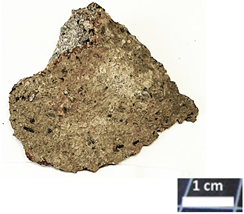 | 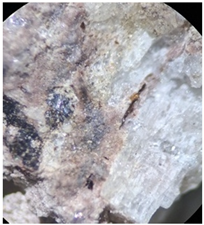 |
| 5 |  | 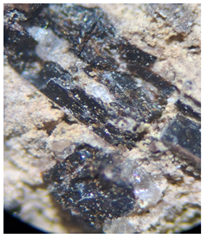 |
| 6 | 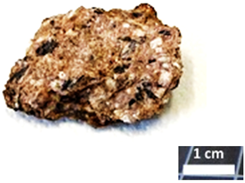 | 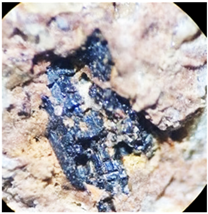 |
| Sample No. 1 | Sample No. 2 | Sample No. 3 | Sample No. 4 | Sample No. 5 | Sample No. 6 | |
|---|---|---|---|---|---|---|
| Oxide | Concentration, % | |||||
| Na2O | 3.4653 ± 0.31014 | 4.0862 ± 0.33715 | 3.4061 ±0.30668 | 4.0171 ±0.35643 | 3.2961 ±0.39452 | 3.0856 ±0.32632 |
| MgO | 1.3201 ± 0.14552 | 1.1072 ± 0.13904 | 1.0641 ±0.11972 | 0.6962 ±0.15198 | 0.9341 ±0.13627 | 0.9449 ±0.12918 |
| Al2O3 | 21.9109 ± 0.1086 | 21.3876 ± 0.11212 | 21.8862 ±0.1027 | 22.3247 ±0.11406 | 20.6651 ±0.11073 | 21.5919 ±0.10741 |
| SiO2 | 57.5004 ± 0.1559 | 60.7908 ± 0.1518 | 61.6323 ± 0.1518 | 58.7454 ± 0.1679 | 60.3688 ± 0.16446 | 58.0825 ± 0.15100 |
| P2O5 | 0.4008 ± 0.0306 | 0.3748 ± 0.03480 | 0.2378 ± 0.02660 | 0.2765 ± 0.04121 | 0.6779 ± 0.02934 | 0.6080 ± 0.03077 |
| SO3 | 0.5244 ± 0.02108 | 0.0368 ± 0.01854 | 0.0798 ± 0.02387 | 0.0936 ± 0.1969 | ||
| Cl | 0.0199 ± 0.00812 | 0.0190 ± 0.00710 | ||||
| K2O | 1.9290 ± 0.03656 | 1.9094 ± 0.03322 | 1.9792 ± 0.02981 | 1.8778 ± 0.04308 | 2.0877 ± 0.04032 | 1.8126 ± 0.03567 |
| CaO | 6.0937 ±0.03497 | 5.4392 ± 0.0356 | 4.3263 ± 0.03147 | 5.9526 ± 0.03465 | 6.3984 ± 0.03871 | 6.1841 ± 0.03701 |
| TiO2 | 0.4270 ± 0.05661 | 0.4307 ± 0.05087 | 0.3851 ± 0.04701 | 0.4274 ± 0.09215 | 0.3395 ± 0.05977 | 0.4334 ± 0.04599 |
| MnO | 0.1083 ± 0.0223 | 0.1330 ± 0.01790 | 0.1070 ± 0.01805 | 0.1087 ± 0.9177 | 0.1347 ± 0.02227 | 0.3161 ± 0.02124 |
| Fe2O3 | 5.8688 ± 0.02479 | 3.9994 ± 0.01924 | 4.3533 ± 0.01483 | 4.7334 ± 0.02547 | 4.2710 ± 0.02626 | 5.7112 ± 0.02099 |
| CuO | 0.0323 ± 0.0153 | |||||
| Rb2O | 0.0215 ± 0.00846 | |||||
| SrO | 0.4315 ± 0.00806 | 0.3154 ± 0.00726 | 0.2733 ± 0.00640 | 0.4043 ± 0.00900 | 0.4012 ± 0.00882 | 0.3973 ± 0.00862 |
| BaO | 0.2935 ± 0.1188 | 0.3022 ± 0.13779 | 0.4029 ± 0.10928 | 0.6946 ± 0.21692 | ||
| ZnO | 0.0264 ± 0.00958 | 0.0227 ± 0.01117 | 0.0442 ± 0.01070 | |||
| N.A. | 2.033 | 1. 8538 | 1. 8524 | 1. 8174 | 1. 7796 | 1. 8689 |
| Samples | <120 °C | 120–200 °C | 200–600 °C | >600 °C |
|---|---|---|---|---|
| 1 | 0.45 | 0.27 | 0.5 | 0.08 |
| 2 | 0.43 | 0.32 | 0.3 | 0.1 |
| 3 | 0.23 | 0.18 | 0.2 | 0.13 |
| 4 | 0.17 | 0.2 | 0.05 | 0.14 |
| 5 | 0.1 | 0.03 | 0.56 | 0.2 |
| 6 | 0.26 | 0.07 | 0.87 | 0.09 |
| Asbestos | 3.59 | 1.2 | 4.23 | 10.15 |
| Sample | Surface Area (m2/g) | Pore Volume (cc/g) | Pore Diameter (nm) | K2O (%) | Na2O (%) |
|---|---|---|---|---|---|
| 1 | 1.349 | 0.002 | 4.567 | 1.81 | 2.78 |
| 2 | 1.327 | 0.001 | 4.234 | 1.89 | 3.12 |
| 3 | 1.294 | 0.002 | 4.345 | 1.88 | 3.24 |
| 4 | 0.893 | 0.001 | 4.807 | 1.87 | 4.01 |
| 5 | 0.112 | 0.000 | 4.759 | 2.08 | 3.29 |
| 6 | 0.522 | 0.001 | 3.668 | 1.81 | 3.08 |
Disclaimer/Publisher’s Note: The statements, opinions and data contained in all publications are solely those of the individual author(s) and contributor(s) and not of MDPI and/or the editor(s). MDPI and/or the editor(s) disclaim responsibility for any injury to people or property resulting from any ideas, methods, instructions or products referred to in the content. |
© 2025 by the authors. Licensee MDPI, Basel, Switzerland. This article is an open access article distributed under the terms and conditions of the Creative Commons Attribution (CC BY) license (https://creativecommons.org/licenses/by/4.0/).
Share and Cite
Ion, R.-M.; Barbu, M.G.; Gurgu, V.I.; Slamnoiu-Teodorescu, S.; Gheboianu, A.I.; Vasilievici, G.; Iancu, L.; Grigorescu, R.M.; Alexandrescu, E. Tremolite-Asbestos Presence in Roman Archaeological Site of Micia, Romania. Crystals 2025, 15, 430. https://doi.org/10.3390/cryst15050430
Ion R-M, Barbu MG, Gurgu VI, Slamnoiu-Teodorescu S, Gheboianu AI, Vasilievici G, Iancu L, Grigorescu RM, Alexandrescu E. Tremolite-Asbestos Presence in Roman Archaeological Site of Micia, Romania. Crystals. 2025; 15(5):430. https://doi.org/10.3390/cryst15050430
Chicago/Turabian StyleIon, Rodica-Mariana, Marius Gheorghe Barbu, Valentin Ioan Gurgu, Sofia Slamnoiu-Teodorescu, Anca Irina Gheboianu, Gabriel Vasilievici, Lorena Iancu, Ramona Marina Grigorescu, and Elvira Alexandrescu. 2025. "Tremolite-Asbestos Presence in Roman Archaeological Site of Micia, Romania" Crystals 15, no. 5: 430. https://doi.org/10.3390/cryst15050430
APA StyleIon, R.-M., Barbu, M. G., Gurgu, V. I., Slamnoiu-Teodorescu, S., Gheboianu, A. I., Vasilievici, G., Iancu, L., Grigorescu, R. M., & Alexandrescu, E. (2025). Tremolite-Asbestos Presence in Roman Archaeological Site of Micia, Romania. Crystals, 15(5), 430. https://doi.org/10.3390/cryst15050430