Article

Anisotropy in the Creep–Fatigue Behaviors of a Directionally Solidified Ni-Based Superalloy: Damage Mechanisms and Life Assessment

1
State Key Laboratory of Powder Metallurgy, Central South University, Changsha 410083, China
2
Wedge Central South Research Institute Co., Ltd., Shenzhen 518045, China
*
Author to whom correspondence should be addressed.
Crystals 2025, 15(5), 429; https://doi.org/10.3390/cryst15050429
Submission received: 8 April 2025 / Revised: 28 April 2025 / Accepted: 29 April 2025 / Published: 30 April 2025

Abstract

:
Aero-engine turbine vanes made from directionally solidified nickel-based superalloys often fail with crack formation from the external wall of cooling channels. Therefore, this study simulates the compressive load on the external wall of the vane and conducts a sequence of creep–fatigue evaluations at 980 °C to investigate the creep–fatigue damage mechanisms of a directionally solidified superalloy and to assess its life. It is found that at low strain ranges, creep damage is dominant, with creep cavities forming inside the specimen and fatigue sources mostly distributed in the specimen interior. As the strain range increases, the damage mechanism transitions from creep-dominated to creep–fatigue coupled damage, with cracks nucleating preferentially on the surface and exhibiting a characteristic of multiple fatigue sources. In the longitudinal (L) specimen, dislocations in multiple orientations of the {111}<110> slip system are activated simultaneously, interacting within the γ channels to form dislocation networks, and dislocations shear through the γ′ phase via antiphase boundary (APB) pairs. In the transverse (T) specimen, stacking intrinsic stacking faults (SISFs) accumulate within the limited {111}<112> slip systems, subsequently forming a dislocation slip band. The modified creep–fatigue life prediction model, incorporating strain energy dissipation and stress relaxation mechanisms, demonstrates an accurate fatigue life prediction under creep–fatigue coupling, with a prediction accuracy within an error band of 1.86 times.

1. Introduction

High-temperature structural materials in energy and power equipment (such as gas turbines and aero-engines) face complex thermomechanical load interactions, among which creep–fatigue interaction damage is one of the core issues limiting the long-life reliability of critical components [1,2]. Directionally solidified nickel-based superalloys, with their excellent creep resistance and directionally aligned columnar grain structure, are widely used in high-temperature load-bearing components such as turbine blades [3,4,5,6,7]. Since the solidification process is carried out under controlled heat flow conditions, the grains grow preferentially in the direction of the heat flow, forming columnar grains oriented along the <001> direction, which is commonly referred to as “texture”. It is this texture that has a strong crystallographic orientation dependence, leading to significant anisotropy in mechanical behavior, especially under asymmetric cyclic loading, where the creep–fatigue damage mechanisms in different directions may have fundamental differences [8,9]. Accurately characterizing this anisotropy and establishing corresponding life prediction models is of great significance for optimizing component design and enhancing service safety.
In recent years, significant progress has been made in the study of the creep–fatigue interaction in superalloys, but the systematic exploration of anisotropic effects still has obvious shortcomings [10,11,12,13,14,15,16,17,18]. In the field of equiaxed grain materials, Kumar et al. [11] elucidated the regulation of hold time and strain amplitude on crack propagation paths in the IN740H alloy at 750 °C by introducing the energy density model of the principal creep parameter, but their research framework did not extend to directionally solidified materials with strong orientation characteristics. Regarding life prediction models, Sun et al. [13] proposed a crystal plasticity model based on dislocation density evolution, successfully predicting the cyclic softening behavior of the DZ125 alloy in the [001] orientation, but the model did not couple the growth and coalescence effects of creep cavities, resulting in a prediction deviation of more than 40% for hold time sensitivity. Ding et al. [16,17] revealed the differences in γ′ phase shearing mechanisms due to the stress ratio by comparing the low-cycle fatigue behavior of the DZ445 alloy under tensile/compressive-dominant loading, but their experimental design was limited to the single [001] orientation, failing to reveal the coupling mechanisms of different crystal orientations on creep cavity nucleation and dislocation network evolution under multi-axial loading. The above studies show that the existing achievements mostly focus on isotropic materials or simplified loading conditions, lacking a quantitative characterization of the synergistic effects of different crystal orientations—slip systems—and external loads in directionally solidified alloys.
This study takes directionally solidified nickel-based superalloys as the research object. By designing creep–fatigue experiments with different crystal orientations (longitudinal, parallel to the growth direction, and transverse, perpendicular to the growth direction), and combining various characterization techniques, this study reveals the microscopic mechanisms of anisotropic damage, including the orientation dependence of dislocation slip, γ′ phase shearing, and creep cavity evolution. Based on the energy and damage mechanics framework, an improved life model considering strain energy dissipation and creep stress relaxation is proposed. The research findings can provide theoretical support for the microstructural optimization of directionally solidified alloys and the life assessment of components.

2. Materials and Methods

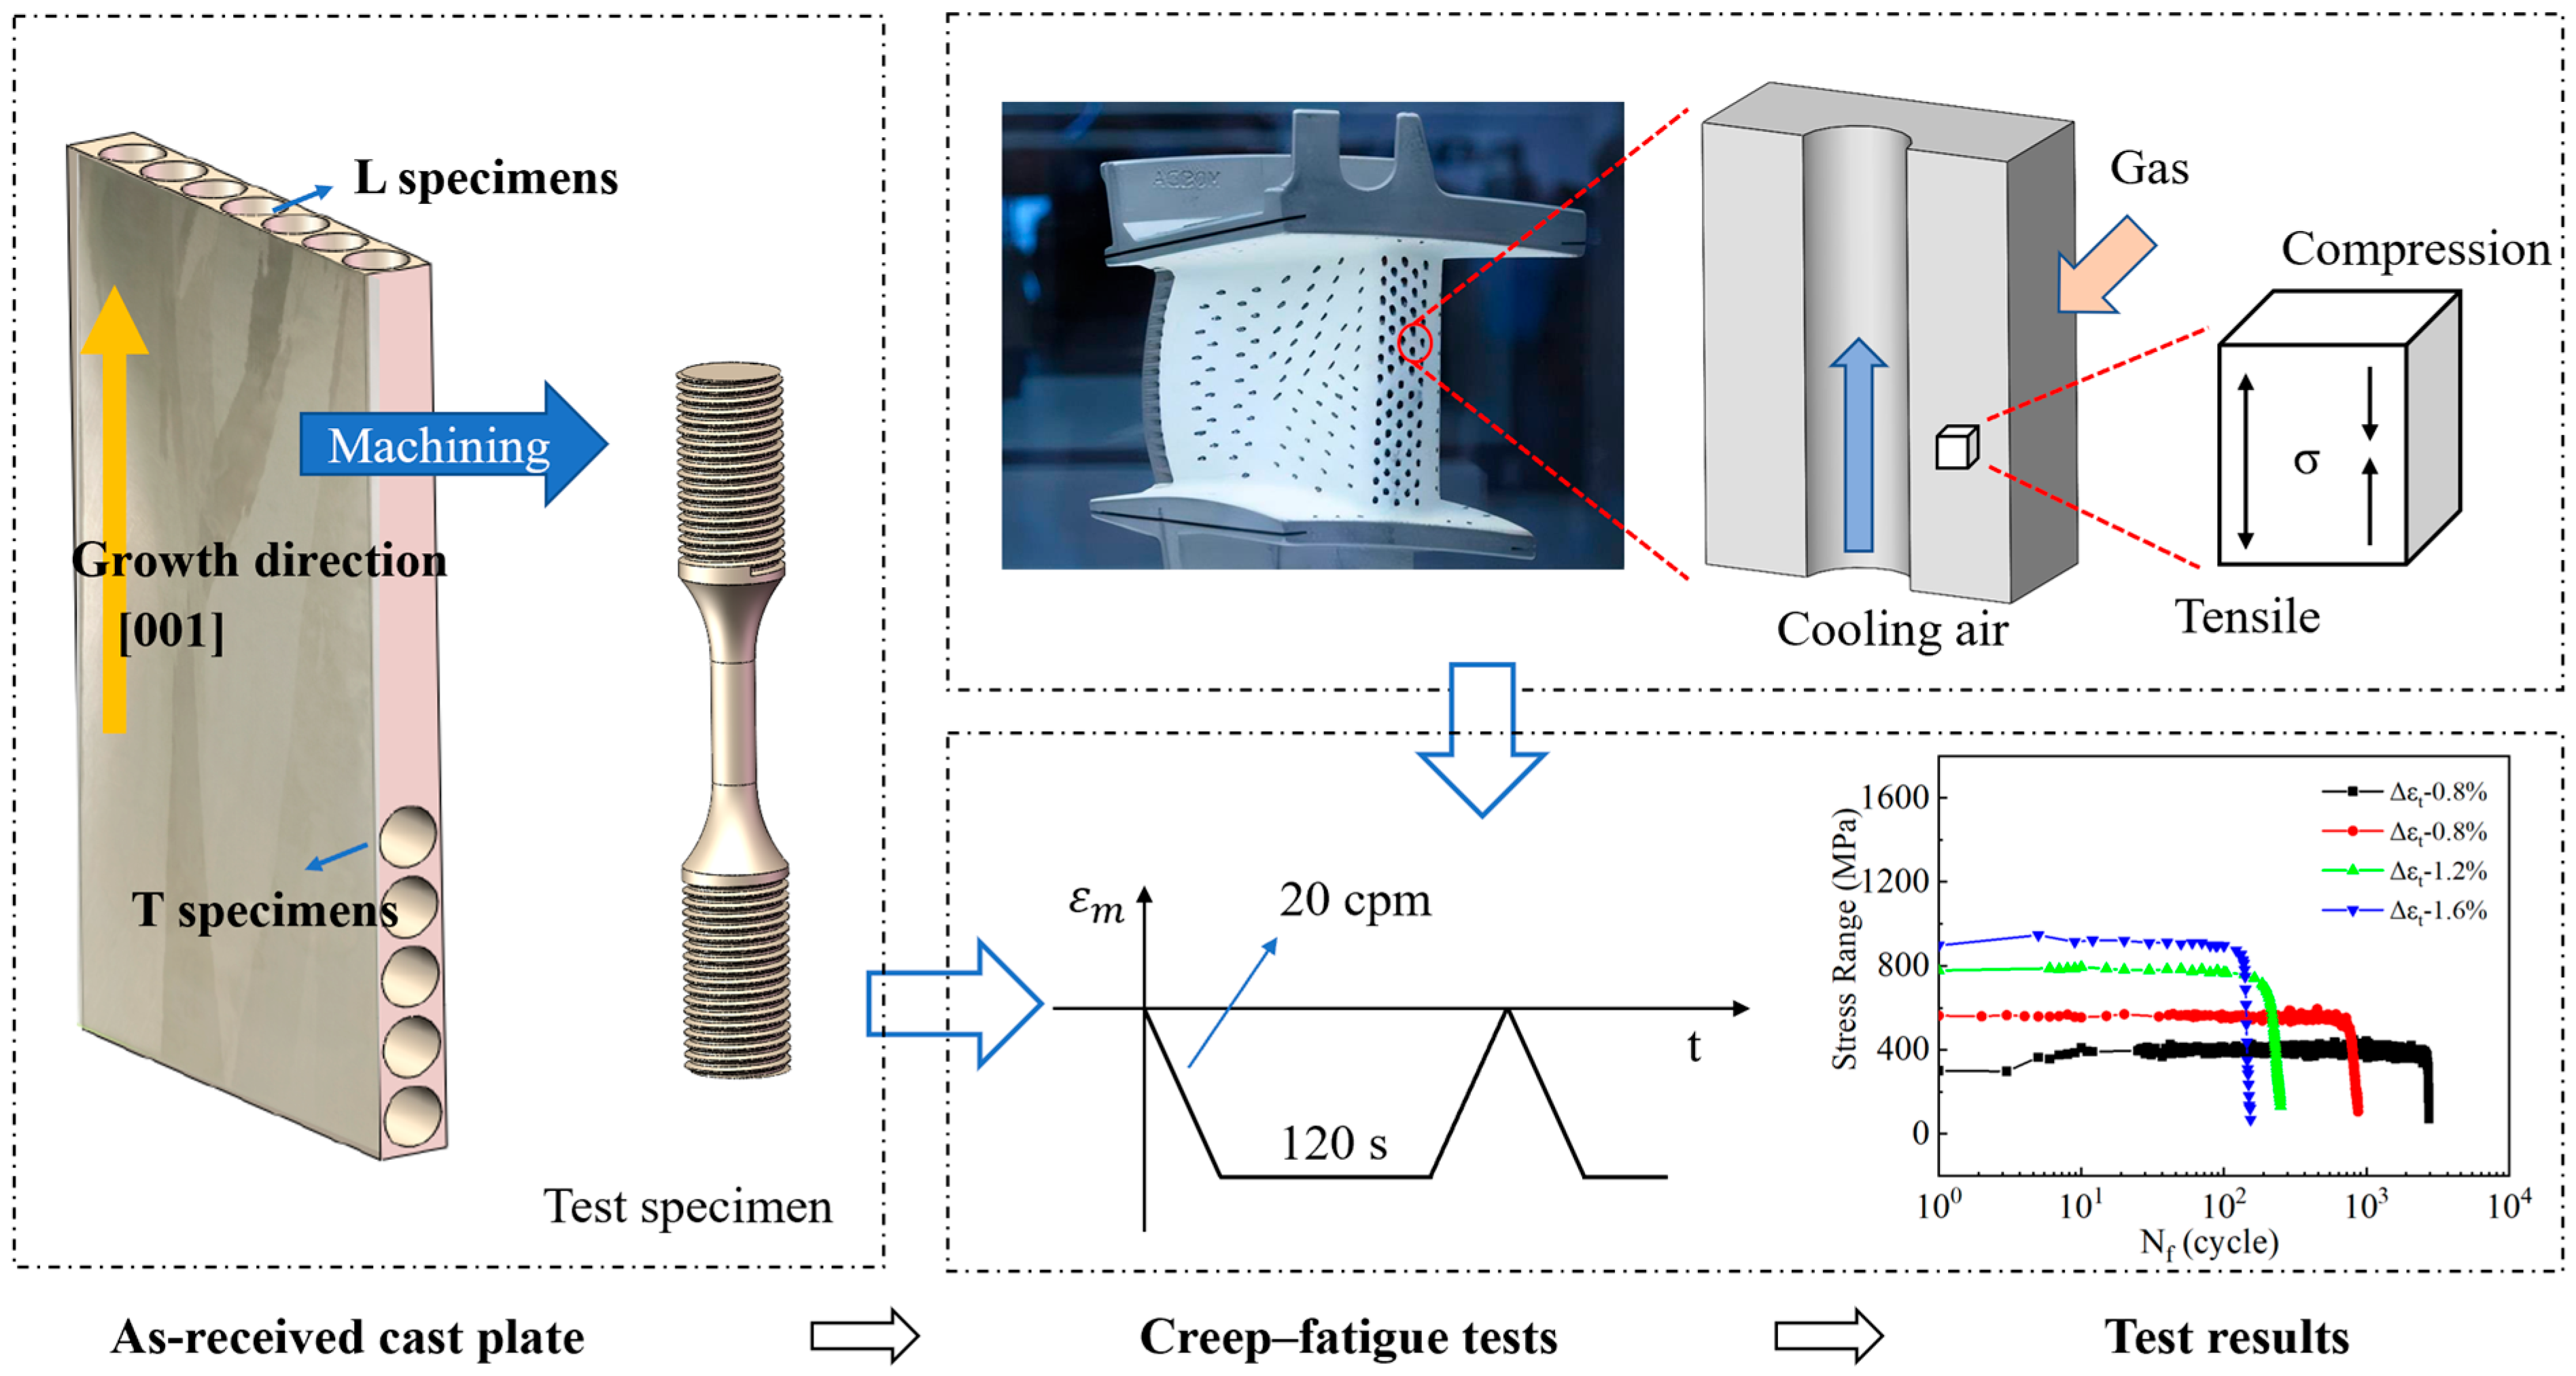
2.1. Materials and Heat Treatment

The specimen analyzed in this investigation comprises a nickel-based superalloy fabricated through directional solidification, possessing the chemical composition detailed subsequently (mass fraction, wt.%): Cr 7.0, Co 12.0, W 4.95, Al 5.9, Ta 7.0, Mo 1.5, Hf 1.5, C 0.09, and B 0.015, with the balance being Ni. The alloy casting plates, measuring 120 × 110 × 15 mm, were fabricated using directional solidification. Subsequent heat treatments, including solution treatment and aging, were performed in an Titan (H2) series furnace (Ipsen, Souderton, PA, USA). The solution treatment involved a two-stage heating process: initially ramping at 10 °C per minute to 1180 °C with a 2 h hold, followed by a slower heating rate of 5 °C per minute to 1270 °C and another 2 h dwell. The cooling phase utilized argon at an approximate rate of 60 °C per minute. For aging, the plates were maintained at 1050 °C for 4 h before being argon-cooled at around 40 °C per minute.

2.2. Creep–Fatigue Testing

L specimens were taken along the [001] growth direction of the casting plate, and T specimens were taken perpendicular to the growth direction. Creep–fatigue experiments were performed at 980 °C. The test conditions were referenced from the service conditions of the outer wall of the air-cooled holes in aero-engine vanes. Under the actions of cooling gas and combustion gas, a notable temperature difference exists between the inner and outer walls of the air-cooled holes, with the inner wall under tensile stress and the outer wall under compressive stress. Therefore, this experiment used a trapezoidal wave with a compressive hold for fatigue testing, with a hold time of 120 s at the maximum compressive strain and a cycling frequency of 20 cycles per minute for the non-hold part. The procedure for sampling and creep–fatigue testing is depicted in Figure 1. Fatigue tests were conducted on an Landmark 370.10 high-temperature fatigue testing machine (MTS, Eden Prairie, MN, USA) with resistive furnace heating and temperature control. An MTS 632.53 high-temperature extensometer (MTS, Minnesota, USA) was used for strain control, with a gauge length of 12 mm and Class B1 accuracy. Three specimens were tested under each test condition to ensure data reliability.

2.3. Microstructural Characterization

The macroscopic fracture surface morphology and internal cavities near the fracture were observed using a Nikon SMZ1270 optical microscope (OM) (Tokyo, Japan). Samples for observing internal cavities were taken from the cross-section perpendicular to the fracture, positioned 1 mm away from the fracture site, and were observed directly after polishing without etching. The original microstructure of the samples, the fracture micro-region morphology, and the surface crack conditions were observed employing a Sigma300 scanning electron microscope (SEM) (Carl Zeiss, Cambridge, UK) operating at an acceleration voltage of 20 kV and 120 μm objective aperture system. Prior to imaging, the specimens were polished and etched with reagent (5 g of CuCl2 + 100 mL of methanol + 100 mL of HCl), while specimens for the grain size measurement were etched with reagent (3 mL of HNO3 + 3 mL of CH3COOH + 3 mL of H2O + 1 mL of HF). The elemental analysis of long cracks was performed using the above-mentioned SEM equipped with energy-dispersive spectroscopy (EDS) (Bruker, Berlin, Germany). The microstructural evaluation of dislocation configurations was performed via an Tecnai F20 transmission electron microscope (TEM) (FEI, Hillsboro, OR, USA) operating at 200 kV accelerating voltage. TEM samples were taken within a range of 3–5 mm from the fracture using an electro-discharge wire cutting machine, ground to a thickness of 50 μm with metallographic sandpaper, and then thinned by double-jet electropolishing using a Tenupol-5 device (Struers, Ballerup, Denmark) in a solution of 10% HClO4 and 90% CH3CH2OH-25. The grain orientation characterization of TEM samples was performed using the above-mentioned scanning electron microscope equipped with Electron Backscatter Diffraction (EBSD) (Bruker, Berlin, Germany), with the TEM samples analyzed directly.

3. Results

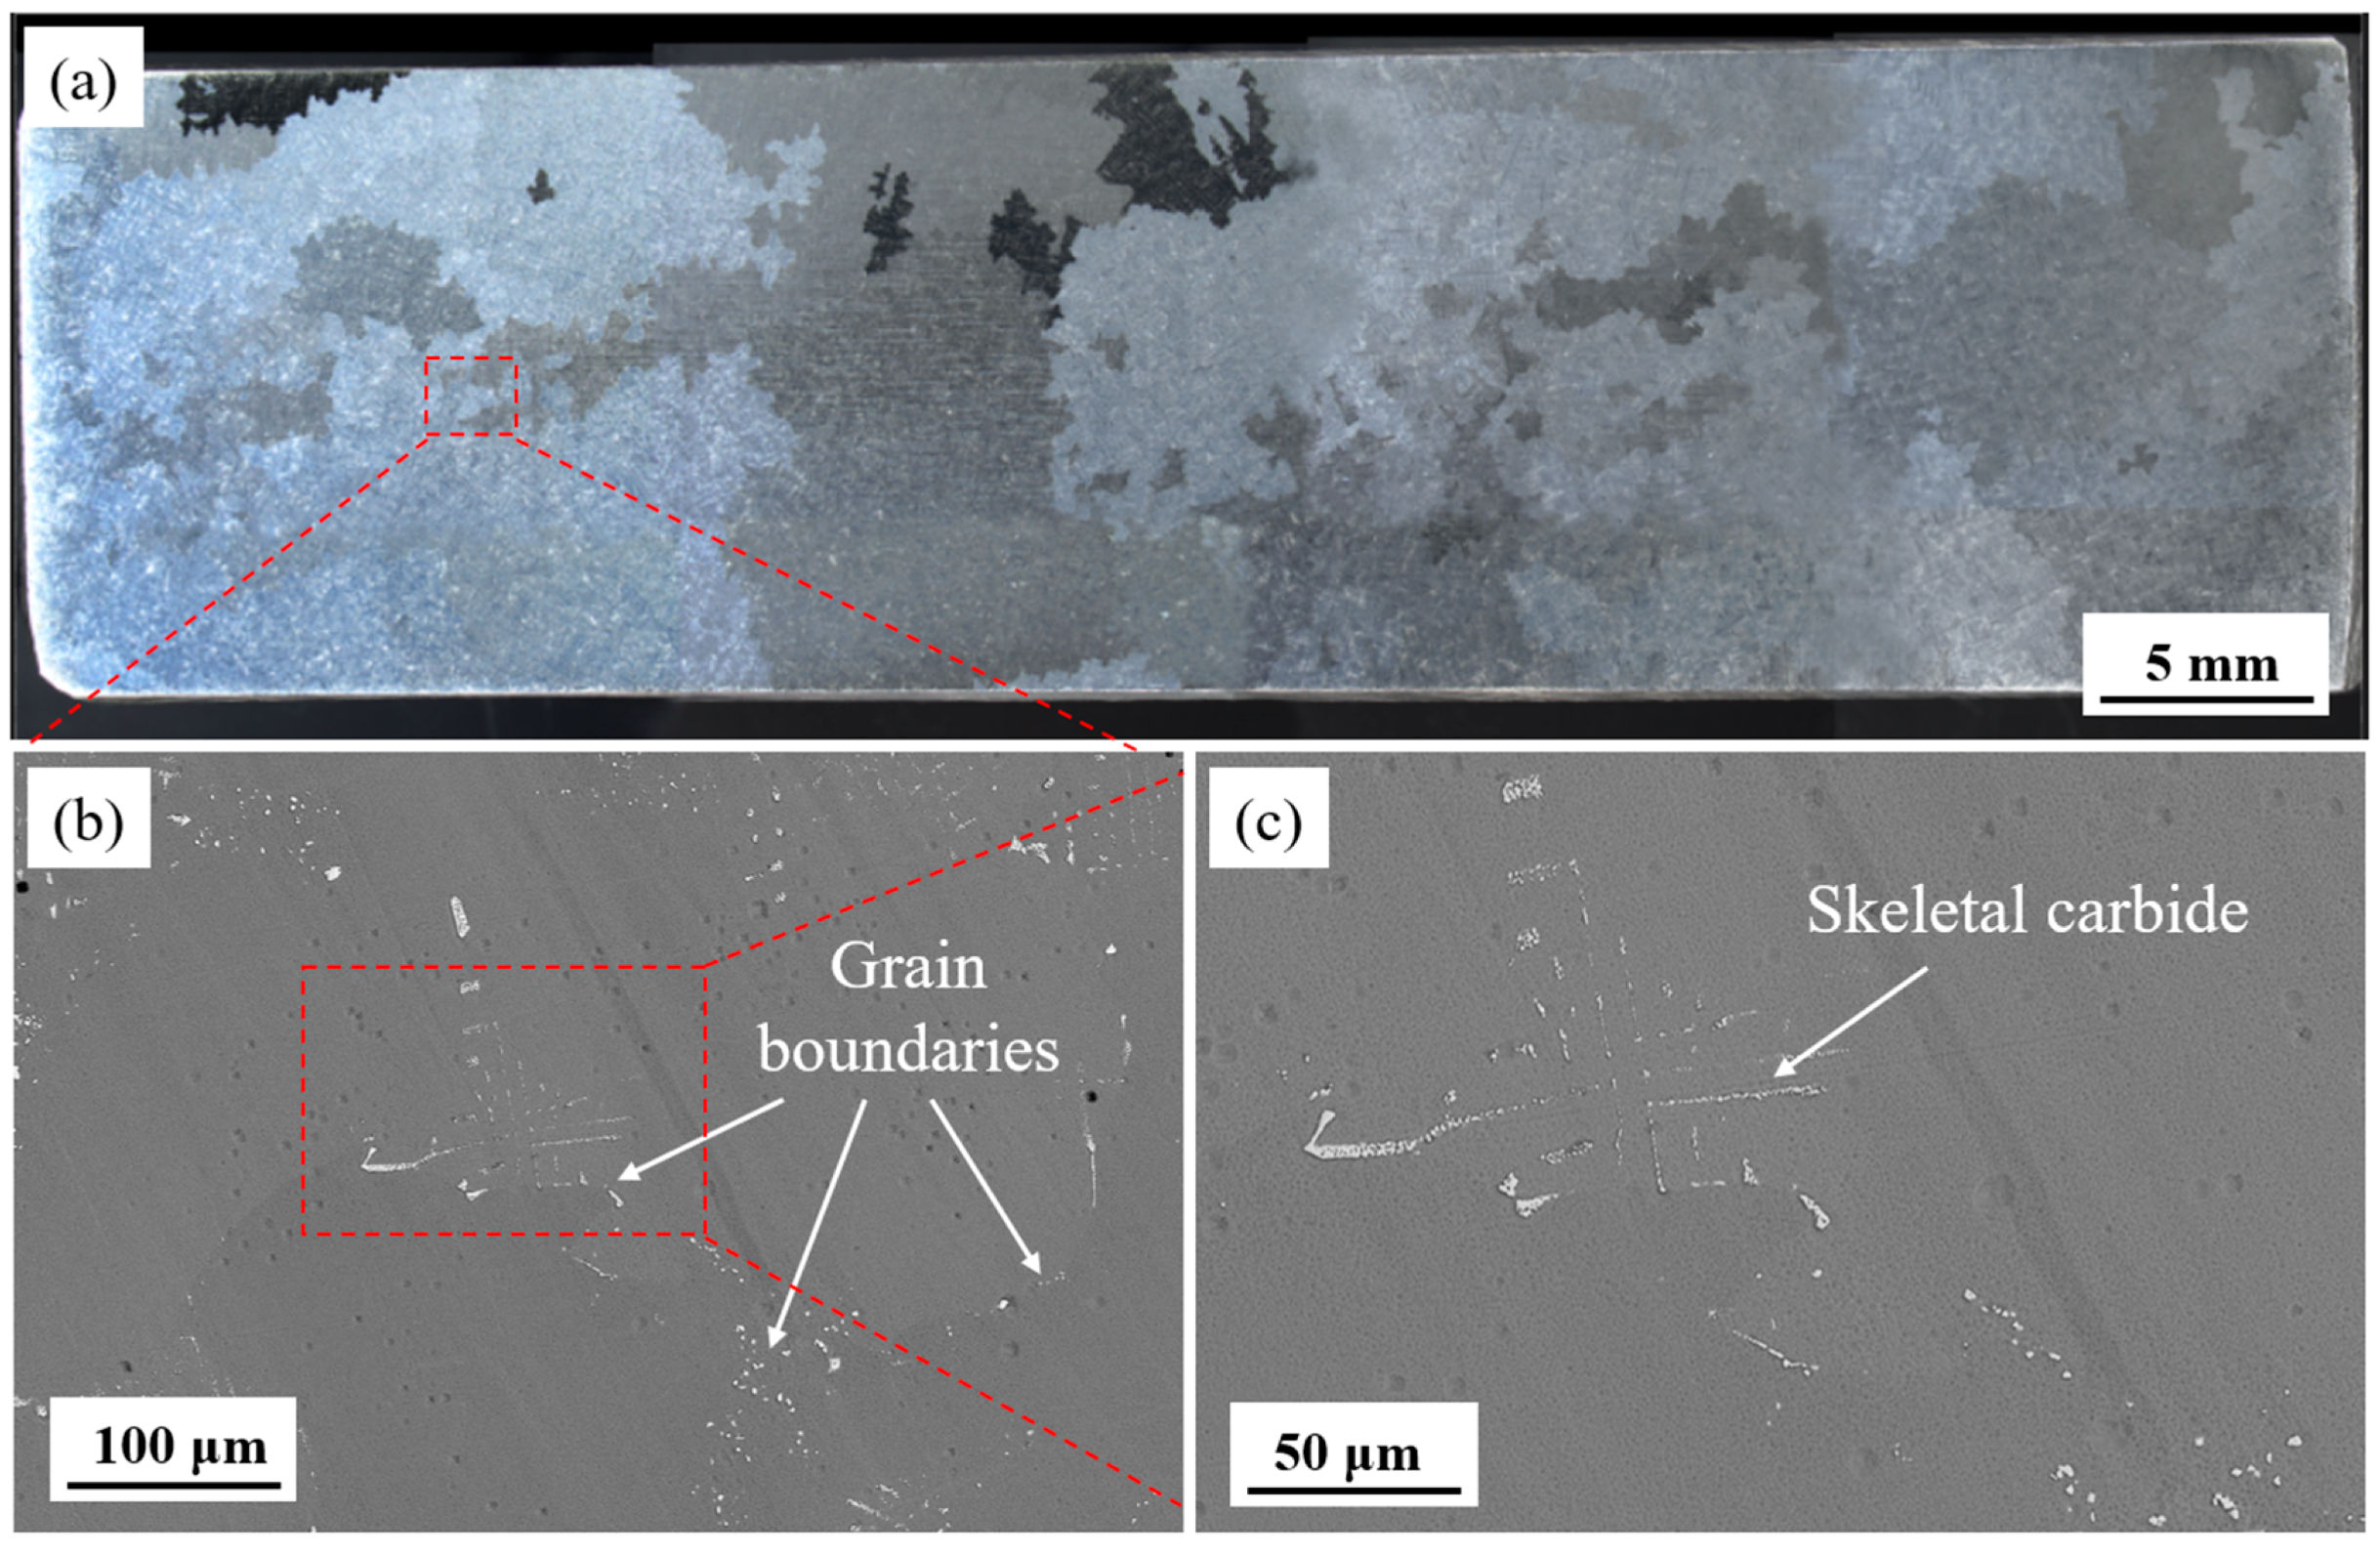
3.1. Original Microstructure

The microstructural characteristics of the alloy plate after heat treatment are delineated in Figure 2, which were also described in previous studies [19]. The dendritic morphology of the T and L specimens is highly consistent, with the secondary γ′ phase in the dendritic regions showing good size uniformity, an average size of about 0.8 μm, and a certain degree of squareness. The high-temperature solution treatment dissolves the primary γ′ phase formed during the slow cooling stage of casting into the matrix, and then the rapid cooling process promotes the precipitation of fine secondary γ′ phases from the supersaturated matrix, which are further regularized and homogenized in distribution during the aging treatment. This precipitate phase system with a regular morphology has been proven to significantly enhance the creep resistance of the material [20,21]. It is worth noting that a small amount of eutectic structure that has not been completely dissolved remains in the interdendritic regions, with large-sized γ′ phases inside. In addition, two types of characteristic carbides are distributed in this region: small-sized equiaxed carbides are discretely distributed, while the skeletal carbides partially dissolve during the heat treatment process, transforming into isolated short rod-like shapes.
The grain morphology of the casting plate’s cross-section (which perpendicular to the grain growth direction) is shown in Figure 3a. The grain width of the columnar grains is about 5.6 mm, as obtained from the statistical grain size in Figure 3. The gauge section of the creep–fatigue test specimen has a diameter of 5 mm and a length of 14 mm. Therefore, the cross-section of the transverse specimen may contain one to two grains, and the length direction may have three to four grains. For the transverse specimen, the grain growth direction is always perpendicular to the applied stress direction, while the secondary orientation is randomly distributed. A total of 12 specimens were used for the transverse creep–fatigue test, which is equivalent to examining the properties of 72 to 96 grains with randomly distributed secondary orientations, providing a certain statistical significance. The microstructure of grain boundaries and within grains is shown in Figure 3b,c. The carbide density at grain boundaries is much higher than within grains. Grain boundary carbides can be divided into dispersed carbides and large-sized skeletal carbides.

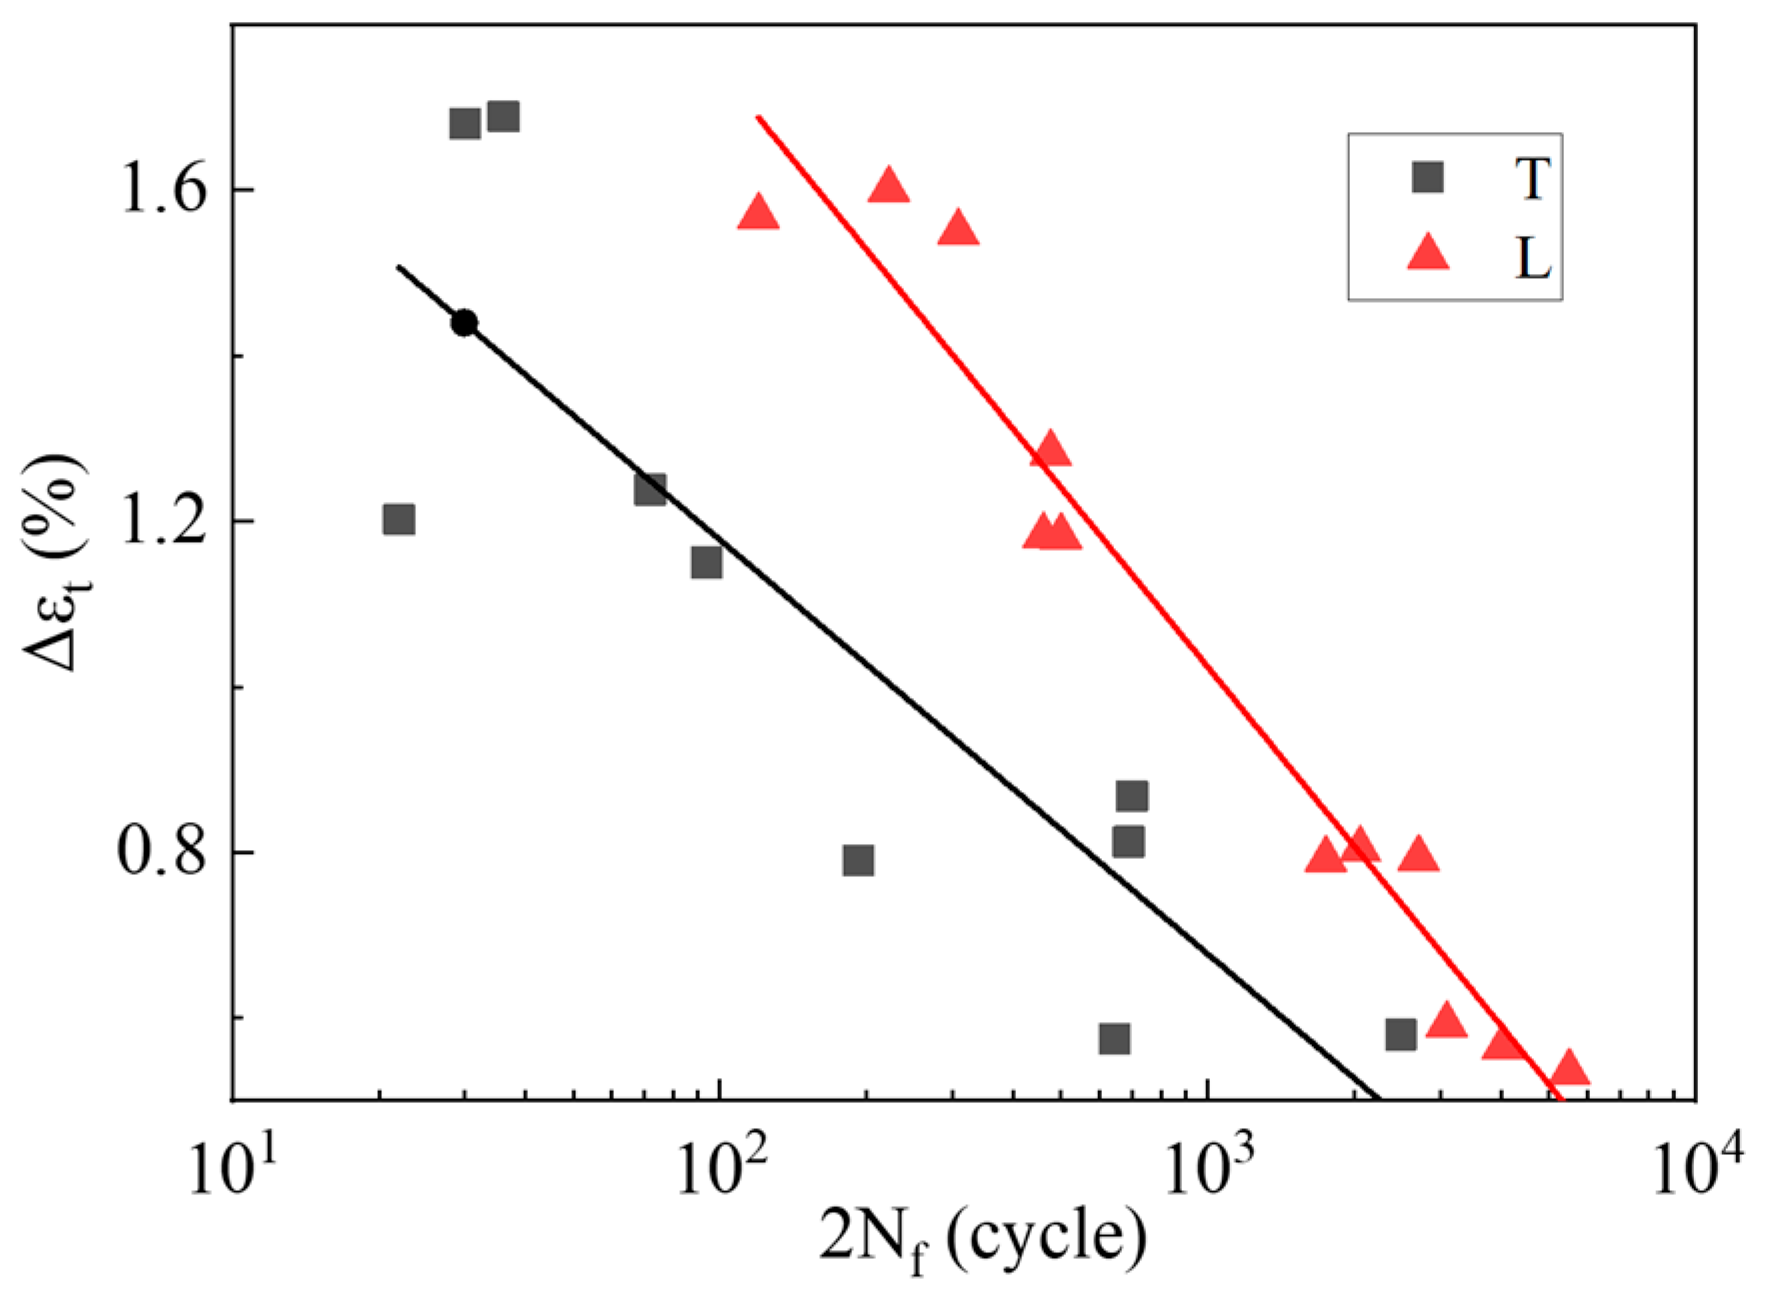
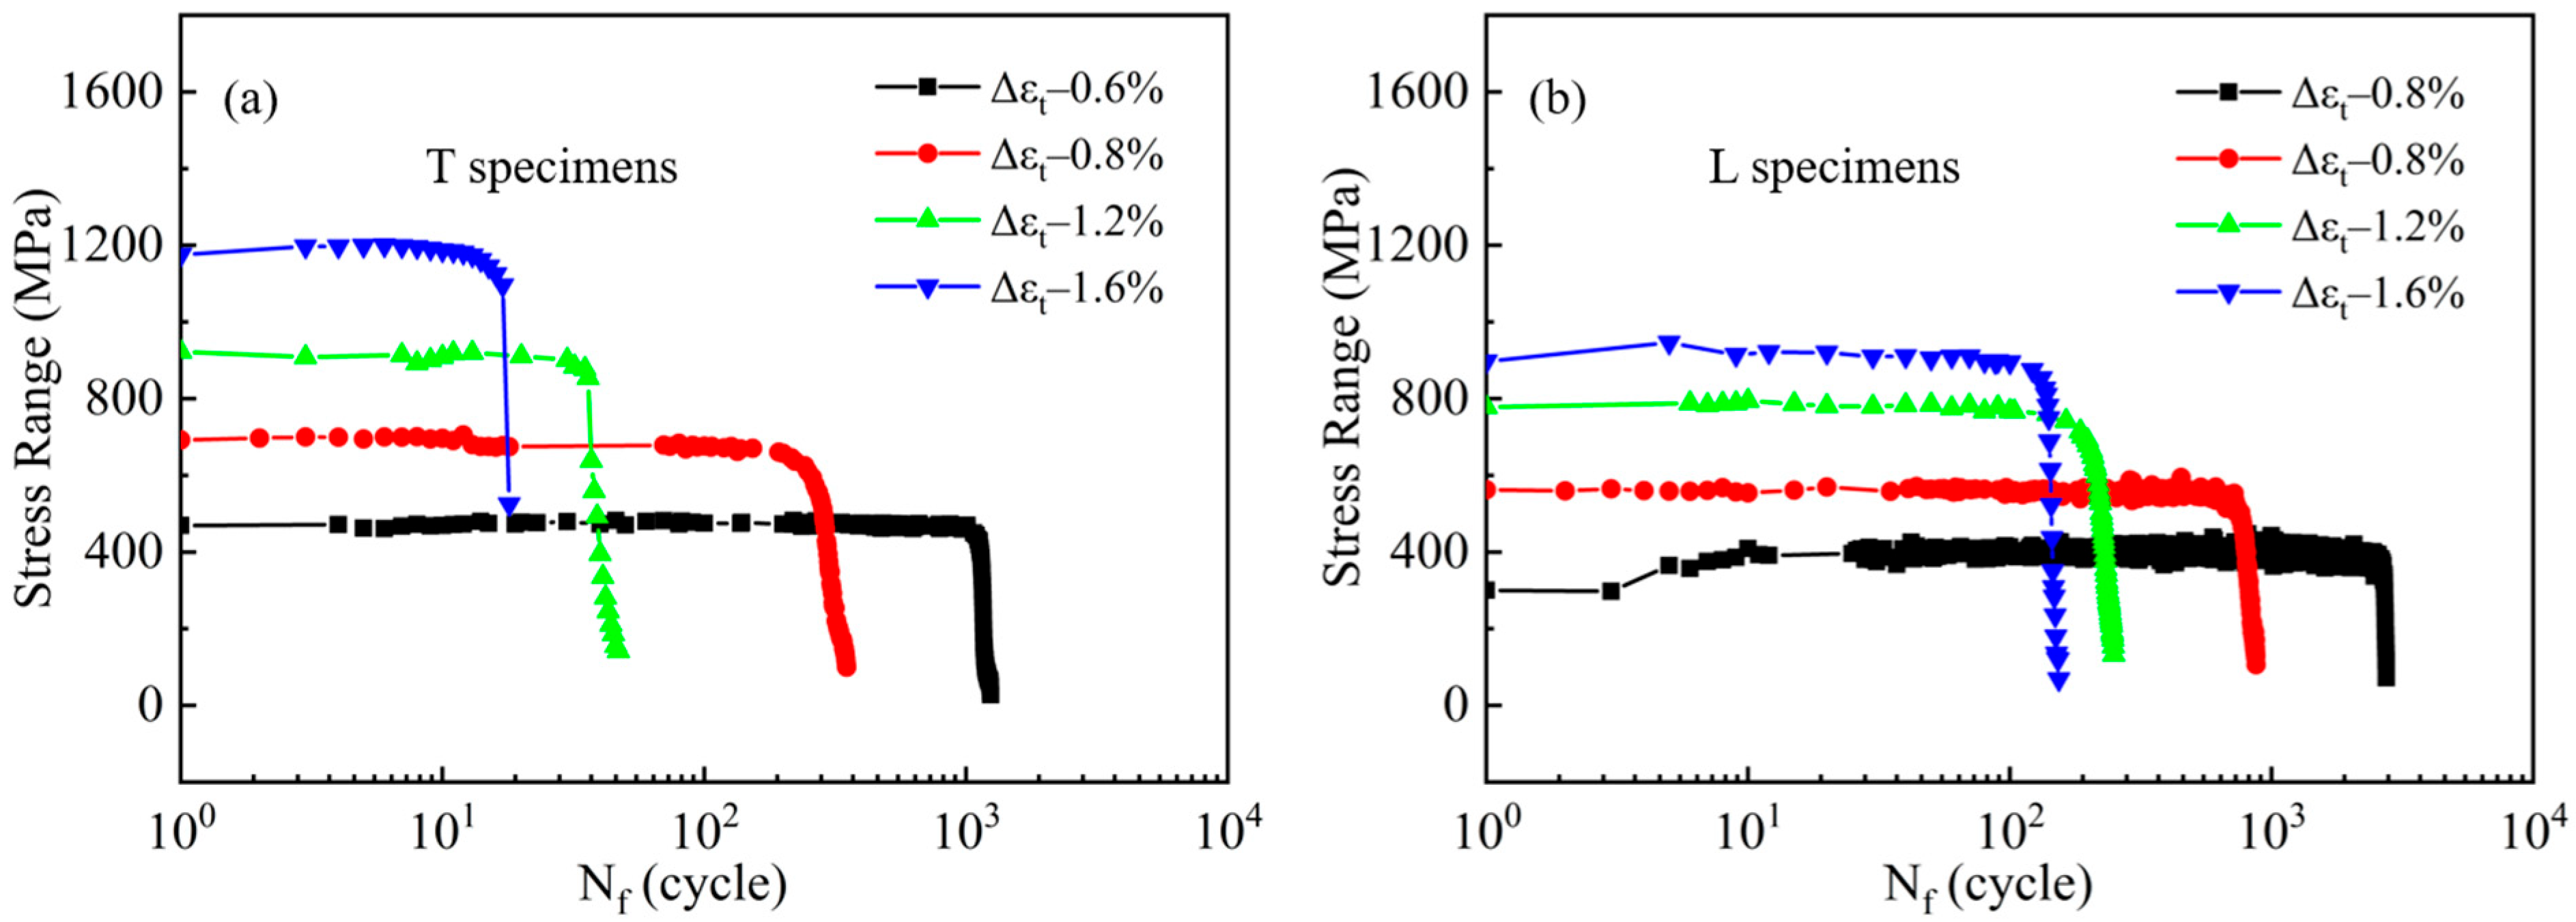
3.2. Creep–Fatigue Properties

T and L specimens were subjected to creep–fatigue tests at 980 °C under strain ranges of 0.6% to 1.6%. A comparison of their cyclic life is shown in Figure 4. At identical strain levels, the cyclic life of the T specimens were significantly lower than the L specimens. Specifically, at a strain range of 1.6%, the L specimens exhibited an average cyclic life 6.5 times greater than that of the T specimens. This difference decreased at lower strain ranges, with the L specimens’ average life being 3.5 times higher than the T specimens’ at 0.6% strain. The disparity between the two orientations diminishes as the strain range decreases.
The stress range–cycle curves of T and L specimens at strain ranges of 0.6% to 1.6% are presented in Figure 5. The cyclic hardening or softening behavior of the material can be determined by observing the increase or decrease in the stress amplitude during the cyclic process. As shown in Figure 5, neither significant cyclic softening nor hardening is observed in T and L specimens across strain ranges of 0.6% to 1.6%. This equilibrium suggests that the hardening effects from dislocation proliferation and entanglement are effectively counterbalanced by the softening mechanisms of dislocation rearrangement and annihilation in this directionally solidified superalloy at 980 °C. Comparing the stress ranges of the T and L specimens at the same strain range in Figure 5a, b indicates that the T specimen demonstrates elevated cyclic stress. At a strain range of 1.6%, the stress range of the T specimen is about 300 MPa higher than that of the L specimen. Based on earlier studies on the high-temperature deformation mechanisms of this alloy [19], the T specimen mainly deforms through dislocation motion in the {111}<112> slip system. Within the face-centered FCC cubic structure, the <112> direction has high atomic slip resistance, resulting in a high dislocation slip threshold. So, the T specimen has a greater deformation resistance.
The hysteresis loops reflect the combined effects of plastic deformation, creep relaxation, and damage accumulation during creep–fatigue tests. The mid-life hysteresis loops of T and L specimens are shown in Figure 6. As shown in Figure 6a, with increasing strain ranges, the deformation mechanism transitions from elastic-dominated to plastic/viscoplastic-dominated behavior, accompanied by significant increases in both the width and area of the hysteresis loops. At higher strain ranges, accelerated plastic strain accumulation causes the loops to expand toward higher strains and stresses. Additionally, enhanced stress relaxation induced by creep effects during the compressive hold period becomes more pronounced with increasing strain ranges. As shown in Figure 6b, L specimens exhibit similar strain-dependent trends in hysteresis loop evolution. However, L specimens demonstrate narrower hysteresis loops and smaller stress relaxation amplitudes compared to T specimens at equivalent strain levels. The loop area represents the energy dissipation per cycle, which further explains the shorter fatigue life of T specimens from an energy perspective.

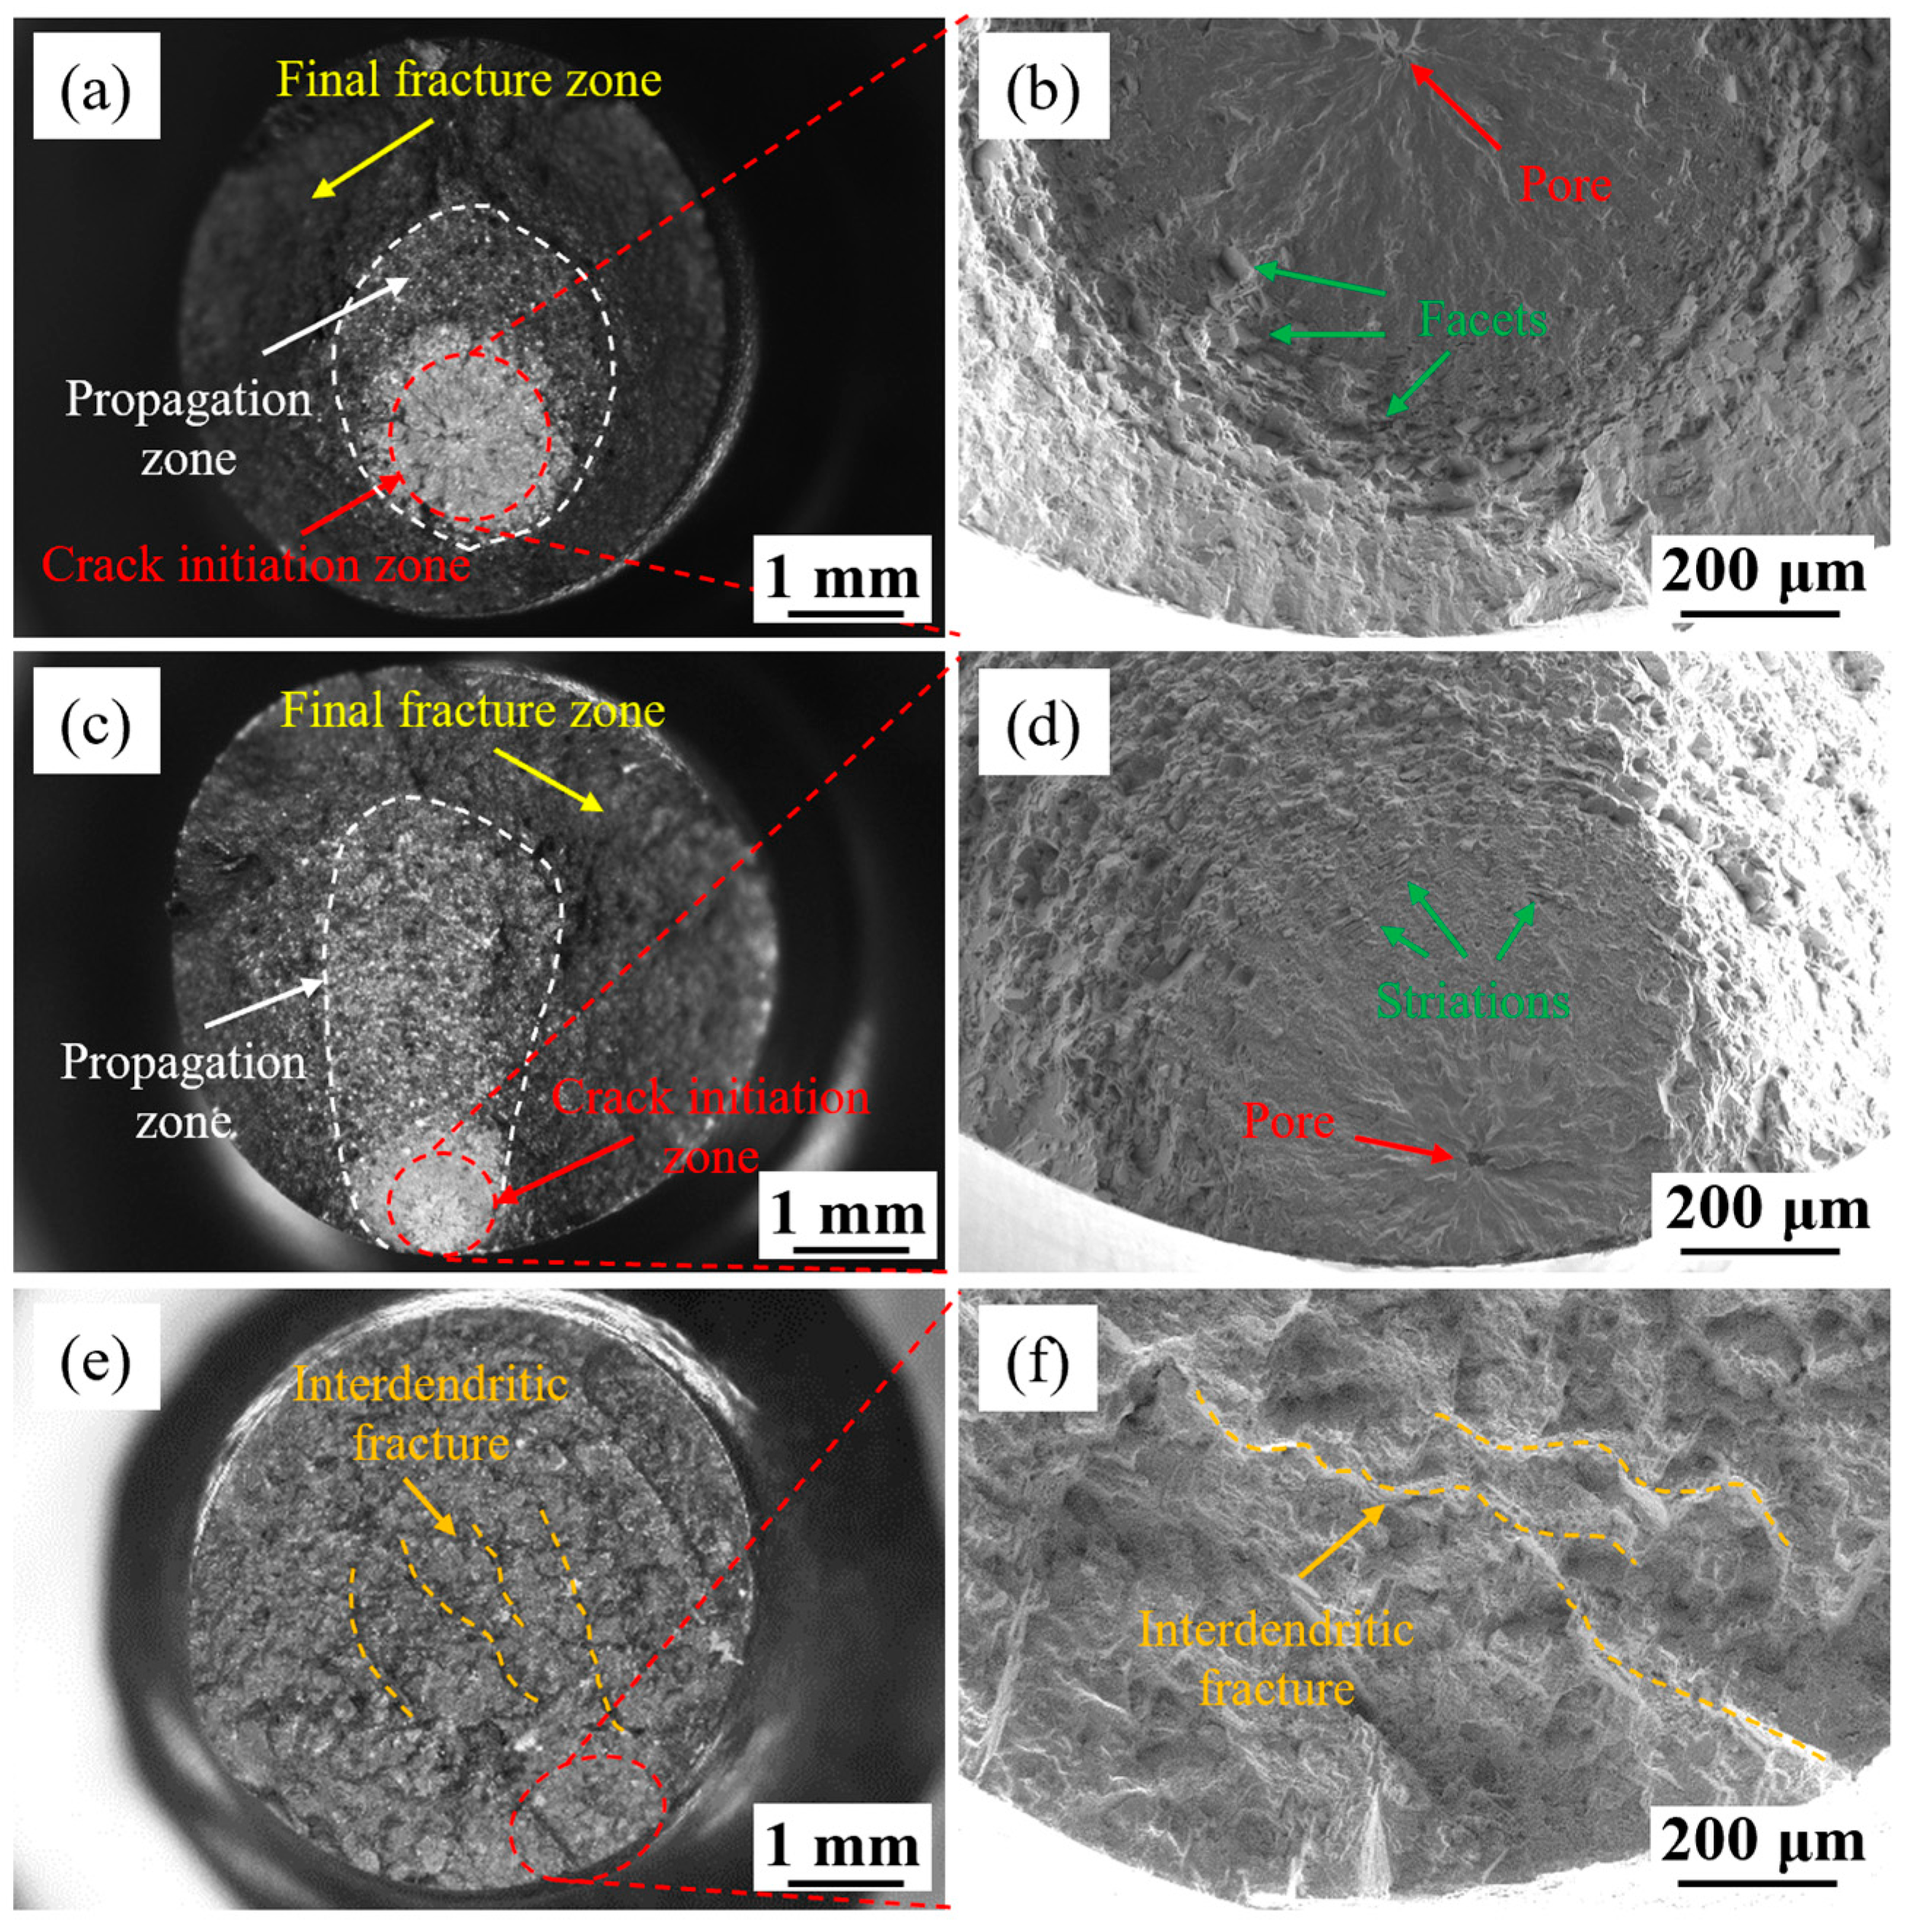
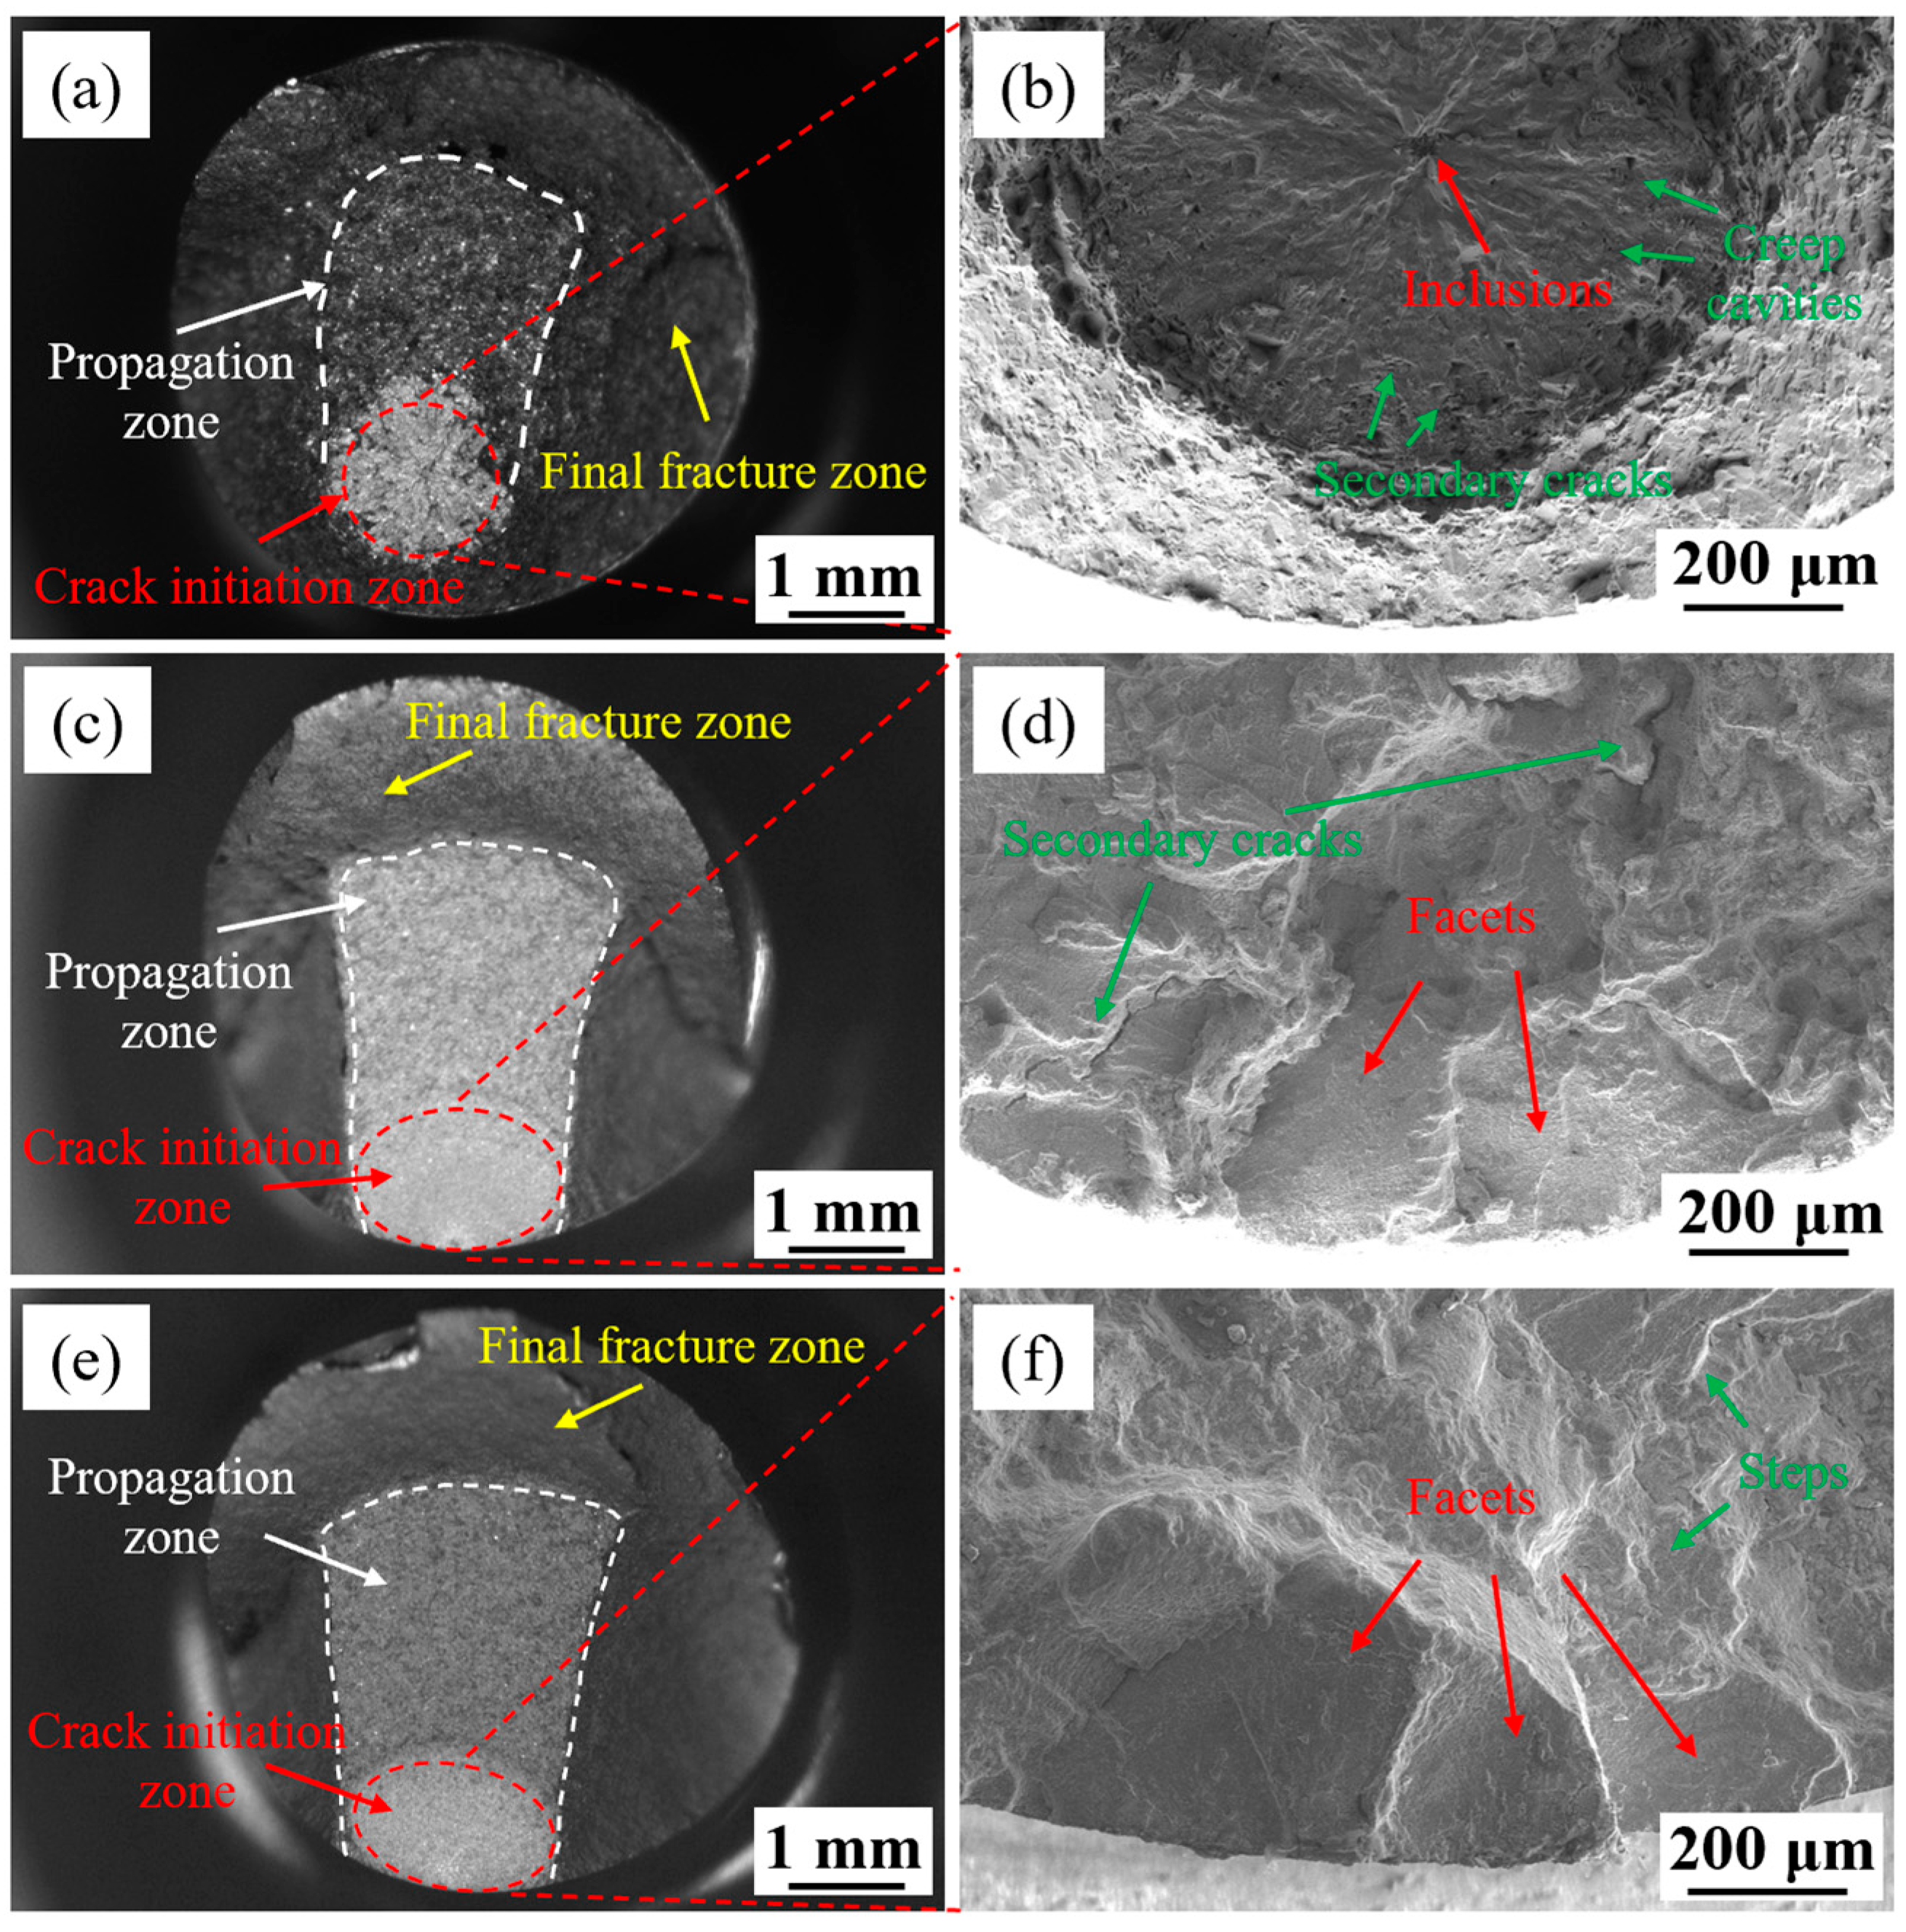
3.3. Fracture Morphology

The creep–fatigue fracture surfaces at different strain ranges (0.6%, 1.2%, and 1.6%) were analyzed utilizing OM and SEM. The fracture surface morphology of the T specimens is shown in Figure 7. At low strain ranges of 0.6% and 1.2%, the fracture surfaces exhibit typical three-zone characteristics (crack initiation zone, crack propagation zone, and instantaneous fracture zone), but the micro-damage behavior shows significant evolution with increasing strain level. At a low strain range of 0.6% (as shown in Figure 7a,b), the crack initiation mainly occurs at internal cavities, with the crack initiation zone showing a single-source radial expansion feature. Numerous cleavage platforms can be observed in the crack propagation region, extending beyond the initiation zone. According to the research by Jean, C.S. [22] on the nucleation damage behavior of directionally solidified superalloys in the transverse direction, these cleavage platforms are formed by a crack propagating along a specific orientation at high-angle grain boundaries. When the strain range is increased to 1.2% (as shown in Figure 7c,d), the crack initiation location migrates from the interior to the subsurface. It is worth noting that parallel fatigue striations with a spacing of about 7 μm are visible in the crack propagation zone. When the strain range is further increased to 1.6% (as shown in Figure 7e,f), there are no obvious zonal characteristics on the macroscopic fracture surface, and only a river-like fracture morphology is observed, which is typical of an interdendritic fracture. As shown in Figure 2, skeletal carbides tend to precipitate in the interdendritic regions. Figure 3b,c show that large-sized primary γ′ and skeletal carbides are often distributed near grain boundaries with a higher density. These large-sized carbides, with their interfaces with the matrix, are prone to becoming pathways for crack propagation [23], further reducing the plastic elongation of the transverse specimens. The specimens fractured after only about 10 cycles. All these indicate that grain boundaries play important roles in crack initiation and propagation in transverse specimens.
This may be due to the high strain level and the poor plastic elongation of the T specimen, which fractured after only about 10 cycles.
The fracture surface morphology of the L specimens is shown in Figure 8. Under a low strain range of 0.6% (as shown in Figure 8a,b), crack initiation also occurs at internal cavities, with the crack initiation zone showing a single-source radial expansion feature. Numerous creep cavities and secondary cracks are present in the crack propagation zone, which may be the result of the interaction between interdendritic cracks caused by creep damage and fatigue loading. When the external strain is low, the overall stress level has not yet reached the critical value for the nucleation of slip bands on the surface. At this time, internal casting defects (such as microcavities or inclusions) become local stress concentration points. According to fracture mechanics principles [24], the stress intensity factor ∆K at the defect tip is positively correlated with the square root of the defect size. Even with a small external load, these micrometer-sized defects may still meet the crack initiation conditions. When the strain range is increased to 1.2% (as shown in Figure 8c,d), crack initiation shows a dual-source competitive expansion mode, with the source location migrating from internal defects to the surface region. Two flat cleavage steps can be observed at the surface crack initiation site, indicating that dislocations are restricted by the ordered structure of the γ′ phase during the fatigue crack initiation process. Large secondary cracks are also present in the crack propagation zone, with almost no creep cavities observed, indicating that the damage mechanism has transitioned from a creep-dominated mode at low strain levels to a creep–fatigue interaction damage mode. Under a large strain condition of 1.6%, the macroscopic fracture surface of the L specimen shows typical three-zone characteristics, as shown in Figure 8e, and the initiation of surface cracks exhibits a characteristic of collaborative multi-platform propagation. According to Eshelby’s inclusion theory [25,26], the stress field of internal defects decays with distance as r−3, while the surface stress gradient decays as r−1. Under high strain conditions, the elastic–plastic strain energy density stored in the high-strain gradient region near the surface can be more than ten times that of the interior, promoting crack nucleation on the surface.

4. Discussion

4.1. Damage Mechanisms

Pure low-cycle fatigue cracks typically initiate on the material surface, especially under conditions of large strain ranges where multiple fatigue sources are likely to form on the surface. Pure creep deformation, on the other hand, tends to form creep cavities inside the specimen [27]. In directionally solidified superalloys, creep cavities preferentially form around carbides at grain boundaries and in interdendritic regions, where plastic deformation is often hindered and stress concentration is likely to occur [28,29]. Figure 9 shows the internal cavities on the cross-section perpendicular to the fracture surface at a distance of 1 mm from the specimen fracture. As can be seen in Figure 9, with the increase in the strain range from 0.6% to 1.6%, the density of cavities in both T and L specimens first decreases and then increases. At a low strain range of 0.6%, the fatigue life of the specimen is long, and the hold time accounts for 97.6% of the total test duration. Therefore, the specimen has more time to undergo uniform creep deformation during the hold period, and the creep cavities formed inside the specimen due to creep damage are relatively uniform, as shown in Figure 9a,d. Creep cavities formed inside the specimen usually serve as crack initiation sites; so, fatigue sources are mostly formed inside the specimen at low strains. As the strain range increases, local stress concentration at the interface between the second phase particles and the matrix can also trigger cavity nucleation when it exceeds a critical value. High stress can exacerbate stress concentration at grain boundaries or second phase particles, accelerating the growth rate of cavities, increasing the average cavity size, and promoting the coalescence of cavities through enhanced diffusion and dislocation motion, which explains well the phenomenon of large cavity aggregation shown in Figure 9c,f. According to previous research results [19], creep deformation at 980 °C is dominated by dislocation shearing, and high stress promotes plastic deformation through dislocation climb, accelerating local strain at the cavity edges and enlarging the cavities. The ligaments between adjacent cavities undergo plastic instability or fracture under high stress, leading to cavity coalescence and the formation of larger cracks, which accelerates specimen fracture. Comparing the creep cavities in the T and L specimens at an identical strain level, it is found that the T specimen has a higher density of creep cavities, and the expansion and coalescence of cavities are more pronounced at high strain levels, as shown in Figure 9c,f.
The process of fatigue failure involves two primary stages: the initiation of cracks and their subsequent propagation. In low-cycle fatigue testing, the period of crack initiation constitutes most of the overall fracture life. The causes of crack initiation include plastic strain accumulation, stress concentration, environmental factors, loading conditions, and the material’s microstructure. Analyzing the reasons for crack formation near the fracture surface of the samples can help us better understand the damage mechanisms of materials during the creep–fatigue process. Figure 10 shows the surface crack initiated near the fracture surface of the T and L specimens. Microstructural small fatigue cracks (MSFCs) were found on the surface of all specimens at a strain range of 0.6% to 1.6%, and the density of MSFCs on the specimen surface increased with increasing strain level. The sample surface where the MSFCs are located forms a depleted layer devoid of the γ′ phase. Comparing the T and L specimens in Figure 10a–c and 10d–f, it can be seen that the MSFCs in the L specimens are shorter in length and the depleted layer is thinner than in the T specimens. This can be explained by the stress-assisted dynamic embrittlement (SADE) mechanism [30,31,32,33]. According to Figure 5, at the same strain level, the stress in the T specimen is higher than that in the L specimen. Under greater stress, the atomic diffusion potential energy is higher, resulting in a thicker depleted layer. The depleted layer becomes embrittled due to the combined effects of the absence of the γ′ phase and the ingress of oxygen atoms, lowering the crack initiation threshold. Correspondingly, more crack initiation promotes further oxygen diffusion, and crack initiation and oxidation embrittlement promote each other, resulting in longer MSFCs and a thicker depleted layer in the T specimen.
After MSFCs form on the specimen surface, they do not necessarily continue to propagate into long cracks. Only a small number of MSFCs continue to expand and form long cracks. Along the propagation paths of these long cracks, skeletal carbides are almost always present, indicating that skeletal carbides play a promoting role in the propagation of fatigue cracks. The density of skeletal carbides along grain boundaries is higher in the transverse specimens, which illustrated in Figure 3b,c. Therefore, it can be reasonably inferred that cracks in the transverse specimens are more likely to propagate along high-angle grain boundaries. A long crack was randomly selected for surface scanning electron microscopy (SEM) and energy-dispersive spectroscopy (EDS) analyses, as shown in Figure 11. From the EDS results in Figure 11d–f, it can be inferred that the main components of the skeletal carbides are TaC and HfC. Oxidation takes place in the vicinity of the crack as it continues to propagate. Meanwhile, there are also dispersed small carbides within the alloy, which, as a type of precipitate, can strengthen the alloy [23].
Some studies of nickel-based single crystals have shown that the properties of single crystals are not only closely related to the crystal orientation, as the deformation mechanisms related to dislocation motion also vary with the orientation [34,35,36]. To better understand the stress–strain response and damage mechanisms during the creep–fatigue process, we used EBSD and TEM to characterize the dislocations of T and L specimens with different grain orientations. The grain orientations of the TEM samples for the T specimens at strain ranges of 0.6% and 1.6% were analyzed using EBSD, as shown in the Figure 12. From Figure 12a, it can be seen that the cross-section of the specimen at a strain range of 0.6% contains two grains, with Z-axis directions near [113] and [212]. For the TEM analysis, the thin area near the punching hole (i.e., the grain near a Z-axis direction of [113]) was selected for observation. From Figure 12b, it can be seen that the cross-section of the specimen at a strain range of 1.6% contains only one grain, near a Z-axis direction of [103]. The Z-axis direction of the longitudinal TEM specimens is always in the [001] direction.
TEM was used to analyze the dislocation morphology of specimens with different orientations at strain ranges of 0.6% and 1.6%, as shown in Figure 13. The dislocation morphology of the T specimens at strain ranges of 0.6% and 1.6% is shown in Figure 13a,c. SISFs can be observed cutting through some γ′ precipitates. More notably, both samples exhibit large-sized slip bands. Based on the zone axis and selected area electron diffraction patterns of the specimens, the trace direction of the slip bands can be determined as [ 11 1 ¯ ] and [200], with the slip plane of {111}, and the slip bands extend across multiple γ′ precipitate particles. These slip bands are formed by the accumulation and slip of SISFs on specific slip planes. Previous research [19] has shown that in the creep deformation process of this directionally solidified alloy at 980 °C, the T specimen mainly undergoes shearing of γ′ precipitates by SISFs and APB pairs, and APB pairs can dissociate into SISFs when sufficient energy is available. In this creep–fatigue test, the applied stress is much higher than that under slow creep conditions, providing enough energy for APB pairs to dissociate into SISFs. The generated SISFs move within the limited {111}<112> slip system. The <112> direction in the {111}<112> slip system is not a close-packed direction of the L12 ordered structure, making atomic migration difficult and increasing deformation resistance. The limited slip system is prone to non-uniform plastic deformation, which is the intrinsic reason for the high deformation resistance and poor plasticity of the T specimen.
During the fatigue cyclic loading process, the movement of dislocations is irreversible, with dislocations being emitted from the crack tip and slipping on specific slip systems [37,38]. Due to interactions with other defects and obstacles (such as precipitates and carbides), the forward and reverse motions of dislocations cannot be fully restored, leading to irreversible, non-recoverable dislocation movement and the accumulation of additional strain with increasing fatigue cycles [39,40]. This explains well the phenomenon of increasing peak stress and decreasing valley stress with increasing cycle number in the compressive fatigue test.
Figure 13b,d display the dislocation structure of the L specimen under strain ranges of 0.6% and 1.6%, respectively. At a strain range of 0.6%, numerous dislocation network structures were identified in the γ matrix, formed by the interweaving of dislocations with different orientations. Dislocations in the γ channels encounter less resistance during slip, and when they move to the γ/γ′ interface, they are impeded by the γ′ precipitates and accumulate there. More energy is required for dislocations to cut through the γ′ phase along a specific orientation. As the strain range reaches 1.6%, a notable rise in the dislocation density is observed within the γ channels, making it impossible to distinguish the dislocation network structure. More dislocations cut through the γ′ phase, and some γ′ precipitates are severely sheared, losing the γ/γ′ interface. This indicates that the γ′ phase loses its L12 ordered structure after being sheared by multiple dislocations, which may lead to softening of the alloy. Clear dislocation pairs can be observed in some γ′ precipitates. These dislocation lines are short and thick, typical of APB pairs shearing the γ′ phase and similar to the deformation mechanism observed in the creep deformation at 980 °C [19].
Based on the above discussions, the damage mechanisms of the directionally solidified superalloy under the creep–fatigue interaction at 980 °C are summarized. At low strain ranges, creep damage is dominant, with creep cavities forming inside the specimen and cracks nucleating preferentially at cavities or brittle inclusions, with fatigue sources mostly distributed in the specimen interior. As the strain range increases, the damage mechanism transitions from creep-dominated to creep–fatigue coupled damage, with cracks nucleating preferentially on the surface. Oxidation damage also plays a role in the SADE process, and the fracture surface exhibits a characteristic of multiple fatigue sources expanding in coordination. Combining the dislocation analysis, the creep–fatigue deformation mechanisms for L and T specimens are shown in Figure 14. For the L specimen, at low strain ranges, dislocations in multiple orientations of the {111}<110> slip system are activated simultaneously, interacting within the γ channels to form dislocation networks, depositing at interfaces (such as γ/γ′ interfaces, carbides, inclusions, and cavities), and accumulating plastic strain energy. As the strain range increases, the degree of dislocation shearing through the γ′ phase via APB pairs intensifies. In the T specimen, SISFs move within the limited {111}<112> slip system. But, <112> is not the maximum atomic packing orientation of the L12 ordered structure, making atomic migration difficult and increasing deformation resistance. The SISFs in the limited slip system accumulate and slip on specific planes to form dislocation slip bands.

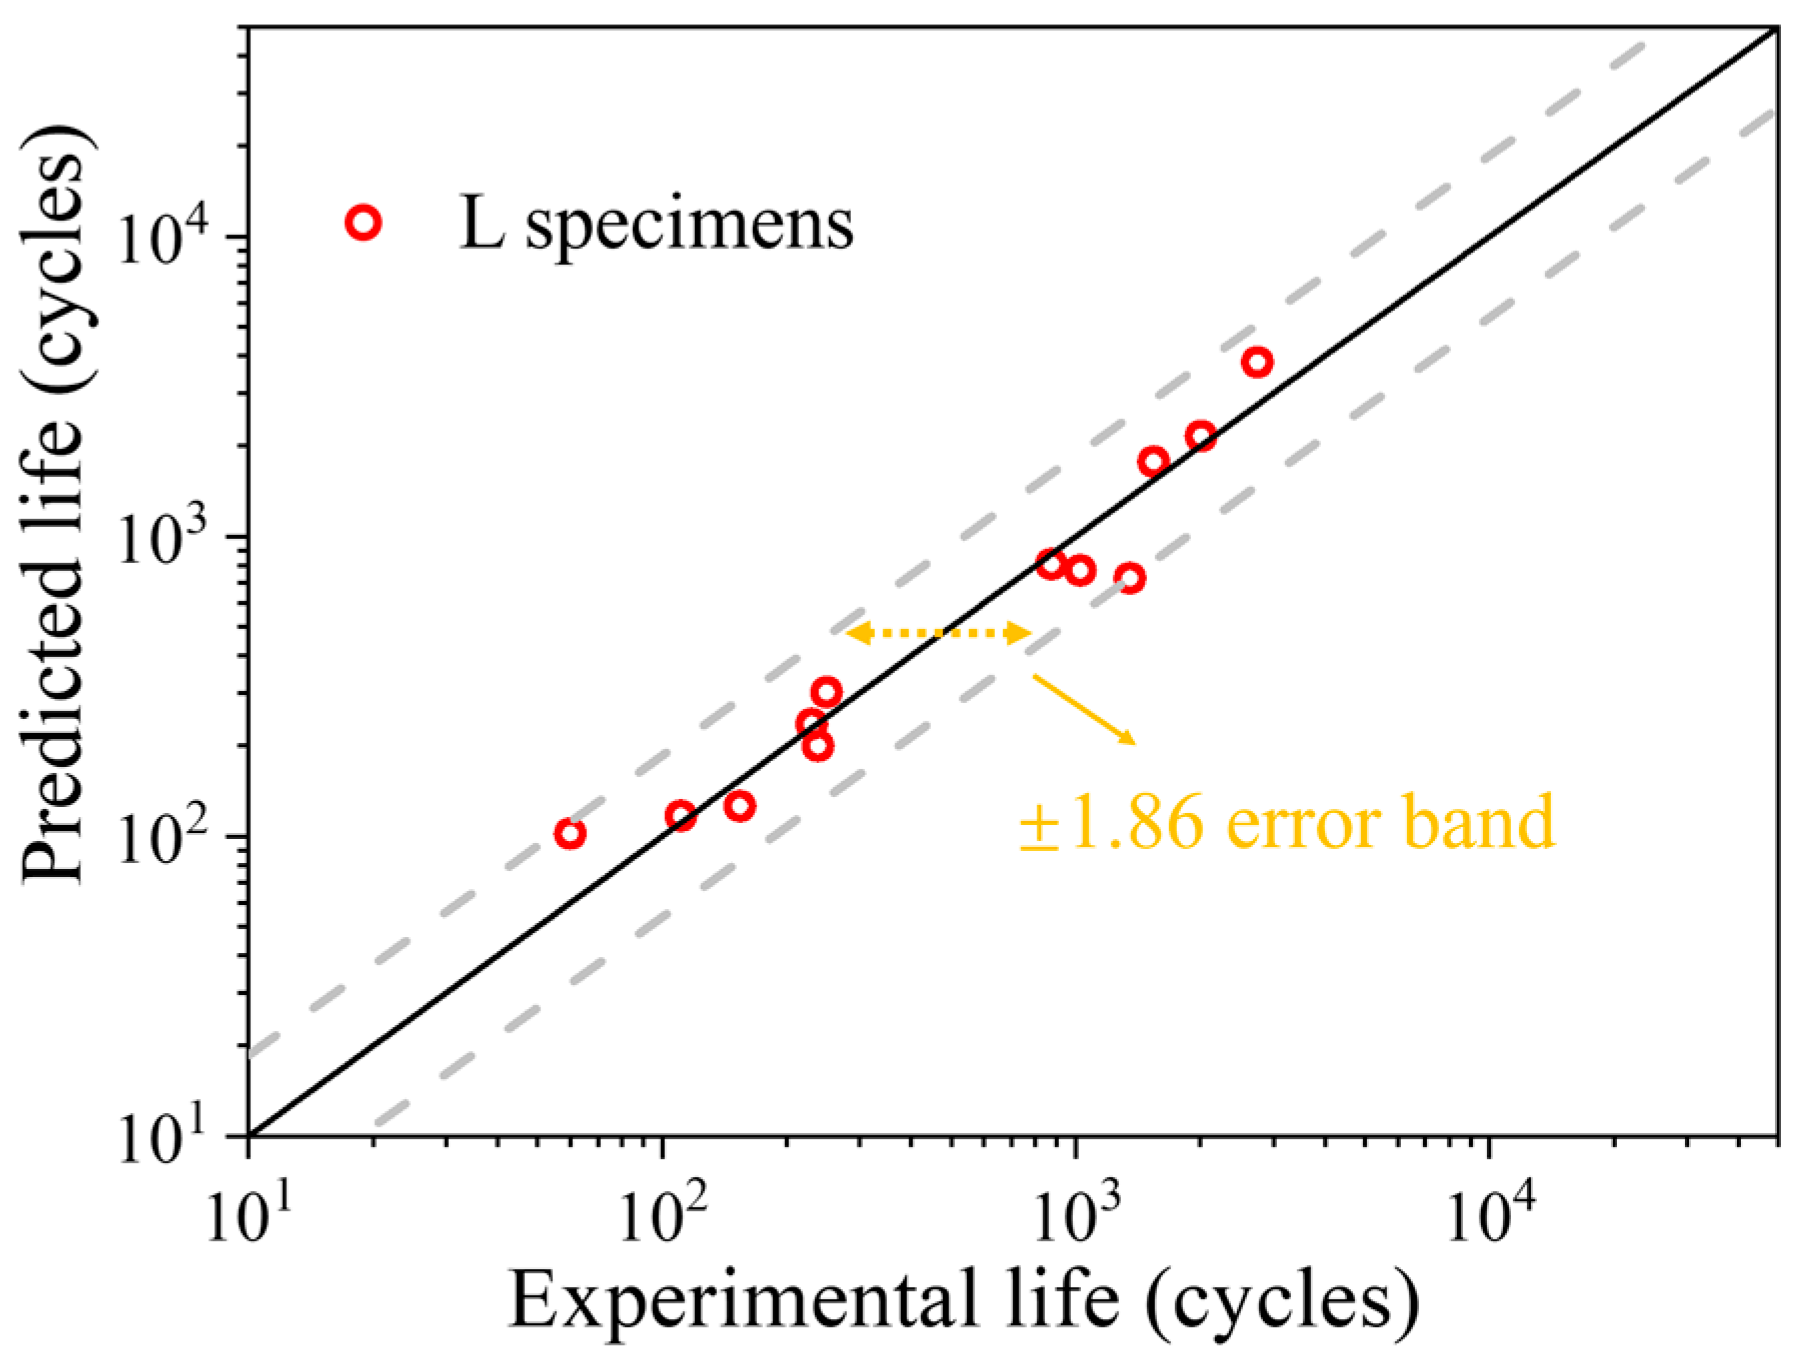
4.2. Life Prediction

Steady-state cyclic stress–strain data are usually used as the input for life prediction models. The steady-state cyclic stress–strain data for L and T specimens at 1/2 N f are obtained from the test data shown in Table 1, where Δ ε t represents the total strain range, which comprises two components: Δ ε e (the elastic strain component) and Δ ε p (the plastic strain component). σ a denotes the stress amplitude, σ m a x refers to the maximum stress, and N f is the cyclic life.
There has been extensive research on life prediction models for pure creep and pure fatigue. Many theoretical models have also been proposed for life prediction under the creep–fatigue interaction [41,42,43,44,45]. Building upon existing continuum damage mechanics (CDM)-based models [46], this paper enhances the model by taking into account the strain energy dissipation under creep–fatigue coupling and the stress relaxation during the hold period.
For fatigue damage, Lemaitre et al. [47] proposed a classical fatigue damage evolution model:
d D f = ( 1 D f ) n ( σ a M ) β d N
where D f refers to the fatigue damage, and M, β , and n are temperature-dependent material parameters.
For creep damage, Chaboche [48] and Lemaitre [49] proposed a creep damage model based on the work of Rabotnov et al. [50]:
d D c = ( σ A ) r ( 1 D c ) m d t
where D c is the creep damage, σ is the stress, and A, r, and m are temperature-dependent material parameters.
To describe creep damage under alternating loading, Equation (2) is improved based on the work of Berti et al. [51]:
d D c = ( σ ( t ) A ) r ( 1 D c ) m d t
where σ(t) represents the load–time relationship.
To describe the damage under the coupling effect from an energy perspective, Equation (1) is improved:
d D f = ( Δ W t M ) β ( 1 D f ) n d N
where
Δ W t = Δ σ Δ ε
The modified prediction model for the creep–fatigue coupled life is derived as follows:
d D d N = ( 1 D ) m 0 t 0 ( σ ( t ) A ) r d t + ( Δ w t M ) β
Fatigue damage parameters were obtained from pure fatigue test data in the handbook of “Material Data Manual for Aero-engine Design” [52], and creep damage parameters were obtained from pure creep test data in our previous publications [19]. Since the manual data lack pure fatigue test data for the T specimen, only the creep–fatigue life of the L specimen is predicted and evaluated in this section. Table 2 presents the fatigue and creep damage parameters, which were obtained using the Levenberg–Marquart nonlinear optimization algorithm.
To simplify the calculation, the creep stress σ(t) during the hold period is assumed to vary linearly from the start to the end of the hold time. The stress–strain data from the steady-state cycling at 1/2 N f shown in Table 1 are used as input for the predictive model for the creep–fatigue lifetime, and the predicted and experimental life values are shown in Figure 15. The modified creep–fatigue life prediction model, which takes into account the stress relaxation effect during the hold period and the strain energy dissipation, achieves a prediction accuracy within an error band of 1.86 times.

5. Conclusions

A directional solidification nickel-based superalloy was subjected to multiple creep–fatigue experiments at 980 °C to investigate the damage mechanisms across varying orientations and evaluate its life. The experimental findings and subsequent analysis lead to the conclusions summarized below.
(1) At low strain ranges, creep damage is dominant, with creep cavities forming inside the specimen and cracks nucleating preferentially at cavities or brittle inclusions, and with fatigue sources mostly distributed in the specimen interior. As the strain range increases, the damage mechanism transitions from creep-dominated to creep–fatigue coupled damage, with cracks nucleating preferentially on the surface and exhibiting a characteristic of multiple fatigue sources expanding in coordination. In addition to this, crack initiation and propagation in the transverse specimens are more inclined to occur along high-angle grain boundaries.
(2) In the L specimen, dislocations in multiple orientations of the {111}<110> slip system are activated simultaneously, interacting within the γ channels to form dislocation networks, and dislocations shear through the γ′ phase via the APB mechanism. In the T specimen, SISFs move within the limited {111}<112> slip system, with SISFs accumulating and slipping on specific slip planes to form dislocation slip bands.
(3) The modified creep–fatigue life prediction model, which takes into account the strain energy dissipation under creep–fatigue coupling and the stress relaxation during the hold period, can accurately predict the fatigue life under creep–fatigue coupling, with a prediction accuracy within a scatter band of 1.86 times.
This study, however, has several limitations. For instance, in T specimens, the grain growth direction is perpendicular to the applied stress direction, but the secondary orientation relative to the applied stress direction is random. Therefore, the TEM characterization analysis of the T specimens in this paper can only represent a portion of the orientations. Additionally, the actual working conditions of guide vanes are far more complex than creep–fatigue coupling, which also points the way for our further research.

Author Contributions

Conceptualization, A.L. and X.L.; methodology, A.L., X.L., J.G. and R.L.; software, A.L., L.X. and G.Z.; validation, J.X. and G.Z., formal analysis, G.Z. and L.X., investigation, A.L. and R.L., resources, G.F., J.G. and R.L.; data curation, A.L., J.X. and L.X. writing—original draft preparation, A.L.; writing—review and editing, L.X., G.F., J.G. and R.L.; visualization, A.L.; supervision, G.F., J.G. and R.L.; project administration, J.G.; funding acquisition, G.F., J.G. and R.L. All authors have read and agreed to the published version of the manuscript.

Funding

This research was funded by the National Key Research and Development Program of China, grant number Nos.2021YFB3702900.

Data Availability Statement

The original contributions presented in the study are included in the article; further inquiries can be directed to the corresponding authors.

Conflicts of Interest

Authors Anping Long, Xiaoshan Liu, Lei Xiao, Gaoxiang Zhang, Jiangying Xiong, Ganjiang Feng, Jianzheng Guo were employed by the company Wedge Central South Research Institute Co., Ltd. The remaining authors declare that the research was conducted in the absence of any commercial or financial relationships that could be construed as a potential conflict of interest.

Abbreviations

The following abbreviations are used in this manuscript:
APBAntiphase boundary
SISFsSuperlattice intrinsic stacking faults
TTransverse
LLongitudinal
OMOptical microscope
SEMScanning electron microscope
EDSEnergy-dispersive spectroscopy
TEMTransmission electron microscope
EBSDElectron Backscatter Diffraction
MSFCsMicrostructural small fatigue cracks
SADEStress-assisted dynamic embrittlement
CDMContinuum damage mechanics

References

  1. Sun, D.B.; Ma, G.L.; Wan, Z.H.; Gao, J.H. Study on creep-fatigue interaction mechanism and life prediction of aero-engine turbine blade. Eng. Failure Anal. 2023, 154, 107715. [Google Scholar] [CrossRef]
  2. Abu, A.O.; Eshati, S.; Laskaridis, P.; Singh, R. Aero-engine turbine blade life assessment using the Neu/Sehitoglu damage model. Int. J. Fatigue 2014, 61, 160–169. [Google Scholar] [CrossRef]
  3. Sajjadi, S.A.; Nategh, S. A high temperature deformation mechanism map for the high performance Ni-base superalloy GTD-111. J. Mater. Sci. Eng. A 2001, 307, 158–164. [Google Scholar] [CrossRef]
  4. Zhang, S.Q.; Hu, L.J.; Yang, Z.Y.; Niu, S.X.; Bao, H.Z.; Jin, Q.C.; Renqing, D.J.; Jiang, R.S. A Contribution to the Study of the Integrity Surface of the IC10 Ni3Al-Based Alloy After Creep-Feed Grinding with a Focus on High-Temperature Fatigue Life. Metals 2024, 14, 1440. [Google Scholar] [CrossRef]
  5. Kang, D.S.; Lee, H.; Yun, D.W.; Jeong, H.W.; Yoo, Y.S.; Seo, S.M. Microstructural mechanism of local dynamic recrystallization around cavity during tertiary creep in directionally solidified superalloy CM247LC. Mater. Charact. 2023, 198, 112727. [Google Scholar] [CrossRef]
  6. Ding, X.; Huang, D.W.; Guo, Z.X.; Zhang, X.J.; Shen, C.Y.; Luan, X.; Wangyin, Z.R. Fracture failure analysis of DZ125 directionally solidified superalloy under combined high and low cycle fatigue. Eng. Fract. Mech. 2024, 310, 110459. [Google Scholar] [CrossRef]
  7. An, W.R.; Utada, S.; Antonov, S.; Lu, S.; He, S.L.; Lu, F.; Zheng, W.W.; Li, L.F.; Cormier, J.; Feng, Q. Microstructural evolution and creep mechanism of a directionally solidified superalloy DZ125 under thermal cycling creep. J. Alloys Compd. 2023, 947, 169533. [Google Scholar] [CrossRef]
  8. Rai, R.K.; Sahu, J.K.; Das, S.K.; Paulose, N.; Fernando, C. Creep-fatigue deformation micromechanisms of a directionally solidified nickel-base superalloy at 850 °C. Fatigue Fract. Eng. Mater. Struct. 2020, 43, 51–62. [Google Scholar] [CrossRef]
  9. Shi, D.Q.; Dong, C.L.; Yang, X.G.; Sun, Y.T.; Wang, J.K.; Liu, J.L. Creep and fatigue lifetime analysis of directionally solidified superalloy and its brazed joints based on continuum damage mechanics at elevated temperature. Mater. Des. 2013, 45, 643–652. [Google Scholar] [CrossRef]
  10. Li, K.S.; Wang, R.Z.; Yuan, G.J.; Zhu, S.P.; Zhang, X.C.; Tu, S.T.; Miura, H. A crystal plasticity-based approach for creep-fatigue life prediction and damage evaluation in a nickel-based superalloy. Int. J. Fatigue 2021, 143, 106031. [Google Scholar] [CrossRef]
  11. Kumar, C.; Kumar, P. Creep-fatigue damage evolution in a nickel-based superalloy: An experiment-inspired modeling approach for life prediction. Int. J. Fatigue 2025, 195, 108872. [Google Scholar] [CrossRef]
  12. Cheng, L.Y.; Wang, R.Z.; Wang, J.; Zhu, S.P.; Zhao, P.C.; Miura, H.; Zhang, X.C.; Tu, S.T. Cycle-dependent creep-fatigue deformation and life predictions in a nickel-based superalloy at elevated temperature. Int. J. Mech. Sci. 2021, 206, 106628. [Google Scholar] [CrossRef]
  13. Sun, D.B.; Wan, Z.H. Experimental study and creep-fatigue life prediction of turbine blade material DZ125 considering the nonholding effect and coupling effect of stress and high temperature. J. Pressure Vessel Technol. 2024, 146, 031702. [Google Scholar] [CrossRef]
  14. Hu, J.H.; Zhao, G.L.; Li, S.L.; Qi, H.Y.; Yang, X.G.; Shi, D.Q. Damage evolution and life modeling of hot corrosion environment on creep-fatigue of a directionally solidified nickel-based superalloy. Fatigue Fract. Eng. Mater. Struct. 2023, 46, 1512–1526. [Google Scholar] [CrossRef]
  15. Wang, R.Z.; Zhu, S.P.; Wang, J.; Zhang, X.C.; Tu, S.T.; Zhang, C.C. High temperature fatigue and creep-fatigue behaviors in a Ni-based superalloy: Damage mechanisms and life assessment. Int. J. Fatigue 2019, 118, 8–21. [Google Scholar] [CrossRef]
  16. Ding, B.; Ren, W.; Peng, J.C.; Zhong, Y.B.; Li, F.; Yu, J.B.; Ren, Z.M. Revealing the creep-fatigue deformation mechanism for a directionally-solidified Ni-based superalloy DZ445 at 900 °C. Mater. Res. Express 2018, 5, 076513. [Google Scholar] [CrossRef]
  17. Ding, B.; Ren, W.L.; Deng, K.; Li, H.T.; Liang, Y.C. An abnormal increase of fatigue life with dwell time during creep-fatigue deformation for directionally solidified Ni-based superalloy DZ445. High Temp. Mater. Processes 2018, 37, 277–284. [Google Scholar] [CrossRef]
  18. Hu, X.A.; Zhang, Q.; Jiang, Y.; Rao, G.F.; Miao, G.L.; He, W.F.; Nie, X.F. The effect of cyclic loading on the creep fatigue life and creep strength of a DS superalloy: Damage mechanism and life modeling. Int. J. Fatigue 2020, 134, 105452. [Google Scholar] [CrossRef]
  19. Long, A.P.; Xiong, J.Y.; Wei, B.; Zhang, G.X.; Feng, G.J.; Guo, J.Z.; Liu, R.T. Creep Mechanism and Microstructure Evolution of a Directionally Solidified Ni-Based Superalloy with Different Orientations at 850 °C. Materials 2025, 18, 1540. [Google Scholar] [CrossRef]
  20. Chen, J.B.; Chen, J.Y.; Wang, Q.J.; Wu, Y.D.; Li, Q.; Xiao, C.B.; Li, S.L.; Wang, Y.D.; Hui, X.D. Enhanced creep resistance induced by minor Ti additions to a second generation nickel-based single crystal superalloy. Acta Mater. 2022, 232, 117938. [Google Scholar] [CrossRef]
  21. Wei, B.S.; Lin, Y.; Huang, Z.W.; Huang, L.; Zhou, K.C.; Zhang, L.F.; Zhang, L.J. A novel Re-free Ni-based single-crystal superalloy with enhanced creep resistance and microstructure stability. Acta Mater. 2022, 240, 118336. [Google Scholar] [CrossRef]
  22. Stinville, J.C.; Suave, L.M.; Mauget, F.; Marcin, L.; Villechaise, P.; Pollock, T.M.; Cormier, J. Damage nucleation during transverse creep of a directionally solidified Ni-based superalloy. Mater. Sci. Eng. A 2022, 858, 144089. [Google Scholar] [CrossRef]
  23. Li, Q.Y.; Tian, S.G.; Yu, H.C.; Tian, N.; Su, Y.; Li, Y. Effects of carbides and its evolution on creep properties of a directionally solidified nickel-based superalloy. Mater. Sci. Eng. A 2015, 633, 20–27. [Google Scholar] [CrossRef]
  24. Gdoutos, E.E. Fracture Mechanics: An Introduction, 3rd ed.; Springer Nature: Cham, Switzerland, 2020; Volume 263, pp. 15–63. [Google Scholar] [CrossRef]
  25. Eshelby, J.D. The determination of the elastic field of an ellipsoidal inclusion, and related problems. Proceedings of the royal society of London. Ser. A Math. Phys. Sci. 1957, 241, 376–396. [Google Scholar] [CrossRef]
  26. Zheng, H.W.; Muraishi, S. Two ways to estimate precipitate elastic fields through Eshelby inclusion theory. Results Mater. 2024, 21, 100544. [Google Scholar] [CrossRef]
  27. Rodriguez, P.; Rao, K.B.S. Nucleation and growth of cracks and cavities under creep-fatigue interaction. Prog. Mater. Sci. 1993, 37, 403–480. [Google Scholar] [CrossRef]
  28. Rao, K.B.S.; Meurer, H.P.; Schuster, H. Creep-fatigue interaction of Inconel 617 at 950 °C in simulated nuclear reactor helium. J. Mater. Sci. Eng. A 1988, 104, 37–51. [Google Scholar] [CrossRef]
  29. Suresh, S. Fatigue of Materials, 2nd ed.; Cambridge University Press: Cambridge, UK, 1998; pp. 132–162. Available online: https://books.google.com.hk/books?id=j4w6frFAiQcC&printsec=frontcover&hl=zh-CN#v=onepage&q&f=false (accessed on 5 April 2025).
  30. Pineau, A.; Antolovich, S.D. High temperature fatigue of nickel-base superalloys–A review with special emphasis on deformation modes and oxidation. Eng. Failure Anal. 2009, 16, 2668–2697. [Google Scholar] [CrossRef]
  31. Jiang, R.; Song, Y.D.; Reed, P.A. Fatigue crack growth mechanisms in powder metallurgy Ni-based superalloys—A review. Int. J. Fatigue 2020, 141, 105887. [Google Scholar] [CrossRef]
  32. Muller, F.M.; Fang, C.Z.; Basoalto, H.C.; Williams, S.; Bowen, P. Modelling and predictions of time-dependent local stress distributions around cracks under dwell loading in a nickel-based superalloy at high temperatures. Int. J. Fatigue 2022, 163, 107038. [Google Scholar] [CrossRef]
  33. Chan, K.S. A grain boundary fracture model for predicting dynamic embrittlement and oxidation-induced cracking in superalloys. Metall. Mater. Trans. A 2015, 46, 2491–2505. [Google Scholar] [CrossRef]
  34. Liu, L.; Meng, J.; Liu, J.L.; Zhang, H.F.; Sun, X.D.; Zhou, Y.Z. Effects of crystal orientations on the low-cycle fatigue of a single-crystal nickel-based superalloy at 980 °C. Acta Metall. Sin. 2019, 32, 381–390. [Google Scholar] [CrossRef]
  35. Suzuki, S.Y.; Sakaguchi, M.; Inoue, H. Temperature dependent fatigue crack propagation in a single crystal Ni-base superalloy affected by primary and secondary orientations. Mater. Sci. Eng. A 2018, 724, 559–565. [Google Scholar] [CrossRef]
  36. Wollgramm, P.; Bürger, D.; Parsa, A.B.; Neuking, K.; Eggeler, G. The effect of stress, temperature and loading direction on the creep behaviour of Ni-base single crystal superalloy miniature tensile specimens. Mater. High Temp. 2016, 33, 346–360. [Google Scholar] [CrossRef]
  37. Deshpande, V.S.; Needleman, A.; Van der Giessen, E. Discrete dislocation modeling of fatigue crack propagation. Acta Mater. 2002, 50, 831–846. [Google Scholar] [CrossRef]
  38. Reddy, G.P.; Robertson, C.; Déprés, C.; Fivel, M. Effect of grain disorientation on early fatigue crack propagation in face-centred-cubic polycrystals: A three-dimensional dislocation dynamics investigation. Acta Mater. 2013, 61, 5300–5310. [Google Scholar] [CrossRef]
  39. Cheng, Z.X.; Wang, H.; Liu, G.R. Fatigue crack propagation in carbon steel using RVE based model. Eng. Fract. Mech. 2021, 258, 108050. [Google Scholar] [CrossRef]
  40. Ma, L.; Xiao, S.F.; Deng, H.Q.; Hu, W.Y. Molecular dynamics simulation of fatigue crack propagation in bcc iron under cyclic loading. Int. J. Fatigue 2014, 68, 253–259. [Google Scholar] [CrossRef]
  41. Gillis, P.P. Manson-coffin fatigue. Acta Metall. 1966, 14, 1673–1676. [Google Scholar] [CrossRef]
  42. Koul, A.K.; Castillo, R.; Willett, K. Creep life predictions in nickel-based superalloys. Mater. Sci. Eng. 1984, 66, 213–226. [Google Scholar] [CrossRef]
  43. Sandström, R. Basic Modeling and Theory of Creep of Metallic Materials, 1st ed.; Springer Nature: Cham, Switzerland, 2024; pp. 185–203. [Google Scholar] [CrossRef]
  44. Salehnasab, B. Low cycle fatigue behavior and life prediction of a directionally solidified alloy. J. Des. Fatigue 2024, 2, 1–10. [Google Scholar] [CrossRef]
  45. Dinesh, K.; Dash, B.B.; Kannan, R.; Paulose, N.; Reddy, G.P.; Krishnaswamy, H.; Sankaran, S. Effect of temperature on fatigue behavior and deformation mechanisms of nickel-based superalloy SU-263. Int. J. Fatigue 2025, 192, 108721. [Google Scholar] [CrossRef]
  46. Chaboche, J.L. Continuum damage mechanics: Part I—General concepts. J. Appl. Mech. 1988, 55, 59–64. [Google Scholar] [CrossRef]
  47. Lemaitre, J.; Chaboche, J.L. Mechanics of Solid Materials, 1st ed.; Cambridge University Press: Cambridge, UK, 1994; pp. 346–450. Available online: https://books.google.com.hk/books?id=YfHTNHfjqXoC&printsec=frontcover&hl=zh-CN#v=onepage&q&f=false (accessed on 5 April 2025).
  48. Chaboche, J.L. Continuous damage mechanics—A tool to describe phenomena before crack initiation. Nucl. Eng. Des. 1981, 64, 233–247. [Google Scholar] [CrossRef]
  49. Lemaitre, J. How to use damage mechanics. Nucl. Eng. Des. 1984, 80, 233–245. [Google Scholar] [CrossRef]
  50. Rabotnov, Y.N. Kinetics of creep and creep rupture. In Proceedings of the Irreversible Aspects of Continuum Mechanics and Transfer of Physical Characteristics in Moving Fluids, Symposia, Vienna, Austria, 22–28 June 1966. [Google Scholar] [CrossRef]
  51. Berti, G.A.; Monti, M. Thermo-mechanical fatigue life assessment of hot forging die steel. Fatigue Fract. Eng. Mater. Struct. 2005, 28, 1025–1034. [Google Scholar] [CrossRef]
  52. Yu, H.C.; Wu, X.R. Material Data Manual for Aero-Engine Design, 1st ed.; Aviation Industry Press: Beijing, China, 2010; Volume 4, pp. 338–344. Available online: https://scholar.google.com/scholar?cluster=14401761704590689732&hl=zh-CN&as_sdt=2005&sciodt=0,5 (accessed on 26 April 2025).
Figure 1. Schematic diagram of sampling and creep–fatigue testing.
Crystals 15 00429 g001
Figure 2. Original microstructures of T (ac) and L (df) specimens after heat treatment: dendritic regions (a,d); interdendritic regions (b,e); and γ′ phases in dendritic regions (c,f).
Crystals 15 00429 g002
Figure 3. Grain (a) and grain boundary (b,c) morphologies of the casting plate’s cross-section.
Crystals 15 00429 g003
Figure 4. The cyclic life comparison of T and L specimens.
Crystals 15 00429 g004
Figure 5. The stress range–cycle curves of T (a) and L (b) specimens at strain ranges of 0.6% to 1.6%.
Crystals 15 00429 g005
Figure 6. Hysteresis loops corresponding to T (a) and L (b) specimens.
Crystals 15 00429 g006
Figure 7. Fracture morphologies of T specimens at different strain ranges: 0.6% (a,b); 1.2% (c,d); and 1.6% (e,f).
Crystals 15 00429 g007
Figure 8. Fracture morphologies of L specimens at different strain ranges: 0.6% (a,b); 1.2% (c,d); and 1.6% (e,f).
Crystals 15 00429 g008
Figure 9. Internal cavities on the cross-section perpendicular to the fracture surface at a distance of 1 mm from the fracture in T (ac) and L (df) specimens: 0.6% (a,d); 1.2% (b,e); and 1.6% (c,f).
Crystals 15 00429 g009
Figure 10. Crack initiation on the surfaces of T (ac) and L (df) specimens: 0.6% (a,d); 1.2% (b,e); and 1.6% (c,f).
Crystals 15 00429 g010
Figure 11. Elemental distribution near the long crack by EDS analysis: morphology (a); Al (b); O (c); C (d); Ta (e); and Hf (f).
Crystals 15 00429 g011
Figure 12. Grain orientations of transverse TEM samples at strain ranges of 0.6% (a) and 1.6% (b).
Crystals 15 00429 g012
Figure 13. Dislocation morphology of T (a,c) and L (b,d) specimens: 0.6% (a,b) and 1.6% (c,d).
Crystals 15 00429 g013
Figure 14. Schematic diagrams of creep–fatigue mechanisms for the L (a) and T (b) specimens.
Crystals 15 00429 g014
Figure 15. Creep–fatigue life prediction results for the L specimens under the modified model.
Crystals 15 00429 g015
Table 1. Stress–strain data for L and T specimens in 1/2 N f steady-state cycling.
Specimen
Orientation
Δ ε t /2 (%) Δ ε e /2 (%) Δ ε p /2 (%) σ a (MPa) σ m a x (MPa) N f (Cycles)
L0.296 0.227 0.069 219 305 1544
0.283 0.224 0.058 219 313 2010
0.267 0.228 0.040 196 295 2750
0.396 0.289 0.107 278 377 873
0.402 0.289 0.113 275 358 1025
0.396 0.269 0.127 257 337 1351
0.591 0.363 0.228 376 453 230
0.641 0.376 0.265 374 436 238
0.591 0.409 0.182 382 479 250
0.785 0.443 0.342 518 602 60
0.801 0.454 0.346 455 537 111
0.775 0.452 0.323 457 541 154
T0.2870.2190.068254360323
0.2900.2270.0622343401243
0.3000.2260.075285393210
0.3950.2620.13336045696
0.4060.2890.118320418344
0.4340.3080.126326406350
0.5990.3620.23745449147
0.6010.2920.30949954611
0.6190.3700.24947652936
0.8400.4340.40754460015
0.8440.4000.44559563018
Table 2. Parameters of the creep–fatigue life prediction model.
rA (MPa)mβM (MPa)
6.423410.817.3572.866150.0
Disclaimer/Publisher’s Note: The statements, opinions and data contained in all publications are solely those of the individual author(s) and contributor(s) and not of MDPI and/or the editor(s). MDPI and/or the editor(s) disclaim responsibility for any injury to people or property resulting from any ideas, methods, instructions or products referred to in the content.

