Article

The Electrochemical Characteristics and Corrosion Resistance of a Low-Melting-Point Al49Sn21Zn16Pb14 Alloy in NaCl Solution

1
School of Materials Science and Chemical Engineering, Xi’an Technological University, Xi’an 710021, China
2
Aviation Key Laboratory of Science and Technology on Life-Support Technology, Xiangyang 441003, China
*
Author to whom correspondence should be addressed.
Crystals 2025, 15(5), 425; https://doi.org/10.3390/cryst15050425
Submission received: 7 April 2025 / Revised: 23 April 2025 / Accepted: 26 April 2025 / Published: 30 April 2025

Abstract

:
In this study, we prepared an innovative corrosion-resistant and low-melting-point Al49Sn21Zn16Pb14 alloy, and its microstructure was characterized. The corrosion resistance of the Al49Sn21Zn16Pb14 alloy in a NaCl solution with different concentrations was tested via electrochemical and immersion methods. In addition, the corrosion morphologies and products were analyzed via scanning electron microscopy (SEM), energy dispersive spectrometry (EDS), and X-ray diffraction (XRD), and the effects of the NaCl solution’s concentration on the corrosion resistance of the Al49Sn21Zn16Pb14 alloy were studied. The results showed that the melting point of the Al49Sn21Zn16Pb14 alloy was only 356.8 °C, and the melting temperature range was 356.8–377.6 °C. The microstructure of the Al49Sn21Zn16Pb14 alloy was dendritic, eutectic, and peritectic, and it had a face-centered cube (FCC) composition in the solid solution phase. The dendrite structure comprised an Al-rich solid solution primarily in the interdendrites and a Zn-rich solid solution mostly in the dendrites; the eutectic structure mainly consisted of Sn- and Pb-rich solid solutions; and the peritectic structure mainly comprised Zn- and Sn-rich solid solutions. In NaCl solutions of different concentrations, the Al49Sn21Zn16Pb14 alloy is generally corrosive; the corrosion rate of the Al49Sn21Zn16Pb14 alloy in 3.5% NaCl solution was 1.97 × 10⁻² mm/a; and the corrosion surface was loose or cracking. The corrosion products attached to the corrosion surface of the alloys mainly comprised Al and Zn oxides, while Sn and Pb corroded to form Sn and Pb oxides, which dissolved or fell off to form microholes or pores on the corrosion surface of the Al49Sn21Zn16Pb14 alloy. With an increase in the NaCl solution’s concentration, the degree of corrosion products that fell off or dissolved increased, and thus, the Al49Sn21Zn16Pb14 alloy’s corrosion rate increased. In 10.5% and 14% NaCl solutions, the amount of Al oxides in the corrosion products increased, and the locally dense corrosion product that formed on the corrosion surface of the Al49Sn21Zn16Pb14 alloy cracked and could not protect the matrix. The locally dense corrosion products on the surface of the Al49Sn21Zn16Pb14 alloy in NaCl solutions therefore could not improve the corrosion resistance.

1. Introduction

Structural steel and steel products are easily corroded in the atmosphere and other environments [1,2,3,4,5]. To improve the product’s performance and durability during service life, usually, anti-corrosion coatings are prepared and applied to steel products [6,7,8,9,10]. The corrosion resistance of the coating material directly determines its protective effects [11,12,13,14,15]. There is therefore great value in studying the corrosion resistance of coating materials suitable for the surface of structural steel and steel products. Al, Zn, Sn, Pb, and their alloys have good corrosion resistance, leading to their widespread use as coating materials for structural steel or steel products [16,17,18,19,20]. Zinc and its alloys are often used in this type of coating as their protection effectiveness results from barrier and sacrificial protection, thus providing excellent atmospheric corrosion resistance [21,22]. Moreover, hot-dip galvanizing is typically used as the surface protection layer on steel products and structural steel. Aluminum and aluminum alloys have good casting properties, mainly due to liquid aluminum exhibiting good fluidity [23]. In addition, as aluminum and aluminum alloys have good corrosion resistance, adding aluminum to the alloy can not only improve the corrosion resistance but also the molding performance. Adding Al can also improve the fluidity of liquid Zn alloys, thus increasing the bonding force between the coating and the substrate during hot-dip Zn alloy plating [24,25]. In addition, a dense Al2O3 film can easily form on the surface of an Al alloy in atmospheric environments, which has a protective effect on the matrix and improves the corrosion resistance [26,27]. In this work, zinc and aluminum were therefore selected as the alloy components. PbSn is a typical eutectic alloy with good casting properties, good fluidity, a low melting point, good wettability, and good corrosion resistance, making it a common choice as a hot-dip coating material on copper wires [28]. In this work, Pb and Sn elements were used as the alloy components, mainly based on two considerations. First, PbSn is a typical eutectic alloy with a low melting point and good wettability. We thus attempted to add Pb40Sn60 to the composition of the alloy, thereby aiming to effectively reduce the melting point and increase the wettability of the alloy. Second, as PbSn has good corrosion resistance, the alloy was prepared on copper wires as a hot-dip plating material to effectively improve their weather corrosion resistance. For example, to improve the corrosion resistance, the PbSn alloy was hot-dip plated on the solar photovoltaic panel busbar (copper strip). This study therefore attempted to add PbSn as a component of the alloy, which we hoped would effectively improve the corrosion resistance of the alloy. The AlZnPbSn alloy studied in this work can also be used as a novel hot-dip plating material, which is widely used in steel and copper products.
Reducing the melting point of a hot-dip coating material is of great value for hot-dip plating technology. The existing literature mainly focuses on the following low-melting-point aluminum alloys: Al-Si, Al-Si-Cu, Al-Ge-Si, Al-Si-Zn, Al-Si-Cu-Ge, Al-Si-Cu-Zn, etc. Among these, the melting point of the Al-Ge-Cu alloy is relatively low at about 418 °C~426 °C. The commonly used AlZn alloy offers good corrosion resistance, but its melting point is high at about 560 °C. PbSn is a eutectic alloy with a low melting point at about 183 °C. Considering these characteristics, in this study, we attempted to add PbSn to AlZn for realloying—thereby reducing the melting point of the alloy—toward designing and preparing a novel low-melting-point corrosion-resistant alloy (Al49Sn21Zn16Pb14) as a coating material for the hot-dip plating of structural steel and steel products. High-entropy alloys are designed differently to traditional alloys and form solid solutions with crystal structures and multiple principal elements, thus giving them the advantages of multiple elements, an integrated crystal structure and excellent properties, unlike those exhibited by traditional alloys [29,30,31,32,33]. Daming Jiang et al. studied the corrosion resistance of an AlZnMgCu alloy by using potentiodynamic polarization and impedance testing [34]; their results showed that the potential of the AlMg phase in the dendrites is relatively low, while the potential of the HCP phase in the matrix is relatively high. There is a potential difference between the AlMg phase in the dendrites and the HCP phase in the matrix, thus forming a galvanic cell. The dendrites are corroded as the anode region, while the matrix is protected as the cathode region, and the corrosion micro-zones are connected to each other and develop into a large corrosion pit area. Menghan Zhang et al. used an electrochemical workstation to study the corrosion resistance of AlZnMgCu, a lightweight high-entropy alloy [35]. In their study, the Cu in the FCC phase was solidly dissolved into the matrix, which improved the corrosion resistance of the alloy, and the Cu in the FCC phase was enriched to precipitate the second phase, which formed a micro-corrosion battery with the FCC phase and reduced the corrosion resistance of the alloy. Xueming Wei et al. investigated the effects of the addition of C on the corrosion resistance of CoCrFeNi, a high-entropy alloy [36]. If an M7C3 carbide phase is formed by the addition of C, the M7C3 phase and the FCC phase of the matrix form an electric pair, and thus, electrical couple corrosion occurs, which reduces the corrosion resistance of the alloy. The literature search shows that high-entropy alloys with a single-phase solid-solution structure have a better corrosion resistance, while high-entropy alloys with a precipitated phase can easily form micro-corrosion cells, reducing the corrosion resistance of the alloy [37,38,39,40]. As the corrosion resistance of the alloy can be significantly improved by increasing its entropy, research on multi-principal element alloys is thus of great significance to improve the corrosion resistance of metal materials [41,42]. A NaCl solution is typically used as the corrosion medium to study the corrosion resistance of metals and their alloys [43,44]. In this work, first, the Al49Sn21Zn16Pb14 alloy was designed and prepared, its microstructure and phase structure were analyzed, and its corrosion performance in NaCl solutions was tested. Second, the influence of the NaCl solution’s concentration on the corrosion resistance of the Al49Sn21Zn16Pb14 alloy was analyzed. Finally, the corrosion mechanism of the Al49Sn21Zn16Pb14 alloy in NaCl solutions was revealed.

2. Experiments

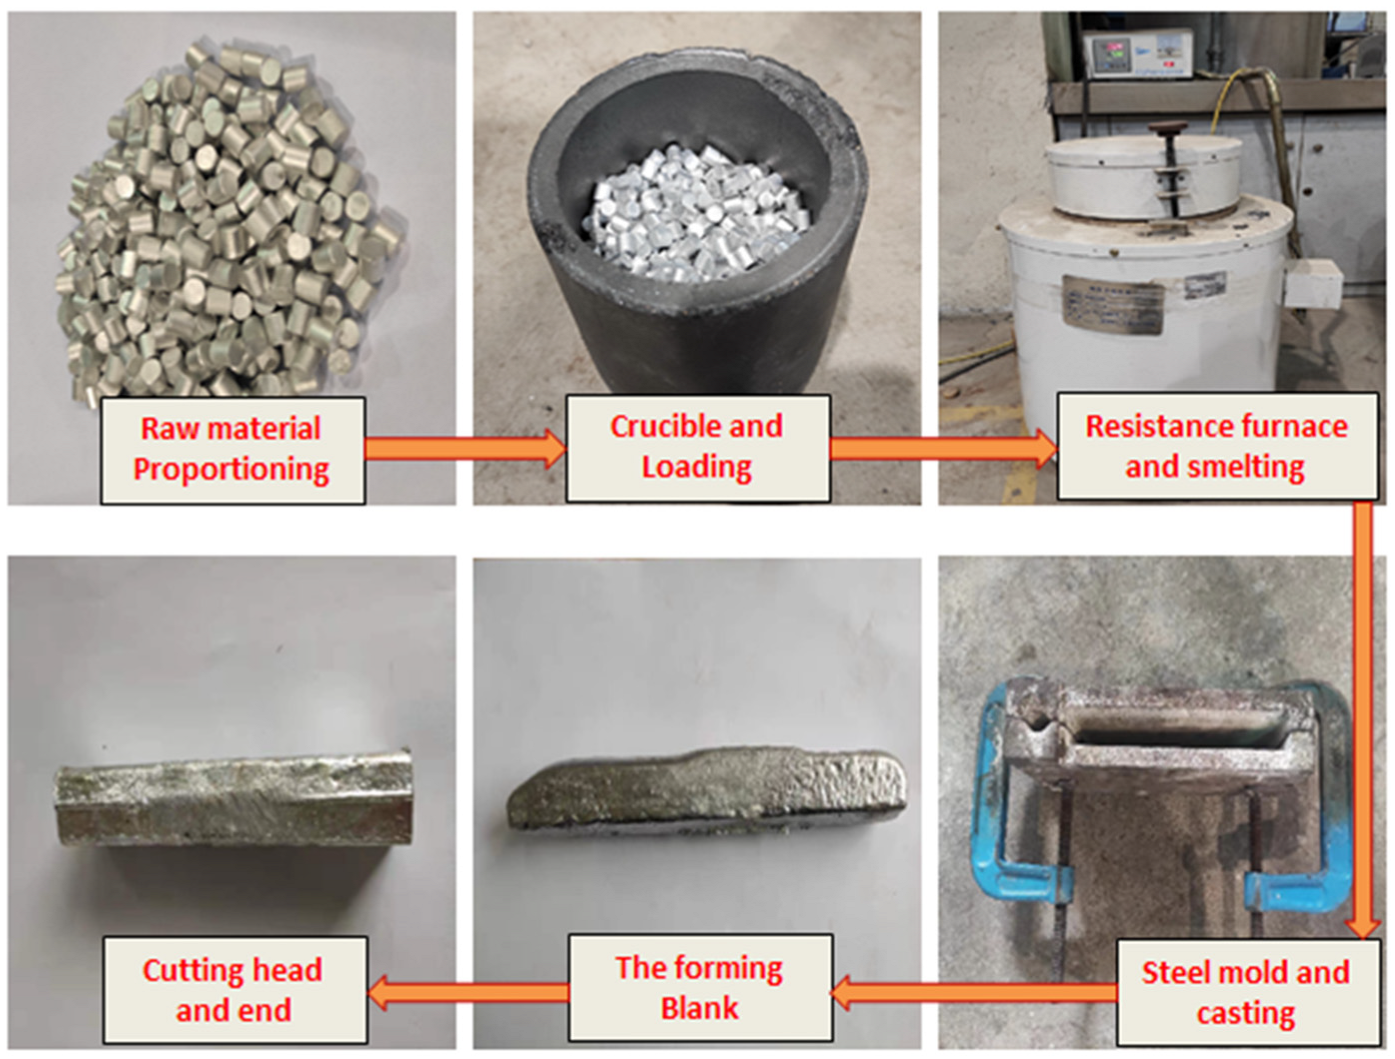
2.1. Experimental Materials
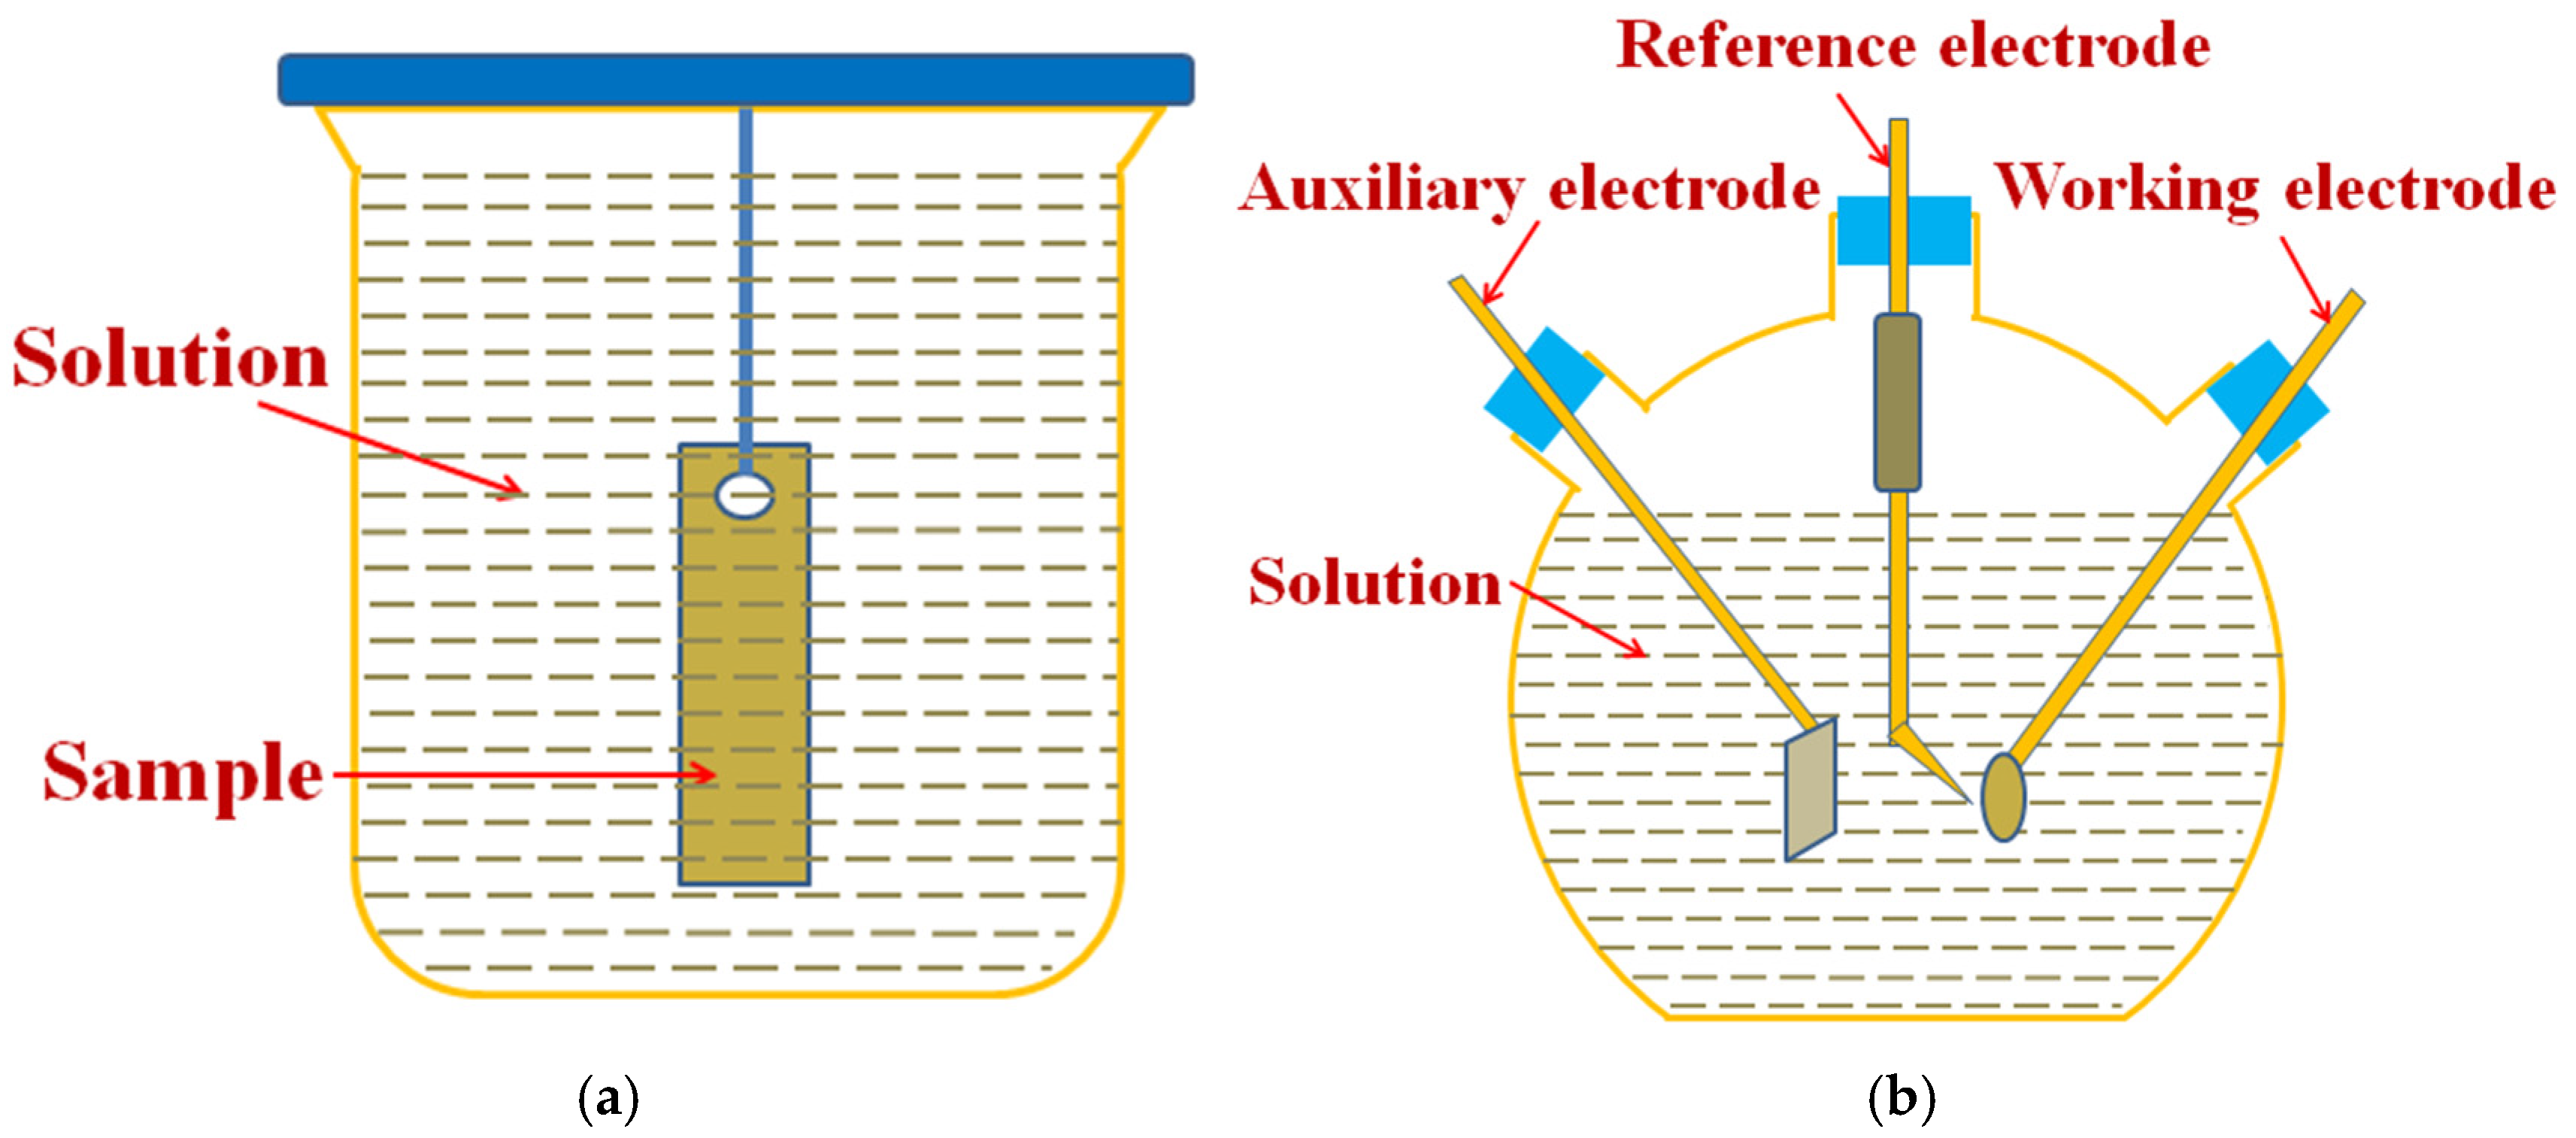
The main considerations in the design of an alloy’s composition are the melting point and corrosion resistance. When trying to obtain a lower-melting-point alloy, three steps are required: In this study, the first step was to design the composition of the AlZn alloy. In the early stages, the research team evaluated the melting point, structure, and properties of AlZn alloys with different proportions of components, with the results showing that the Al75Zn25 alloy has the lowest melting point at about 461 °C using a 75:25 composition ratio. In the second step, PbSn is used a typical eutectic alloy, and the alloy phase diagram shows Pb40Sn60 to be the eutectic component with the lowest melting point at 183 °C [45]. The ratio of the PbSn alloy composition was therefore chosen as 40:60. The third step is choosing the Al75Zn25 and Pb40Sn60 alloy ratio. The research team conducted research on the melting point, structure, and properties of an (Al75Zn25)x(Pb40Sn60)(1−x) alloy with different proportions of components, and the results showed that the (Al75Zn25)65(Pb40Sn60)35 alloy has the lowest melting point at about 357 °C. The composition ratio of the (Al75Zn25) and (Pb40Sn60) alloy was therefore chosen as 65:35. Finally, the chemical composition of the alloy is 49%Al, 21%Sn, 16%Zn, and 14%Pb; that is, the designed alloy is termed Al49Sn21Zn16Pb14.
Elemental Al, Zn, Sn, and Pb metal particles with 99.9% purity were used as raw materials. Casting technology was used to prepare the experimental materials. A well-type resistance furnace was used to melt the alloy and the equipment was manufactured in May 2022 (equipment manufacturer Shanghai Yifeng Electrical Furnace Co., Ltd., Shanghai, China). The equipment was the SG2-5-12 model, with a rated power of 5 KW, a rated temperature of 1200 °C, a bore diameter of 2000 mm, and a depth of 250 mm. A graphite crucible with a volume of about 1 L was used to melt the alloy. A steel model was used for pouring and molding, and the samples were naturally cooled.
The preparation of experimental materials was divided into three steps. First, an Al75Zn25 alloy was prepared at a 75:25 Al/Zn mass ratio alloy composition. The resistance furnace was used for melting, and the melting temperature was 720 °C. In the second step, a Pb40Sn60 alloy was prepared with a 40:60 Pb/Sn composition. The resistance furnace was used for melting at a melting temperature of 230 °C. In the third step, the Al49Sn21Zn16Pb14 alloy was prepared at a 65:35 mass ratio of the prepared Al75Zn25 and Pb40Sn60 alloys. The resistance furnace was used for melting, and the melting temperature was 400 °C.
The preparation process of alloy is shown in Figure 1. To ensure the uniformity of the alloy, the alloy was melted repeatedly three times, and to reduce the level of impurities in the alloy, a refining agent was added when the alloy was melted. The selected refining agent was a fluoride refining agent, with a primary composition of NaF and CaF2 [46]. To reduce the porosity in the alloy, the liquid alloy melt was mechanically stirred. To ensure the intrinsic structure and properties of the alloy, the alloy ingot was cut off from the head and tail, and the testing samples were taken from the middle of the alloy ingot.

2.2. Corrosion Test

The corrosion resistance and electrochemical characteristics of Al49Sn21Zn16Pb14 alloy were tested by immersion experiments and electrochemical test experiments. Apparatus for electrochemical and immersion tests are shown in Figure 2. The corrosion performance of the prepared Al49Sn21Zn16Pb14 alloy was tested via immersion corrosion methods. The immersed test samples were hanging pieces with a size of 10 mm × 3 mm × 30 mm. The surfaces of the immersed samples were polished step by step with dry sandpaper to 2000# and cleaned via the acetone ultrasonic wave method. The soaking solutions were 3.5%, 7%, 10.5%, 14%, and 17.5% NaCl solutions, respectively. The ASTM G31 standard (Standard for Laboratory Immersion Corrosion of Metals) was referred to in the immersion corrosion test. The cycle of the immersion corrosion test is generally 7 days but should be selected based on the corrosion resistance of the material. The Al49Sn21Zn16Pb14 alloy in this study has good corrosion resistance. The immersion corrosion test was set at 4 cycles; that is, the immersion corrosion test lasted for 28 days. Immersion corrosion was tested at room temperature (about 23 °C). The electrochemical characteristics of the Al49Sn21Zn16Pb14 alloy were measured via three-electrode voltammetry using an electrochemical workstation (equipment manufacturer Princeton Applied Research (PAR) Co., Ltd., Oak Ridge, TN, USA; the equipment was manufactured in May 2022; and the equipment type was PARSTAT 2273). The auxiliary electrode was a platinum electrode and the reference electrode was a saturated calomel electrode.
The mass of the sample was weighed before corrosion, and after corrosion, the corrosion products were removed from the sample and the mass of the sample was weighed again. The corrosion rate of the Al49Sn21Zn16Pb14 alloy in NaCl solutions with different concentrations was calculated via the weight loss method. The weighing method was adopted to obtain the density of the Al49Sn21Zn16Pb14 alloy, which was 7.22 g/cm3. Chemical pickling was used to clean and remove corrosion products on samples. The corroded part of the sample was treated with 37% HCl at room temperature to effectively dissolve the corrosion products. Corrosion product removal was judged visually, and the guidelines for the corrosion of metals and alloys and the removal of corrosion products from corrosion test specimens GB/T 16545-2015 standards (Corrosion of metals and alloys—Removal of corrosion products from corrosion test specimens) were referenced. The specific operation process was as follows: In the first step, cotton balls soaked in HCl solution were used to wipe the corroded area of the sample so that the corrosion products were fully dissolved by the HCl solution, but the sample uncorroded matrix was not affected. In the second step, after pickling, the sample was rinsed to clean the residue and attached particles on the surface of the samples. The process was repeated until the corrosion products were removed completely from the specimen; the samples were then cleaned and air-dried.

2.3. Material Characterization and Property Testing

The prepared Al49Sn21Zn16Pb14 alloy was prepared in 10 mm × 10 mm × 10 mm cube samples, which were polished step by step with 180# to 2000# water sandpaper and were polished with diamond grinding paste. Scanning electron microscopy (SEM, Oxford, UK, Quanta 400F) was used to observe the microstructure of the Al49Sn21Zn16Pb14 alloy. Energy dispersive spectrometry (EDS, Britain, Oxford, X-Max) and X-ray diffraction (XRD, Karlsruhe, Germany, Bruker, XRD-6000) were performed to analyze the chemical composition and phase of the Al49Sn21Zn16Pb14 alloy.
The samples were weighed before and after immersion corrosion, and the corrosion rate was calculated via weight loss methods. The corrosion morphologies and corrosion products of the samples were analyzed via SEM, EDS, and XRD. The testing parameters of the X-ray diffractometer were as follows: step size, 0.11°; scanning speed, 4°/min; and scanning, angle 20°~90°.

3. Results and Discussion

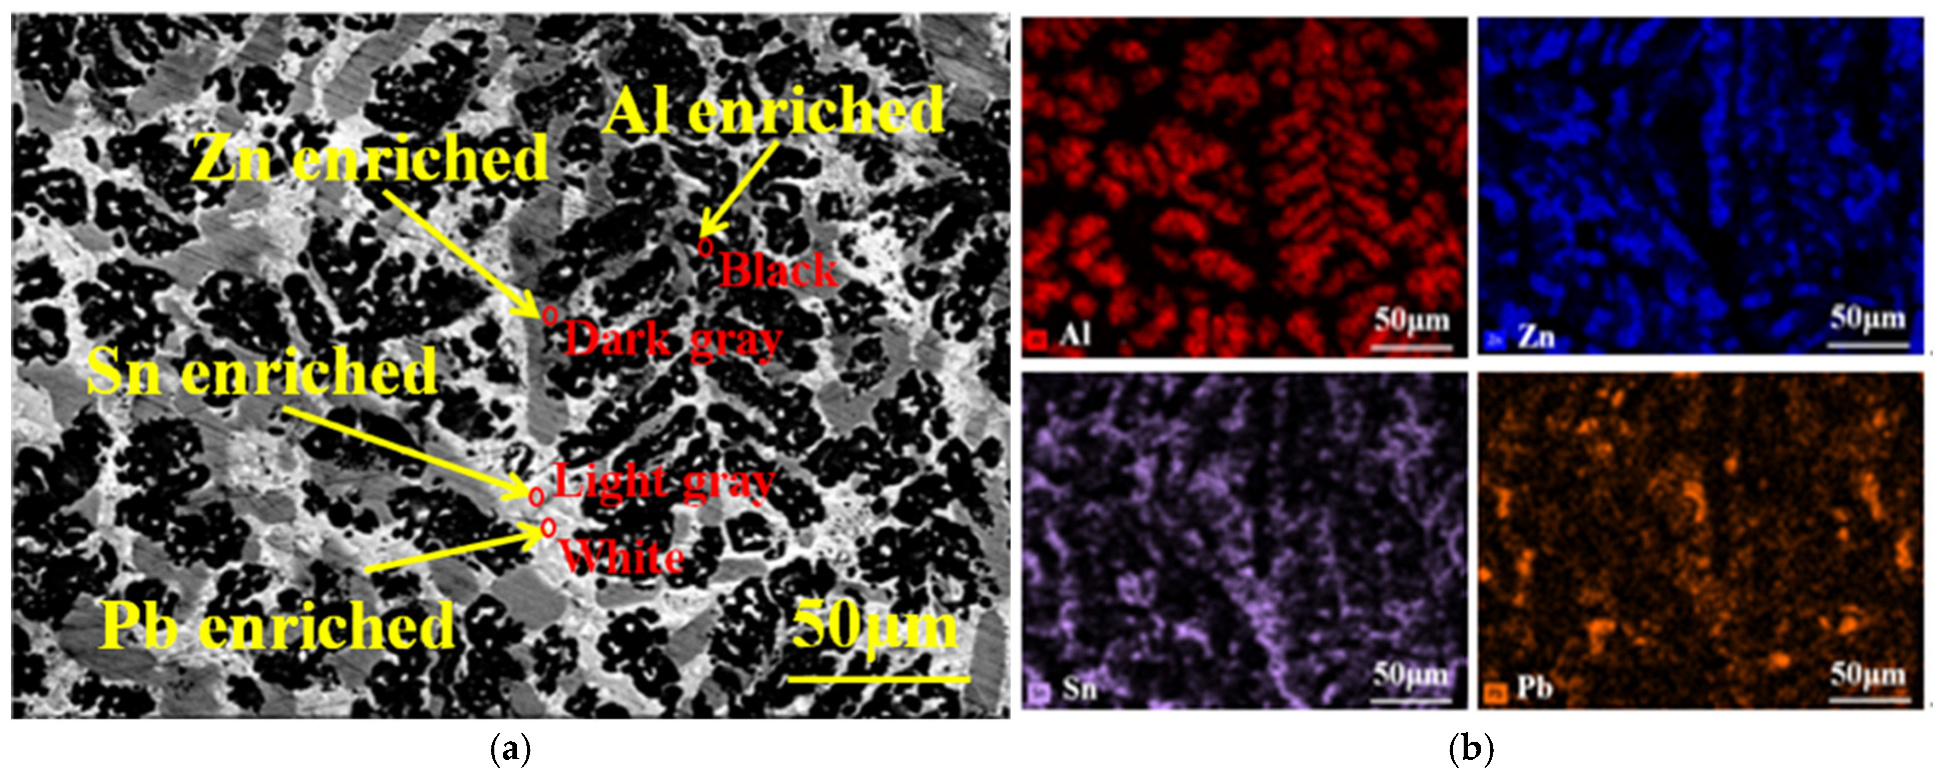
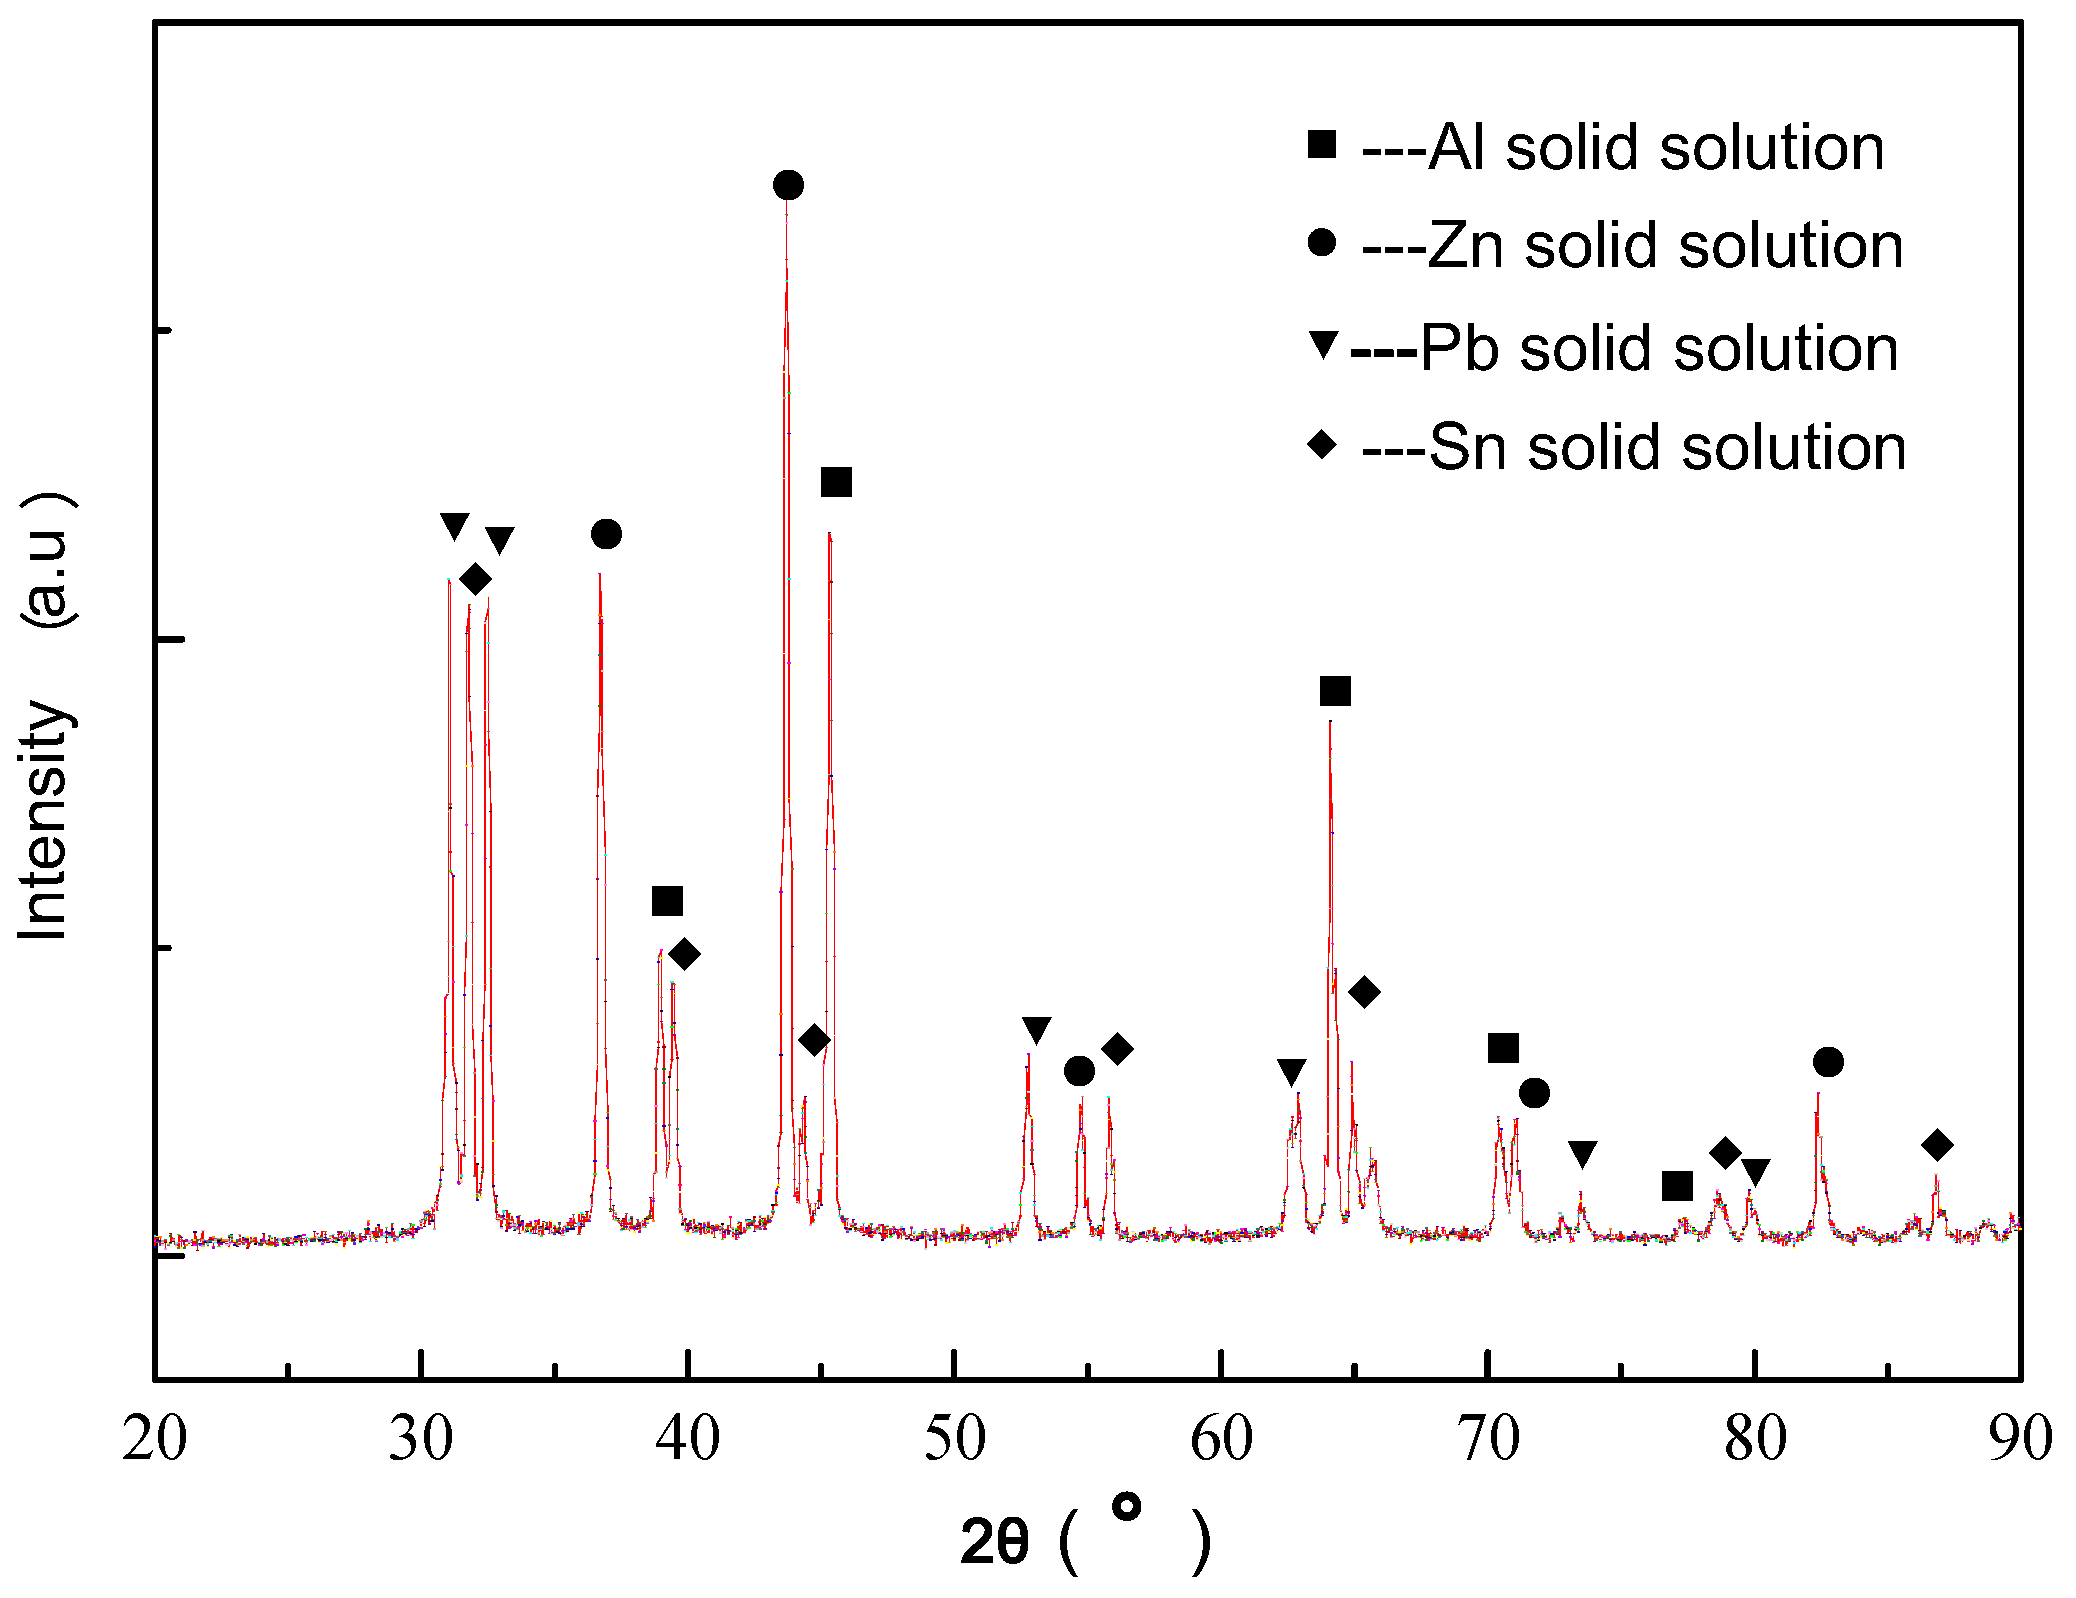
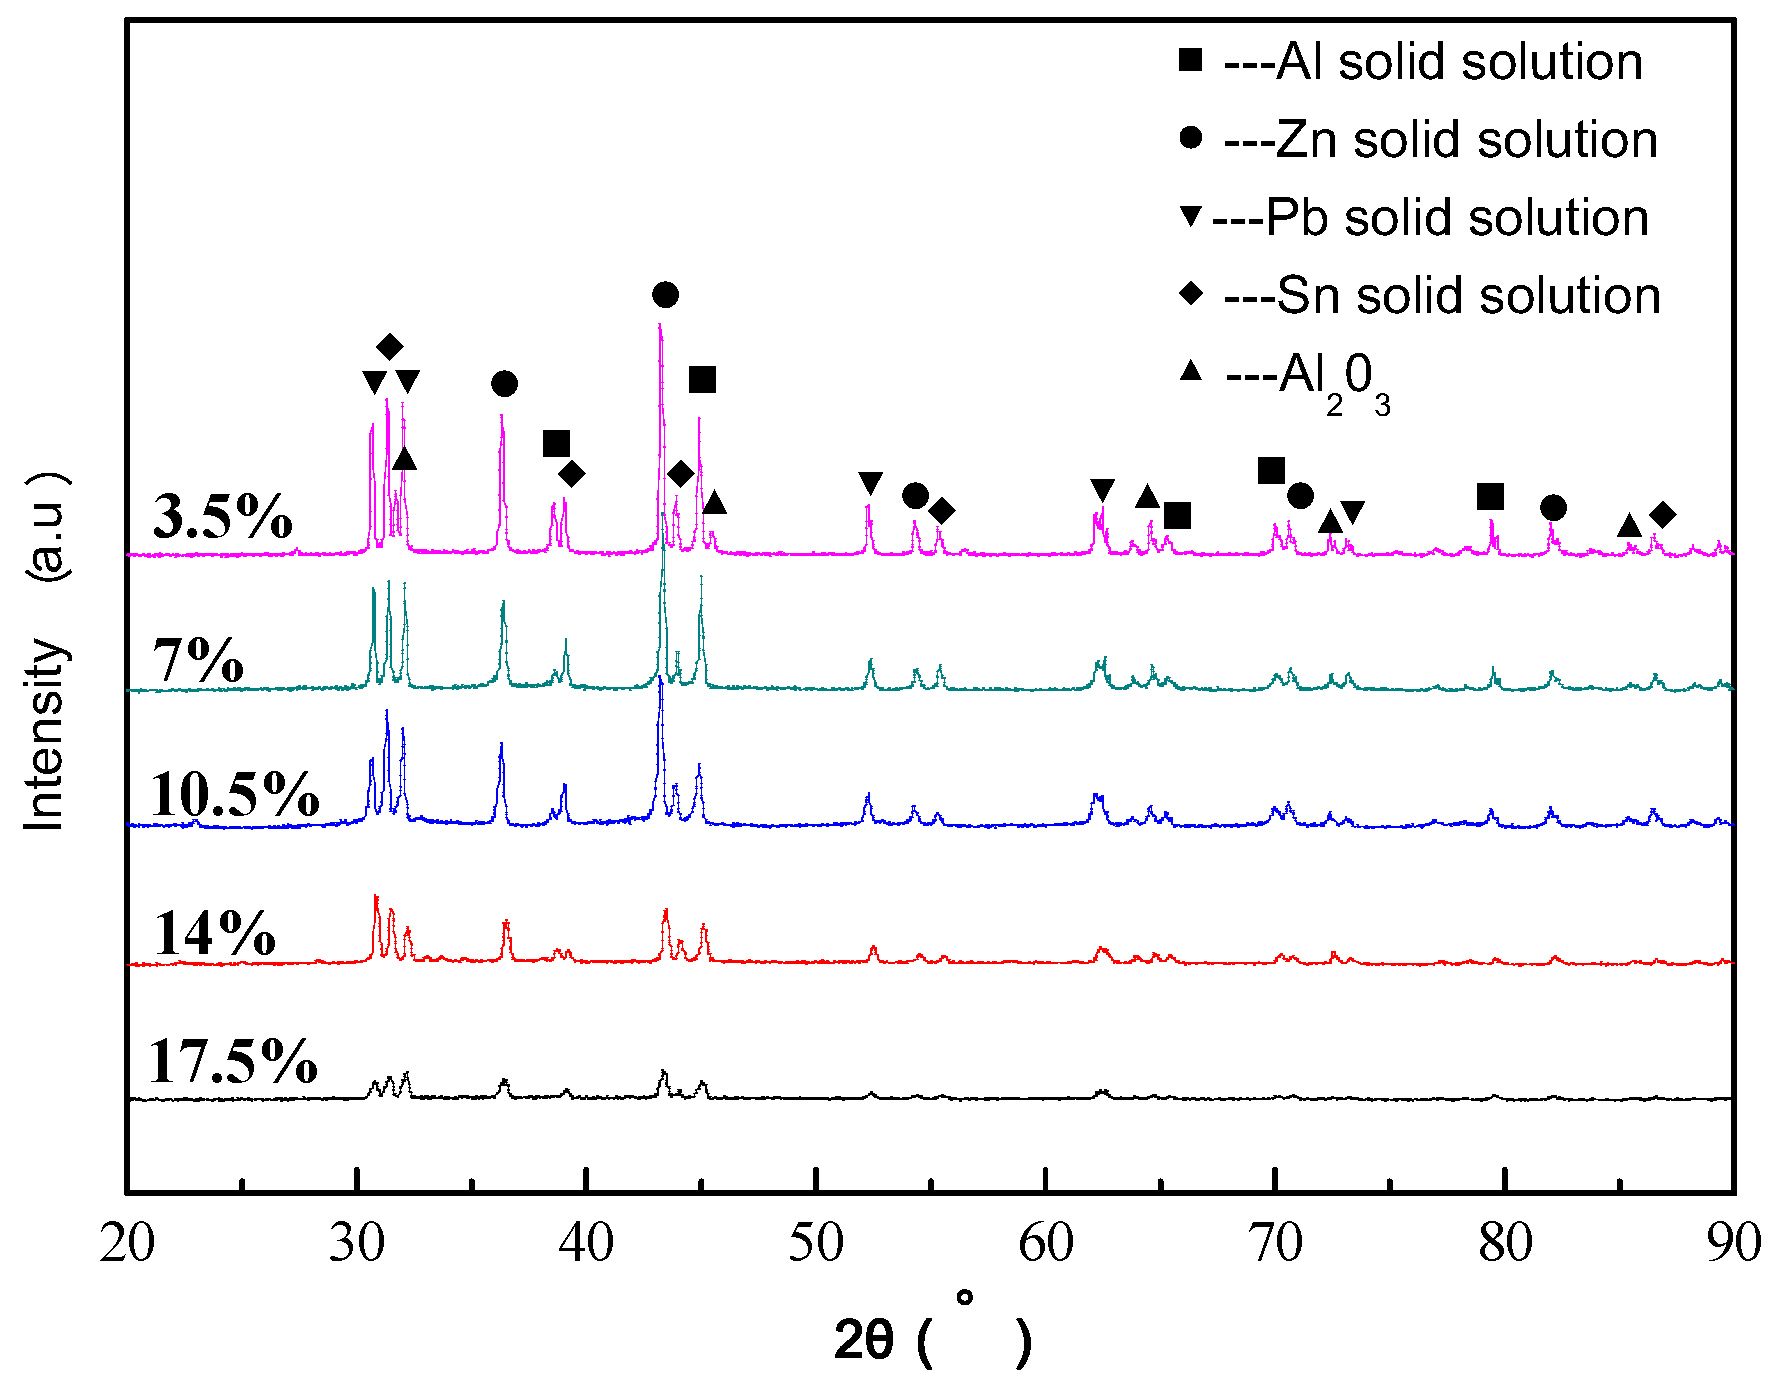
3.1. Microstructure and Phase

The microstructure of the Al49Sn21Zn16Pb14 alloy is shown in Figure 3. The microstructure of the Al49Sn21Zn16Pb14 alloy is shown in Figure 3a. The EDS area scanning results of the Al49Sn21Zn16Pb14 alloy are shown in Figure 3b, showing that the microstructure of the alloy contains the following phases: black, dark gray, light gray, and white. The black phase is the Al-rich phase, with the dark gray being the Zn-rich phase, the light gray the Sn-rich phase, and the white the Pb-rich phase. The dendrite structure mainly comprises the black (dendrites) and dark gray (interdendrites) phases. The eutectic structure or eutectoid structure mainly comprises the white and light gray phases, while the peritectic structure mainly comprises the dark gray and light gray phases. The microstructure of the Al49Sn21Zn16Pb14 alloy thus includes dendrite, eutectic or eutectoid, and peritectic structures. The Al-rich and Zn-rich structures are dendritic, with the Zn-rich phase distributed in the dendrites and the Al-rich phase distributed in the interdendrites. PbSn is a typical eutectic or eutectoid alloy; the Pb-rich phase is granular or lamellar, and the Pb- and Sn-rich phases are mainly eutectic or eutectoid in structure. The Sn- and Pb-rich structures also contain a residual Zn-rich phase, giving both a peritectic structure.
The EDS point analysis and area scan results of the Al49Sn21Zn16Pb14 alloy are shown in Table 1, which shows that the black phase is rich in Al, the dark gray phase is rich in Zn, the light gray phase is rich in Sn, and the white phase is rich in Pb. According to the EDS and SEM analysis results, the black phase is an Al-rich solid solution, the dark gray phase is a Zn-rich solid solution, the light gray phase is a Sn-rich solid solution, and the white phase is a Pb-rich solid solution. The dendrite structure mainly comprises an Al- and Zn-rich solid solution, in which the dendrites mainly represent a Zn-rich solid solution and the interdendrites a mainly an Al-rich solid solution; the eutectic structure mainly comprises Sn- and Pb-rich solid solutions; and the peritectic structure mainly comprises Zn- and Sn-rich solid solutions.
The XRD analysis results of the Al49Sn21Zn16Pb14 alloy are shown Figure 4, showing that Al, Zn, Sn, and Pb are all present in solid solution form with an FCC crystal structure. The composition phase of the Al49Sn21Zn16Pb14 alloy is therefore a solid solution with an FCC crystal structure.

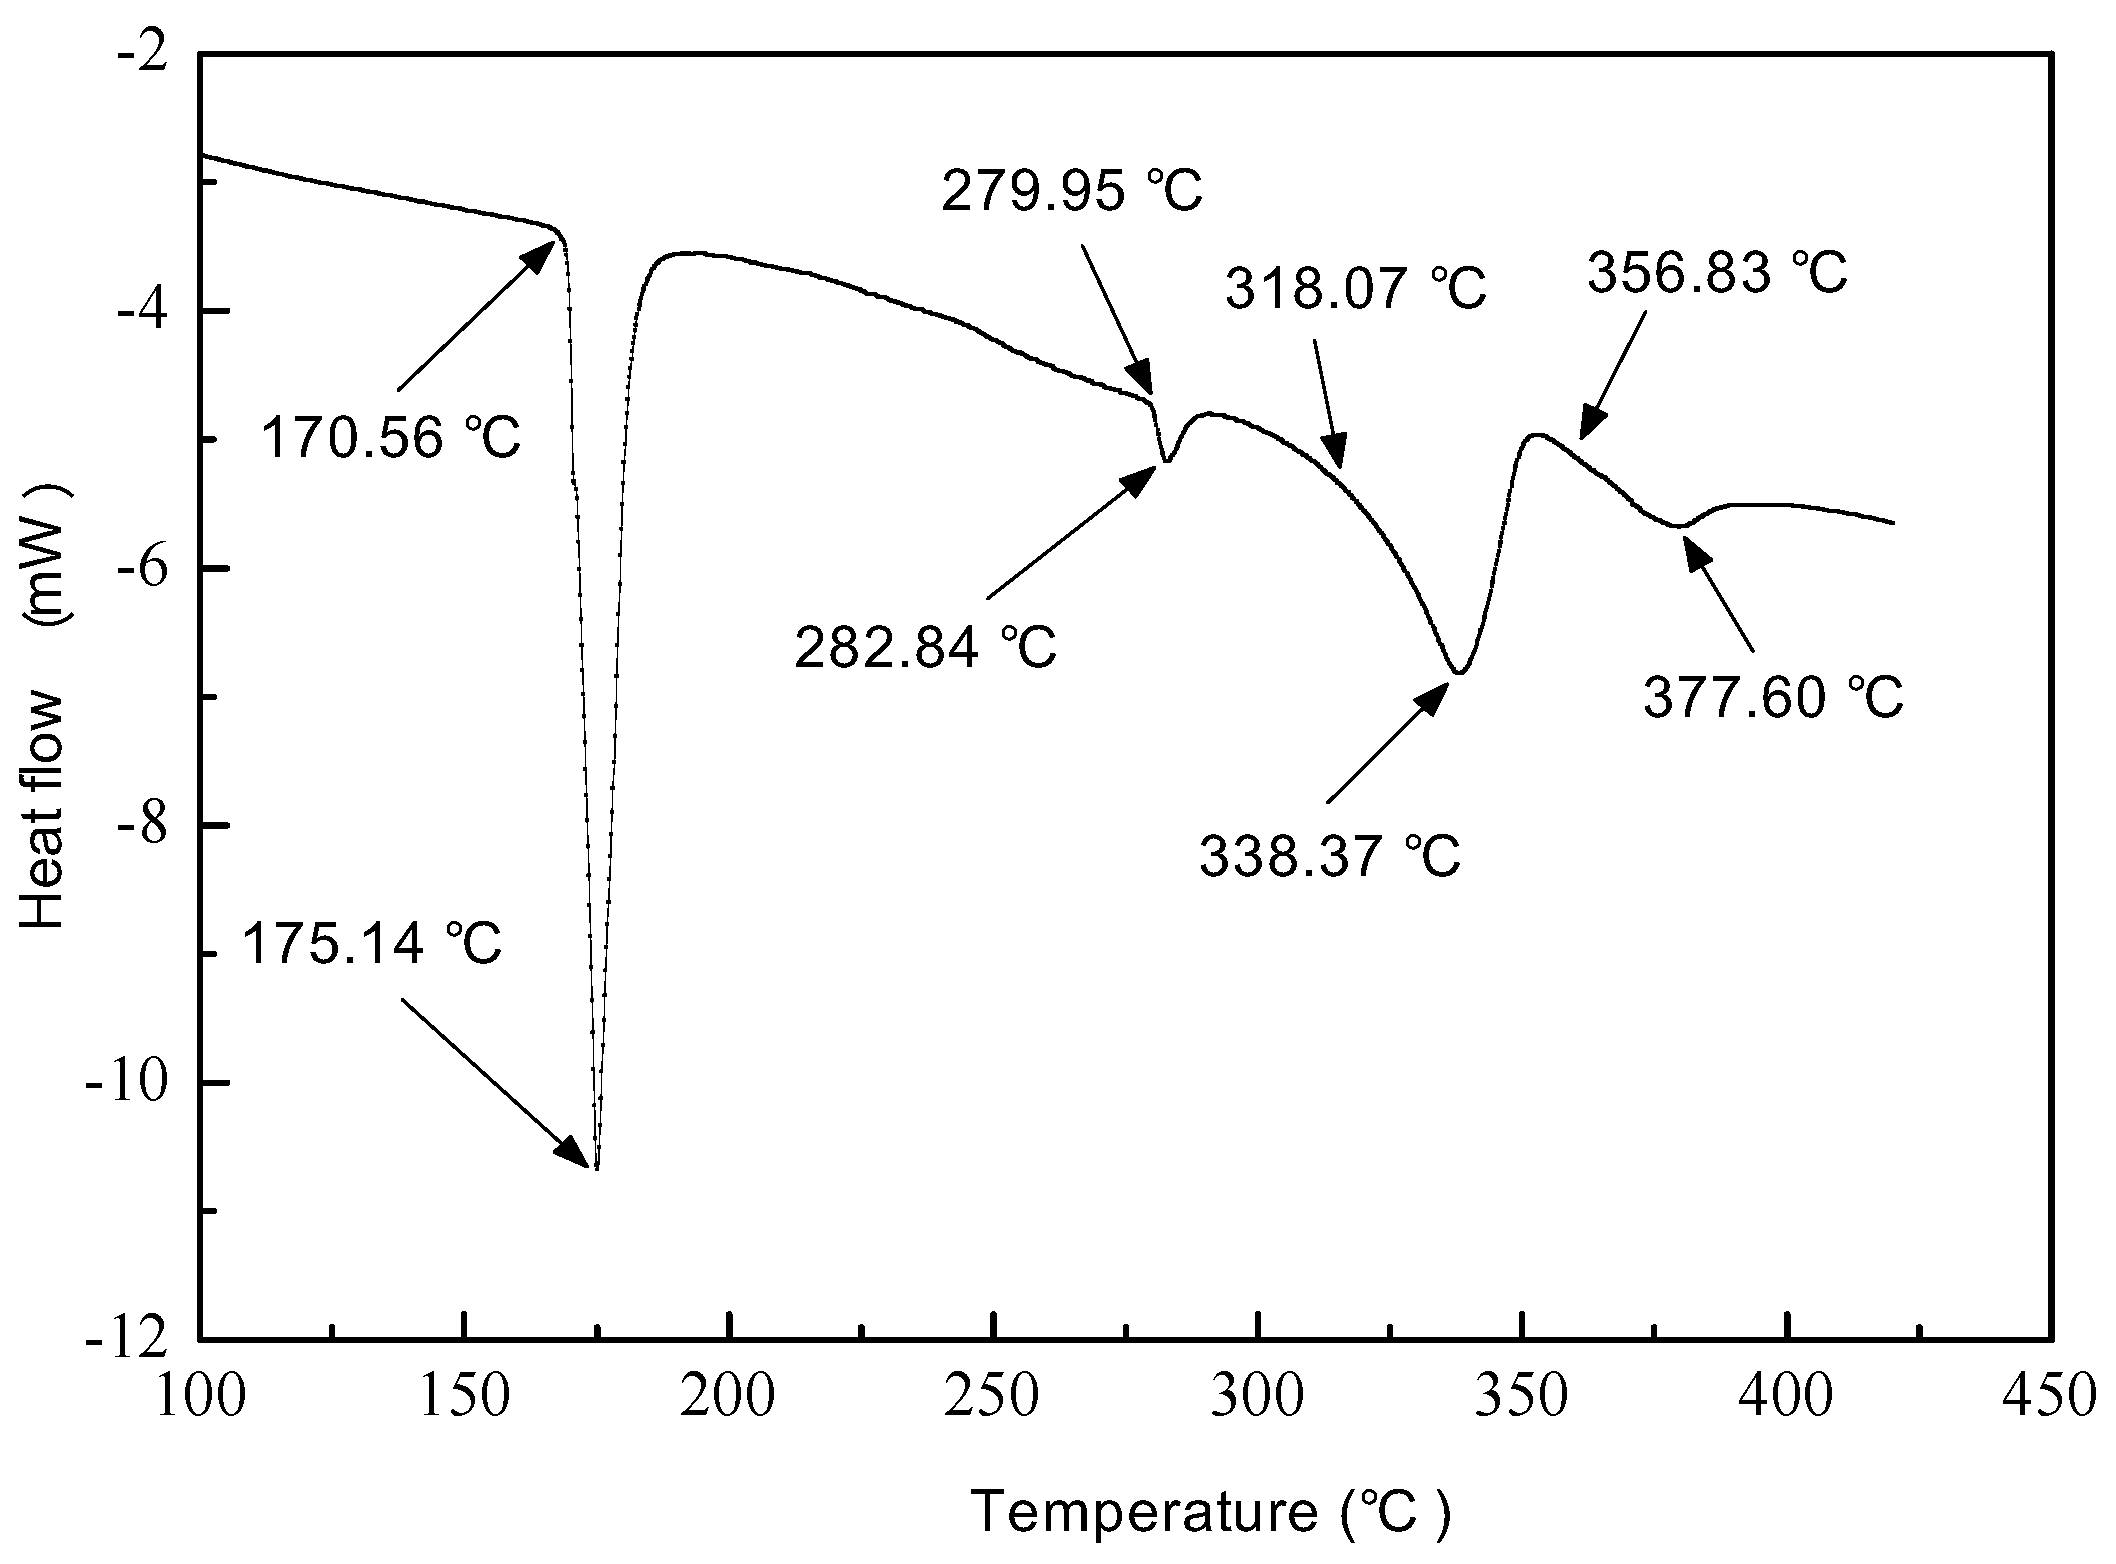
3.2. Melting Point Analysis

The DSC test results of the Al49Sn21Zn16Pb14 alloys are shown in Figure 5, showing that there are four endothermic peaks. The results of the analysis also show that the microstructure of the alloy is mainly eutectoid, peritectic, and dendritic. As shown, combined with the microstructure analysis, the eutectoid transition temperature of the alloy is 175 °C, and the eutectoid structure is formed. The precipitation temperature of the secondary phase is 282 °C. The peritectic transition temperature is 338 °C, thus forming the peritectic structure. The uniform crystal transition temperature range is 357~377 °C; that is, the liquid and solid phases coexist, forming a dendrite structure. When the temperature is higher than 357 °C, the alloy begins to melt, and when the temperature is higher than 377 °C, the alloy is completely transformed into a liquid state. It can be seen from the DSC test results that the melting point of the Al49Sn21Zn16Pb14 alloy is only 356.8 °C, and the melting temperature range is 356.83~377.60 °C; that is, the liquid phase point is 377.60 °C, and the solid phase point is 356.83 °C. PbSn is a eutectic alloy with a melting point of 187.3 °C and good corrosion resistance. On the one hand, adding Zn to the aluminum alloy can improve its corrosion resistance; on the other hand, the melting point of the aluminum alloy can be reduced. Adding Zn, Sn, and Pb elements to aluminum alloys can therefore effectively reduce the melting point.

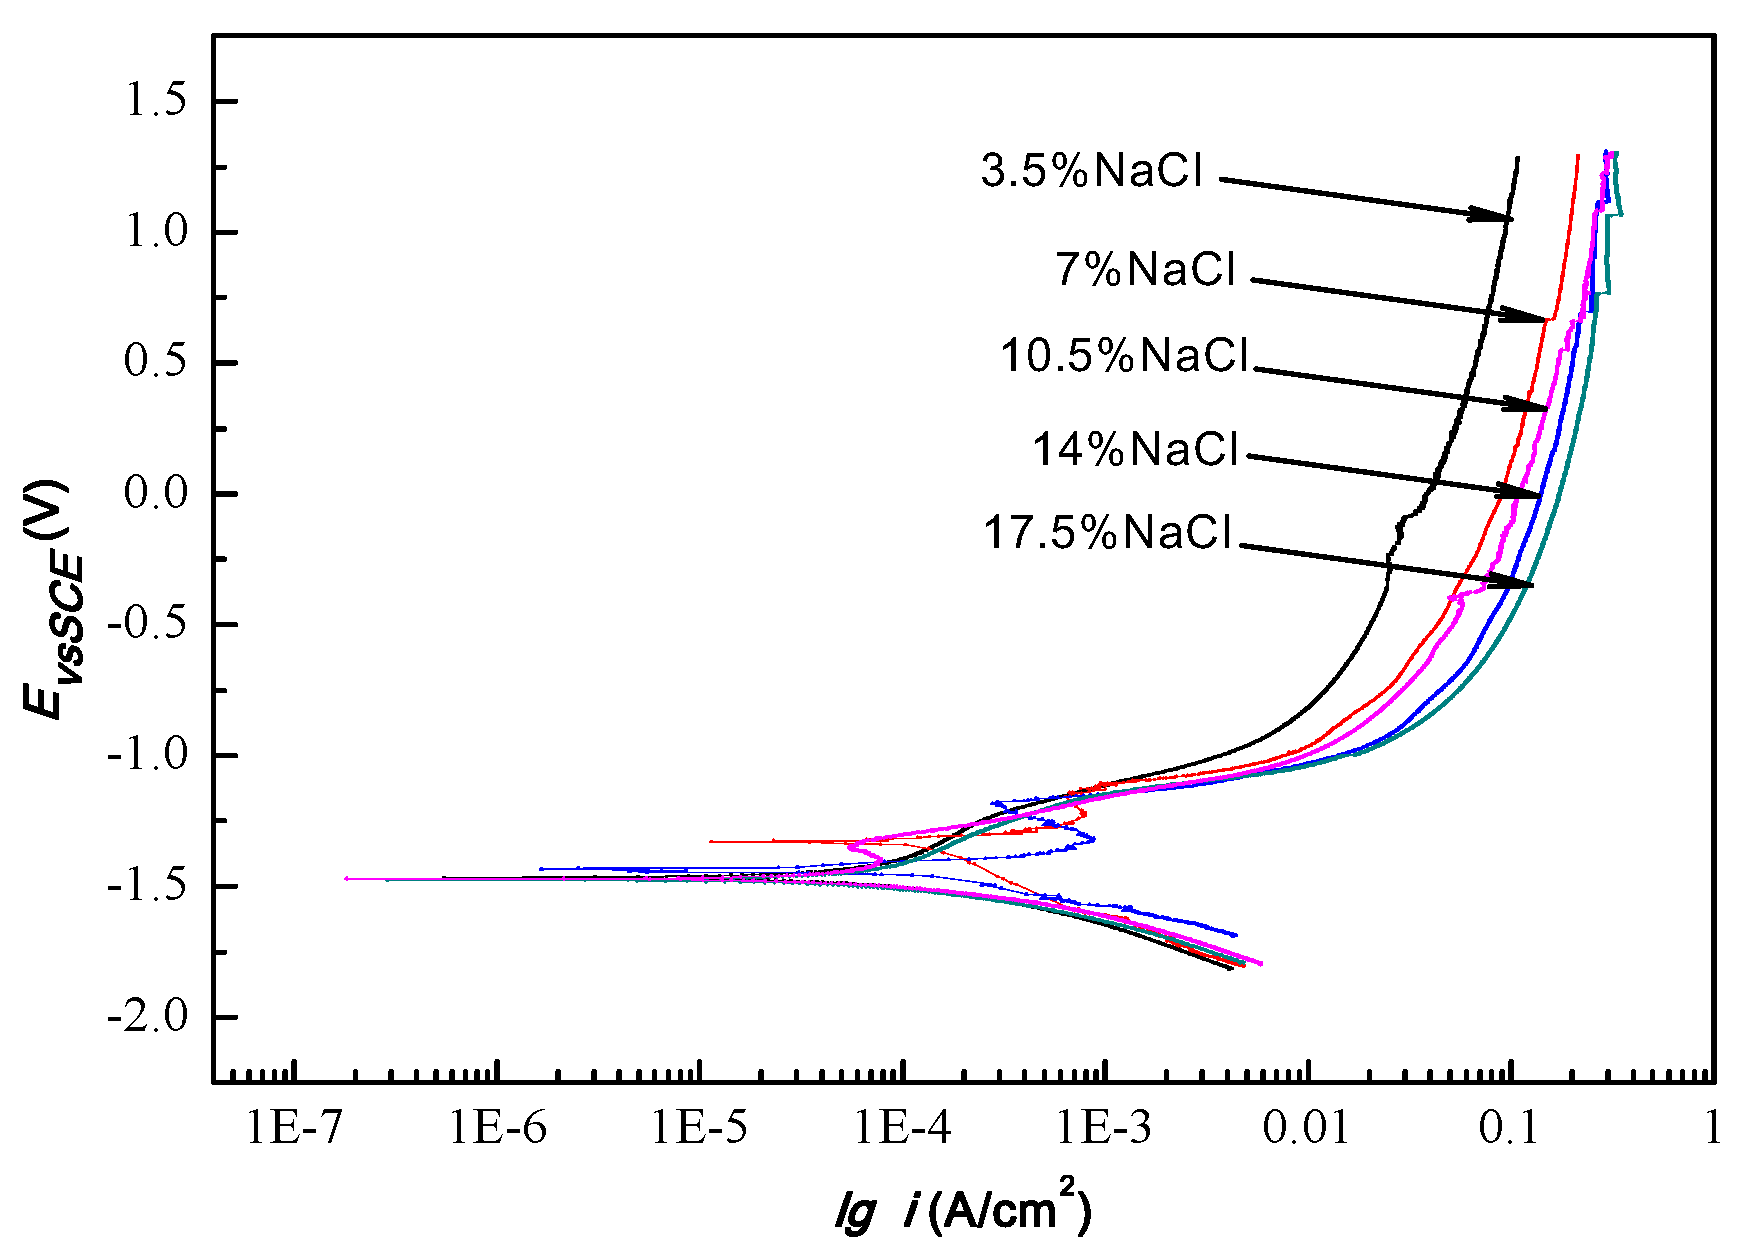
3.3. Potentiodynamic Polarization

The polarization curves of the Al49Sn21Zn16Pb14 alloy were measured via voltammetry in NaCl solutions of different concentrations (Figure 6). As shown, the potential is higher in the 3.5% NaCl solution, and with increases in the NaCl solution’s concentration, the potential decreases, and when the concentration of the NaCl solution is changed from 7% to 17.5%, the change in the potential is not obvious. The initial potential of the anode and cathode is the equilibrium potential of the cathode reaction and the anode reaction, which intersect at a point on the polarization curve, and the corresponding potential is the mixed potential. The anode and cathode reaction constitutes the corrosion process; therefore, this mixed potential is called the self-corrosion potential (Ecorr), and the corresponding corrosion current is called the self-corrosion current (Icorr). The electrochemical characteristics of the Al49Sn21Zn16Pb14 alloy in different concentrations of NaCl solutions are shown in Table 2. As shown, when the concentration of the NaCl solution is 3.5%, the polarization curve does not show the passivation phenomenon. When the concentration of the NaCl solution is 7%, 10.5%, and 14%, the polarization curves show the passivation phenomenon, and the passivation potential ranges are −1.27~−1.13 V, −1.18~−1.33 V, and −1.35~−1.40 V, respectively. With an increase in the NaCl solution’s concentration, the passivation potential ranges decreases. When the concentration of the NaCl solution is 17.5%, the polarization curve does not show the passivation phenomenon. From the perspective of self-corrosion current density, when the concentration of the NaCl solution increases from 3.5% to 14%, the self-corrosion current density of the alloy increases slightly, but the degree of increase is small, and the change in the self-corrosion current density is not obvious. In the 17.5% NaCl solution, the self-corrosion current density increases significantly. Based on the passivation phenomenon analysis and the trend in self-corrosion current density with the change in concentration of the NaCl solution, it can thus be seen that the passivation phenomenon of the Al49Sn21Zn16Pb14 alloy can reduce the corrosion current density in the concentration range of 7% to 14.5%. The test results show that with the increase in the NaCl solution’s concentration, the corrosion tendency of the Al49Sn21Zn16Pb14 alloy increases. The Al49Sn21Zn16Pb14 alloy has passivation characteristics in 7%, 10.5%, and 14% NaCl solutions, but the passivation interval is small, the tendency to form a stable passivation film is low, and the protection of the passivation film on the matrix is weak.

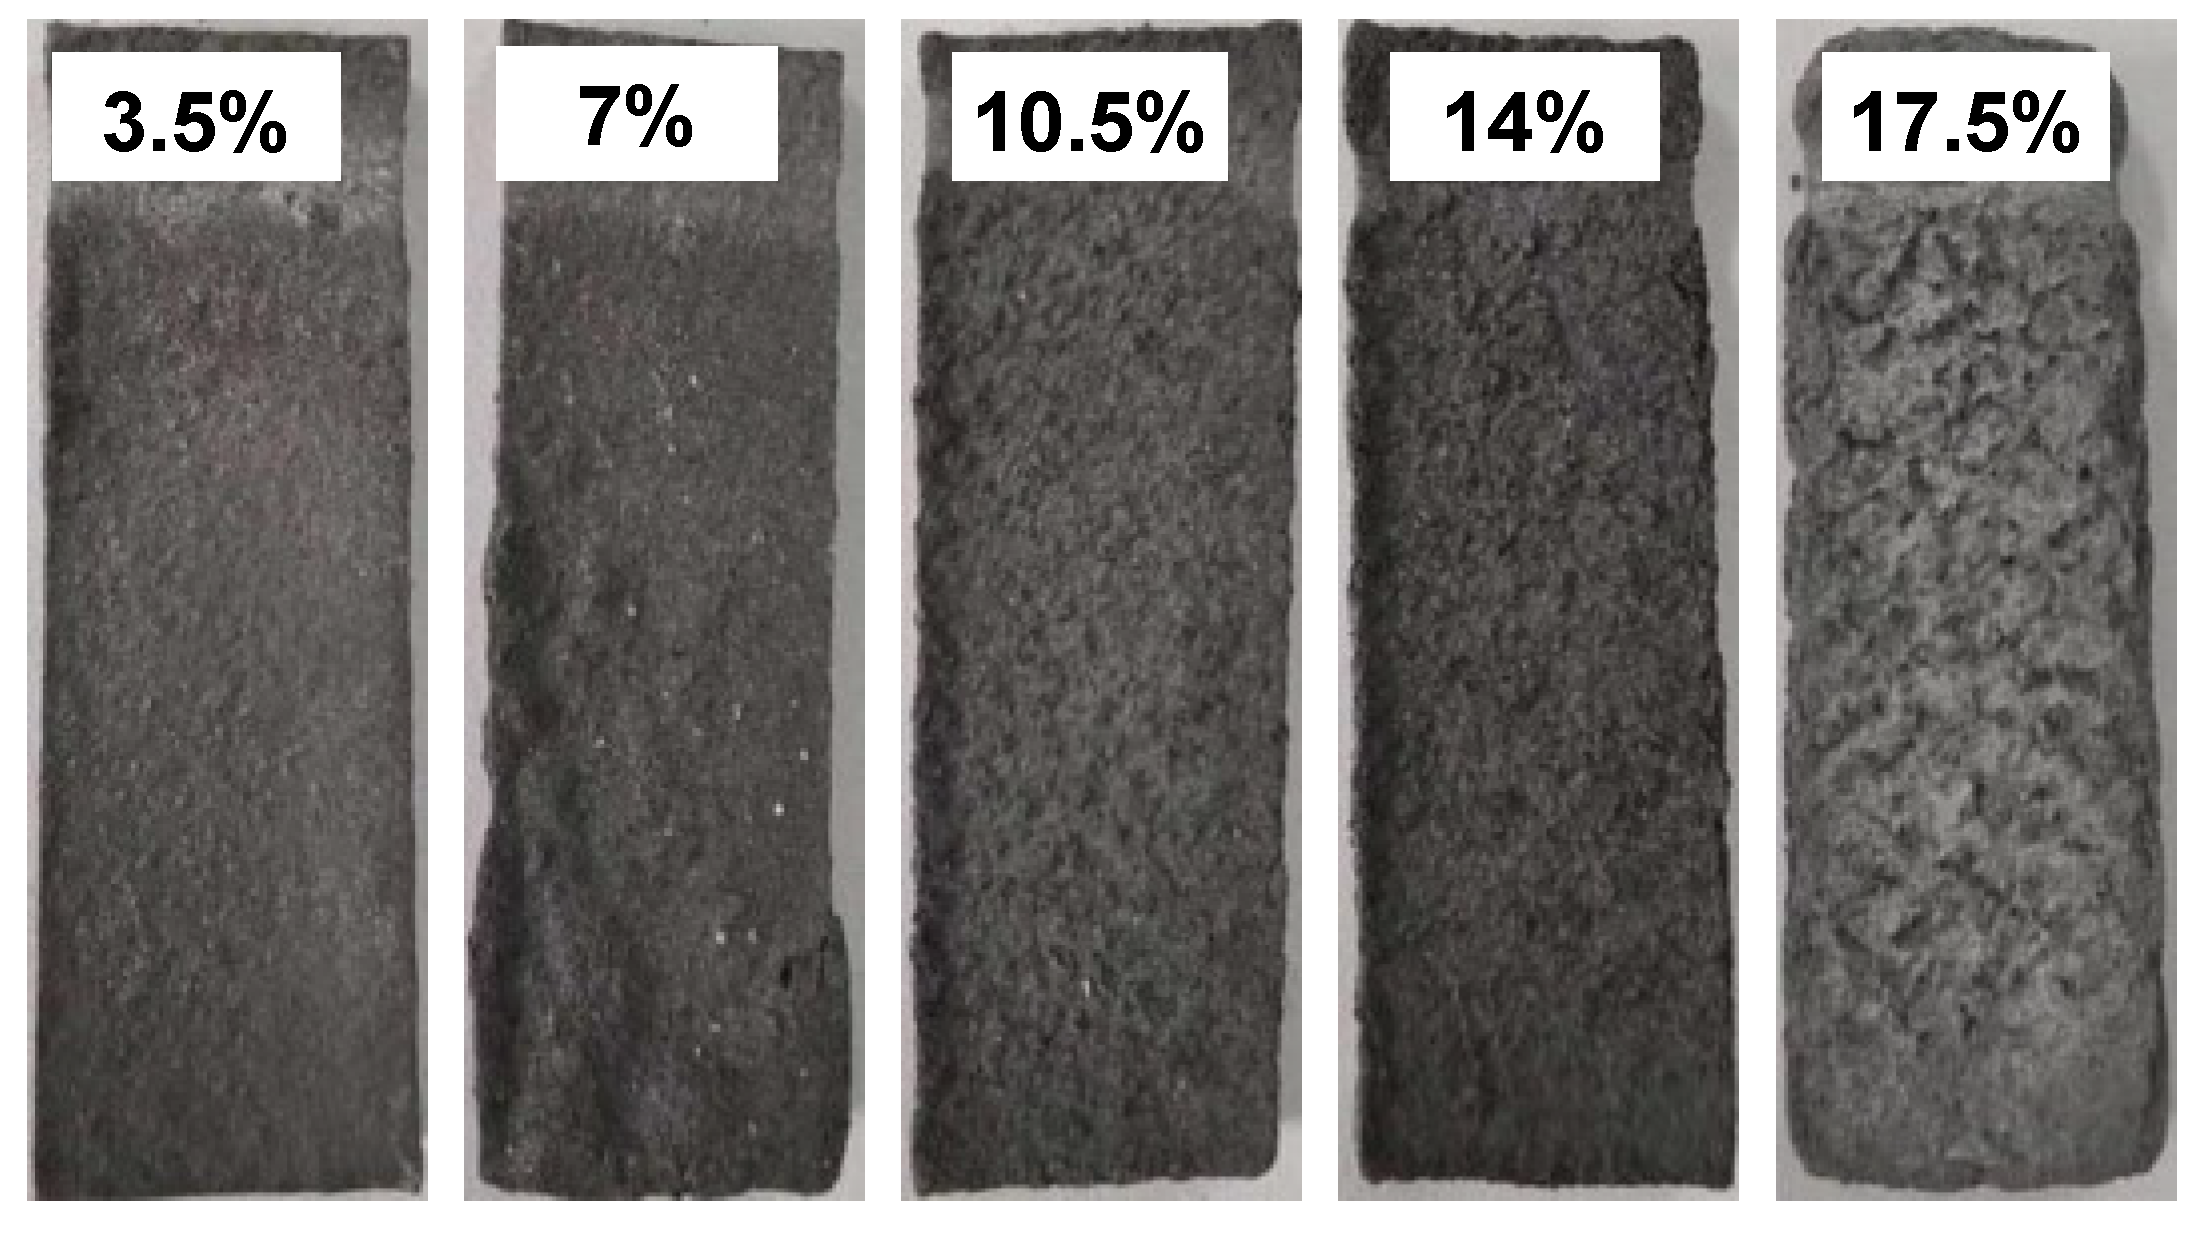
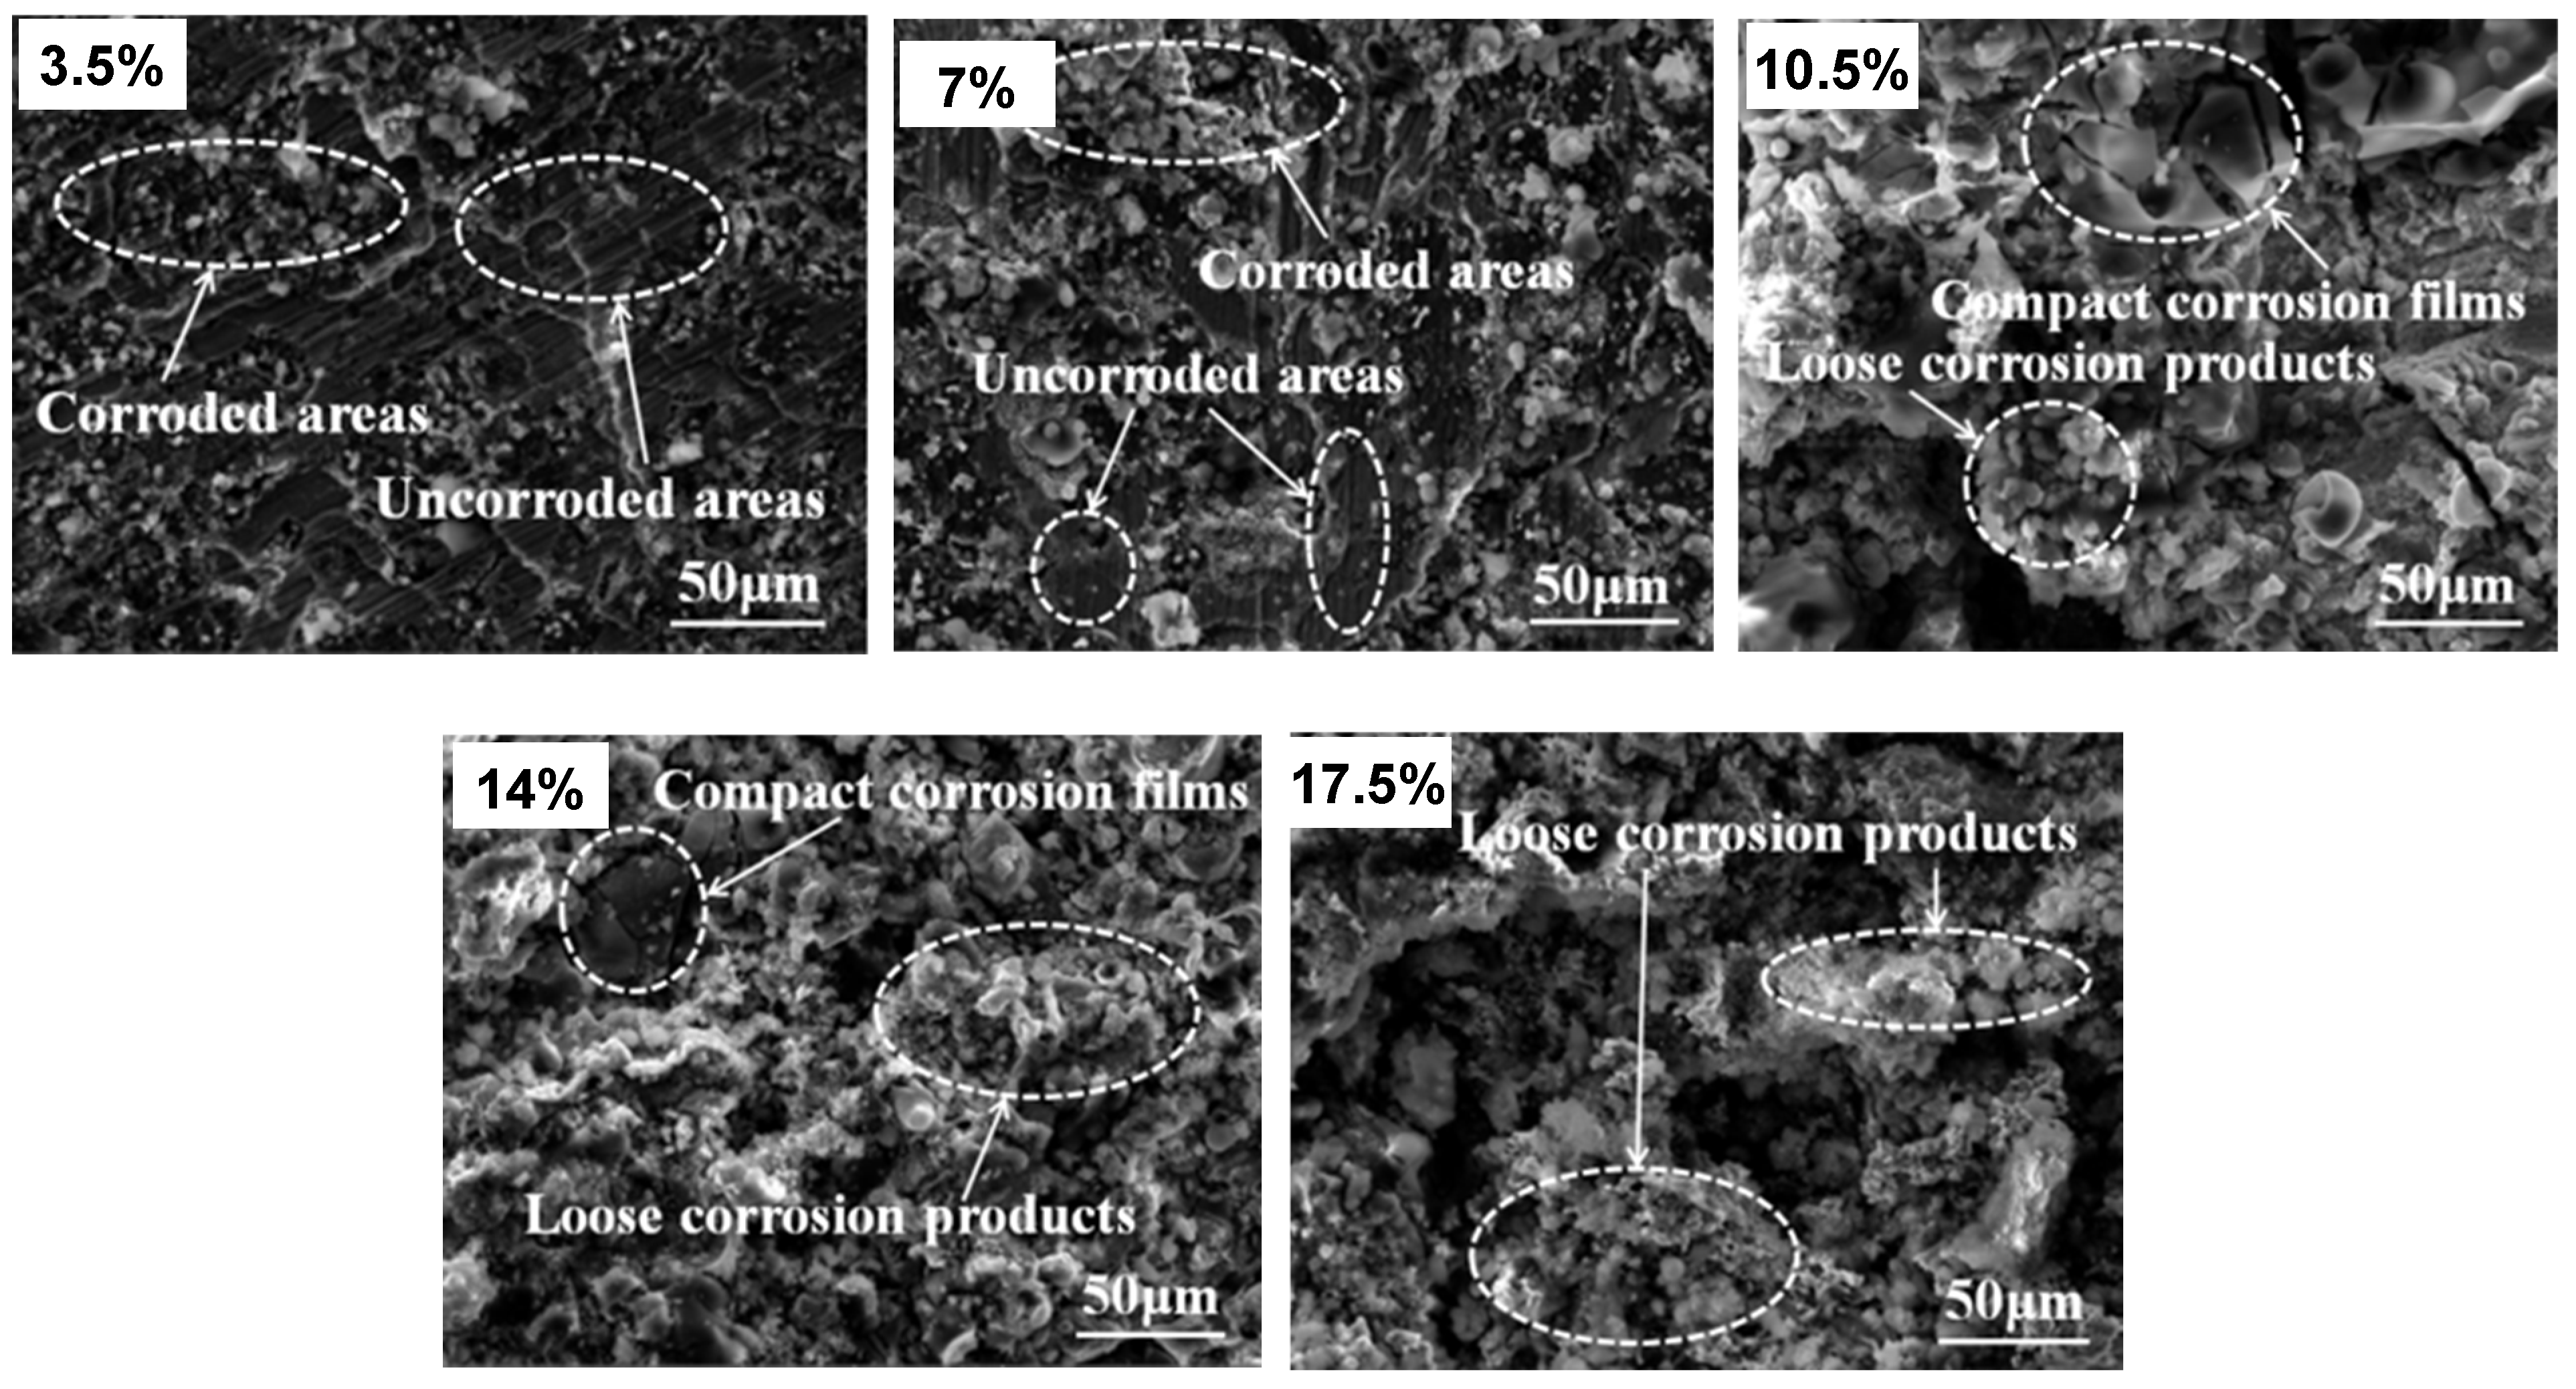
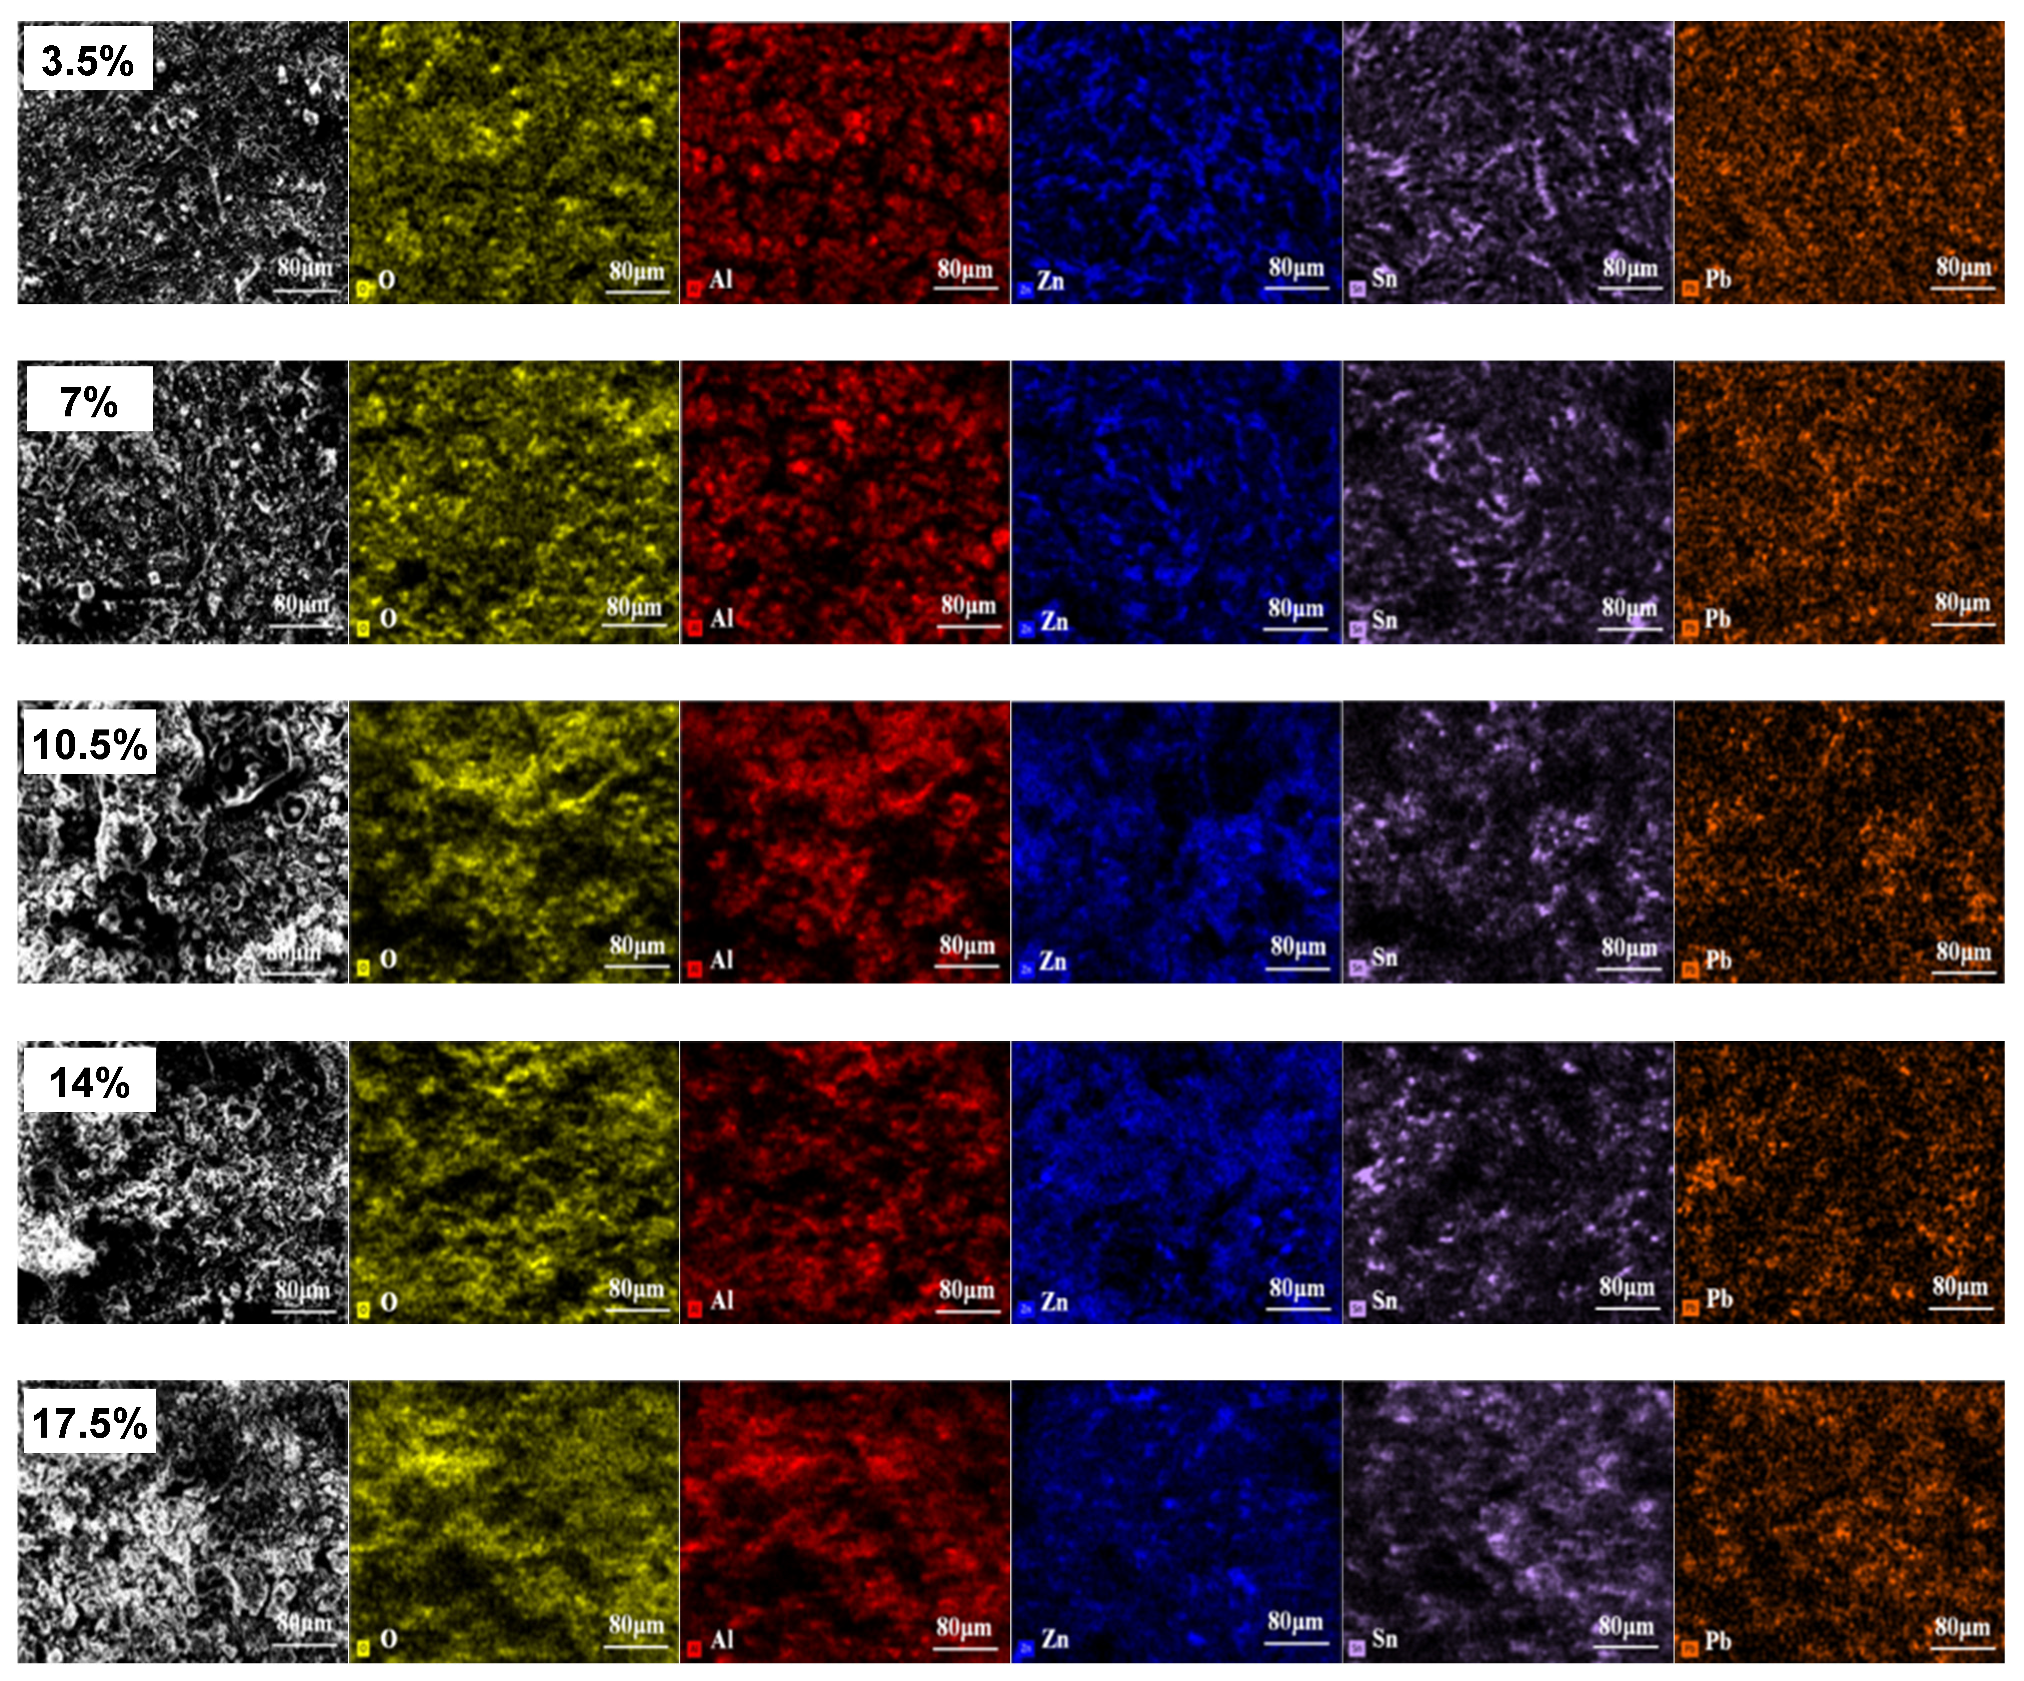
3.4. Immersion Corrosion Morphologies
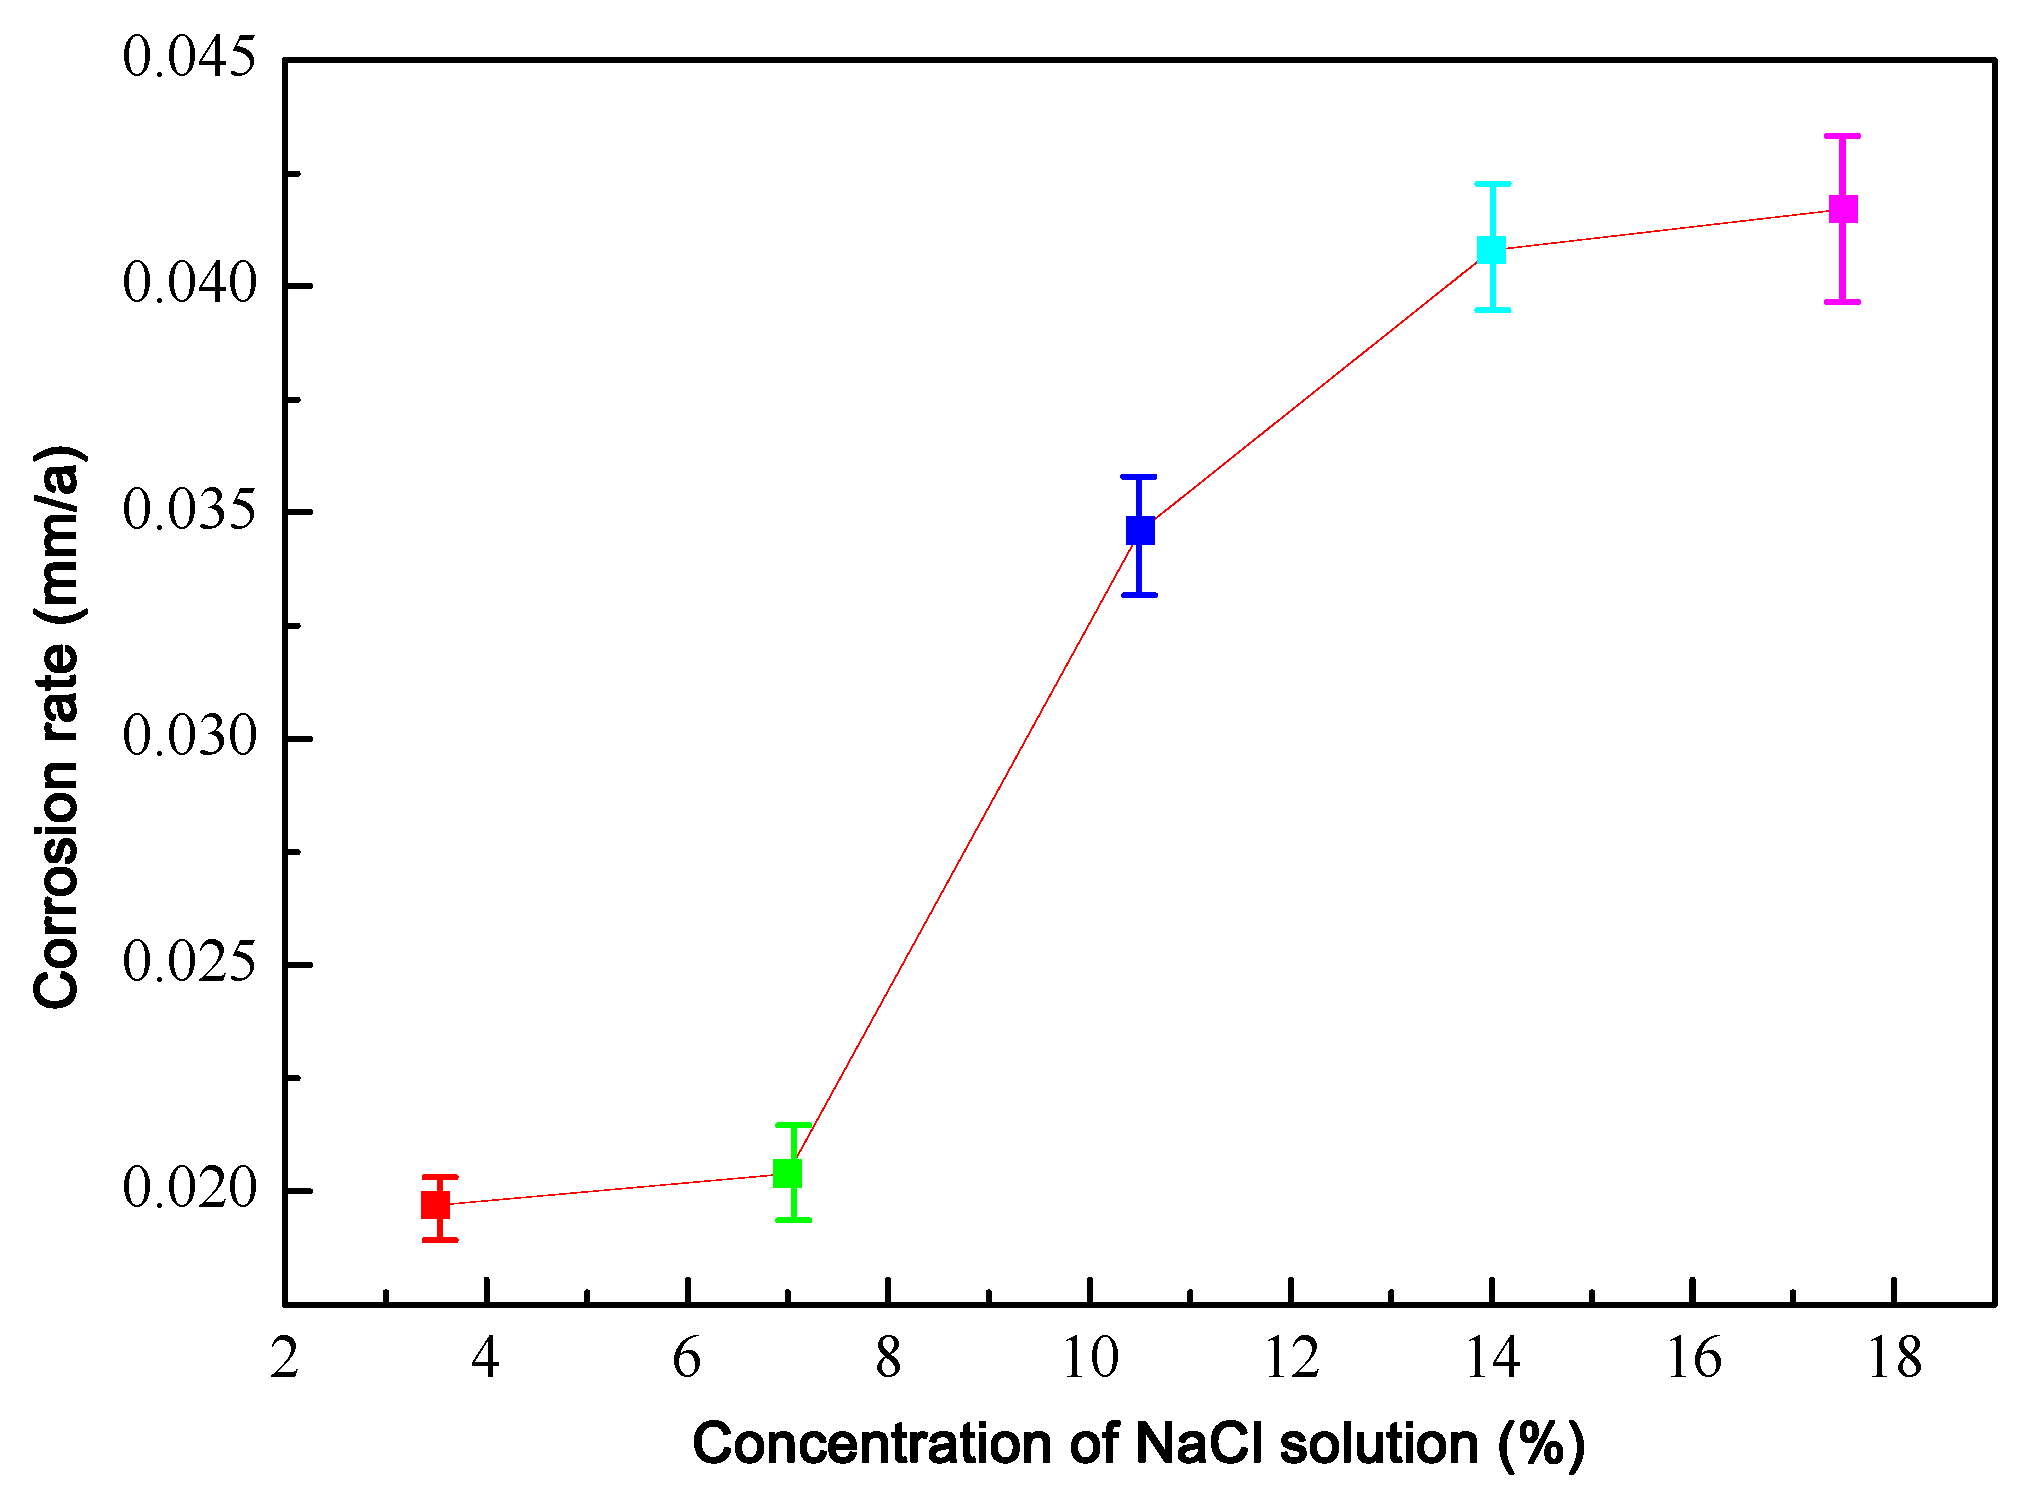
The macroscopic morphologies of the Al49Sn21Zn16Pb14 alloy after immersion corrosion in NaCl solutions with different concentrations are shown in Figure 7. As shown, when the sample is immersed in the 3.5% NaCl solution, the surface of the sample is dense, and there is no obvious change. When the sample is immersed in the 7% NaCl solution, the surface of the sample is still dense, but the local area of the surface exhibits bulges. When the sample is immersed in 10.5% NaCl solution, serried micro-pores appear on the surface of the sample. When the sample is immersed in the 14% NaCl solution, serried pores on the sample surface increase slightly, and the corrosion degree of the sample is aggravated. When the sample is immersed in 17.5% NaCl solution, the surface of the sample exhibits scaly morphologies, and the corrosion degree of the sample is aggravated further. In NaCl solutions with different concentrations, the samples lose metallic luster and show general corrosion. With increases in the NaCl solution’s concentration, the corrosion degree of the Al49Sn21Zn16Pb14 alloy increases.
The surface morphologies of the Al49Sn21Zn16Pb14 alloy after corrosion in NaCl solutions with different concentrations are shown in Figure 8. As shown, when the sample is immersed in a corrosion solution with 3.5% NaCl, corroded and non-corroded areas appear on the sample, with the proportion of non-corroded areas being larger than the proportion of corroded areas. The corrosion surface of the sample is relatively loose, and the small amount of corrosion products are attached on the corrosion area of the sample, the corrosion degree of the sample is relatively light. When the sample is immersed for corrosion in the 7% NaCl solution, there is a small uncorroded area on the sample, and the area with a low degree of corrosion increases, the attached amount of corrosion products increases, and the degree of corrosion is aggravated. When the sample is immersed in the 10.5% NaCl solution for corrosion, the surfaces of the samples are all corroded. The corroded surfaces of the samples are locally loose and locally dense, and the proportion of the dense area is larger than that of the loose area. The loose corrosion products are granular, and the dense corrosion film exhibits the cracking phenomenon. The corrosion degree continues to increase. When the sample is immersed in 14% NaCl solution for corrosion, there is still a dense corrosion film on the sample, but the proportion of dense areas reduces significantly. Most of the dense corrosion products are clumpy or flocculent loose corrosion products. The dense corrosion film also exhibits the cracking phenomenon, and the corrosion degree is further aggravated. When the sample is immersed for corrosion in 17.5% NaCl solution, the surface of the sample is made up of loose corrosion products, which are flaky or flocculent and fall off to form corrosion pits, and the degree of corrosion is seriously elevated. With an increase in the NaCl solution’s concentration, the corrosion degree of the Al49Sn21Zn16Pb14 alloy increases, the morphologies of corrosion products change gradually from smaller particles or larger particles to flocculent and lamellar particles, and the area of surfaces with a loose degree of corrosion increases. In 10.5% and 14% NaCl solutions, a locally dense corrosion product film forms on the surface of the Al49Sn21Zn16Pb14 alloy, but the corrosion product films exhibits the cracking phenomenon, which cannot protect the matrix. The local dense corrosion products formed via the corrosion of the Al49Sn21Zn16Pb14 alloy in NaCl solution therefore do not improve the corrosion resistance.

3.5. Corrosion Rate

The weight loss method was used to calculate the corrosion rate of corroded samples. The corrosion rates of the Al49Sn21Zn16Pb14 alloy in the 3.5%, 7%, 10.5%, 14%, and 17.5% NaCl solutions were 1.97 × 10⁻² mm/a, 2.04 × 10⁻² mm/a, 3.46 × 10⁻² mm/a, 4.08 × 10⁻² mm/a, and 4.17 × 10⁻² mm/a, respectively. The corrosion rate of the Al49Sn21Zn16Pb14 alloy changes with the NaCl solution’s concentration, as shown in Figure 9. With the increase in the NaCl solution’s concentration, the corrosion rate of the Al49Sn21Zn16Pb14 alloy increases, and when the NaCl solution’s concentration is greater than 7%, the corrosion rate increases significantly. Combined with the analysis results of the corrosion morphologies, when the NaCl solution’s concentration is greater than 7%, the degree of overall corrosion increases, the corrosion products in the loose corrosion area fall off or dissolve, and the corrosion products in the dense corrosion area crack and fall off, all of which cause the corrosion rate to increase.

3.6. Corrosion Products

The XRD analysis results of the Al49Sn21Zn16Pb14 alloy after being immersed in NaCl solutions with different concentration are shown in Figure 10. As shown, Al, Zn, Pb, and Sn are all the primary constituent elements forming the solid solubility of the Al49Sn21Zn16Pb14 alloy. Only the Al2O3 peak of the Al oxide phase appeared, while the peaks of Zn, Sn, and Pb oxides or related compounds did not appear. Compared to the XRD analysis results of the as-cast Al49Sn21Zn16Pb14 alloy, it is found that the position of the diffraction peak phase angle does not change before or after immersion corrosion, but the intensity of the diffraction peak does change, which indicates that the contents of the component elements of the Al49Sn21Zn16Pb14 alloy change after immersion corrosion. It can be seen from the surface morphologies of the sample after immersion corrosion that corrosion obviously occurs on the Al49Sn21Zn16Pb14 alloy, and the XRD pattern does not show the diffraction peak of the corrosion products, which may be due to the dissolution or fall-off of the corrosion products, and too few corrosion products are attached to the surface of the sample. The XRD test results thus only detected Al2O3 corrosion products, while the other corrosion products were not detected.
The EDS surface scanning analysis results of corrosion products after immersing the Al49Sn21Zn16Pb14 alloy in NaCl solutions with different concentrations are shown in Figure 11. As shown, in addition to the alloying elements Al, Zn, Sn, and Pb, there are O elements on the sample after immersion corrosion, indicating that the Al49Sn21Zn16Pb14 alloy surface is oxidized, and oxygen elements and alloying element are evenly distributed, which indicates that uniform corrosion occurs on the sample of the Al49Sn21Zn16Pb14 alloy. The microscopic morphologies of the corrosion surface show that the corrosion products mainly comprise white, gray, and black phases. According to the EDS surface scanning results, among them, the white phase is rich in O and Al, the gray phase is rich in O and Zn, and the black area is relatively rich in Sn and Pb, while the content of O, Al, and Zn is relatively low. This shows that the white corrosion products are mainly Al oxides and the gray corrosion products are mainly Zn oxides; the black area represents the pores formed when the corrosion products fall off. To further analyze the corrosion products, an EDS point analysis was performed on the corrosion products after the Al49Sn21Zn16Pb14 alloy was immersed in NaCl solutions with different concentrations (see results in Table 3). As shown, the content of O and Al elements in white corrosion products is relatively high, while the content of Zn, Sn, and Pb elements is relatively low, and the content of O and Zn elements in gray corrosion products is relatively high, while the content of Al, Sn, and Pb elements is relatively low; this also indicates that the white corrosion products are mainly Al oxides, and the gray corrosion products are mainly Zn oxides. With an increase in the NaCl solution’s concentration, the amount of white corrosion products relatively increases, while the amount of gray corrosion products relatively decreases, and the proportion of black area decreases. This indicates that with an increase in the NaCl solution’s concentration, the Al oxides in the corrosion products of the Al49Sn21Zn16Pb14 alloy increase, and the pores formed by the corrosion products falling off increase.
From the above analysis, the morphology on the SEM images indicates the presence of corrosion products, and the EDS mapping confirms the presence of oxygen in them compared to the XRD analysis results of the as-cast Al49Sn21Zn16Pb14 alloy, which indicates that the component elements content of the Al49Sn21Zn16Pb14 alloy change after immersion corrosion. By combining the SEM, EDS, and XRD analysis results, we can thus infer the composition of the corrosion products. The EDS analysis showed that the content of Pb and Sn in the corrosion products was small, thus indicating that the corrosion products fell off or were dissolved. The SEM morphology also shows the pores, which can illustrate this view. The EDS analysis results show that the content of Al, Zn, and O in the corrosion products is high, which indicates the presence of Al or Zn oxides in the corrosion products.
It can be seen from the corrosion morphologies that the corrosion products are loose and dense. According to the element distribution analysis, the dense corrosion products are Al oxides, and the loose corrosion products are Zn, Pb, or Sn oxides. In summary, the Al-rich region of the Al49Sn21Zn16Pb14 alloy forms a dense corrosion film, while the Zn-, Pb-, and Sn-rich regions of the Al49Sn21Zn16Pb14 alloy form loose corrosion products, which flake off or dissolve in large quantities, and only a small amount of corrosion products adhere to the corrosion surface.

3.7. Corrosion Mechanism

The corrosion morphology of the sample in the 3.5% NaCl solution shows which local areas of the specimen surface are corroded, but there are also local areas of the specimen surface that are not corroded, indicating that the local area of the sample has good corrosion resistance in the 3.5% NaCl solution. The morphology of the corrosion zone has a loose appearance, which indicates that the corrosion products are not compact and cannot protect the alloy matrix. The polarization curve therefore does not display passivation characteristics, and the Al49Sn21Zn16Pb14 alloy exhibits no passivation performance in the 3.5% NaCl solution. In the 7% NaCl, 10.5% NaCl, and 14% NaCl solutions, compact corrosion products exist locally on the corrosion surface of the samples, which can protect the alloy matrix. Passivation characteristics thus appear on the polarization curve, but the proportion of the compact area is relatively small, so the passivation range is also relatively small. However, in the 17.5% NaCl solution, the corrosion surface of the sample shows a loose corrosion morphology and pores, which cannot protect the alloy matrix. Again, the polarization curve therefore does not exhibit passivation characteristics.
The corrosion morphology indicates that comprehensive corrosion occurs on the specimen; however, the corrosion forms in different regions of the sample surface vary, with the corrosion surface of the sample comprising both compact and loose corrosion products. Combined with the EDS surface scanning results, it can be observed that the compact corrosion products are rich in O, Al, and Zn, while loose corrosion products are rich in O, Sn, and Pb. However, O, Al, Zn, Sn, and Pb elements are not distributed in some areas, which indicates that the corrosion products are shed or dissolved, and pores are formed on the corrosion surface of the sample. With the thickening of the dense corrosion products and increase in loose corrosion products, the compact corrosion products crack and the loose corrosion products fall off or dissolve. Cracking causes the compact corrosion products to fall off, which promotes further corrosion, while loose corrosion products fall off or dissolve, which leads to the formation of pores on the corroded surface of the sample and also promotes further corrosion. The corrosion mechanism of the Al49Sn21Zn16Pb14 alloy in NaCl solution is summarized in Figure 12. The Al49Sn21Zn16Pb14 alloy consists of Al- and Zn-enriched and Sn- and Pb-enriched regions. When the Al49Sn21Zn16Pb14 alloy is immersed in NaCl solution, compact corrosion products are formed in the Al- and Zn-enriched regions of the Al49Sn21Zn16Pb14 alloy, while loose corrosion products are formed in the Sn- and Pb-enriched regions of the Al49Sn21Zn16Pb14 alloy. With the thickening of the corrosion film and increase in corrosion products, the compact corrosion products crack and loose corrosion products fall off. The cracking of compact corrosion products leads to spalling, while the spalling of loose corrosion products leads to pore spaces forming.

4. Conclusions

(1) The microstructure of the Al49Sn21Zn16Pb14 alloy is dendritic, eutectic or eutectoid, and peritectic, and the composition of the Al49Sn21Zn16Pb14 alloy is an FCC solid solution. The dendrite structure mainly comprises Al- and Zn-rich solid solutions, in which the internal dendrites are mainly Al-rich solid solutions, and the interdendrites are mainly Zn-rich solid solutions. The eutectic or eutectoid structure mainly comprises Sn- and Pb-rich solid solutions. The peritectic structure mainly consists of Zn-rich solid solutions and Sn-rich solid solutions.
(2) The corrosion rate of the Al49Sn21Zn16Pb14 alloy in 3.5% NaCl solution is 1.97 × 10⁻² mm/a. With an increase in the NaCl solution’s concentration, the corrosion rate of the Al49Sn21Zn16Pb14 alloy increases, and when the NaCl solution’s concentration is greater than 7%, the corrosion rate increases significantly.
(3) The Al49Sn21Zn16Pb14 alloy corrodes uniformly in NaCl solutions with different concentrations, in which the corrosion surface is loose and not dense. The corrosion products attached to the surface of the alloy are mainly Al and Zn oxides, while corrosion products of Sn and Pb dissolve or fall off, forming micro-pits or pores on the surface.
(4) The Al49Sn21Zn16Pb14 alloy exhibits passivation characteristics in 7%, 10.5%, and 14% NaCl solutions, but the passivation interval is small, the tendency to form a stable passivation film is low, and the protective effect of the passivation film on the matrix is poor. Although a locally dense corrosion product is formed on the surface of the Al49Sn21Zn16Pb14 alloy, cracking occurs and cannot protect the matrix, and the dense corrosion products thus cannot improve the corrosion resistance.
(5) When the Al49Sn21Zn16Pb14 alloy is immersed in a NaCl solution, compact corrosion products are formed in its Al- and Zn-enriched regions, while loose corrosion products are formed in its Sn- and Pb-enriched regions. With the thickening of the corrosion film and increase in corrosion products, compact corrosion products crack and loose corrosion products fall off. The former leads to spalling, and the spalling of loose corrosion products leads to the formation of pore spaces.

Author Contributions

Conceptualization, W.W. and X.Q.; Methodology, X.Y.; Formal analysis, Y.L. and W.Y.; Investigation, W.W.; Resources, W.W. and J.C.; Data curation, X.Y.; Writing—original draft, X.Y.; Writing—review & editing, X.Y.; Visualization, Y.M.; Supervision, W.Y. and J.C.; Project administration, X.Q. and Y.L.; Funding acquisition, W.W. All authors have read and agreed to the published version of the manuscript.

Funding

This research was funded by the Aeronautical Science Foundation of China (202400290U1001), Natural Science Basic Research Program of Shaanxi (2024JC-YBMS-410), the National Natural Science Foundation of China (U24A20106, U24A2034), Shaanxi Laboratory of Advanced Materials (2024ZY-JCYJ-04-11), the Innovation Capability Support Program of Shaanxi (2024RS-CXTD-61), and National Key Research and Development Program of China (2022YFE0122900).

Data Availability Statement

The original contributions presented in this study are included in the article. Further inquiries can be directed to the corresponding author.

Conflicts of Interest

The authors declare no conflict of interest.

References

  1. Zhao, Y.; Li, H.; Hu, X.; Shi, C. Evaluation on steel corrosion risk of seawater sea sand concrete with low water-to-binder ratio by electrochemical measurement. Constr. Build. Mater. 2024, 417, 135326. [Google Scholar] [CrossRef]
  2. Gadioli, A.O.; de Souza, L.M.; Pereira, E.C.; Monteiro, S.N.; Azevedo, A.R. Imidazolium-based ionic liquids as corrosion inhibitors for stainless steel in different corrosive media: An overview. J. Mater. Res. Technol. 2024, 29, 803–823. [Google Scholar] [CrossRef]
  3. Zhang, S.; Wang, Z.; Wang, C. Corrosion behavior of steel exposed to “zero” pollution atmosphere environment for 20 years. J. Mater. Res. Technol. 2024, 30, 2388–2396. [Google Scholar] [CrossRef]
  4. Ni, Q.; Zhu, M.; Yuan, Y.; Guo, S. Corrosion behavior and mechanism of FeCoNi high-entropy alloy compared with X100 pipeline steel in a simulated alkaline soil environment. Mater. Today Commun. 2024, 39, 108846. [Google Scholar] [CrossRef]
  5. Zeng, Q.; Zheng, C.; Wei, X. Study of the corrosion behaviors of M50 steel in brine-contaminated lubricating oil. Int. J. Electrochem. Sci. 2024, 19, 100572. [Google Scholar] [CrossRef]
  6. Zhang, Q.; Shao, L.; Li, W.; Cui, S.; Shang, L.; Wang, C.; Song, Q.; Zhang, C. Comparative study of anti-corrosion properties in different CrN/WC-Co duplex coatings processed by PVD/HVOF. Surf. Coat. Technol. 2024, 483, 130799. [Google Scholar] [CrossRef]
  7. Deng, J.; Zhang, W.; Zhou, M.; Qiu, X.; Zhou, Y.; Zhong, Y.; Liu, N.; Yang, J. Effect of Al content on the microstructure, mechanical property and lead-bismuth eutectic corrosion resistance of refractory AlxTiNbZrMoV coatings produced by magnetron sputtering. Mater. Today Commun. 2024, 38, 108569. [Google Scholar] [CrossRef]
  8. Zhou, S.; Liu, Z.; Lu, Z.; Ma, L. Carbon dot/nickel nanocomposite coating for wear and corrosion control of Mg alloy: Experimental and theoretical studies. Appl. Surf. Sci. 2024, 659, 159845. [Google Scholar] [CrossRef]
  9. Ding, K.; Wu, Y.; Wei, X.; Zhu, X. Preparation and corrosion resistance mechanism of chromium-free ZnAl+CeO2 composite coatings. Mater. Chem. Phys. 2024, 312, 128704. [Google Scholar] [CrossRef]
  10. Wu, J.; Zhu, J. One-step preparation of color-tuned surface coatings on magnesium alloy with corrosion resistance. J. Alloys Compd. 2024, 976, 173300. [Google Scholar] [CrossRef]
  11. Xue, F.; Wang, J.; Hou, Y.; Hu, W. Preparation of ZnO resistive switching film and its corrosion behavior in 3.5 wt.% NaCl solution. Appl. Surf. Sci. 2024, 649, 159105. [Google Scholar] [CrossRef]
  12. Xue, F.; He, W.; Wang, J.; Hu, W. Preparation of AlxZn1−xO resistive switching film by sol–gel method and its corrosion behavior in 3.5 wt% NaCl solution. Appl. Surf. Sci. 2023, 615, 156279. [Google Scholar] [CrossRef]
  13. Xue, F.; Zhao, F.; Wang, J.; Hu, W. Preparation of Zn1−xCrxO resistive switching film and its corrosion behavior in 3.5 wt.% NaCl solution. Appl. Surf. Sci. 2023, 609, 155359. [Google Scholar] [CrossRef]
  14. Zhao, F.; Li, Q.; Wang, J.; Hu, W. Preparation and corrosion resistance of ZnO films under different annealing temperatures and their resistive switching behaviours. Int. J. Electrochem. Sci. 2021, 16, 210654. [Google Scholar] [CrossRef]
  15. Yang, Z.; Zhang, J.; Luo, C.; Yu, C.; Li, M.; Han, W. Effect of pre-oxidation and sea salt on the hot corrosion behavior of MCrAlY coatings and Alsingle bondSi coatings. Surf. Coat. Technol. 2024, 477, 130354. [Google Scholar] [CrossRef]
  16. Zhang, Y.; Yang, H.; Huang, R.; Sun, P.; Zheng, S.; Li, M.; Wang, X.; Du, Q. Investigation of microstructure and corrosion resistance of an Al-Zn-Mg-Cu alloy under various ageing conditions. Corros. Sci. 2024, 227, 111719. [Google Scholar] [CrossRef]
  17. Wang, S.; Ma, X.; Bai, J.; Niu, J.; Ma, R.; Du, A.; Zhao, X.; Fan, Y.; Li, G. Study on the structure and corrosion behavior of hot-dipped Zn–6Al–3Mg alloy coating in chlorine-containing environment. Corros. Sci. 2024, 231, 112001. [Google Scholar] [CrossRef]
  18. Chen, T.-C.; Yung, T.-Y.; Chou, C.-C.; Wang, Y.-M. Investigating the corrosion resistance of Zn and Al coating deposited by arc thermal spraying process. Surf. Coat. Technol. 2024, 483, 130684. [Google Scholar] [CrossRef]
  19. Yang, K.; Yan, J.; Wang, Q.; Ding, J.; Xu, Q.; Wen, Z.; Zeng, R.; Lu, C.; Fan, T.; Gong, M.; et al. Revealing microstructure and the associated corrosion mechanism of Al/amorphous Al2O3/Al tri-layer coating deposited on depleted uranium by magnetron sputtering. Appl. Surf. Sci. 2024, 659, 159911. [Google Scholar] [CrossRef]
  20. Li, H.; Yu, H.; Zhou, T.; Yin, B.; Yin, S.; Zhang, Y. Effect of tin on the corrosion behavior of sea-water corrosion-resisting steel. Mater. Des. 2015, 84, 1–9. [Google Scholar] [CrossRef]
  21. Mitsunobu, T.; Tokuda, K.; Shimoda, N. Peritectic structure evolution in hot dip Zn-Al alloy coatings. Tetus Hagane—J. Iron Steel Inst. Jpn. 2020, 106, 254–261. [Google Scholar] [CrossRef]
  22. Chu, R.; Wang, Z.; Sun, N.; Deng, X.; Xu, C.; Guo, Z. The fundamental research on suspended dross in hot dip Al-Zn galvanising process. Mater. Sci. Technol. 2024, 40, 552–560. [Google Scholar] [CrossRef]
  23. Buryakovskaya, O.A.; Ambaryan, G.N.; Suleimanov, M.Z.; Tarasenko, A.B.; Vlaskin, M.S. Enhanced hydrogen generation from magnesium–aluminum scrap ball milled with low melting point solder alloy. Materials 2023, 16, 4450. [Google Scholar] [CrossRef] [PubMed]
  24. Zhu, X.-X.; Shen, Y.-F.; Li, C.-T.; Dai, X.; Xiao, G.-H. Effect of rare earth content on microstructure and corrosion resistance of hot-dip Zn-5Al alloy coated steel wire for bridge cables. J. Iron Steel Res. Int. 2023, 30, 2101–2110. [Google Scholar] [CrossRef]
  25. He, X.; Zhou, X.; Shang, T.; Liu, W.; Jiang, G.; Liu, C.; Cheng, X.; Zhang, X.; Li, X. Influence mechanism of different elements and alloy phases on the corrosion resistance of Zn-Al-Mg coated steel in the atmospheric environment: A review. Corros. Commun. 2024, 13, 49–59. [Google Scholar] [CrossRef]
  26. Gao, Y.; Su, R.; Liu, Z.; Chen, K.; Cong, S.; Zhang, L.; Guo, X. High-resolution characterization reveals the role of Al content in the evolution of oxide scales formed on alumina-forming alloy exposed to supercritical water. Corros. Sci. 2024, 231, 111968. [Google Scholar] [CrossRef]
  27. Liu, L.; Shi, C.; Zhang, C.; Su, R.; Zhang, H.; Voyles, P.M.; Perepezko, J.H. The effect of Al on the oxidation behavior of Mo-6Si-12B-(1,2,4,8)Al alloys. Corros. Sci. 2022, 208, 110677. [Google Scholar] [CrossRef]
  28. Guan, Q.; Hang, C.; Li, S.; Tang, X.; Yao, G.; Yu, D.; Ding, Y.; Wang, X.; Zhang, W. Effect of gamma irradiation on microstructural evolution and mechanical properties of SnPb eutectic solder joints. J. Mater. Res. Technol. 2023, 27, 2929–2938. [Google Scholar] [CrossRef]
  29. Dong, S.; Na, R.; Qu, Y.; Chen, R.; Li, G.; Zhang, W.; Zhang, S.; Liu, S. Hot processing performance and fracture toughness control of AlxCrFeNiCu1.5 (x = 0, 0.2, 0.4, 0.6, 0.8) high entropy alloys. Mater. Today Commun. 2024, 38, 108566. [Google Scholar] [CrossRef]
  30. Yao, X.; Wang, W.; Qi, X.; Lv, Y.; Yang, W.; Li, T.; Chen, J. Effects of heat treatment cooling methods on precipitated phase and mechanical properties of CoCrFeMnNi–Mo5C0.5 high entropy alloy. J. Mater. Res. Technol. 2024, 29, 3566–3574. [Google Scholar] [CrossRef]
  31. Yang, P.; Jiang, Z.; Shi, Y.; Ren, X.; Liang, L.; Shao, Q.; Zhu, K. Enhancement of oxygen evolution reaction performance of FeCoNiCrMn high entropy alloy thin film electrodes through in-situ reconstruction. J. Alloys Compd. 2023, 947, 169699. [Google Scholar] [CrossRef]
  32. Akinwande, A.A.; Kumar, M.S.; Adesina, O.S.; Adediran, A.A.; Romanovski, V.; Salah, B. Tribological performance of a novel 7068-aluminium/lightweight-high-entropy-alloy fabricated via powder metallurgy. Mater. Chem. Phys. 2023, 308, 128207. [Google Scholar] [CrossRef]
  33. Zhuo, L.; Sun, J.; Chen, B.; Zhan, M.; Jiang, C. Microstructure and mechanical performances of novel multi-phase refractory high entropy alloys in Ti-Zr-V-Mo fabricated by vacuum arc melting. Vacuum 2023, 217, 112544. [Google Scholar] [CrossRef]
  34. Jiang, D.; Liu, Y.; Liang, S.; Xie, W. The effects of non-isothermal aging on the strength and corrosion behavior of AlZnMgCu alloy. J. Alloys Compd. 2016, 681, 57–65. [Google Scholar] [CrossRef]
  35. Zhang, M.-H.; Liu, S.-D.; Jiang, J.-Y.; Wei, W.-C. Effect of Cu content on intergranular corrosion and exfoliation corrosion susceptibility of Al−Zn−Mg−(Cu) alloys. Trans. Nonferrous Met. Soc. China 2023, 33, 1963–1976. [Google Scholar] [CrossRef]
  36. Wei, X.; Zhang, L.; Zhang, F.; Zhang, C.; Jia, Q.; Sun, K.; Duan, D.; Jiang, H.; Li, G. Effect of carbon addition on the microstructure and corrosion resistance of the CoCrFeNi high-entropy alloy. Corros. Sci. 2024, 231, 111965. [Google Scholar] [CrossRef]
  37. Wang, X.; Peng, Z.; Ma, L.; Lin, Y.; Li, G.; Hailun, W. Effect of SiC particles on the corrosion behaviour of 6.5% SiCp/Al-Cu-Mg-Zn composites. Int. J. Electrochem. Sci. 2017, 12, 11006–11016. [Google Scholar] [CrossRef]
  38. Guo, Q.; Liu, B.; Li, Q.; Xie, J. Effect of 0.3 at. % Ce on the corrosion resistance of Fe40Ni20Co20Cr20 high-entropy alloy in 3.5 wt% NaCl solution. Mater. Lett. 2024, 364, 136310. [Google Scholar] [CrossRef]
  39. Chang, W.; Wang, X.; Qian, H.; Chen, X.; Lou, Y.; Zhou, M.; Guo, D.; Kwok, C.T.; Tam, L.M.; Zhang, D. Effect of Sn addition on microstructure, hardness and corrosion behavior of CoCrFeNiSnx high entropy alloys in chloride environment. Corros. Sci. 2024, 227, 111808. [Google Scholar] [CrossRef]
  40. Zhang, D.; Li, Q.; Sun, R.; Chang, C.; Liu, B.; Ma, X. Effect of Mn addition on microstructure and corrosion behavior of AlCoCrFeNi high-entropy alloy. Intermetallics 2024, 167, 108236. [Google Scholar] [CrossRef]
  41. Xu, Z.; Wang, Y.; Gao, X.; Peng, L.; Qiao, Q.; Xiao, J.; Guo, F.; Wang, R.; Yu, J. Electrochemical deposition and corrosion resistance characterization of FeCoNiCr high-entropy alloy coatings. Coatings 2023, 13, 1167. [Google Scholar] [CrossRef]
  42. Sun, X.; Wang, Y.; Jie, J.; Li, T.; Yuan, Z.; Cui, H.; Liu, J. Effects of Ti addition on microstructure, mechanical properties and corrosion resistance of the Cu-Zn-Ni alloy. Metals 2024, 14, 1360. [Google Scholar] [CrossRef]
  43. Chen, X.; Liao, Q.; Gong, M.; Fu, Q. Corrosion performances of selective laser melting Ti6Al4V alloy in different solutions. Metals 2023, 13, 192. [Google Scholar] [CrossRef]
  44. Wang, S.; Cao, Y.; Liu, X.; Cai, G. In situ electrochemical monitoring of the crevice corrosion process of the 7075-T651 aluminium alloy in acidic NaCl and NaNO3 solution. Materials 2023, 16, 2812. [Google Scholar] [CrossRef]
  45. Yao, X.; Xia, S.; Lv, Y.; Yang, W.; Chen, J. Effects of hot dipping temperature on microstructure and mechanical properties of Pb40Sn60 alloy coating on copper wires. Mater. Sci. Eng. A 2021, 810, 140991. [Google Scholar] [CrossRef]
  46. Lee, C.; Chung, J.; Lee, J.; Yoon, W. Refining behavior of aluminum alloyed metallurgical grade silicon during fractional melting process. J. Nanosci. Nanotechnol. 2013, 13, 7161–7164. [Google Scholar] [CrossRef]
Figure 1. The preparation process of alloys.
Crystals 15 00425 g001
Figure 2. Apparatus for electrochemical and immersion tests: (a) immersion experiment; (b) electrochemical test.
Crystals 15 00425 g002
Figure 3. Microstructure and elemental distribution of Al49Sn21Zn16Pb14 alloy. (a) SEM image; (b) EDS area scan results.
Crystals 15 00425 g003
Figure 4. XRD pattern of Al49Sn21Zn16Pb14 alloy.
Crystals 15 00425 g004
Figure 5. DSC test results of Al49Sn21Zn16Pb14 alloy.
Crystals 15 00425 g005
Figure 6. Polarization curves of Al49Sn21Zn16Pb14 alloy in NaCl solutions with different concentrations.
Crystals 15 00425 g006
Figure 7. Appearance of Al49Sn21Zn16Pb14 alloy after being immersed for corrosion for 28 days in chloride-containing solution with different concentrations of NaCl.
Crystals 15 00425 g007
Figure 8. SEM images of Al49Sn21Zn16Pb14 alloy after being immersed for corrosion for 28 days in chloride-containing solution with different concentrations of NaCl.
Crystals 15 00425 g008
Figure 9. Variation law of Al49Sn21Zn16Pb14 alloy corrosion rate with NaCl solution’s concentration.
Crystals 15 00425 g009
Figure 10. XRD patterns of Al49Sn21Zn16Pb14 alloy after being immersed for corrosion in NaCl solutions with different concentrations.
Crystals 15 00425 g010
Figure 11. EDS surface scanning results of Al49Sn21Zn16Pb14 alloy after being immersed for corrosion in NaCl solutions with different concentrations.
Crystals 15 00425 g011
Figure 12. Schematic diagrams for corrosion mechanism of Al49Sn21Zn16Pb14 alloy.
Crystals 15 00425 g012
Table 1. EDS point analysis and area scan results of Al49Sn21Zn16Pb14 alloy.
PositionElement Content (wt.%)
AlZnPbSn
Black61.126.38.64.0
Dark gray4.9464.7717.4612.83
Light gray2.434.8113.0579.71
White2.073.6186.967.36
Area scanned50.2716.8212.7320.18
Table 2. Electrochemical characteristics of Al49Sn21Zn16Pb14 alloy in NaCl solutions with different concentrations.
Concentration of NaCl Solution (%)Self-Corrosion Potential Ecorr (V)Self-Corrosion Current Density Icorr (A/cm2)Passivation Potential Interval (V)
3.5−1.332.3 × 10−5/
7−1.452.4 × 10−5−1.27–−1.13
10.5−1.452.6 × 10−5−1.33–−1.18
14−1.463.4 × 10−5−1.41–−1.35
17.5−1.468.4 × 10−5/
Table 3. EDS test results of corrosion products for Al49Sn21Zn16Pb14 alloy after being immersed for corrosion in NaCl solutions with different concentrations.
Concentration of NaCl Solution (%)PositionElement Content (at. %)
OAlZnSnPb
3.5Grayness42.77.648.21.20.3
Whiteness70.126.31.91.70.0
7Grayness40.53.653.81.30.8
Whiteness50.142.27.20.40.1
10.5Grayness58.26.030.34.70.8
Whiteness63.324.410.61.40.2
14Grayness71.62.326.00.00.0
Whiteness66.927.35.40.40.0
17.5Grayness68.47.522.73.30.0
Whiteness61.625.48.63.90.4
Disclaimer/Publisher’s Note: The statements, opinions and data contained in all publications are solely those of the individual author(s) and contributor(s) and not of MDPI and/or the editor(s). MDPI and/or the editor(s) disclaim responsibility for any injury to people or property resulting from any ideas, methods, instructions or products referred to in the content.

