Article

Ion Substitution Behavior and Chromatographic Study of “Ya’an Green” Seal Stone

1
Faculty of Materials Science and Engineering, Kunming University of Science and Technology, Kunming 650093, China
2
Kunming Customs Technology Centre, No. 359 Guangfu Road, Xishan District, Kunming 650228, China
*
Authors to whom correspondence should be addressed.
Crystals 2025, 15(5), 420; https://doi.org/10.3390/cryst15050420
Submission received: 24 March 2025 / Revised: 25 April 2025 / Accepted: 28 April 2025 / Published: 29 April 2025

Abstract

:
In recent years, domestic research on the ion substitution behavior and chromaticity of the mineral composition of “Ya’an Green” remains insufficient, while there is almost no relevant research on “Ya’an Green” abroad. In this study, X-ray powder diffraction (XRD), electron probe microanalysis (EPMA), infrared spectroscopy (IR), ultraviolet–visible spectroscopy (UV-Vis), and colorimetry were employed. The results indicate that the green and yellow matrices of “Ya’an Green” are primarily composed of muscovite, with rutile also present in the yellow matrix. In contrast, the white–green samples are mainly composed of quartz, with muscovite as a secondary mineral. Additionally, it was observed that the (004) crystal plane of muscovite exhibits a peak shift to lower 2θ angles, attributed to the substitution of Al3+ by ions with larger radii, such as Ba2+, Cr3+, and Fe2+, leading to an increase in unit cell parameters and a consequent shift in the peak to lower wavenumbers. The main elements of “Ya’an Green” are Al, Si, and K, with minor elements including Na, Fe, and Cr. Furthermore, Mg2+, Ca2+, Ti4+, Cr3+, and Fe2+ in the samples can substitute for Al3+ through isomorphic substitution. The infrared spectrum of muscovite in the ‘Ya’an Green’ sample shows three typical absorption peaks, 422 cm−1 and 513 cm−1 caused by Si-O bending vibration, 697 cm−1 and 837 cm−1 caused by Si-O-Al vibration, 948 cm−1 caused by O-H bending vibration, and 3647 cm−1 caused by O-H stretching vibration. The peak at 837 cm−1 exhibits varying degrees of shift due to the substitution of Al3+ by ions with larger radii. The ultraviolet–visible spectra display two broad absorption bands at 422 nm and 615 nm, which are caused by Cr3+ transition, indicating that Cr is the chromogenic element responsible for the green color. A correlation was observed between the Cr3+ content and the hue angle h in “Ya’an Green” samples: the higher the Cr3+ content, the closer the hue angle is to 136°, resulting in a darker green color, while lower Cr3+ content leads to a deviation from the dark green hue. This study establishes for the first time the correlation between the mineral composition of ‘Ya’an Green’ and its chromatic parameters and explores the linear relationship between its color and the number of color-causing elements and elemental substitution, which provide data support and theoretical models for the study of the color of seal stones.

1. Introduction

Stamp stone, also known as seal stone, is a type of stone used for carving seals. “Ya’an Green”, as a kind of seal stone, has recently emerged, and there are relatively few domestic and international reports and studies on it. Its color, appearance, internal structure, and other factors exhibit a high degree of similarity to other seal stones and jade stones. However, different scholars hold varying views on the research related to “Ya’an Green”. Wang Liming [1] pointed out that the main mineral composition of “Ya’an Green” is illite, and the chromogenic elements are Ti, Cr, and Fe. Li Jinlei [2] et al. suggested that “Ya’an Green” is primarily composed of a green–yellow matrix, with its main mineral components being muscovite and rutile. This conclusion contradicts previous reports that identified illite as the primary component of “Ya’an Green”, leading to its classification as a muscovite–rutile seal stone. Zhao Zhuangyu [3] et al. indicated that the green matrix of “Ya’an Green” is muscovite, while the yellow matrix consists of dolomite and pyrite, with small amounts of quartz and other impurities. They also noted that the main chromogenic elements of the green matrix are Fe, Ti, and Cr, with Cr3+ primarily responsible for the green coloration. These studies demonstrate that the current domestic and international research on “Ya’an Green” mainly focuses on its basic gemological and spectroscopic characteristics [4]. Research means are mostly limited to a single technical means, and the lack of a number of experimental means for joint systematic analysis should be explored in depth to establish the ‘Ya’an green’ seal stone’s mineral composition, chromogenic causes, chromogenic elements, and other intrinsic linkages, and for further research of the seal stone to provide a new method.
Therefore, this paper selects the green and yellow matrices of “Ya’an Green” samples and employs X-ray diffraction, electron probe microanalysis, infrared spectroscopy, ultraviolet–visible spectroscopy, and a USB2000+ fiber-optic spectrometer to explore various aspects. The aim is to determine the main mineral composition, elemental species, and chromogenic elements of “Ya’an Green”. Additionally, this study incorporates chromatic parameters into the analysis of X-ray diffraction data, infrared spectroscopy data, and electron microprobe data to perform fitting and analyze the correlation between the data. This approach provides a new perspective for studying the color of seal stones, their chromogenic elements, and the elemental substitutions among them.

2. Materials and Methods
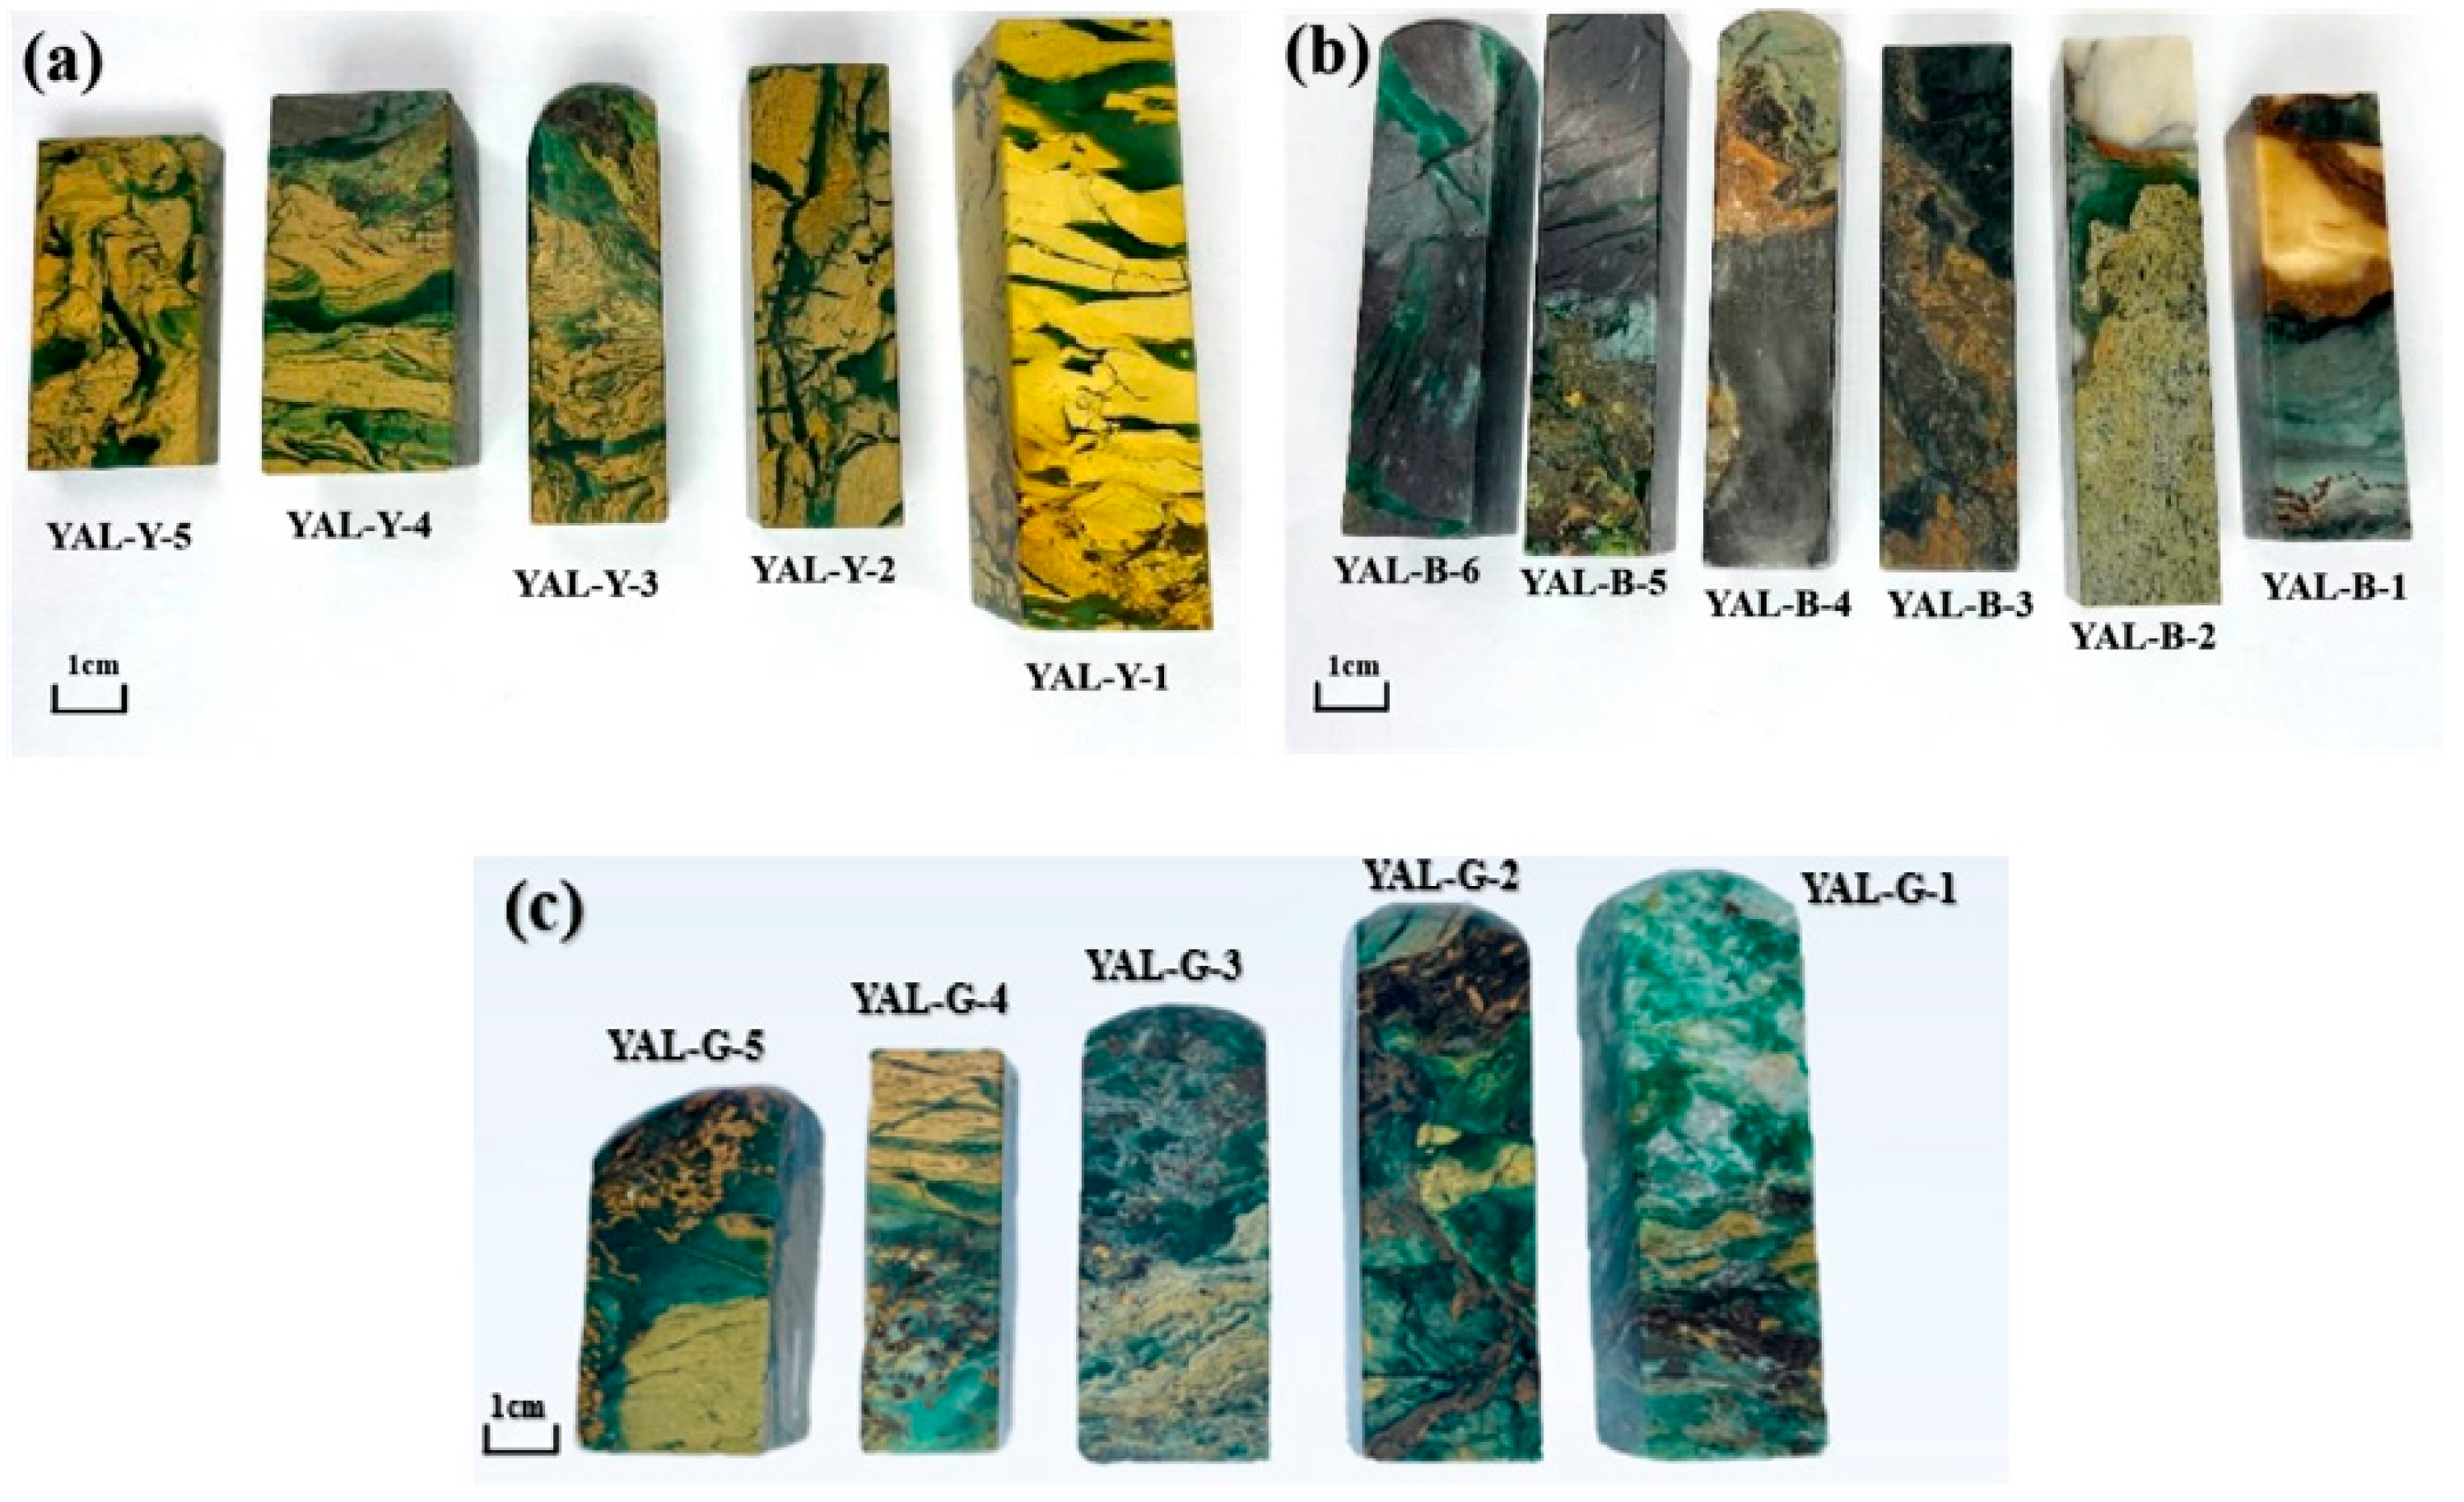
2.1. Materials

In this study, 16 samples of “Ya’an Green” seal stone were selected (Figure 1). From an overall perspective, the primary colors of “Ya’an Green” are green and yellow. By observing the distribution of yellow and green, it is roughly inferred that yellow constitutes the main matrix color, while the green matrix appears to have intruded into the yellow matrix at a later stage. Each “Ya’an Green” seal stone sample was numbered and generally categorized into three color groups: samples with a predominantly yellow matrix were labeled YAL-Y-(sample number); those with a predominantly dark matrix were labeled YAL-B-(sample number); those with a predominantly green matrix were labeled YAL-G-(sample number). The specific numbering was based on the images provided. The color distribution of the yellow and green samples is relatively uniform. Notably, samples YAL-B-1 and YAL-B-2 exhibit a whitish–green color with embedded white particles, distinguishing them from other “Ya’an Green” samples. Several points from each sample were selected for precise measurement and analysis.

2.2. Methods

An X-ray powder diffraction test using the Dandong Tongda TD-3500 X-ray diffractometer (Dandong Tongda Technology Co., Ltd., Dandong, China), scanning mode for continuous scanning, drive mode for the dual-axis linkage, a starting angle of 10°, a termination of the angle of 80°, a step angle of 0.04°, a tube voltage of 30 KV, and a current tube of 20 mA was utilized.
The electron probe microanalysis test used EPMA-1720H (Shimadzu Corporation, Kyoto, Japan), the emitted electrons were backscattered, the working voltage was 15 KV, the beam spot diameter was 10 μm, and the magnification was 1000 times.
Infrared spectral testing was carried out using a TENSOR27 spectrometer produced by Bruker (Bruker Optik GmbH, Ettlingen, Germany). The manufacturer of the infrared spectrometer is Fable, with a spectral resolution of 0.4 nm. The measured wave number range was 400 cm−1–4000 cm−1, the spectral resolution was 2 cm−1, and the sample scanning time was 40 s.
The UV-Vis spectral test was carried out by the FUV-007 UV-Vis-NIR spectrometer (Fable, Shenzhen, China) with a wavelength range of 220 nm–1000 nm, an integration time of 80 ms, and 10 scans.
Chromaticity measurements were carried out using a USB2000+ fiber optical spectrometer (Ocean Optics, Dunedin, FL, USA), with a measurement wavelength range of 380 nm–700 nm, and the experimental light source was the D65 light source in the CIE standard illuminant, with a wavelength interval of 10 nm, and an acquisition integration time of 2500 μs.

3. Results

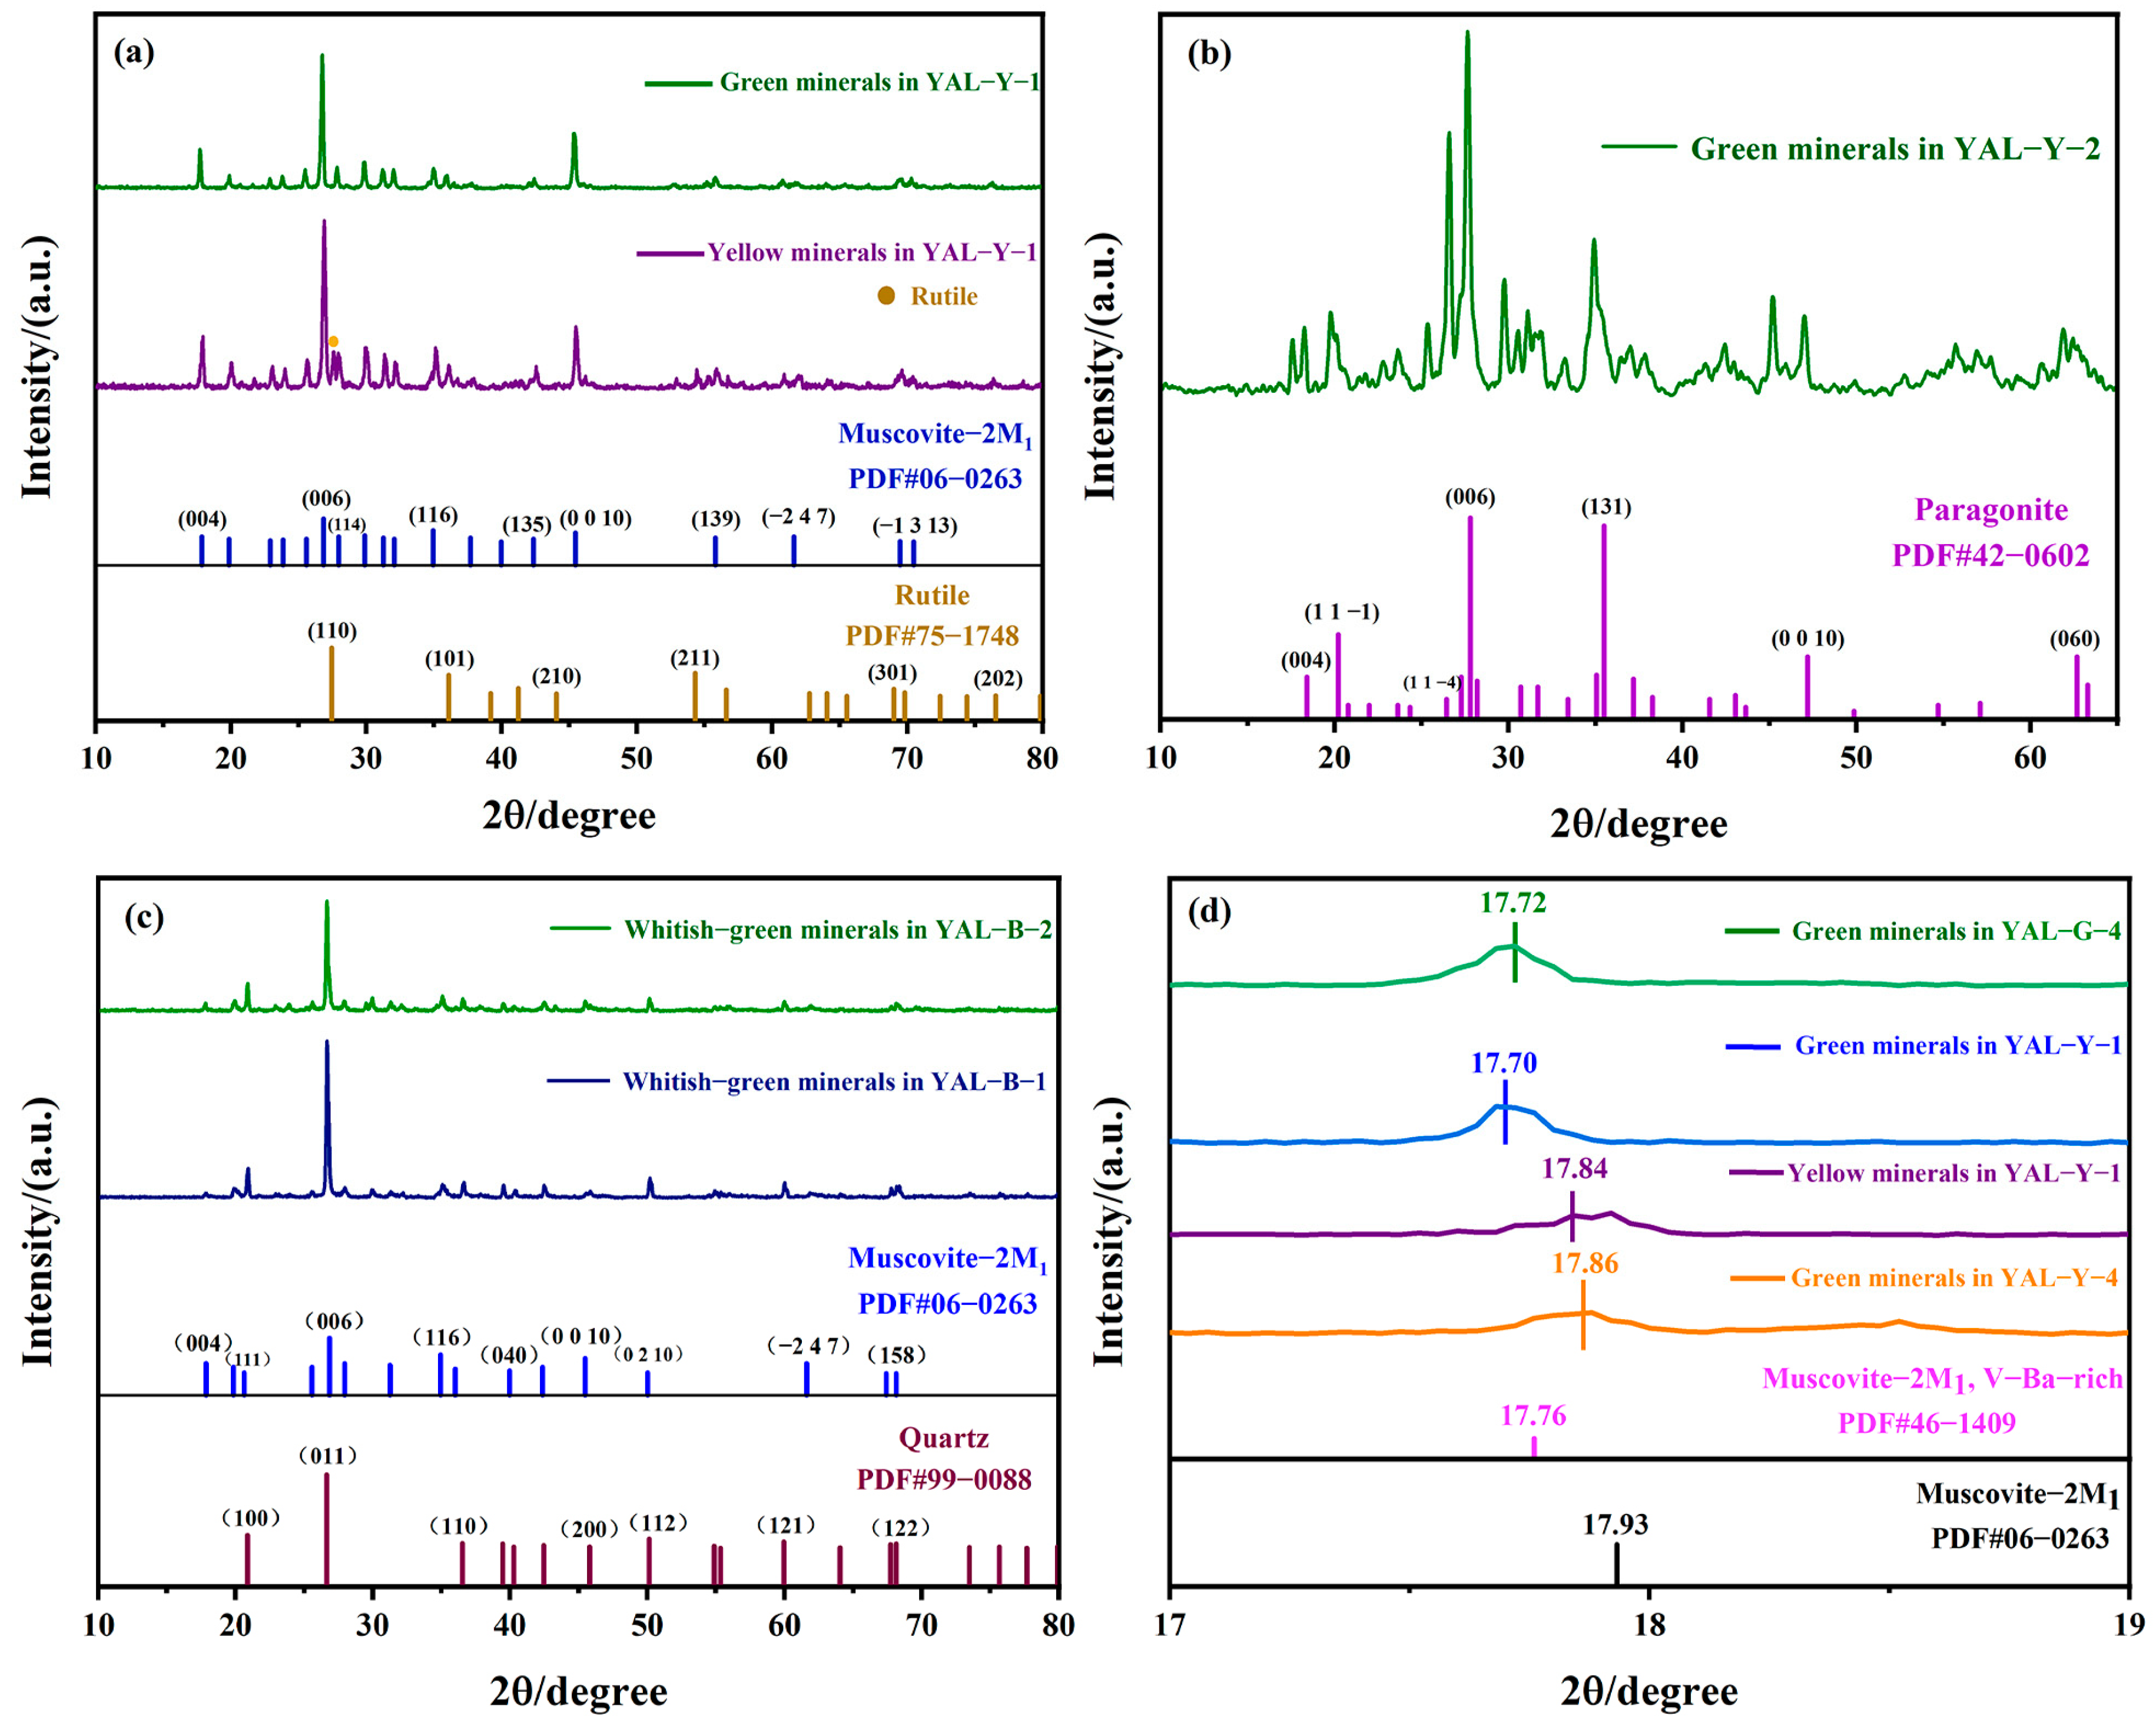
3.1. X-ray Powder Diffraction Test

To investigate the mineral composition of “Ya’an Green”, the green and yellow matrices of the samples were subjected to X-ray powder diffraction analysis (Figure 2). A comparison with the standard muscovite PDF card reveals that both the green and yellow matrices consist of 2M1-type muscovite [5,6,7], with diffraction peaks of rutile appearing in the yellow sample (Figure 2a). A comparison of the X-ray diffraction spectrum of YAL-Y-2 with the standard paragonite PDF card indicates that the substance is a 2M1-type paragonite (Figure 2b). An analysis of the X-ray diffraction peaks of YAL-B-1 and YAL-B-2 from the white–green samples, when compared with standard diffraction spectra, shows that quartz is the primary constituent, with muscovite as the secondary constituent. However, since their colors predominantly appear green, it is inferred that muscovite exists as inclusions within quartz, resulting in the overall green coloration of the samples (Figure 2c). By comparing the muscovite (004) crystal surface of the four samples with the standard PDF card (Figure 2d), it is found that the diffraction peaks are shifted to the left to varying degrees. This phenomenon is attributed to the substitution of ions with larger radii into the crystal structure, leading to an increase in the cell parameters, which causes a shift in the position of the diffraction peaks. It is inferred that the muscovite in the “Ya’an Green” samples underwent varying degrees of ionic substitution, resulting in an increase in the ionic radius and unit cell parameters, which caused the peaks to shift to lower wavenumbers [8]. Furthermore, a comparison with standard PDF cards of muscovite rich in Ba2+ and V5+ shows that the ionic radii of Ba2+ and V5+ are larger than that of Al3+ in muscovite, leading to a shift to lower wavenumbers. This further confirms the influence of ionic substitution on the unit cell parameters.

3.2. Electron Probe Microanalysis Test

Eight samples of “Ya’an green” were selected for the electron microprobe pointing test, mainly on the green matrix, and the results of the different points of the same piece of sample were named as YAL-X (category number)-Z (sample number).2; for example: YAL-Y-1.2. A total of 16 points were hit, and the results (Table 1) showed that. The main elements of “Ya’an green” are Al, Si, and K, and the minor elements contain Na, Fe, Cr, Mg, Ca, and Ti, and it is inferred that Fe and Cr are the main causes of coloration, and Ti and Ca are the minor trace causes of coloration [9]. The average chemical formula of muscovite in the “Ya’an green” sample was calculated from the oxide percentage content of muscovite in Table 1 as follows:
(K0.77Na0.02)Ʃ=0.79(Al2.15Ti0.03Fe0.03)Ʃ=2.21(Si2.75Al1.25)Ʃ=4.00O10(OH)2. The Na2O content of YAL-Y-2 is significantly higher compared to all the other samples, which is consistent with the X-ray diffraction results and allows us to verify that this sample is a paragonite.

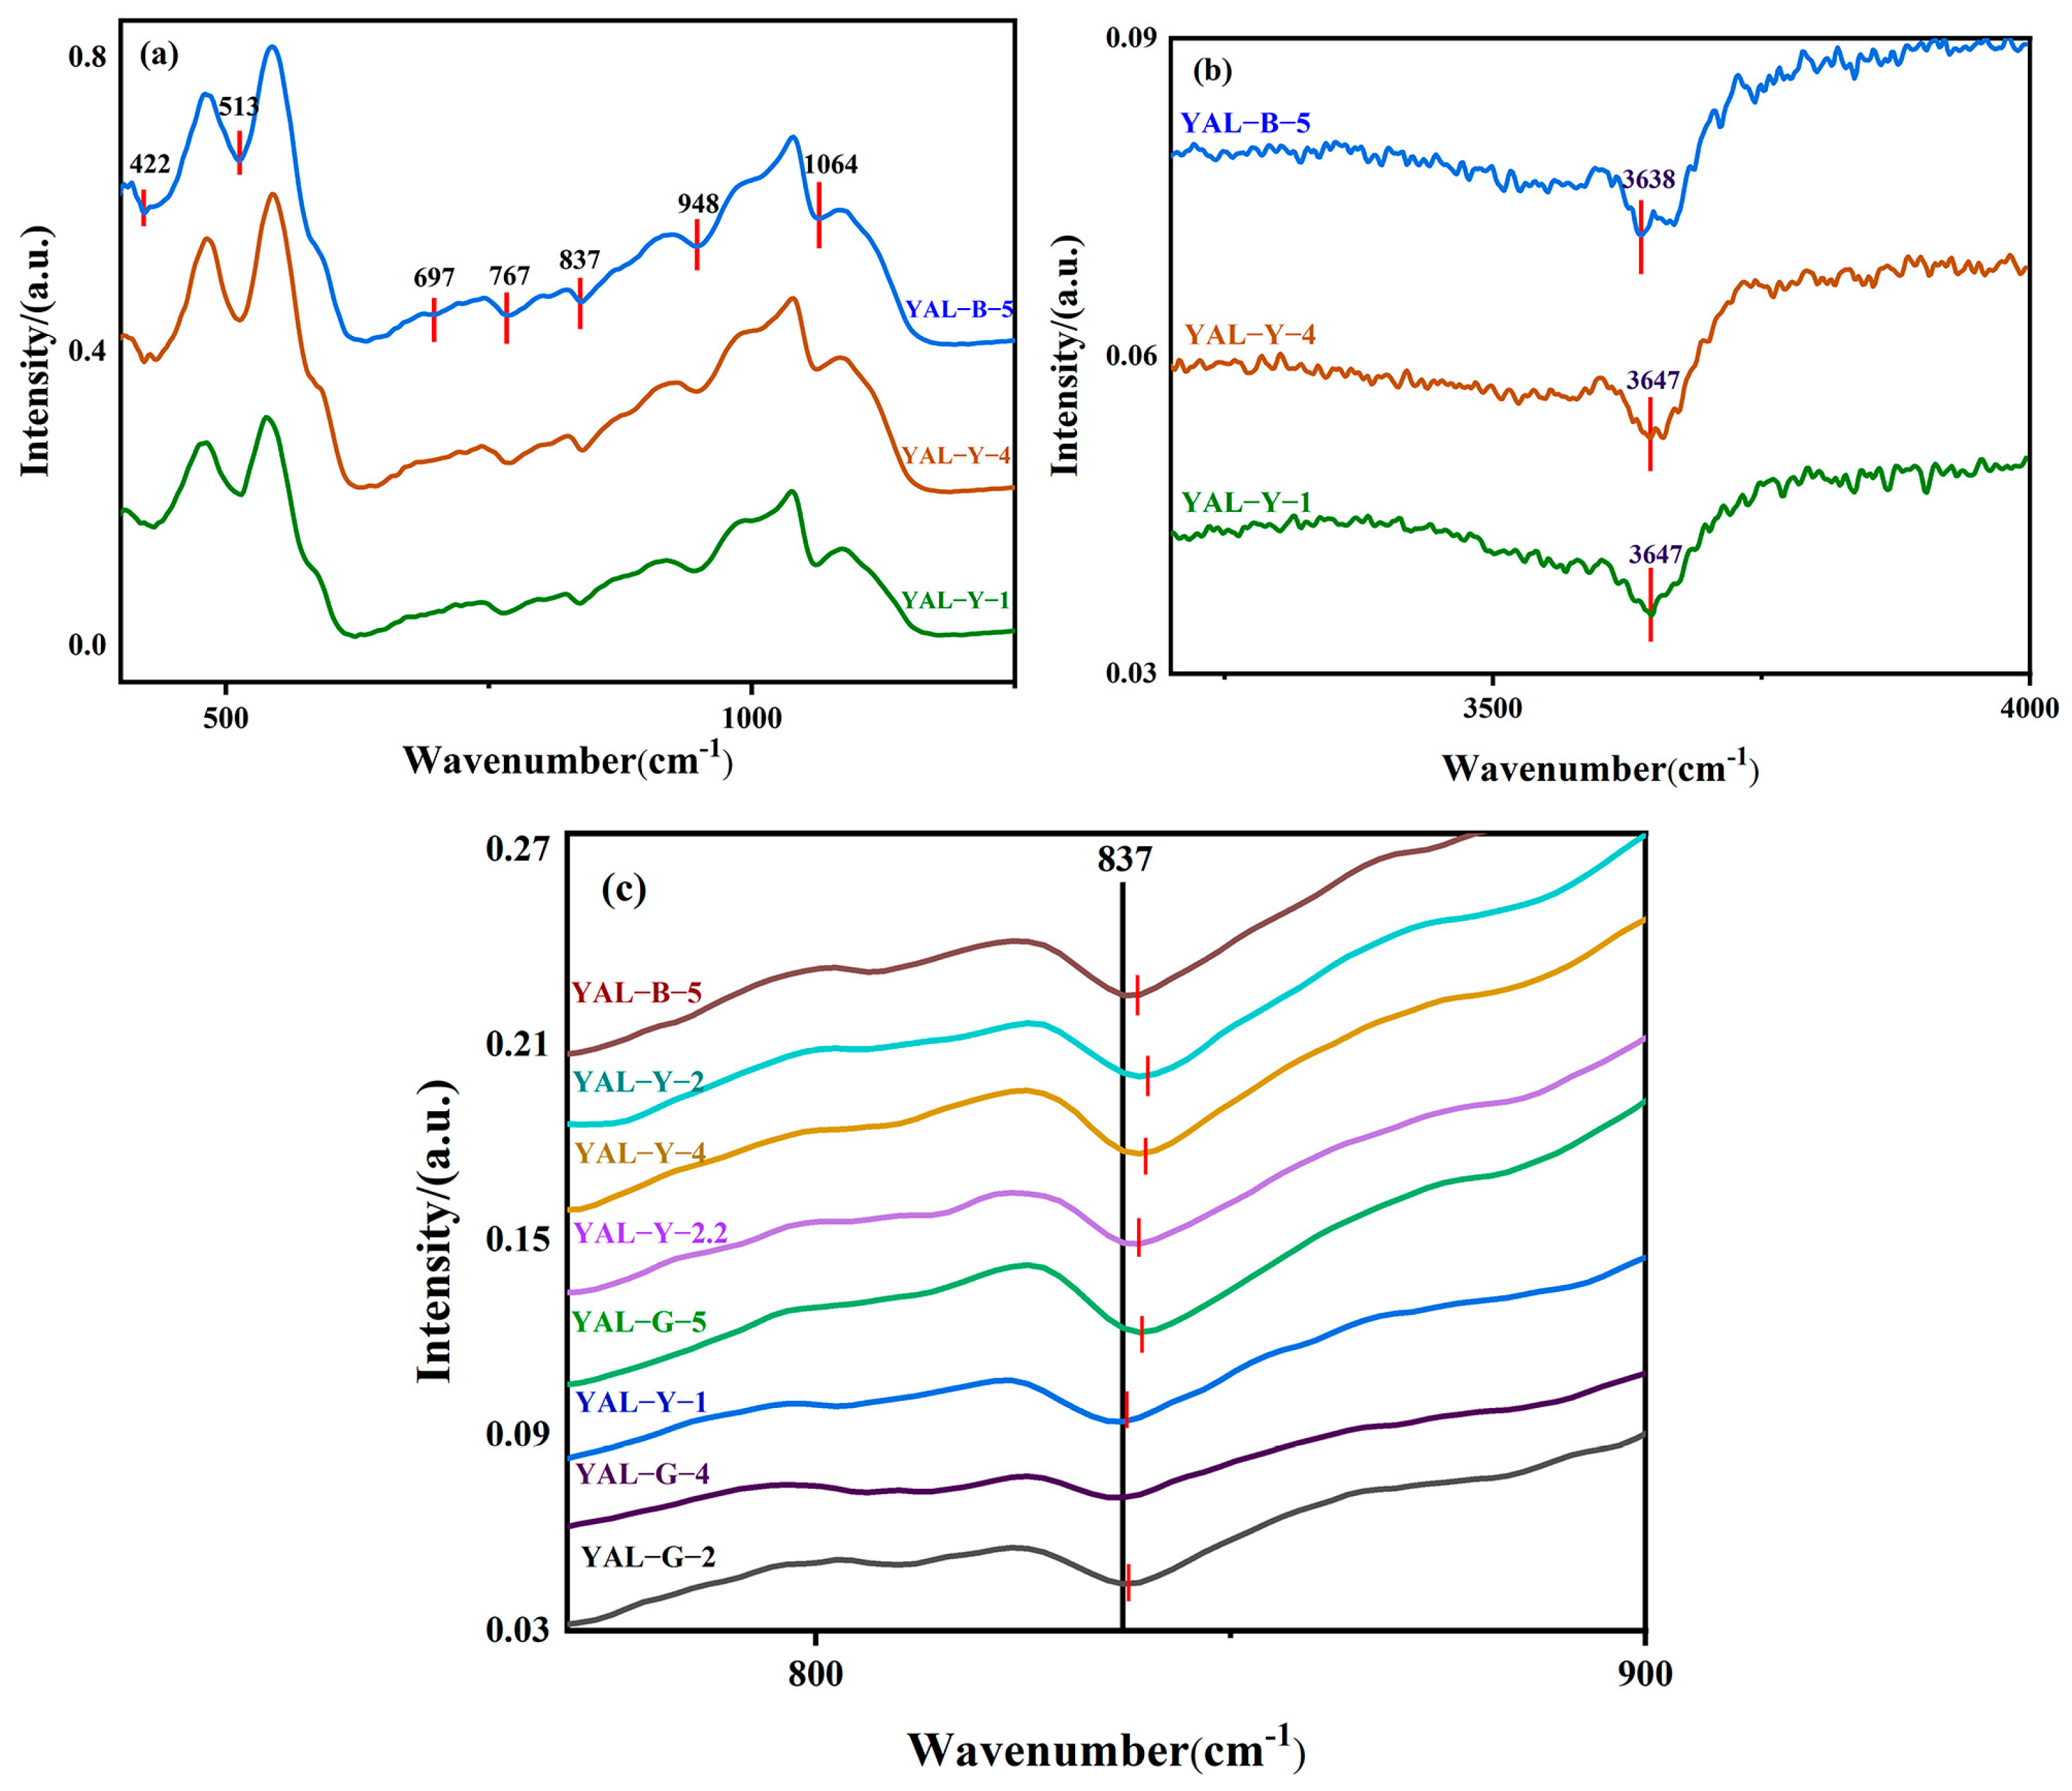
3.3. Infrared Spectroscopic Testing

Infrared spectroscopy point analysis was conducted on the green matrix of selected “Ya’an Green” samples, and the experimental results are shown in Figure 3. The infrared absorption peaks of the green matrix primarily appear in the low-frequency region at 422 cm−1, 513 cm−1, 697 cm−1, 767 cm−1, 837 cm−1, 948 cm−1, and 1064 cm−1, while the infrared absorption peak around 3647 cm−1 is observed in the high-frequency region (Figure 3a,b). By comparing the infrared spectra of the green matrix with relevant research data [1] and standard spectra, it was found that the spectra are consistent with those of muscovite. This conclusion aligns with the results of the X-ray powder diffraction analysis presented earlier. Therefore, it can be confidently concluded that the main component of the green matrix of “Ya’an Green” is muscovite. Specifically, the infrared absorption peaks at 422 cm−1 and 513 cm−1 are attributed to Si-O bending vibrations, the peaks at 697 cm−1 and 837 cm−1 are attributed to Si-O-Al vibrations, and the peak at 948 cm−1 is attributed to O-H bending vibrations. The high-frequency infrared absorption peak at 3647 cm−1 is attributed to O-H stretching vibrations [10,11,12,13]. A magnified view of the 837 cm−1 infrared absorption peak (Figure 3c) reveals that the peaks of different samples exhibit varying degrees of shifts. This is inferred to result from the substitution of Al3+ by ions with larger ionic radii. The increase in ionic radius reduces the atomic distances within the crystal lattice, leading to shorter chemical bonds in the crystal structure and an overall increase in bonding energy. Consequently, the peaks shift toward lower wavenumbers.

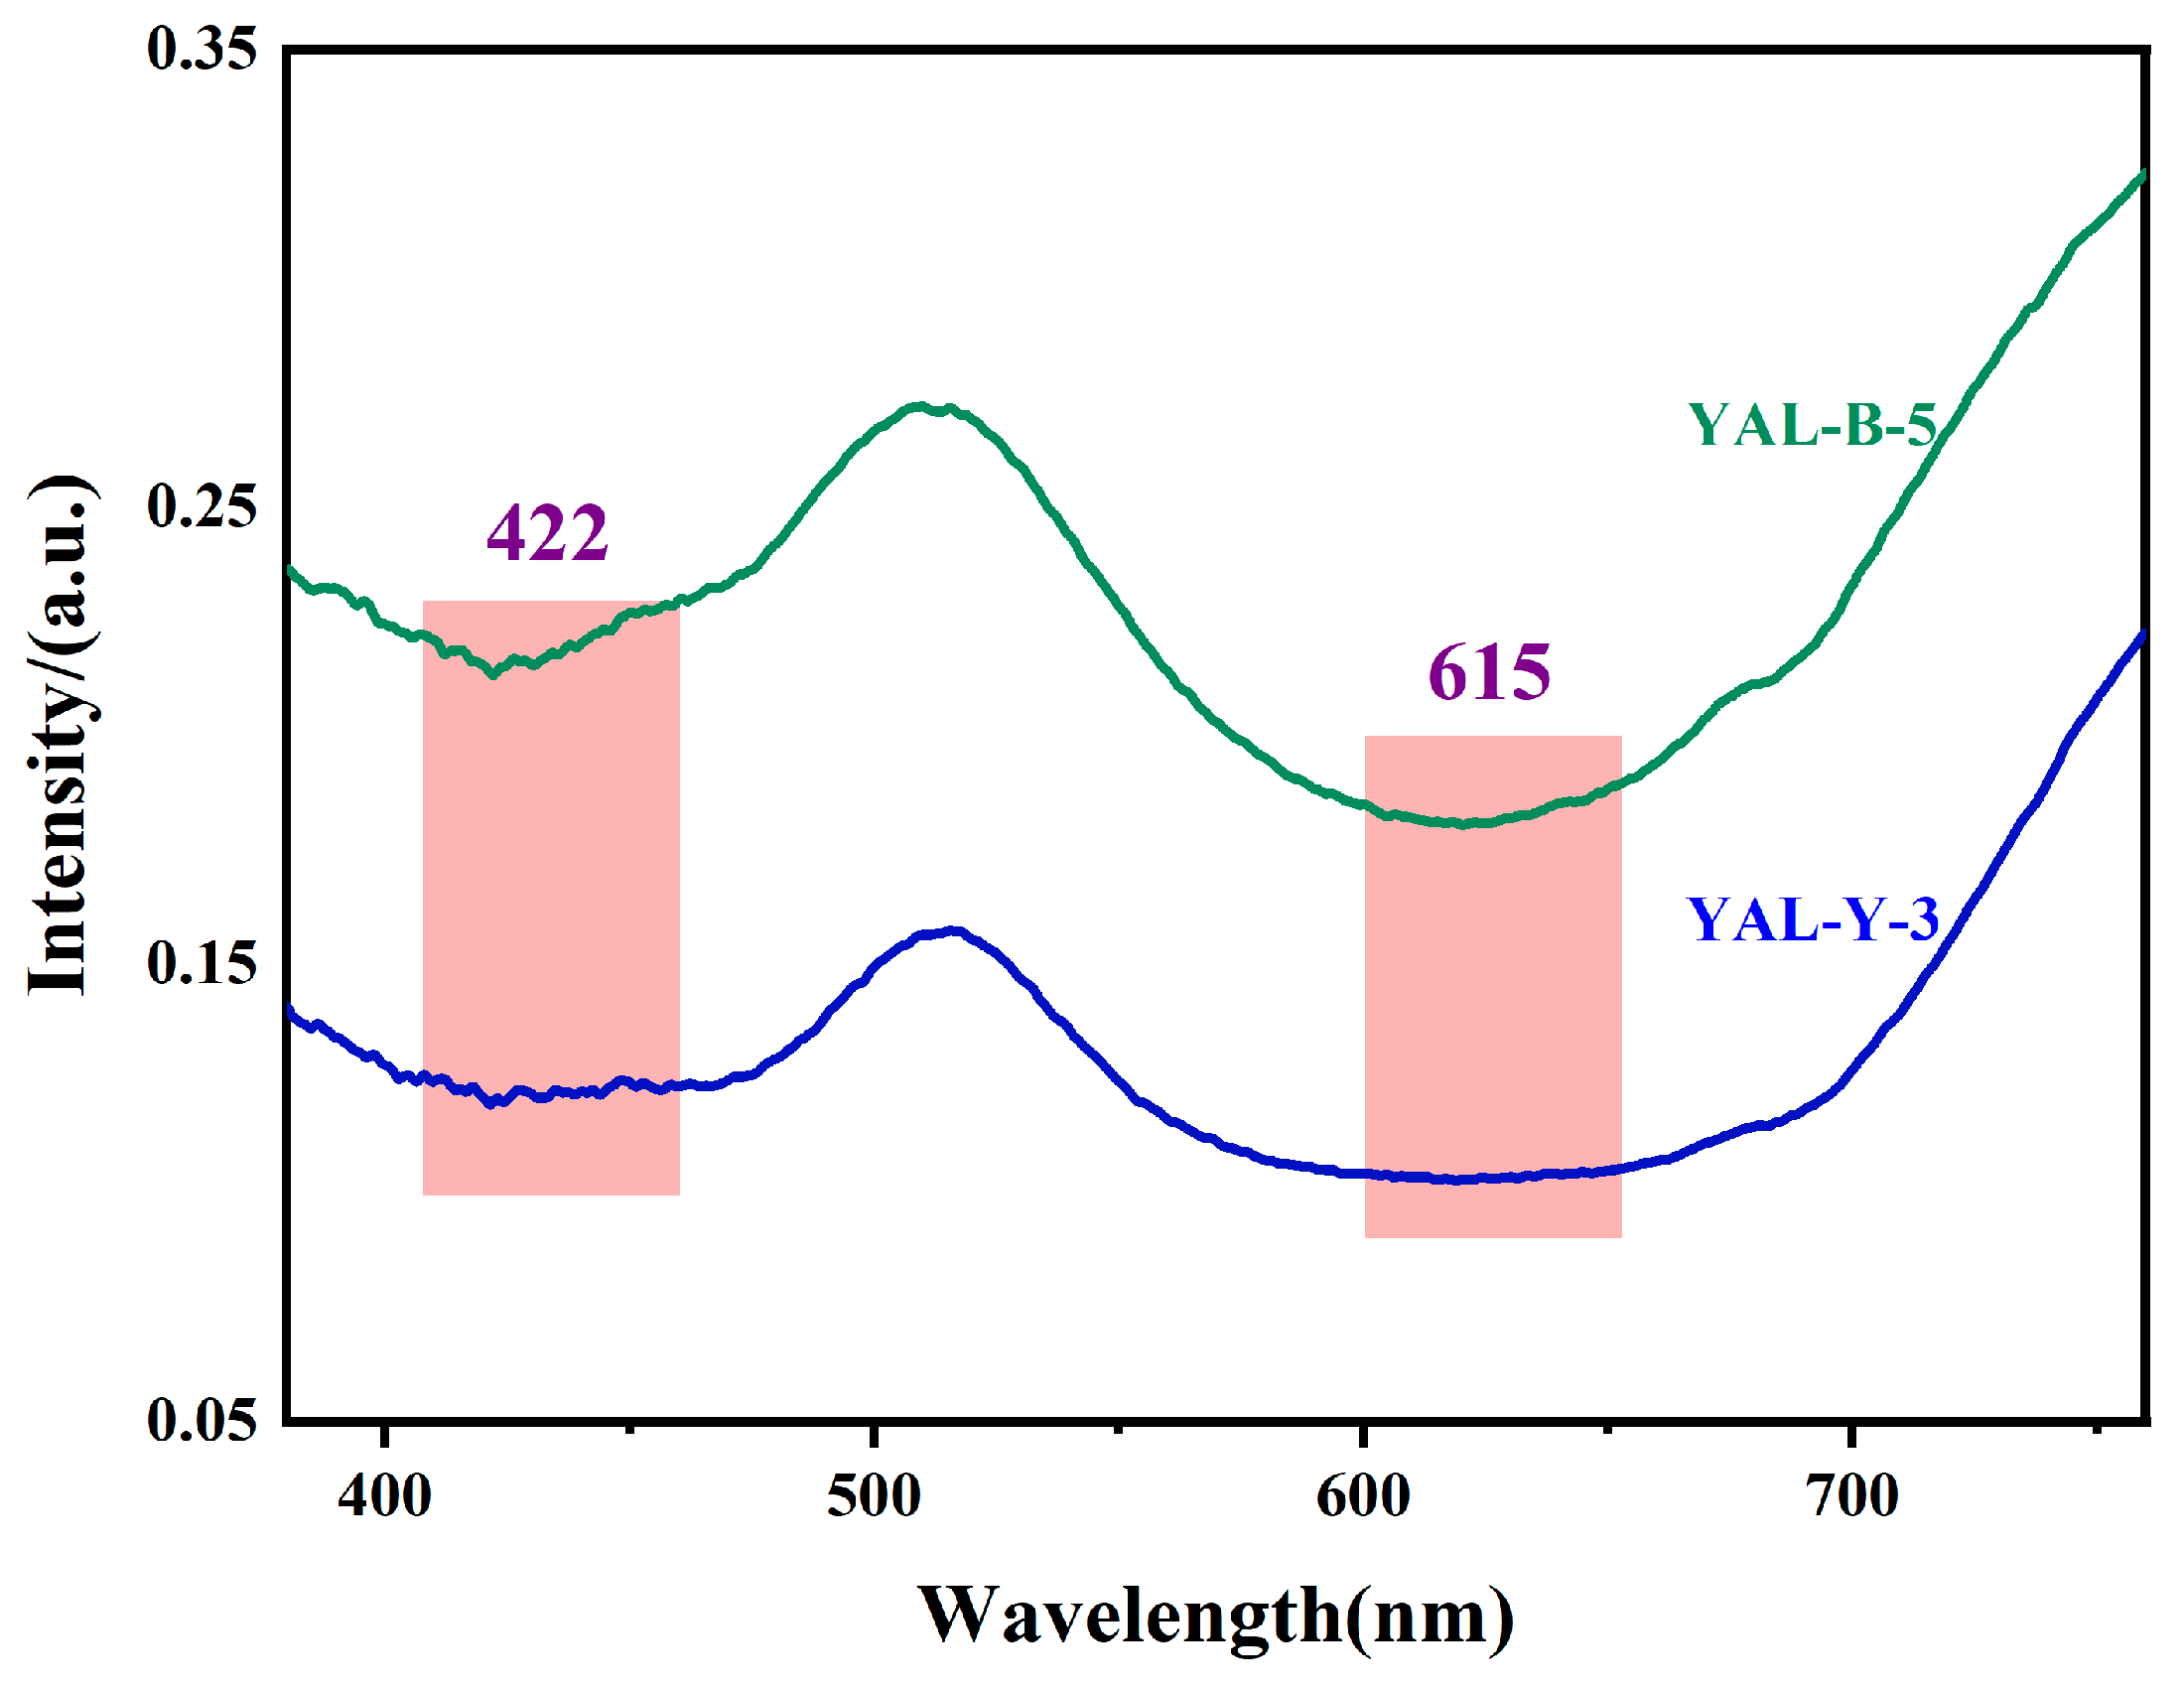
3.4. Ultraviolet–Visible Spectroscopy Tests

The green matrix of the “Ya’an Green” sample was selected for UV-Vis spectroscopy, and the results are shown in Figure 4, in which the broad absorption bands near 422 nm and 615 nm are related to the electron transition of Cr3+ [14], the absorption band near 422 nm is caused by the transition of 4A2g4T1g, and the absorption broadband near 615 nm is due to the 4A2g4T2g transition of Cr3+ [15,16]. Therefore, it can be inferred that the chromogenic element in the green matrix of the “Ya’an Green” sample is Cr.

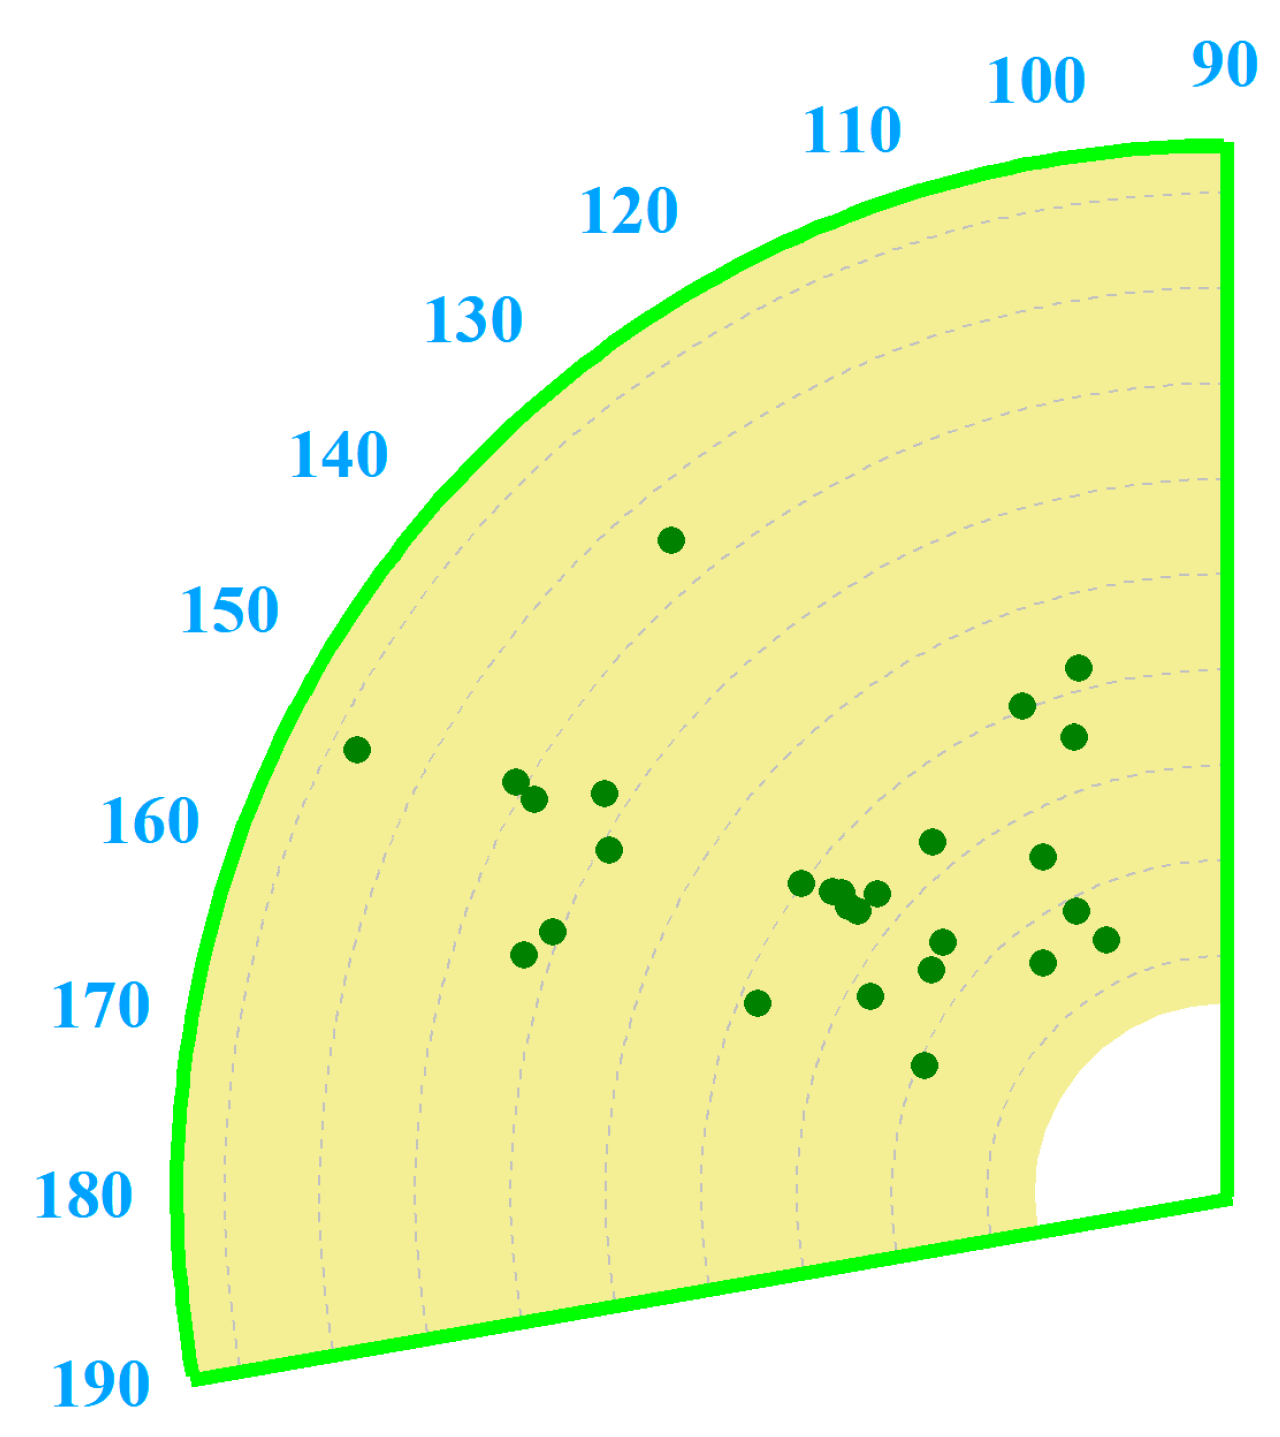
3.5. Chromaticity Test

The CIE1976 color space model is used, h is the hue angle, with values ranging from 0 to 360°: 0° for red, 120° for green, and 240° for blue. S is the saturation, and the larger the saturation, the more vibrant the color is [17].
From the initial collection of 16 samples, only those with a dominant green matrix were selected for further testing, resulting in 13 samples subjected to the chromaticity test. Point measurements were focused on homogeneous green regions, with the number of test points adjusted per sample to account for material variability, and the final number of results was 26 points in total. According to the test results (Figure 5), the hue angle h of the samples is mainly (105.53, 161.2), and the saturation S is mainly (14.65, 51.07). From the scatter plot distribution, the hue angle h is mainly concentrated in the range of (120, 150), which is consistent with the results of the visual observation.

4. Discussion

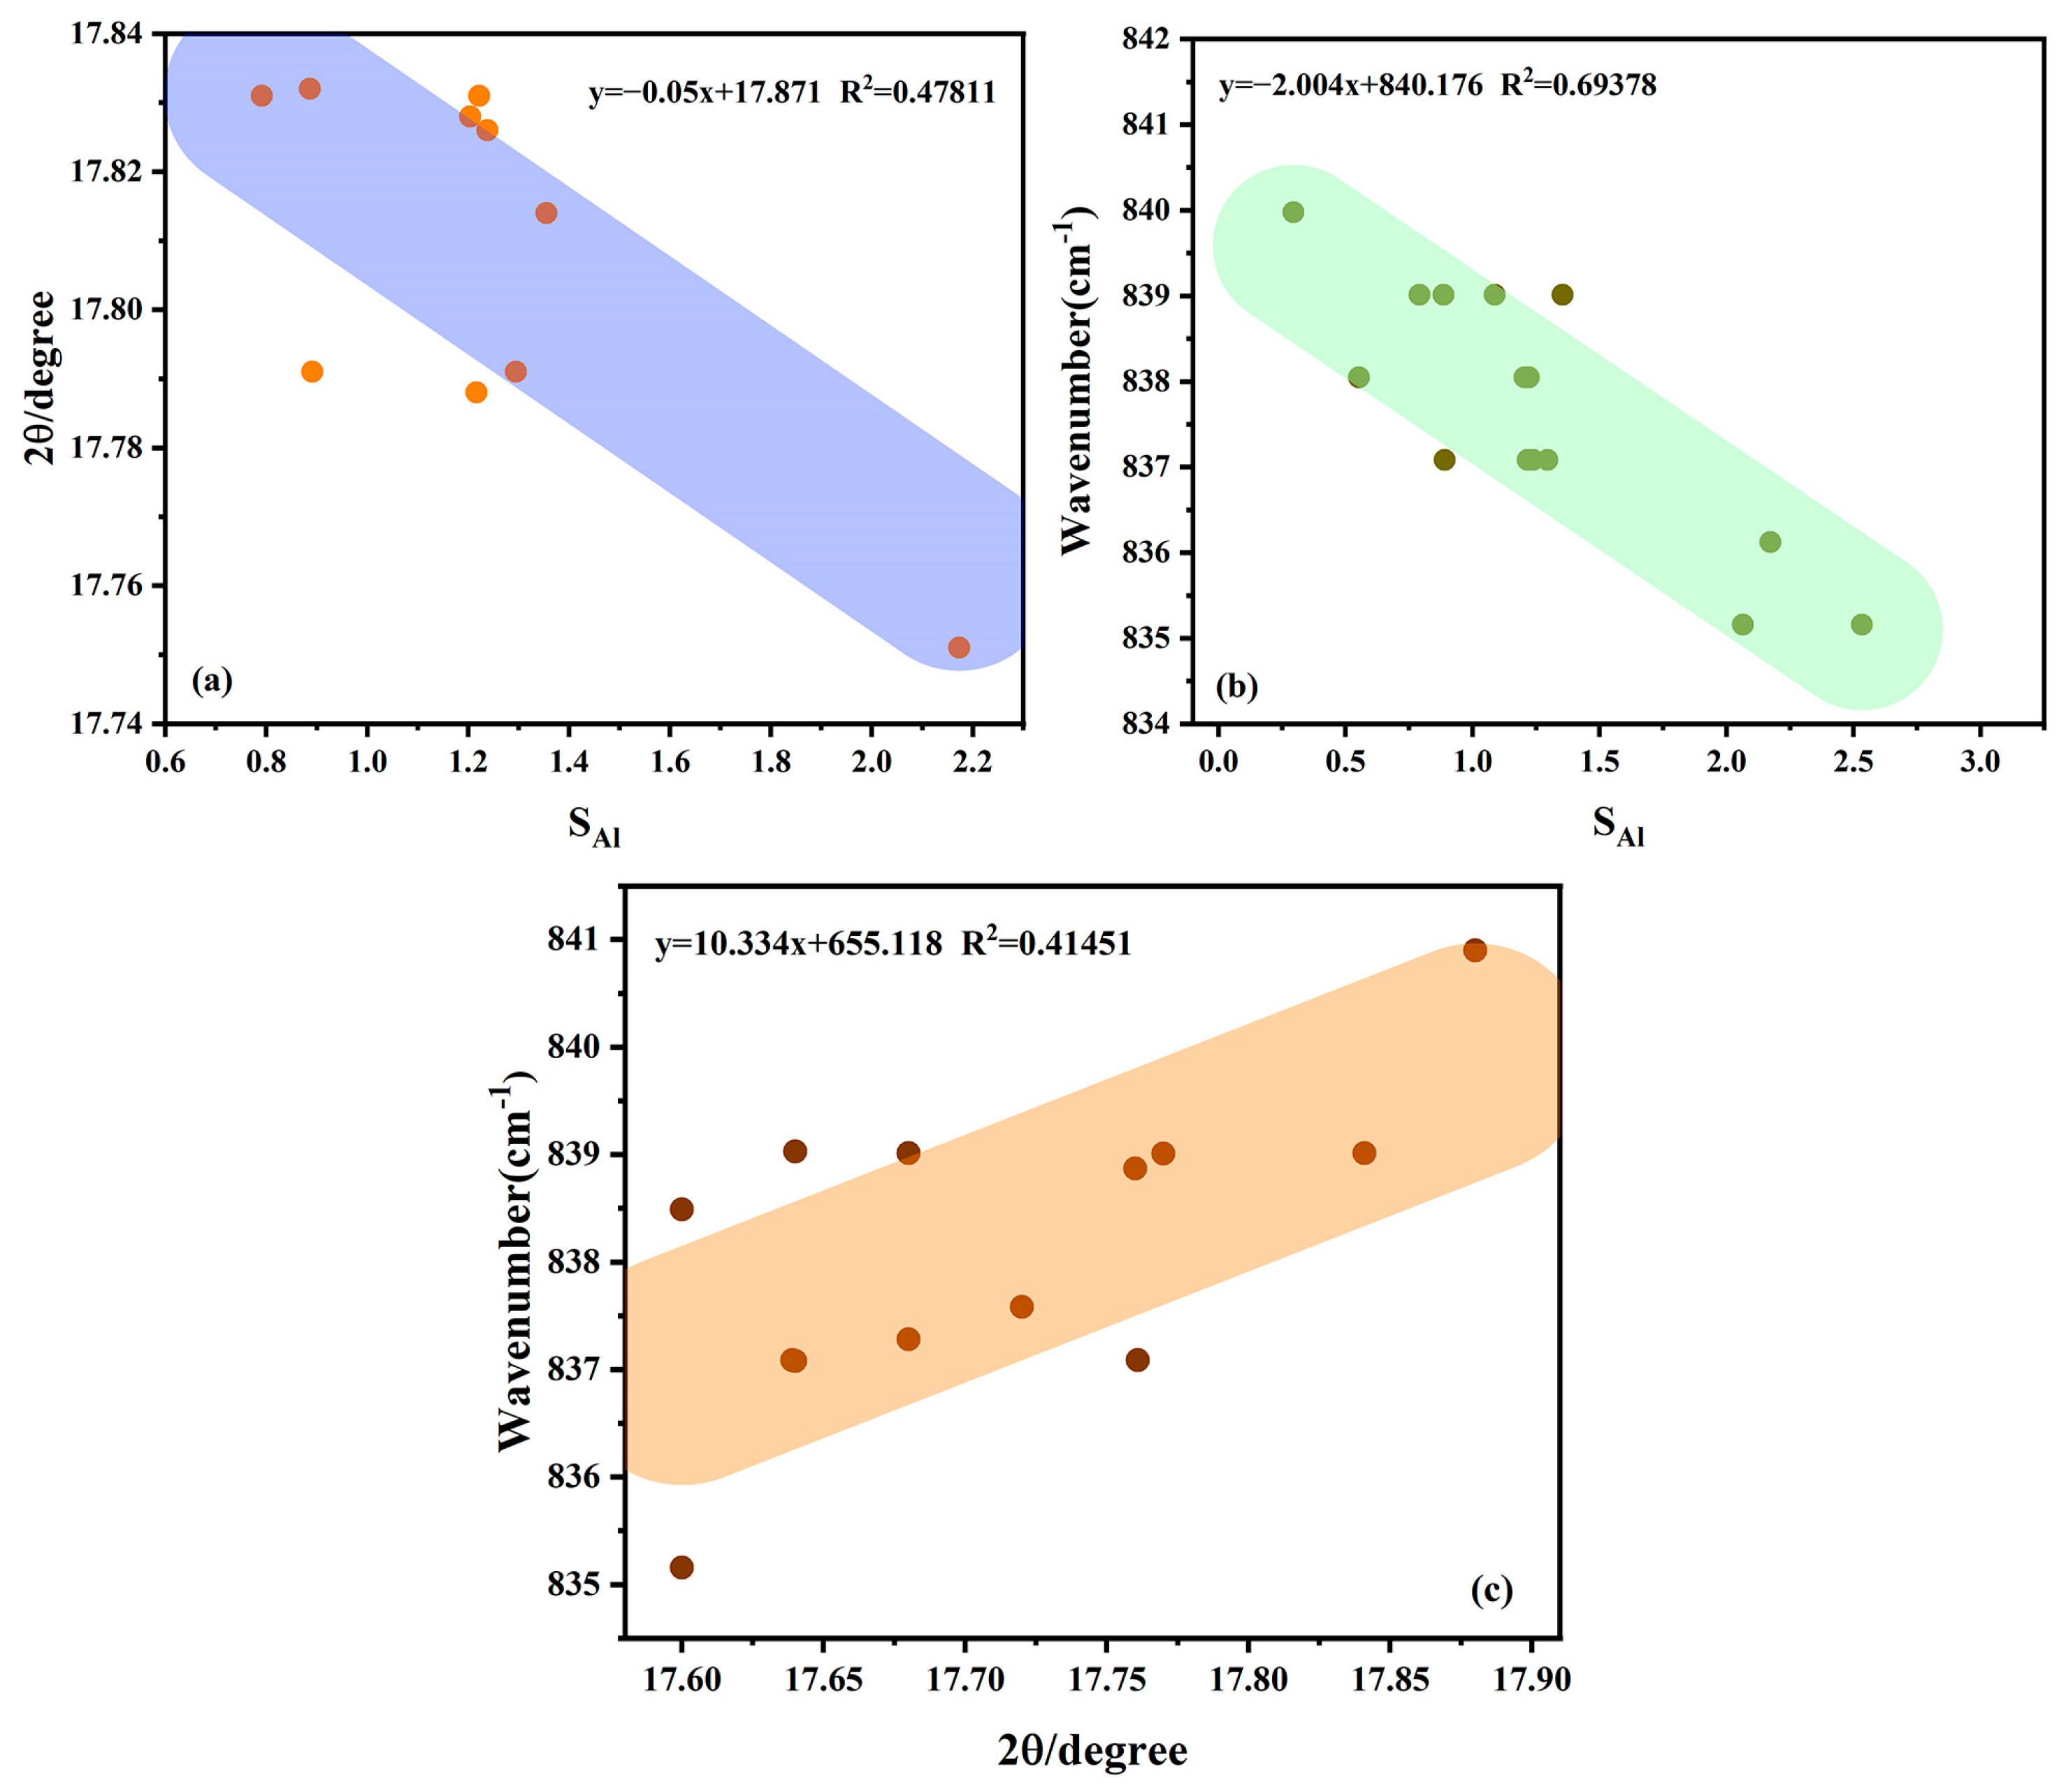
4.1. Physical Phase and Spectroscopic Discussion

The electron microprobe data were fitted and analyzed alongside XRD and IR data (Figure 6a,b). It was observed that ions such as Mg2+, Ca2+, Ti4+, Cr3+, and Fe2+ substitute for Al3+ outside the Si-O tetrahedra in the muscovite of the samples. The substitution amount of Al3+, denoted as SAl, was calculated by summing the values of the five corresponding oxides and then fitted to the XRD and IR data. A negative correlation was observed, indicating that as the substitution of Al3+ increases, the 2θ angle of the (004) crystal plane shifts to a lower angle, and the infrared absorption peak at 837 cm−1 shifts to a lower wavenumber.
The further fitting and analysis of the XRD and infrared spectra revealed that cations in the sample, such as Si4+ and Al3+, are replaced by cations with larger ionic radii, such as Ba2+, Mg2+, and Cr3+. This substitution leads to an increase in ionic radii and a shift to a lower angle due to the expansion of the cell parameters. Consequently, the greater the substitution by cations with larger ionic radii, the more the peak position shifts to the left. An analysis of the infrared absorption peak at 837 cm−1 indicates that this peak is attributed to the Si-O-Al vibration, where Al3+ is substituted by ions with larger radii, such as Mg2+, Fe2+, and Cr3+. This substitution results in shorter chemical bonds and increased energy bonding, causing the peak to shift to a lower wavenumber. A scatter linear fit of the XRD and IR spectra (Figure 6c) demonstrates a clear positive correlation, confirming that the greater the substitution of Al3+, the more the 2θ angle of the (004) crystal plane shifts to a lower angle, and the infrared absorption peak at 837 cm−1 shifts to a lower wavenumber. This finding further validates the above analysis.

4.2. Chromaticity Discussion

Through observation and calculation, it was found that the more Cr3+ content there was in the samples, the closer the hue angle h was to 136°, so 136° was taken as the mean value standard, and the Cr3+ content was named as SCr. The final hue angle fitting value H was obtained by subtracting the mean value from the hue angle h of the selected samples and then taking the absolute value. Based on the UV–visible spectral analysis and the relevant data of the previous authors [1,2,3], it can be concluded that the color-causing element of the green matrix of Ya’an green is Cr3+. Therefore, the Cr3+ content and the final hue angle fitting value H were fitted (Figure 7), and it can be clearly seen that the Cr3+ content and the fitting value H show a negative correlation, which means that the higher the Cr3+ content, the smaller the difference is between its hue angle h and the average value of 136°, and, therefore, the sample color is closer to the dark green and vice versa the more the sample deviates from the dark green.

5. Conclusions

In summary, in this paper, ‘Ya’an Green’ seal stone is mainly selected as the research object, and its ion substitution behavior and chromaticity are investigated. The experimental results show that the substitution of Al3+ ions in white mica, which is the main mineral component of ‘Ya’an green’, will lead to different degrees of shifts in the 2θ of the crystal plane of the X-ray diffraction results (004) and the infrared 837 cm−1. In the chromaticity experiments, it is found that the higher the content of Cr3+ and the closer the hue angle h is to 136°, the more the sample color takes on a darker green color. These results indicate that the ion substitution behavior affects the crystal lattice, and the chromatographic fitting model provides a new methodological reference for the study of seal stone color, a new idea for the study of the relationship between the color of seal stone and its color-causing elements and the amount of elemental substitution, as well as important practical significance and a broad application prospect for the future value assessment and grading in the field of seal stone.

Author Contributions

Conceptualization, Y.S. and E.Z.; methodology, Y.S.; investigation, Y.S., Z.Z., M.X. and Z.P.; resources, Y.W.; writing—original draft preparation, Y.S., Z.W., S.Y., B.M. and E.Z.; writing—review and editing, Y.S., Z.W. and S.Y.; supervision, S.Y. and E.Z.; funding acquisition, B.M., S.Y. and E.Z. All authors have read and agreed to the published version of the manuscript.

Funding

This research was supported by the National Natural Science Foundation of China. (Grant No. 52262018) and the Scientific Research Fund Project of Yunnan Provincial Department of Education (Grant No. 2025J0078).

Data Availability Statement

All data are included in the article; further inquiries can be made to the respective authors.

Acknowledgments

We sincerely thank our teachers for their guidance and revision of this paper, our students for their help in the experiments, and Wang of Kunming Customs Technology Center for his assistance in the experimental apparatus.

Conflicts of Interest

The authors declare no conflicts of interest.

References

  1. Wang, L.M. Gemological and Mineralogical Study of “Xi’an Green” and “Ya’an Green”. Fujian Anal. Test. 2021, 30, 45–49. [Google Scholar]
  2. Li, J.; Liu, Y. Mineralogical Characteristics of Muscovite-Rutile Seal Stones. Mineral. Petrol. 2023, 43, 11–17. [Google Scholar]
  3. Zhao, Z.; Liu, K.; Zheng, H.; Chen, T. Gemological and Mineralogical Characteristics of “Ya’an Green” Seal Stones. J. Gems Gemol. 2024, 26, 47–56. [Google Scholar]
  4. Yuan, Y.; Shi, G.; He, M.; Liu, Y. Application of Spectroscopic Studies in Seal Stones: A Case Study of Changhua Stone. Mineral. Petrol. 2011, 31, 18–24. [Google Scholar]
  5. Chen, T.; Han, W.; Li, T.; Zhou, Q. Mineralogical Characteristics of Muscovite in Three Types of Green Seal Stones from China. Earth Sci. J. China Univ. Geosci. 2012, 37, 981–988. [Google Scholar]
  6. Chen, X.; Chen, T. Gemological and Mineralogical Characteristics of Qingtian “Longdan Stone”. In Proceedings of the International Academic Exchange Conference on Jewelry and Precious Stones of China, Beijing, China, 13–14 November 2019. [Google Scholar]
  7. Brigatti, F.M.; Frigieri, P.; Poppi, L. Crystal Chemistry of Mg-, Fe-bearing Muscovites-2M1. Am. Mineral. 2015, 83, 775–785. [Google Scholar] [CrossRef]
  8. Giovanni, F.; Gabriella, I. Structural Features of Micas. Rev. Mineral. Geochem. 2002, 46, 117–153. [Google Scholar]
  9. Zhang, Z.; Dai, J.; Wang, X.; Hu, Z.; Wan, X.; Peng, B.; Fu, M. Application of Spectroscopic Characteristics of Muscovite in Porphyry Tungsten Deposits: A Case Study Involving the Shimensi Deposit in Northern Jiangxi. Minerals 2023, 13, 256. [Google Scholar] [CrossRef]
  10. Zhou, W.B.; Qin, D.M.; Wang, H.T.; Chen, T.; Wang, Z.W. Gemological, Mineralogical and Spectroscopic Study of Indian “Longdan Stone”. Spectrosc. Spectr. Anal. 2023, 43, 1895–1899. [Google Scholar]
  11. Jin, X.; Li, G.; Liao, B.; Li, X.; Long, C. Gemological and vibrational spectroscopic characterization of a mica-quartz jade ‘strawberry crystal’. J. Gems Gemol. 2021, 23, 19–28. [Google Scholar]
  12. Williams, Q.; Knittle, E.; Scott, H.P.; Liu, Z. The High-Pressure Behavior of Micas: Vibrational Spectra of Muscovite, Biotite, and Phlogopite to 30 GPa. Am. Mineral. 2015, 97, 241–252. [Google Scholar] [CrossRef]
  13. Zhang, M.; Redfern, S.A.T.; Salje, E.K.H.; Carpenter, M.A.; Hayward, C.L. Thermal Behavior of Vibrational Phonons and Hydroxyls of Muscovite in Dehydroxylation: In Situ High-Temperature Infrared Spectroscopic Investigations. Am. Mineral. 2010, 95, 1444–1457. [Google Scholar] [CrossRef]
  14. Maksimovic, Z.; White, J.L.; Logar, M. Chromium-bearing Dickite and Chromium-bearing Kaolinite from Teslic, Yugoslavia. Clays Clay Miner. 1981, 29, 213–218. [Google Scholar] [CrossRef]
  15. Dyar, M.D.; Schaefer, M.W.; Sklute, E.C.; Bishop, J.L. Mössbauer Spectroscopy of Phyllosilicates: Effects of Fitting Models on Recoil-free Fractions and Redox Ratios. Clay Miner. J. Clay Miner. Group Mineral. Soc. 2008, 43, 3–33. [Google Scholar] [CrossRef]
  16. Yan, X.; Yue, S.; Lv, X. Gemological Characteristics and Color Origin Analysis of Green Kyanite. Laser Optoelectron. Prog. 2021, 58, 1516029. [Google Scholar]
  17. Xu, M.; Zu, E.; Zhan, J. Colorimetric Study of Nanhong Agate. J. Kunming Univ. Sci. Technol. Nat. Sci. Ed. 2017, 42, 13–18. [Google Scholar]
Figure 1. “Ya’an Green” samples: (a) sample with a predominantly yellow matrix; (b) sample with a predominantly dark matrix; (c) sample with a predominantly green matrix.
Crystals 15 00420 g001
Figure 2. X-ray diffraction patterns of “Ya’an Green” samples: (a) green and yellow minerals in sample YAL-Y-1; (b) paragonite sample; (c) white–green sample; (d) comparison of peak position shifts between standard muscovite and Ba2+-V5+-rich muscovite. Note: Experiments were conducted by independently selecting the green matrix and yellow matrix of each sample as needed. Translated according to the English standards of the published journal.
Crystals 15 00420 g002
Figure 3. “Ya’an Green” samples: (a) infrared spectrum of the green matrix; (b) high-wavenumber infrared spectrum of the green matrix; (c) infrared shift diagram of the green matrix at 837 cm−1 wavenumber.
Crystals 15 00420 g003
Figure 4. “Ya’an Green” sample: UV-Vis spectrum of the green matrix.
Crystals 15 00420 g004
Figure 5. hs color (°) distribution diagram of the green matrix in “Ya’an Green” samples.
Crystals 15 00420 g005
Figure 6. “Ya’an Green” samples: (a) linear fitting scatter plot of Al3+ substitution amount and XRD data; (b) linear fitting scatter plot of Al3+ substitution amount and infrared wavenumber; (c) linear fitting scatter plot of XRD and infrared wavenumber.
Crystals 15 00420 g006
Figure 7. “Ya’an Green” samples: linear fitting scatter plot of Cr3+ content and fitted hue angle H.
Crystals 15 00420 g007
Table 1. Electron microprobe data of some samples of “Ya’an Green”.
SampleNa2OMgOAl2O3SiO2K2OCaOTiO2Cr2O3FeO
YAL-Y-10.0440.01944.53043.5229.7310.0000.3020.0161.836
YAL-Y-1.21.0070.33041.64943.37411.4370.0600.0590.0462.039
YAL-G-10.0260.01846.18441.7809.9450.0000.7440.0371.266
YAL-G-50.0350.02244.59444.5869.5480.0000.9100.0130.294
YAL-G-5.20.2340.01050.06744.0664.4290.0020.9260.0100.256
YAL-Y-4.20.0610.01546.55843.0969.3990.0000.6800.0060.185
YAL-Y-40.0320.02943.90044.62910.2170.0000.9050.0220.266
YAL-Y-50.0340.01746.29142.67710.2070.0060.5450.0130.210
YAL-Y-5.20.0170.01246.68441.49210.5120.0001.0860.0210.176
YAL-G-4.20.0870.02246.20742.9009.7190.0000.8520.0040.209
YAL-Y-28.7600.17843.50041.6644.9270.2500.0830.1500.489
YAL-Y-3.20.0710.01345.06944.17610.3900.0010.0420.0030.236
YAL-Y-30.0140.02443.69144.84410.5610.0000.5070.0220.339
YAL-G-40.0730.01645.93743.0689.7050.0000.9830.0020.216
YAL-G-10.0280.01947.75540.86210.0000.0000.3020.0041.030
YAL-B-5.20.1570.00847.11145.5746.6050.0040.1850.0180.338
Disclaimer/Publisher’s Note: The statements, opinions and data contained in all publications are solely those of the individual author(s) and contributor(s) and not of MDPI and/or the editor(s). MDPI and/or the editor(s) disclaim responsibility for any injury to people or property resulting from any ideas, methods, instructions or products referred to in the content.

