1. Introduction
Phononic crystals (PnCs) are artificially designed periodic structures that exhibit the characteristic of prohibiting elastic wave propagation within a certain frequency range [
1]. Based on the mechanisms of bandgap formation, they can be primarily classified into Bragg scattering bandgaps [
1] and locally resonant bandgaps [
2]. The bandgap properties of PnCs give rise to a variety of physical phenomena, and they have wide applications in designs such as vibration isolators [
3], noise suppressors [
4], and acoustic transducers [
5,
6].
One of the main focuses of PnC research is the tuning of their bandgaps. Current studies are primarily centered on the adjustable optimization of the materials or geometric parameters [
7] of PnCs. By selecting materials with different mechanical properties (such as varying densities, elastic moduli, and Poisson’s ratios) and varying structural parameters, PnC units are reconstructed to modulate bandgap characteristics. Many researchers have invested considerable time in designing programmable PnC structures [
8], uncovering numerous excellent performance features. To achieve simpler and more flexible control, scholars have begun to study the impact of external excitations on the modulation of PnC bandgaps. External excitations such as electric fields [
9], magnetic fields [
10], mechanical loads [
11], and electromagnetic coupling [
12] can alter the structure and material properties of PnCs, enabling the real-time reversible control of the bandgap. Due to these methods’ simplicity and ease of implementation, they are considered ideal for regulating bandgaps using external excitations.
When the shape or filling ratio of a row of cells changes, linear defects are introduced into perfect PnCs, and waves within the bandgap can propagate along these linear defects. Therefore, inner defects have significant application value in sound filters and acoustic sensors [
13]. The propagation of reconstructed waves can be guided by translating scatterers [
14]; multi-modal shape reconstruction can adjust the bandgap and wave propagation through magnetic–mechanical coupling [
15]; and axial forces combined with voltage can tune topological interface states to regulate wave propagation [
16]. Current studies on waveguide modulation mostly focus on guiding the topological shape changes in PnCs induced by external excitations, which in turn cause different defect states that regulate the direction of wave propagation. The broad application potential of PnCs is closely linked to the characteristics of their band structure.
Several studies have reported on the thermal control of PnC bandgaps, such as studies on the thermal modulation of the longitudinal bandgap in one-dimensional bimaterial PnC beams made of epoxy resin and Terfenol-D [
17]; the thermal effects of the bandgap of the interfacial bonding layer in one-dimensional PnCs made of two materials [
18]; the modulation of the bending bandgap of a PnC plate under the effects of thermal stresses [
19]; the thermal deformation modulation of the bending bandgap of an acoustic sensor; the bending wave bandgap regulation in a PnC plate under thermal stress [
20]; the dispersion properties of solid–liquid transition phase change materials introduced into PnCs at different temperatures [
21]; the thermal sensitivity of Bragg-type and locally resonant-type PnCs at high symmetry points [
22]; and the acoustic bandgap properties of penta-mode metamaterials in a thermal environment [
23]. Regarding defect states, studies have investigated point defect modes and bending vibration energy harvesting behaviors in one-dimensional PnC beams in a localized thermal environment [
24] and the manipulation of longitudinal wave linear defects and L-shaped defects in waveguides in memory polymer thin plates under non-uniform periodic thermal fields [
25].
For PnCs of rubber–metal-based materials, temperature greatly influences the mechanical properties of rubber materials. Previous research on PnCs has primarily focused on the effects of thermal expansion on the structure, without considering the heat source loading and non-uniform temperature field; on the other hand, research on the thermal effects of the bending wave of PnCs is mainly focused on the bandgap, with little research on defect states.
In this paper, based on the finite element method, a non-uniform temperature field is realized using a localized heat source to control the bending wave bandgap of a PnC unit cell and the bending waveguide in PnC plates. The PnCs used in this article are rubber, aluminum, and lead materials, which are commonly used in the field of PnCs and have been used in related research on PnCs [
19]. Rubber is a connecting component that provides equivalent spring stiffness for the resonant system, lead cross-shaped mass blocks provide equivalent mass, and aluminum frames provide attachment support for the spring–mass system.
Section 1 describes the finite element modeling of PnCs in a thermal environment.
Section 2 describes the modulation of the bending wave bandgap of the PnC by adjusting the heat flux.
Section 3 describes the regulation of thermal flux to modulate the PnC supercell’s bending waveguide properties.
2. Finite Element Modeling of Thermal Effects
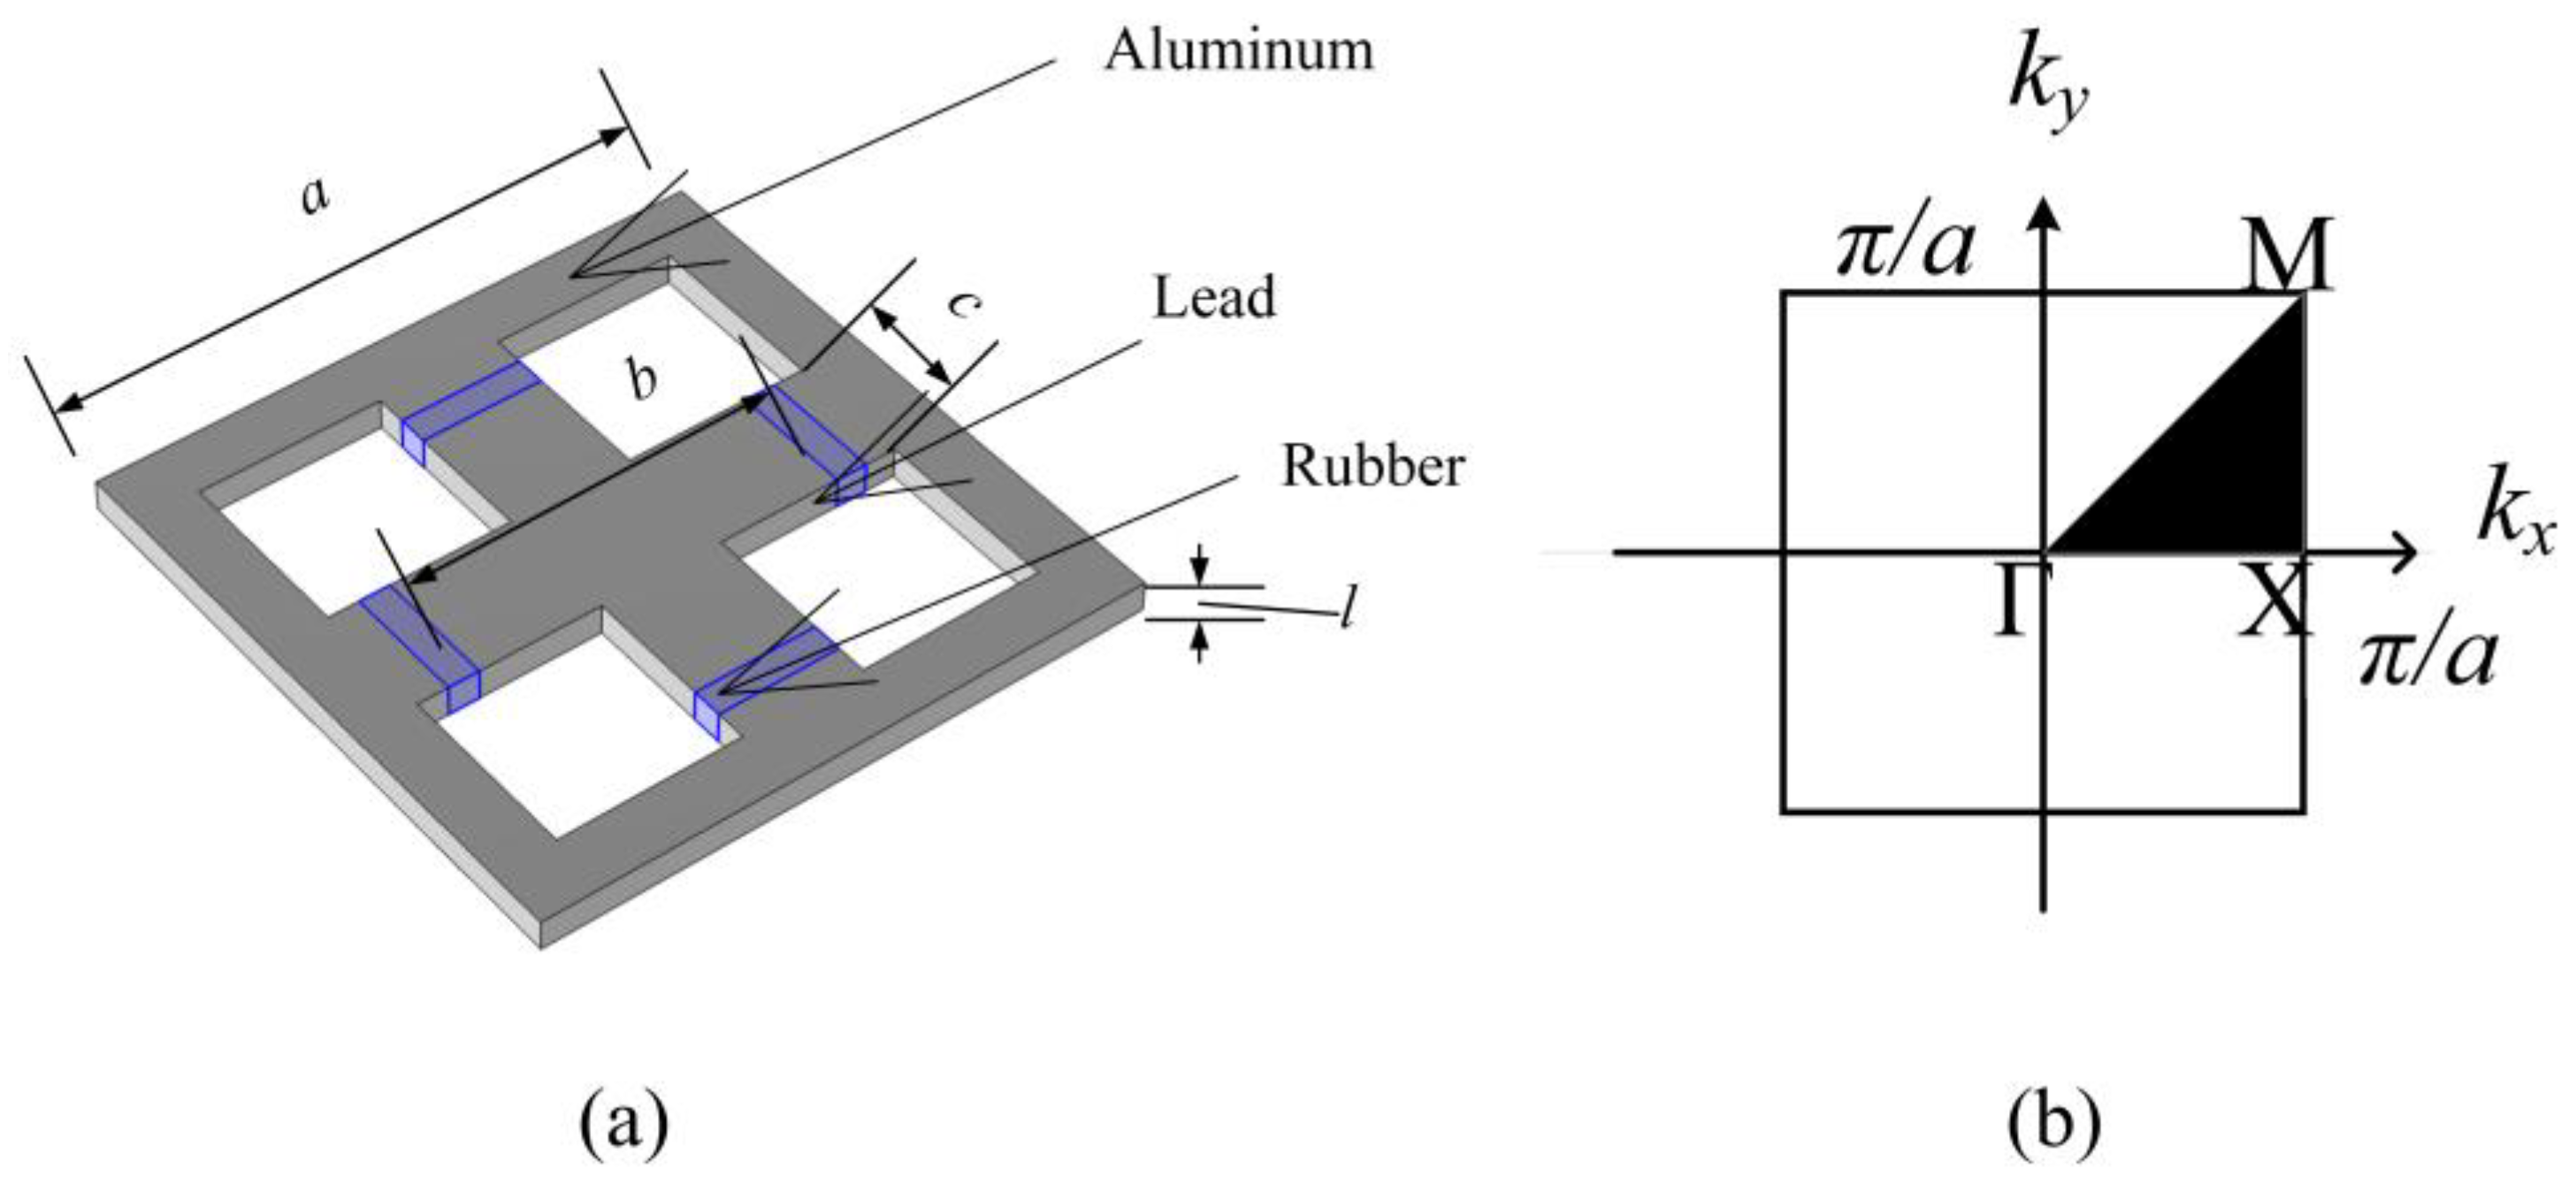
Figure 1a shows the unit structure, and the first Brillouin zone considered in this paper is also shown, where
a = 10 mm is the lattice constant,
b = 7 mm is the length of the cross-shaped mass block,
c = 2 mm is the width of the mass block, and
l = 0.5 mm is the lattice thickness. The structure comprises an aluminum frame, a lead center mass block, and rubber connections. The following material parameters of aluminum, rubber, and lead are used. Young’s moduli:
Ea = 77 GPa,
Er = 10.9 MPa, and
El = 11 GPa; mass densities:
ρa = 2730 kg/m
3,
ρr = 1300 kg/m
3, and
ρl = 11344 kg/m
3; Poisson’s ratios:
μa = 0.35,
μr = 0.47, and
μL = 0.45; and thermal conductivities:
ka = 230 W/(m·K),
kr = 0.2 W/(m·K), and
kl = 34 W/(m·K). Metal films were attached around the rubber connection components as a heat source, with the metal film’s thickness being sufficiently thin; thus, its effect on the structure was neglected.
In analyzing the thermal effects of the material parameters, no attention is paid to the process of considering heat conduction; only the steady-state temperature field distribution at different heat fluxes is considered, so the inclusion of the time derivative term is neglected, and the steady-state heat conduction equation for solids is given by
where
T is the position function of the temperature field,
k is the thermal conductivity, and
Q is the heat source. Heat is exchanged freely with the outside world on other locations in the lattice, so thermal conduction (Newman boundary condition) is chosen as the boundary condition
where
Tref is the ambient temperature, and the thermal convection coefficient is
h. When considering the bandgap tuning of the unit cell, since there is no heat flux at the boundaries of the periodic structure, adiabatic conditions are applied at the side boundaries.
To better illustrate the general impact of thermal effects on the beam structure, the temperature range analyzed in this paper spans from 303 K to 353 K, which corresponds to typical operating conditions. The reference environmental temperature
Tref is 303 K, and the convective heat transfer coefficient
h is 0.025 mW/(mm
2·K). The variation in the temperature field leads to significant differences in the mechanical properties of the rubber material. Based on the existing research literature [
26], the Young’s modulus of rubber is expressed as an interpolation function that varies with temperature, as shown in
Table 1.
The generalized eigenvalue equation for the PnC unit cell is expressed as
In this equation,
Kc is the stiffness matrix,
Mc is the mass matrix, and
u(
r) is the displacement eigenvector. Additionally, this study focuses on the bending modes of PnCs. Therefore, the polarization rate is used to differentiate between bending modes and other modes. The polarization rate is mapped using scatter point color, and the formula for the polarization rate is expressed as
where
u denotes the normalized displacement, the asterisk * denotes complex conjugation, and
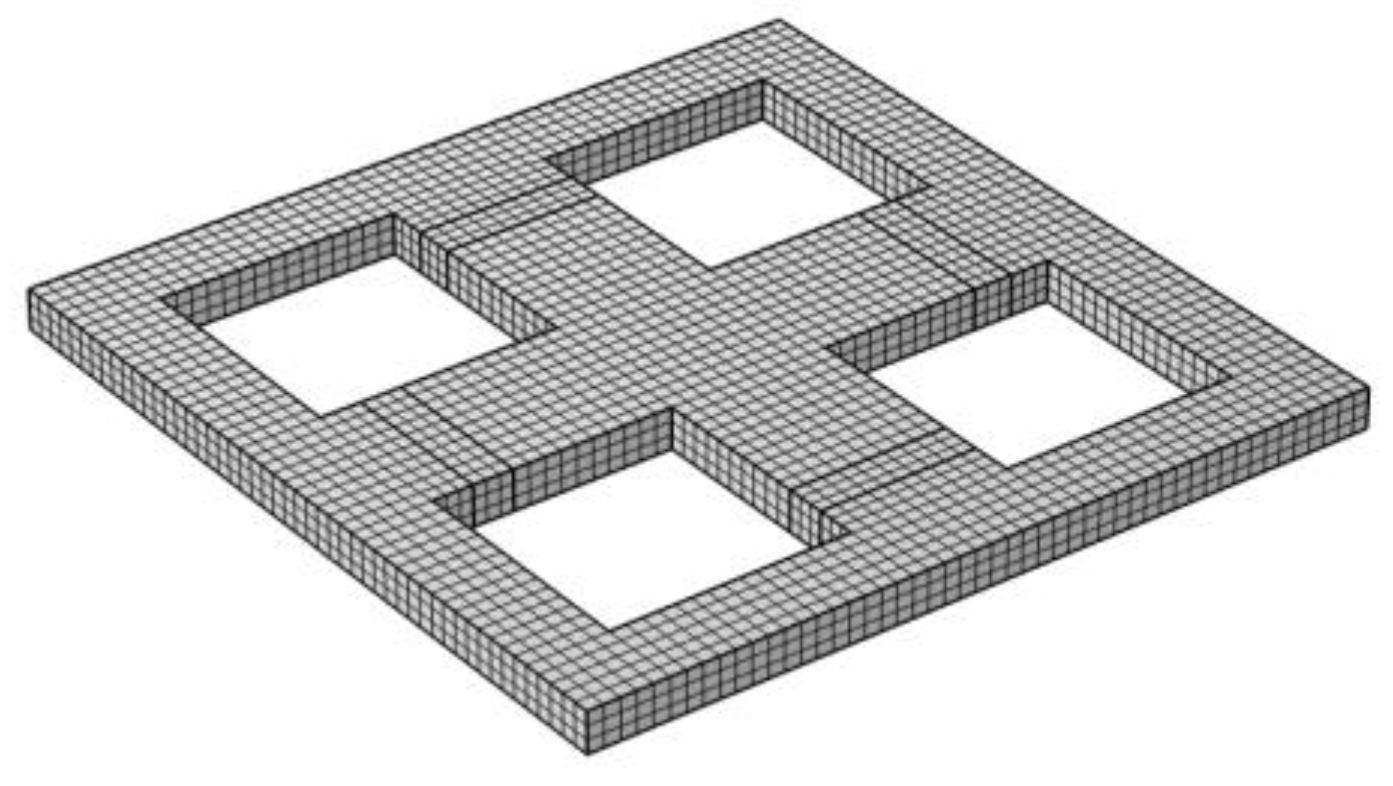
V denotes the entire domain of the unit cell lattice. The bluer the color of the point in the band structure, the greater the polarization of the out-of-plane displacement field; conversely, the redder the color of the point, the greater the polarization of the in-plane displacement field under that mode. The finite element model mesh division of the PnC is shown in
Figure 2, using hexahedral mesh division with a maximum mesh size of 0.2 mm.
3. Bending Bandgap Modulation
To investigate how the thermal environment affects the bending wave bandgap, a three-dimensional structure of the PnC under thermal field influence was established using Multiphysics finite element software. Floquet periodic boundary conditions were applied to the
x-y boundaries of the PnC to simulate infinite periodicity. A Bloch wave vector
k was introduced, and the wave vector was scanned along the boundary of the first Brillouin zone, X-M-Γ-X. For each given value of
k, the characteristic frequency
ω was calculated, with the first Brillouin zone shown in
Figure 1b.
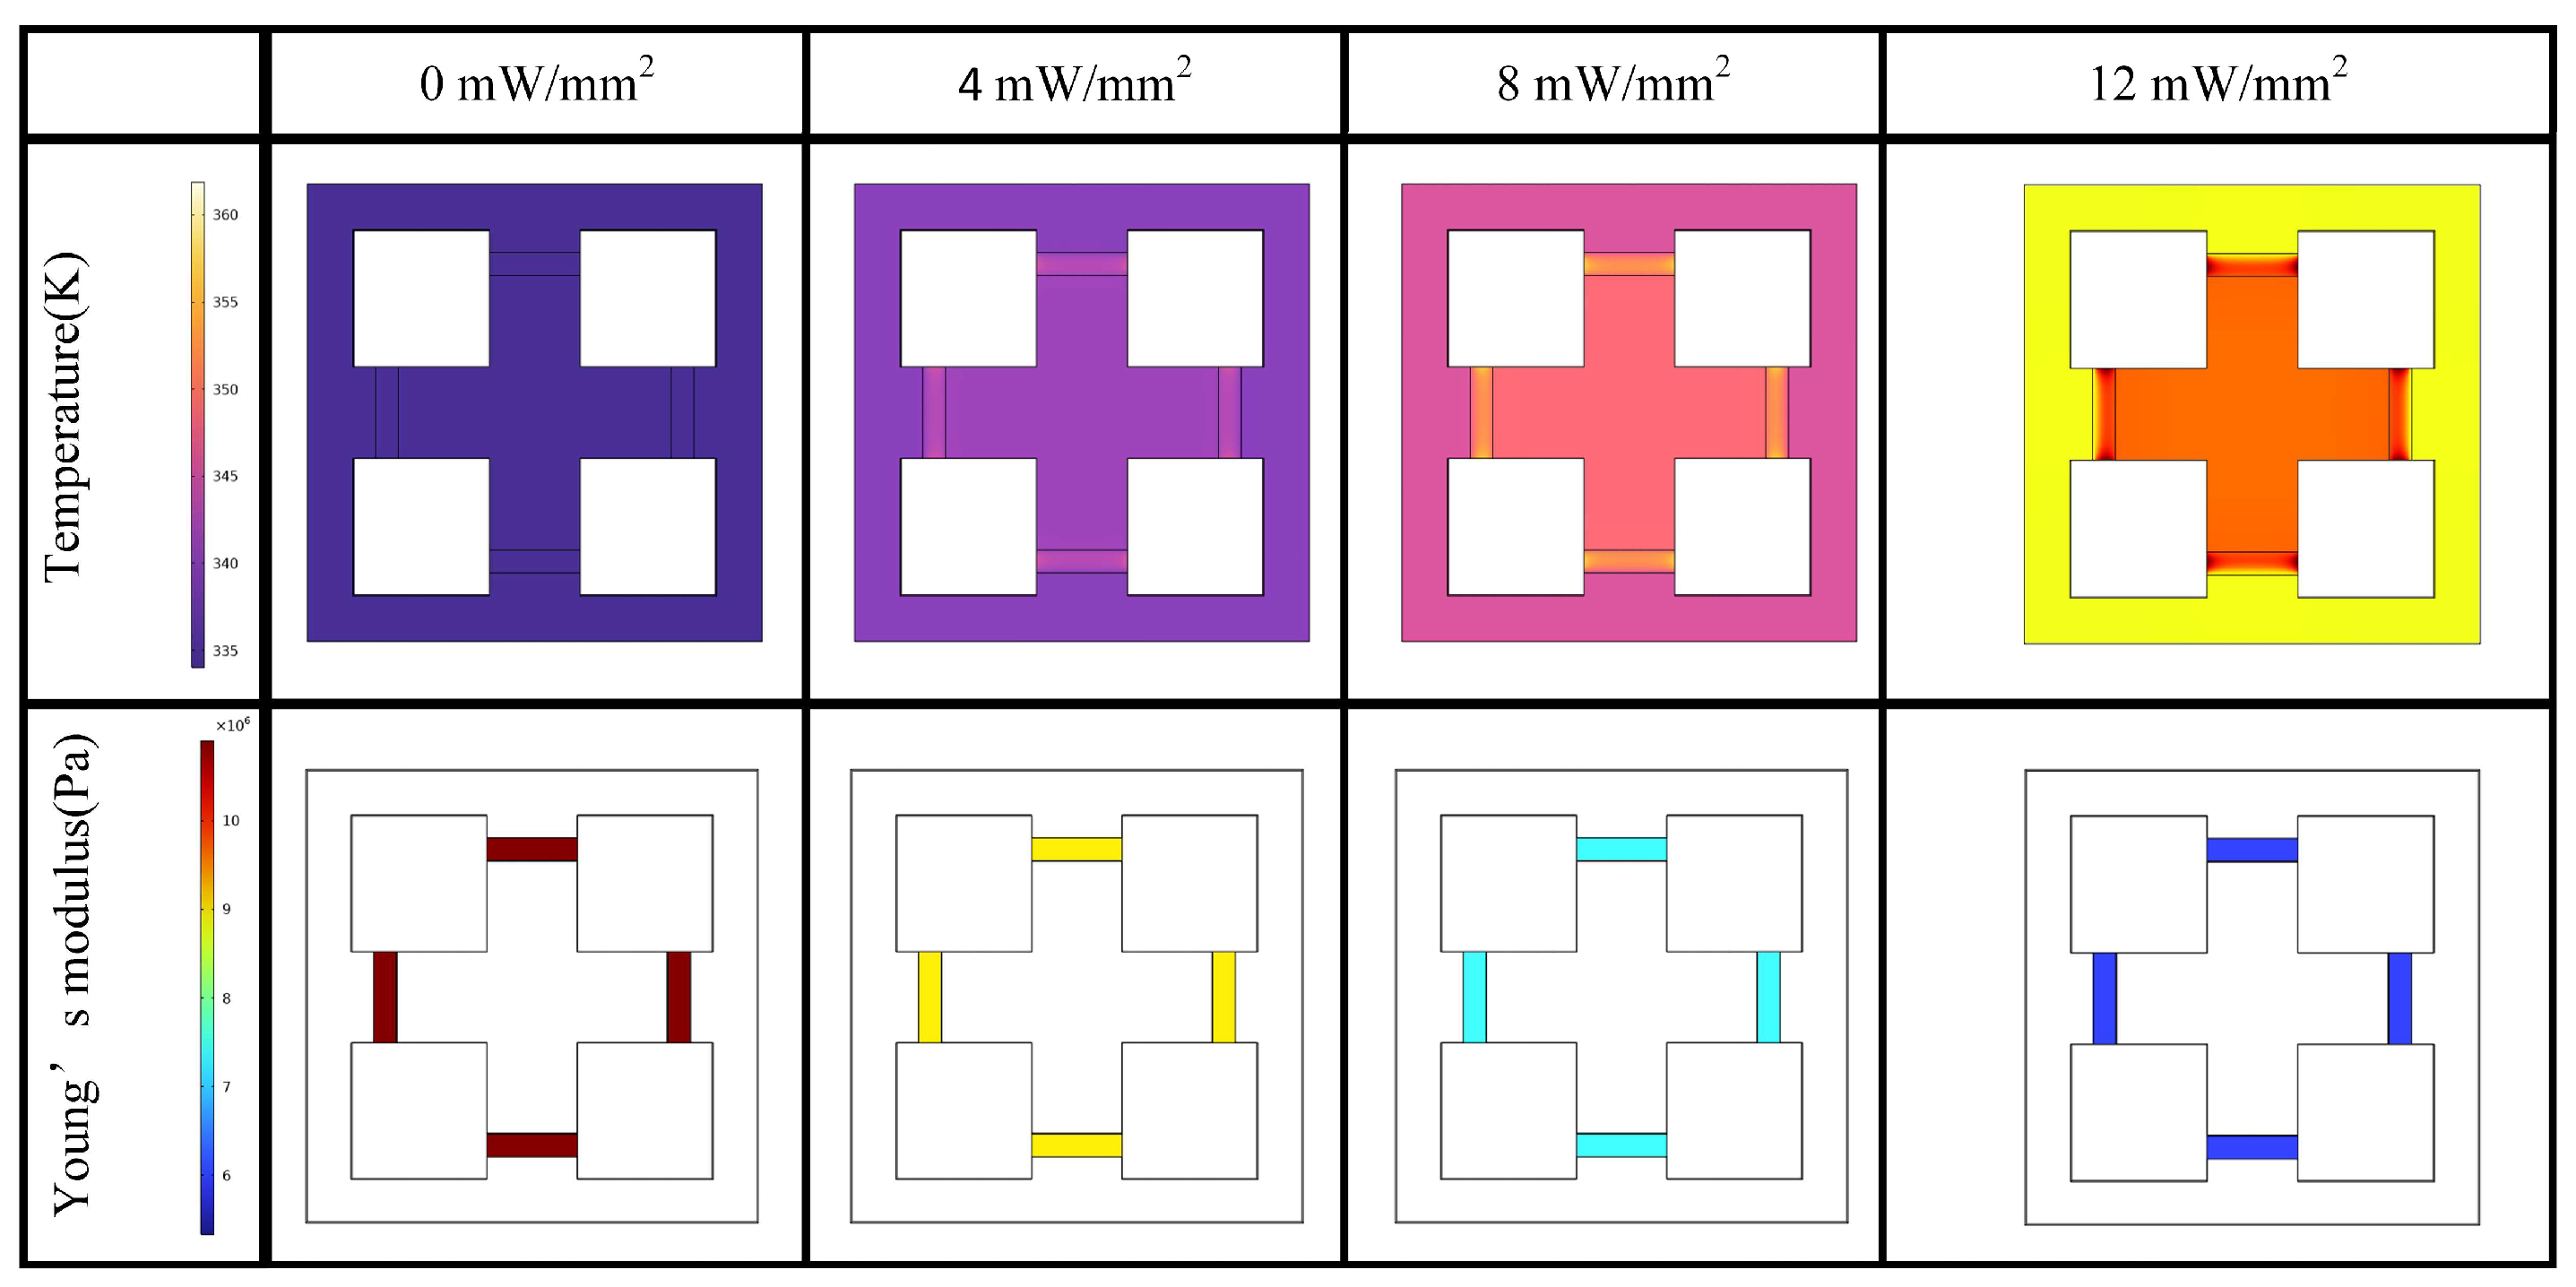
Figure 3 shows the temperature field distribution and the variation in the Young’s modulus of rubber for different heat flux densities of monoliths injected on the rubber. The average temperatures of the rubber reach 317 K, 331 K, and 344 K for the injected heat source conditions of 4, 8, and 12 mW/mm
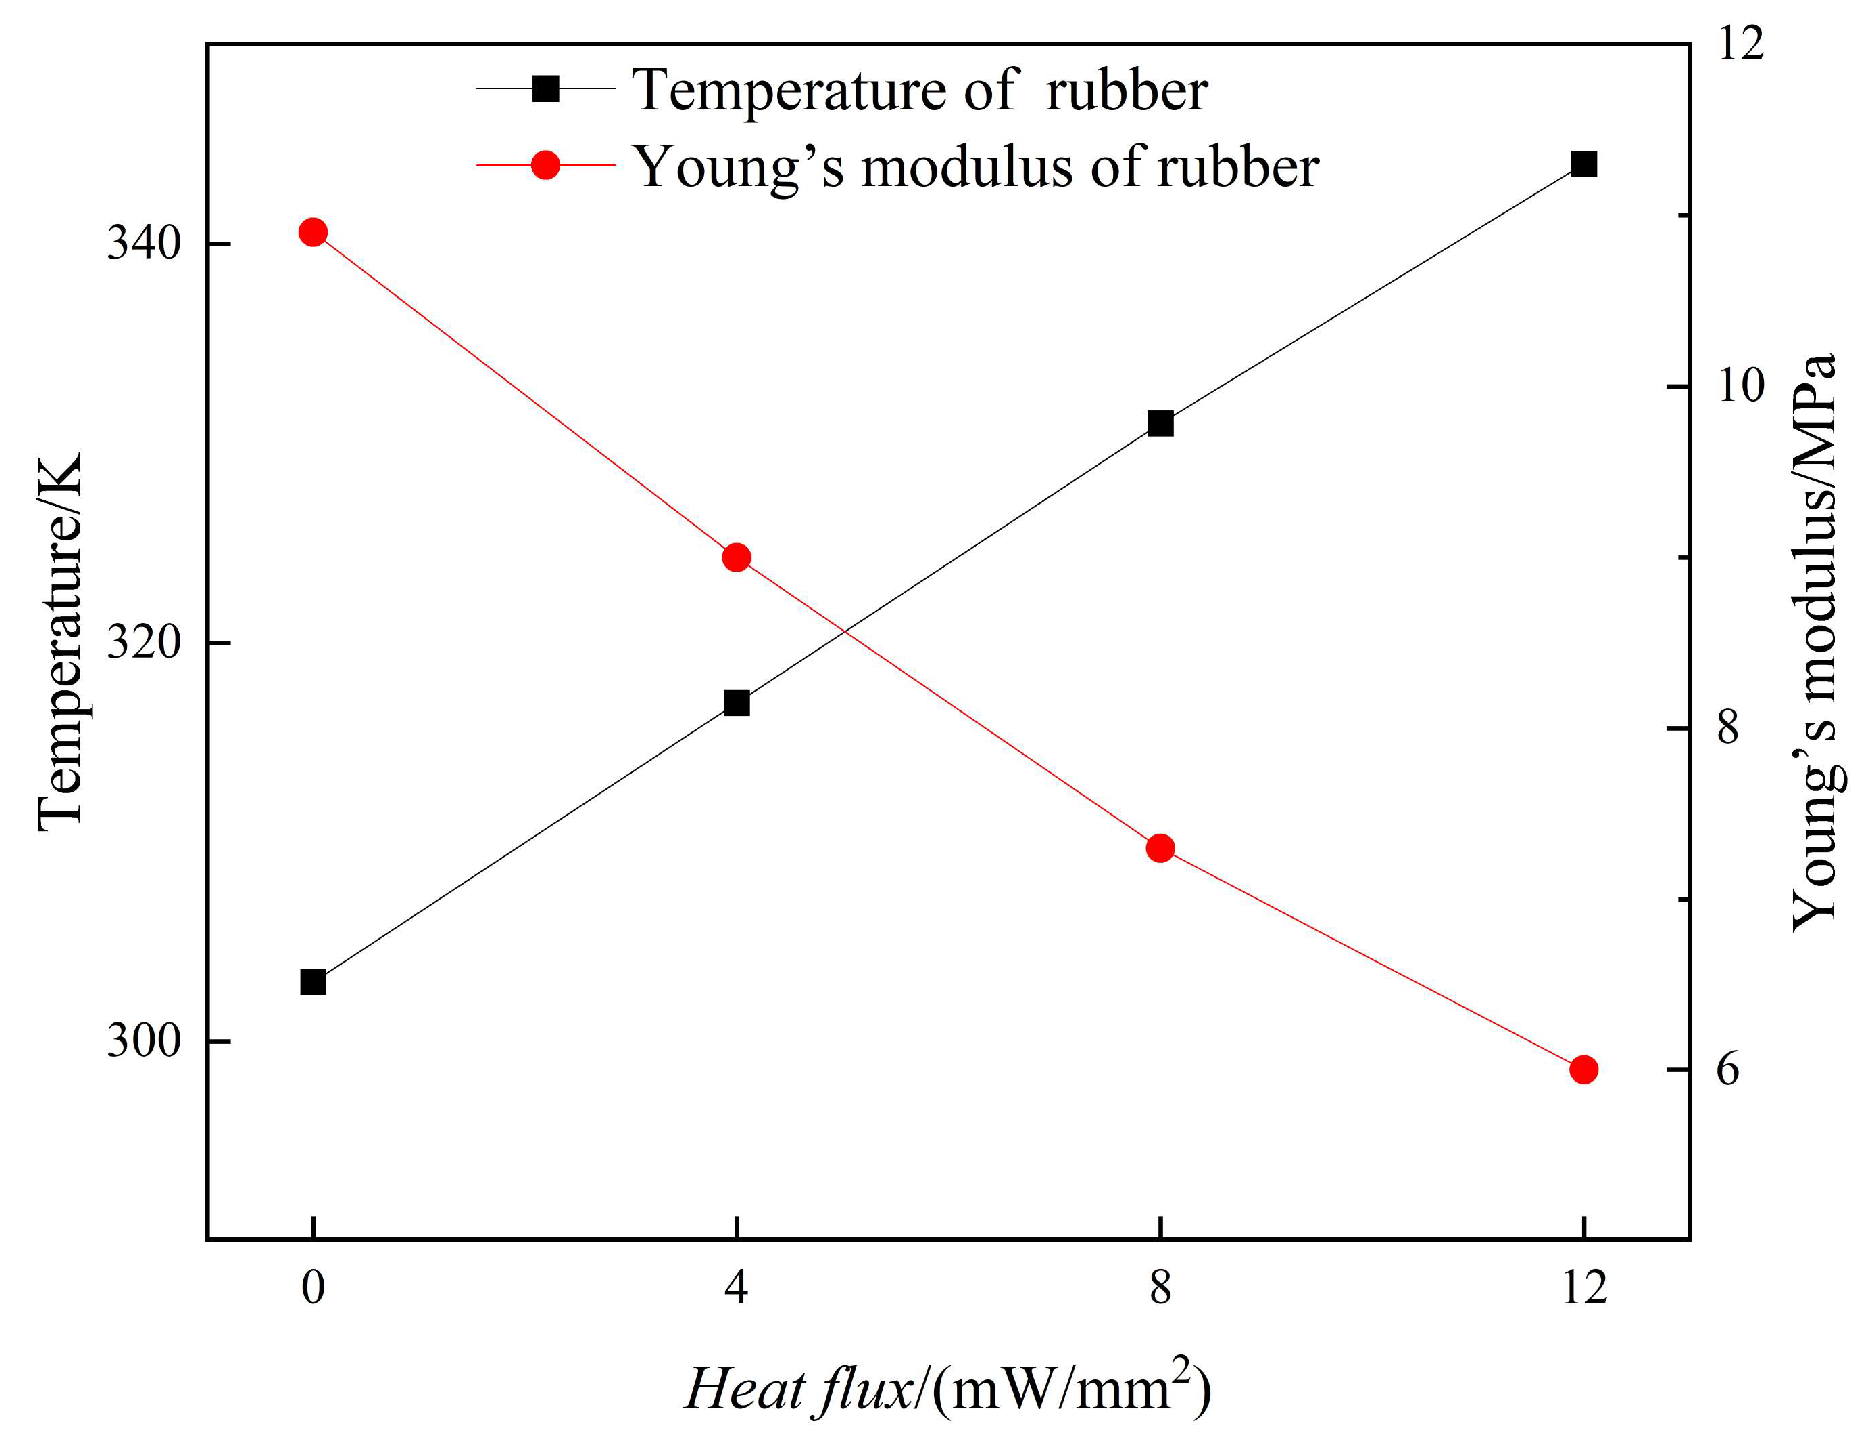
2, respectively, and the Young’s modulus of the rubber at these temperatures are 9 MPa, 7.3 MPa, and 6 MPa, respectively. The calculated results of the physical field of heat transfer in solids present the temperature distribution and Young’s modulus distribution in the interpolated function of the rubber. The heat flux versus temperature and Young’s modulus are shown in
Figure 4. The different Young’s moduli presented by the rubber leads to a change in the local stiffness, which ultimately reconfigures the band structure of the unit cell.
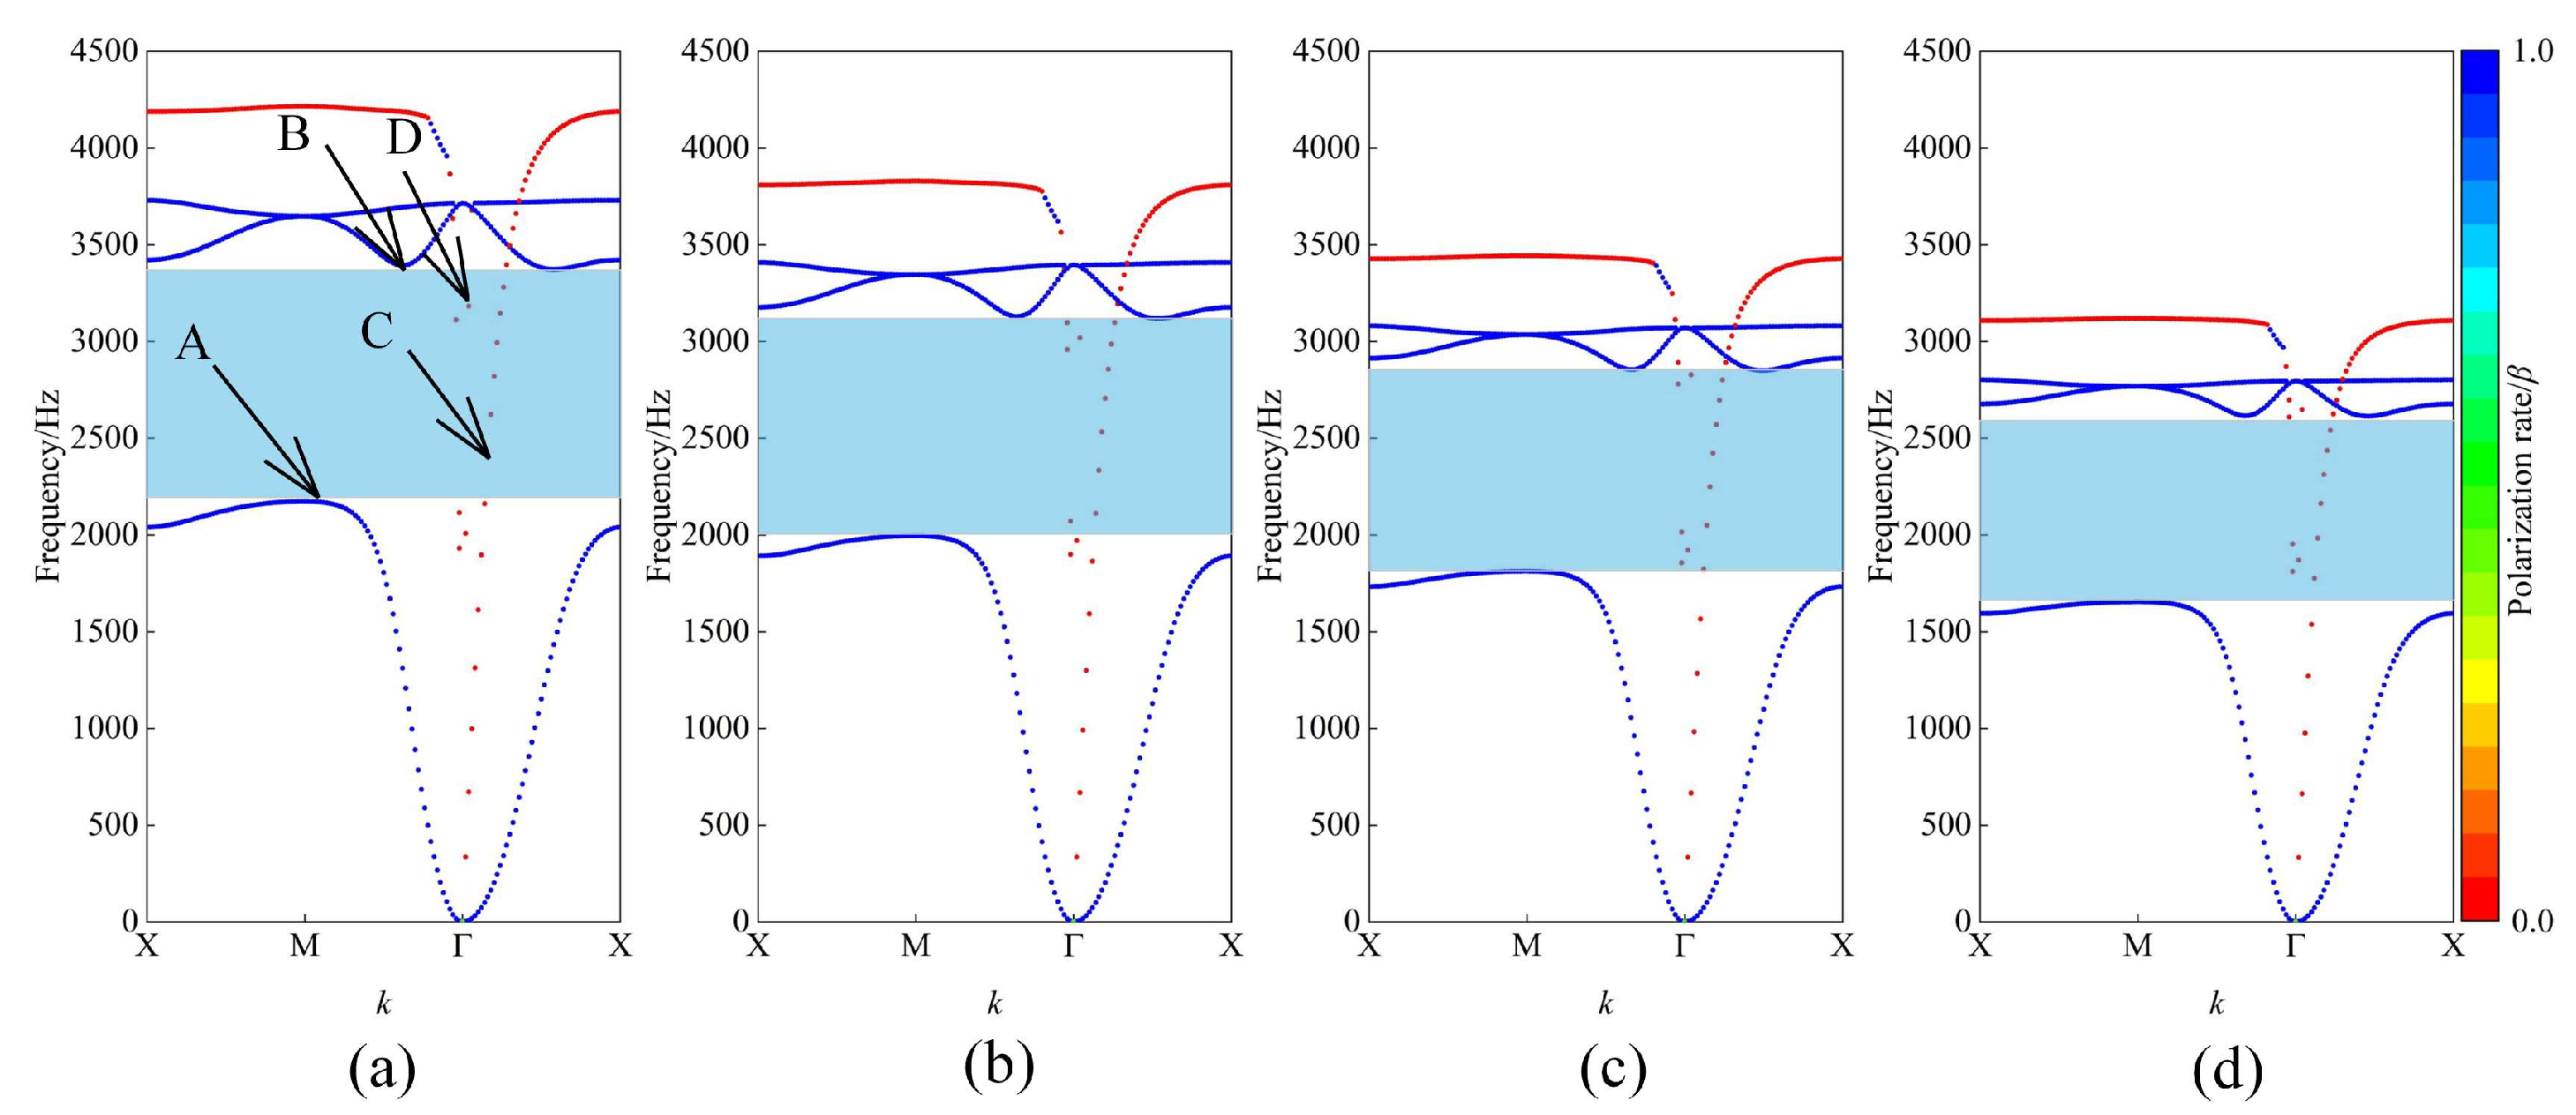
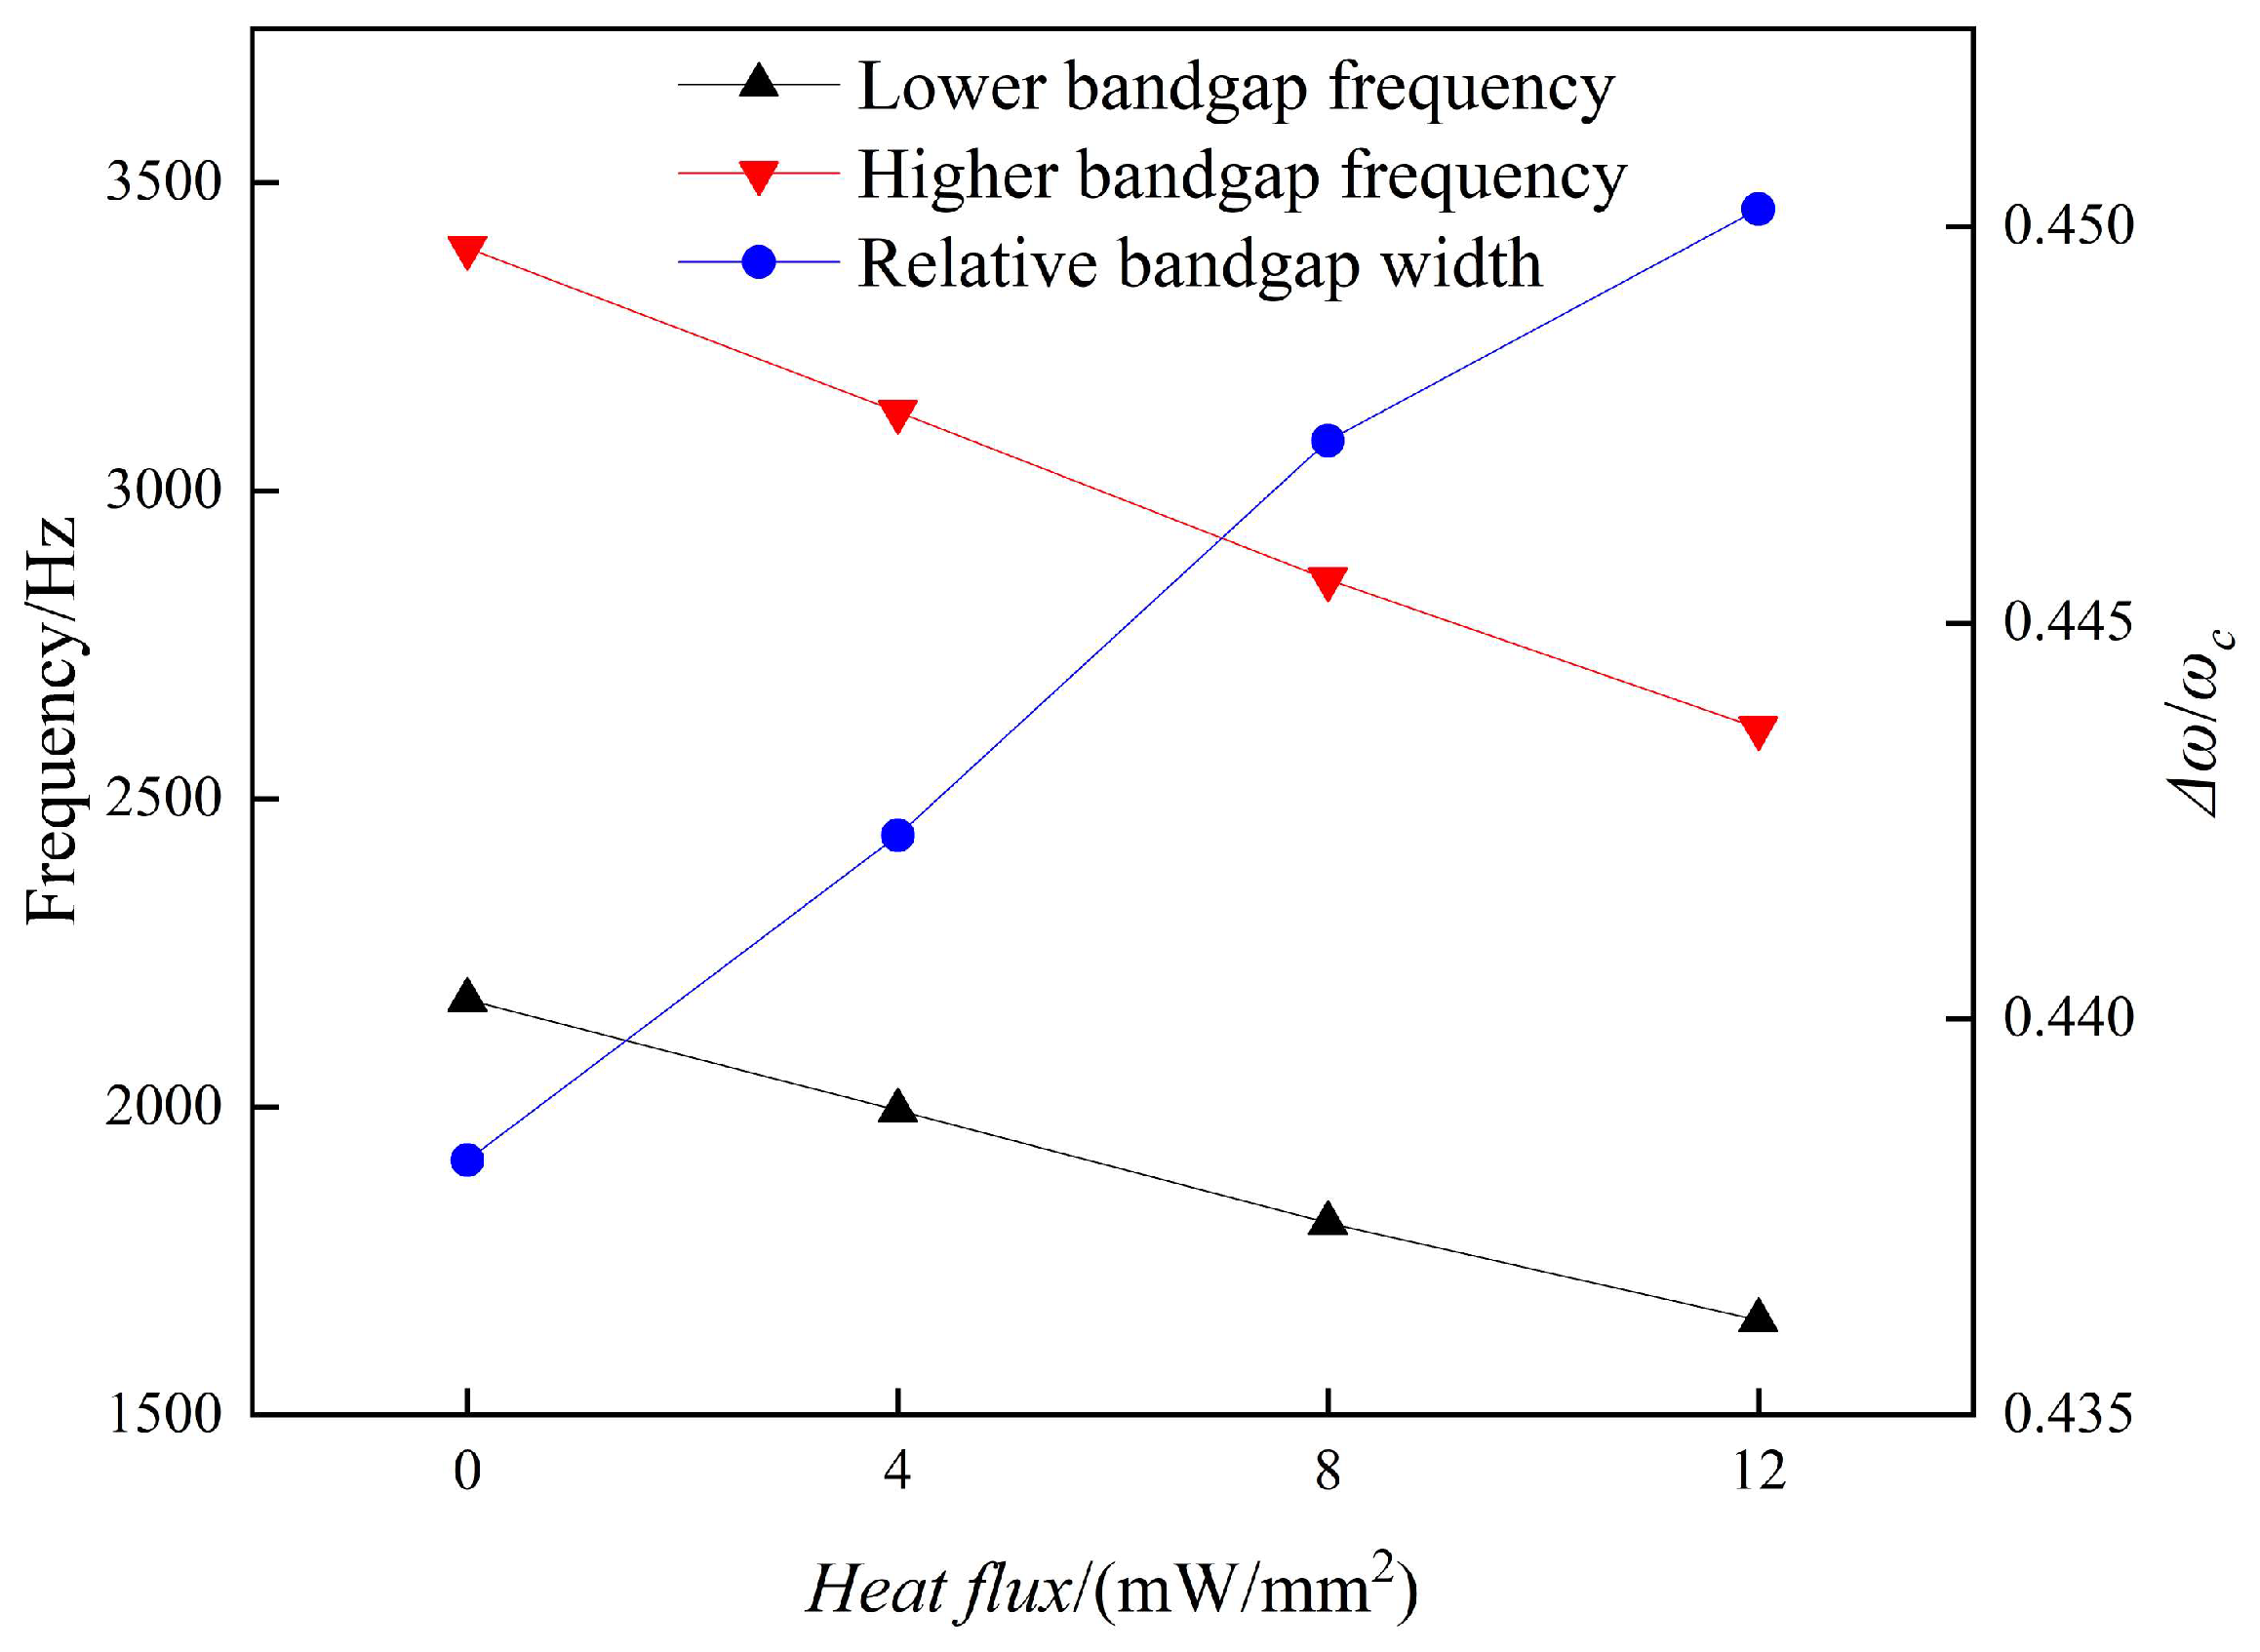
Figure 5a–d show the successive variations in the bandgap at different injected heat fluxes to quantify the effects of the thermal environment on the bandgap. With an increase in the injected heat flux, the lower bandgap frequency and upper bandgap frequency continuously shifted to the lower-frequency region. When the heat flux density increased to 12 mW/mm
2, the lower bandgap frequency and upper bandgap frequency shifted to 1654 Hz and 2615 Hz, respectively, and the relative bandgap width increased to 0.45.
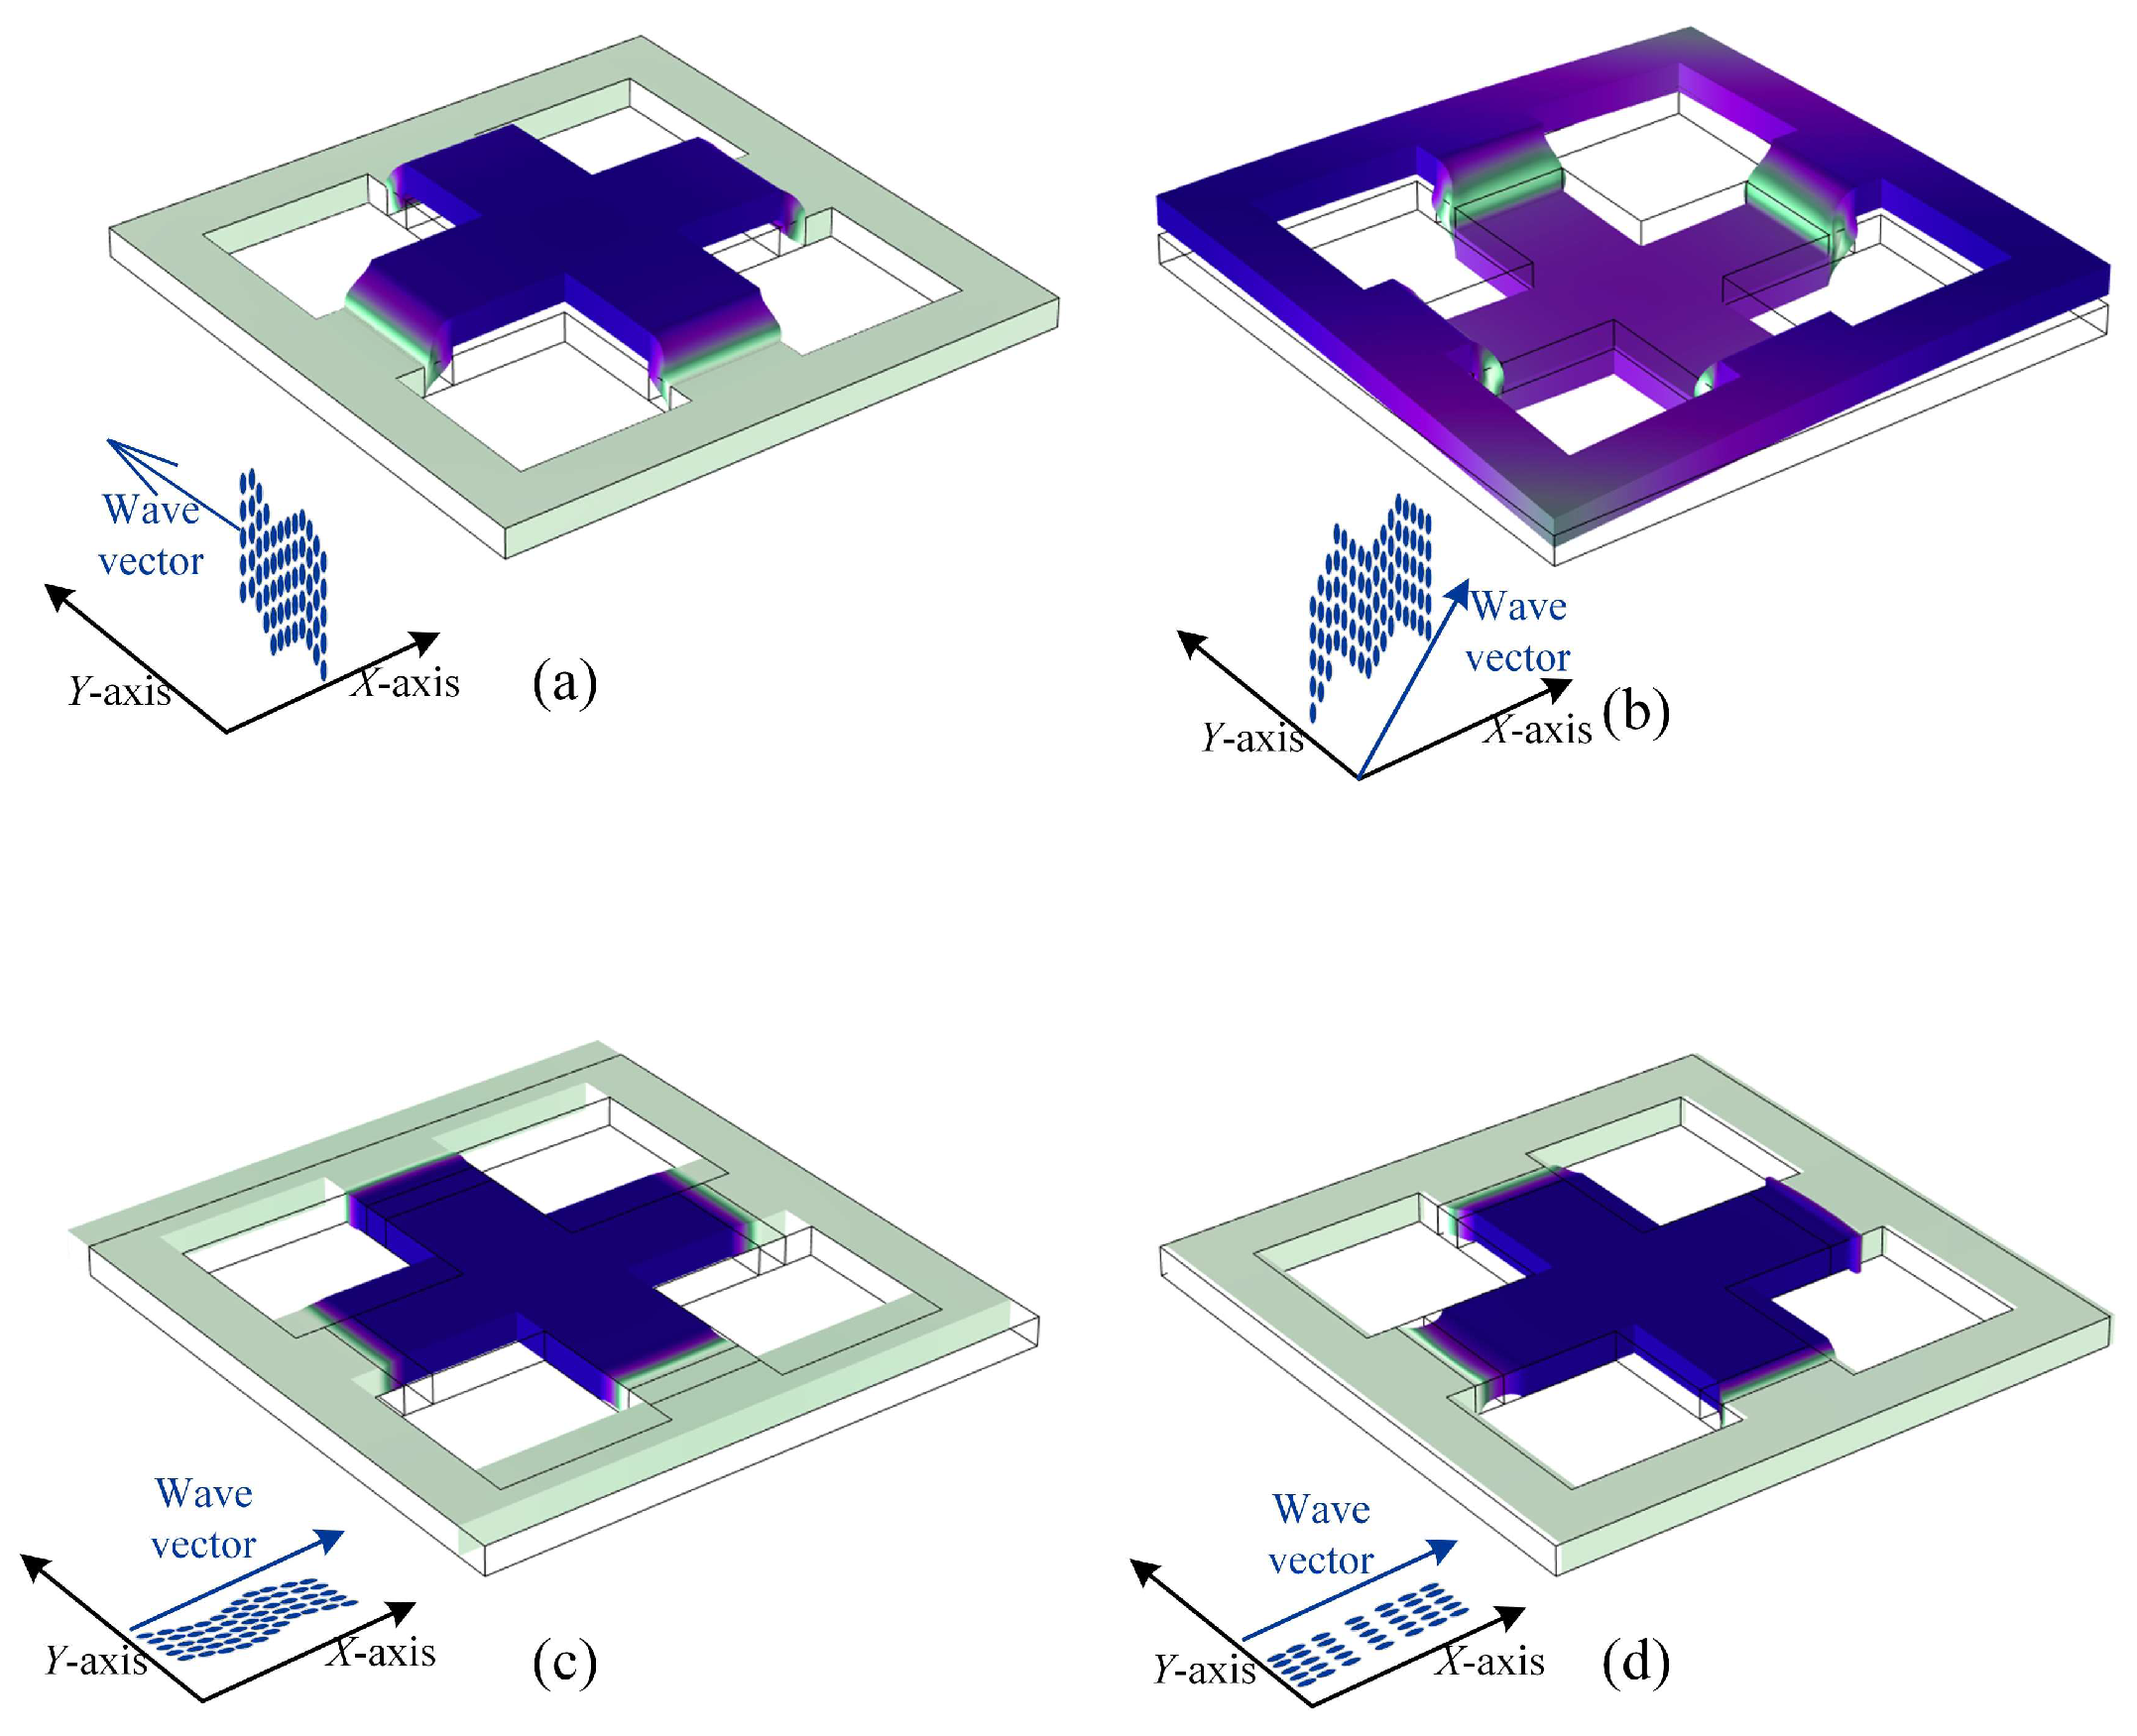
Figure 6 illustrates the vibration modes of several key nodes selected in
Figure 5a. The first-order frequency of the band structure is the starting frequency of the bending wave bandgap. From the vibration pattern at point A in
Figure 6a, it can be seen that the mass block located at the center moves along the positive direction of the
Z-axis, while the aluminum frame remains relatively stationary, and the vibration of the PnC is mainly concentrated at the center of the unit cell, so the energy of the bending wave is confined to the center of the structure and cannot continue to propagate along the frame. As a result, the first-order band is truncated, and a bandgap is subsequently formed. The bandgap ends at the flat frequency band corresponding to point B. At this point, the vibration pattern is denoted by the rubber and mass block moving negatively along the
Z-axis, while the frame starts to move positively along the
Z-axis, contrary to the mass block part, and this vibration pattern indicates that the local resonance mechanism has disappeared. In addition, a linearly rising band in the vicinity of the high symmetry point Γ in the Brillouin zone can still be seen in the bending wave bandgap, and the two vibrational modes are the shear horizontal and longitudinal modes of in-plane polarization. The longitudinal mode is characterized as an in-plane mode moving along the wave vector direction (
Y-axis), as in
Figure 6c, and the shear horizontal mode is characterized as an in-plane mode perpendicular to the wave vector direction, as in
Figure 6d. Since the propagation characteristics of these two vibrational modes within low frequencies are similar to those of a homogeneous plate, they behave linearly overall, with the slope being the wave velocity of a homogeneous medium [
19]. The variation in the bending wave bandgap and relative bandgap width is shown in
Figure 7.
4. PnC Supercell Defect States in Terms of Band Structure and Waveguide Mode
To achieve functions such as filtering, waveguiding, and wave focusing, PnCs with bandgaps are used as cladding layers, while a uniform medium is employed as the pathway. This method is used to create defect states in PnC plates [
27]. In this section, the formation of linear defects is considered by adjusting the heat flux density applied to different units. Waves within the bandgap can propagate through the linear defect, resulting in waveguiding within the structure.
To study the defect properties of PnC supercells, the unit cell of the PnCs in
Figure 1 is arranged in a linear array along the
X-direction in the
X-
Y plane, resulting in a 7 × 1 supercell structure. Floquet periodic boundary conditions were applied to the
Y boundaries of the supercell to simulate infinite periodicity along the
Y-direction. Linear defect states are achieved by heating around the rubber in the central unit without changing the structural parameters of the unit. The supercell is conditioned for convective heat flux between the unit cells, but since the supercell lattice is periodic in the
Y-direction, the supercell is conditioned for an adiabatic boundary on the periodic boundary, with heat flux applied to the rubber of the center cell and the other boundaries being thermally convective with air. In the study of supercell linear defects, the minimum periodic cell can be found in the wave vector direction, and the band structure can be calculated in the wave vector direction. For the study in this section, the linear defect direction is considered to be the
Y-direction, and hence, arrays are generated along the
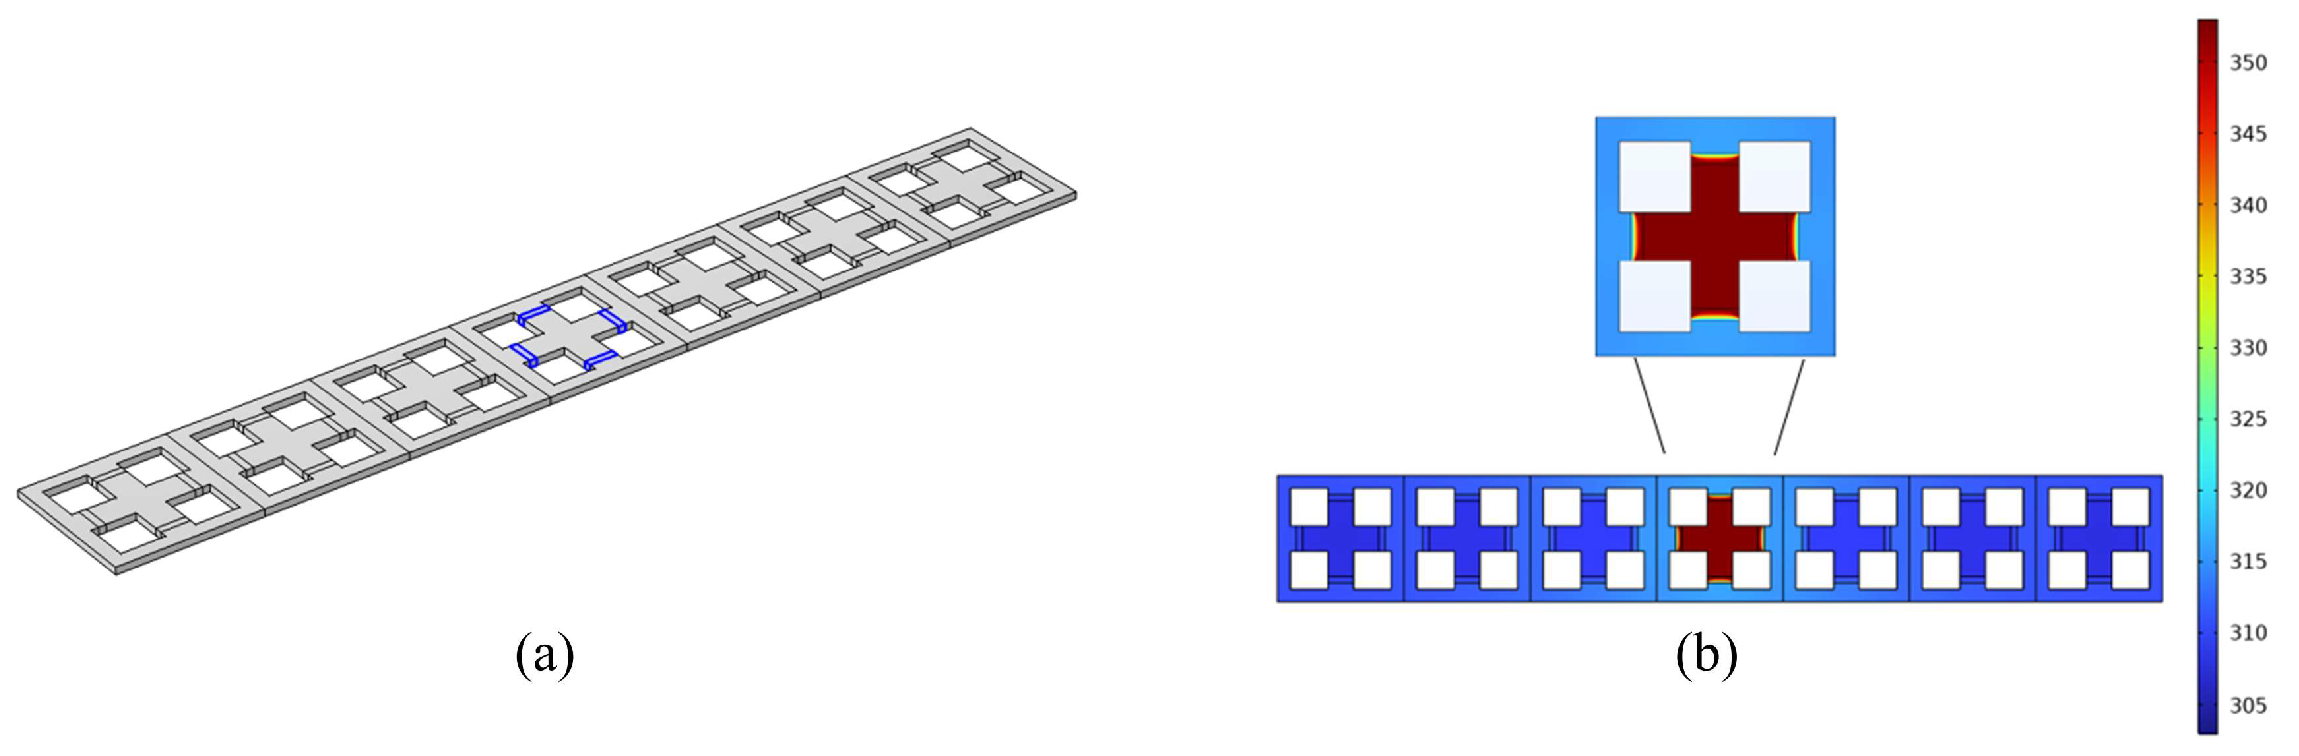
X-direction. A schematic diagram for calculating the linear defects of the supercell is shown in
Figure 8a. When the heat flux density of the supercell is 25 mW/mm
2, the temperature distribution is as shown in
Figure 8b, and the temperature of the rubber in the center cell of the supercell is 348 K, while the temperature of the other rubber materials is comparable to the ambient temperature, which results in a significant decrease in the stiffness of the rubber in the center cell of the supercell, and at this time, the Young’s modulus of the rubber in the center cell is 6.5 MPa, whereas that in the other locations is still 10.9 MPa.
Figure 9a shows the band structure of the supercell along the X-M direction in the absence of heat flow, and
Figure 9b–d show the band structure under different heat flow densities.
As can be seen in
Figure 9, the perfect supercell exhibits a bending wave bandgap in the X-M direction in the frequency range from 2173 Hz to 3391 Hz. As the heat flux increases, two conduction bands gradually appear within the bandgap. For example, when the heat flux density increased to 25 mW/mm
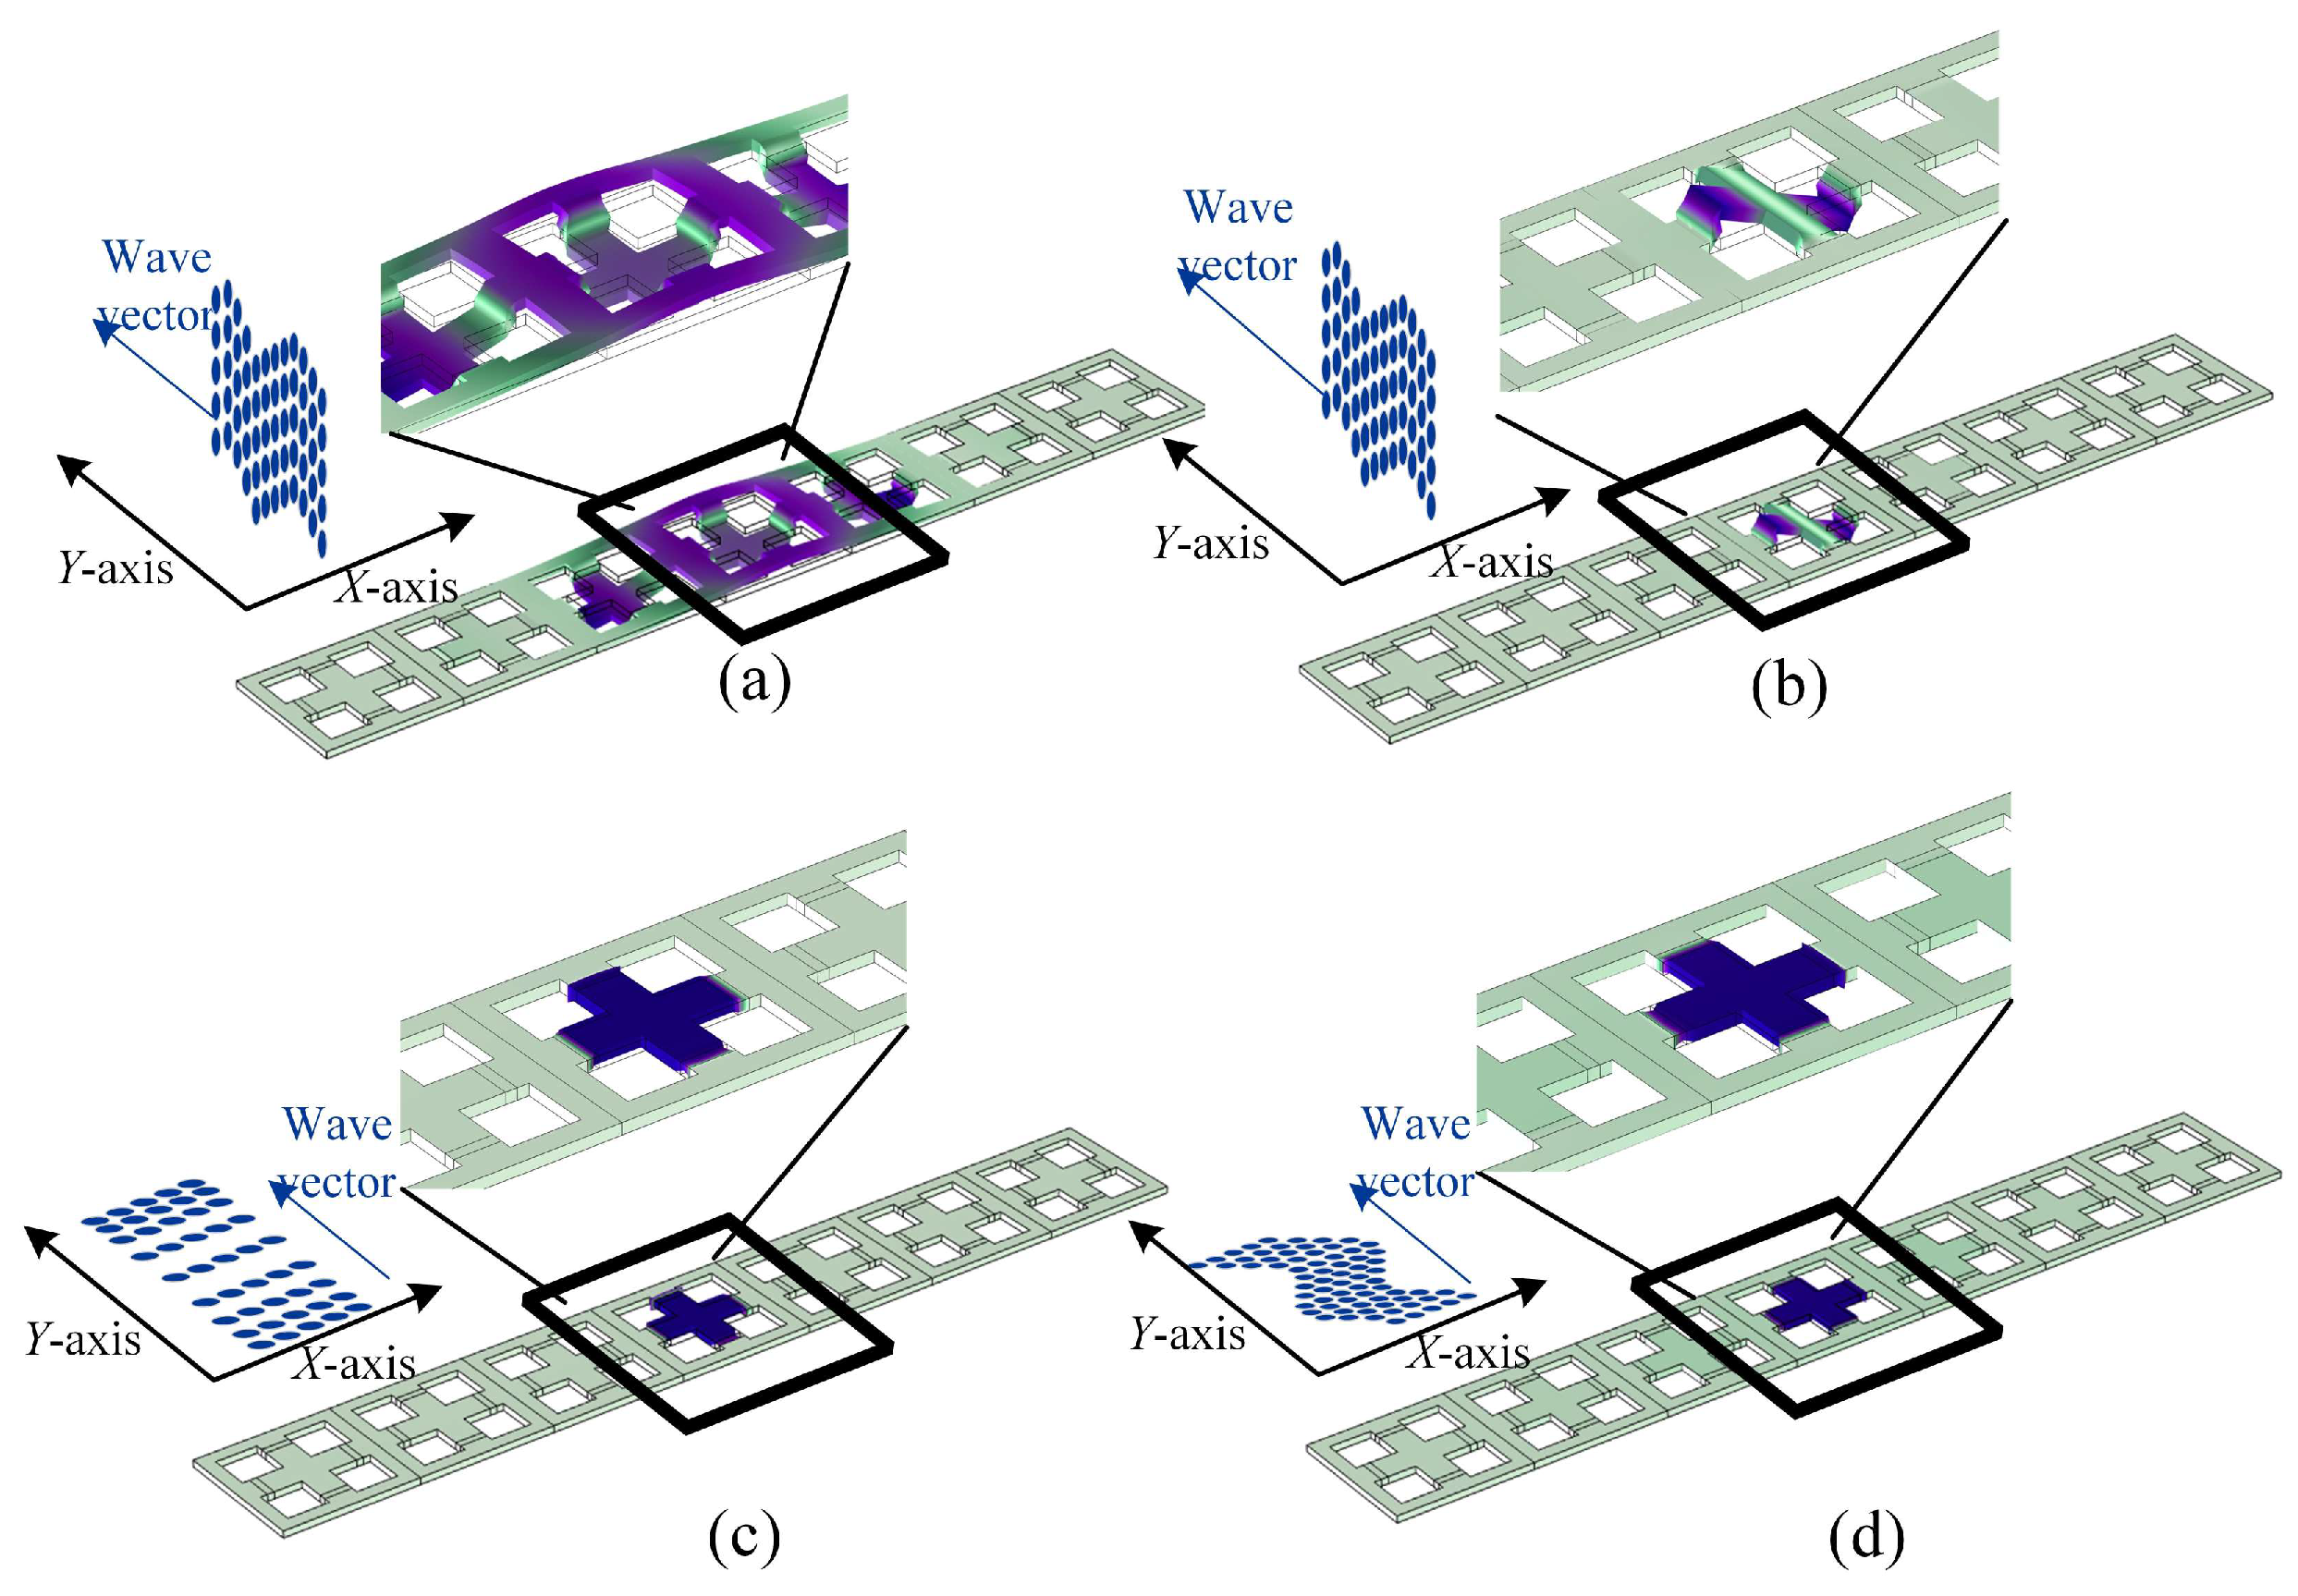
2, the supercell was defective in the X-M-directional band structure. Specifically, two intersecting blue bands of out-of-plane polarization, labeled as mode A and mode B, appear within the original bandgap near 2700 Hz. The displacements in both modes are concentrated in the central cell of the supercell;
Figure 10a shows mode A, in which the central cell and nearby mass block move in the negative direction along the
Z-axis, and the frame moves positively to face the
Z-axis, and
Figure 10b shows mode B, in which the central cell mass block rotates in the
X-Z plane. These two overlapping frequency bands imply that the two out-of-plane modes are coupled in this frequency range under the condition that the wave vector is in the
Y-direction. In addition, when the heat flux is increased to 25 mW/mm
2, two in-plane polarization bands appear at 3128 Hz and 3220 Hz, labeled as C and D modes, and their modes are examined as longitudinal and horizontal shear modes, respectively, as shown in
Figure 10c,d. The appearance and movement of these bands set the stage for the design of tunable waveguides.
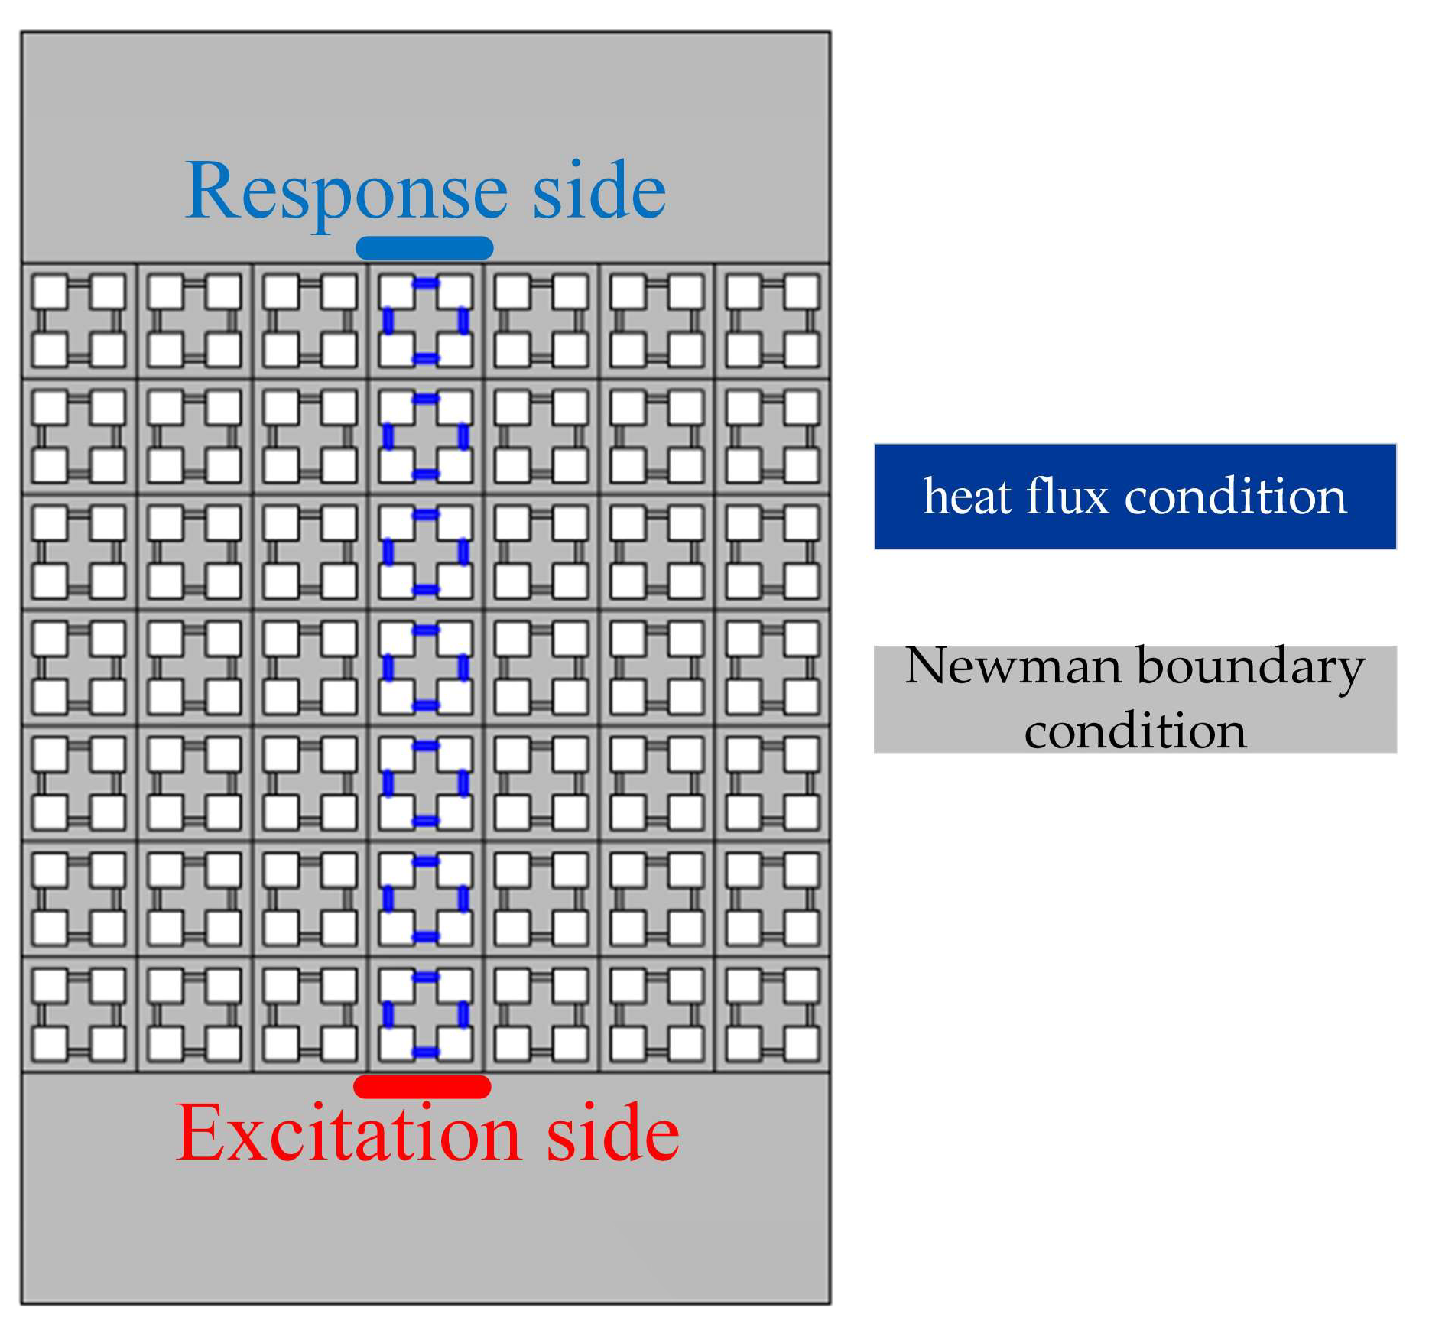
Figure 11 shows a schematic diagram of the forced vibration frequency response of PnCs. The transmission spectrums of the finite structure were calculated using the finite element method. Consider a finite structure consisting of 7 × 7 cells heated on the rubber of the center cell. For the physical field of solid heat transfer,
Figure 8 and
Figure 11 show the same boundary conditions. Perfectly matched layers were used at both ends of the finite structure as a fictitious domain in the
Y-direction to prevent reflected waves. An excitation with unit displacement amplitude in the
Z-direction was applied at the lower end, and the transmitted wave was received at the upper end.
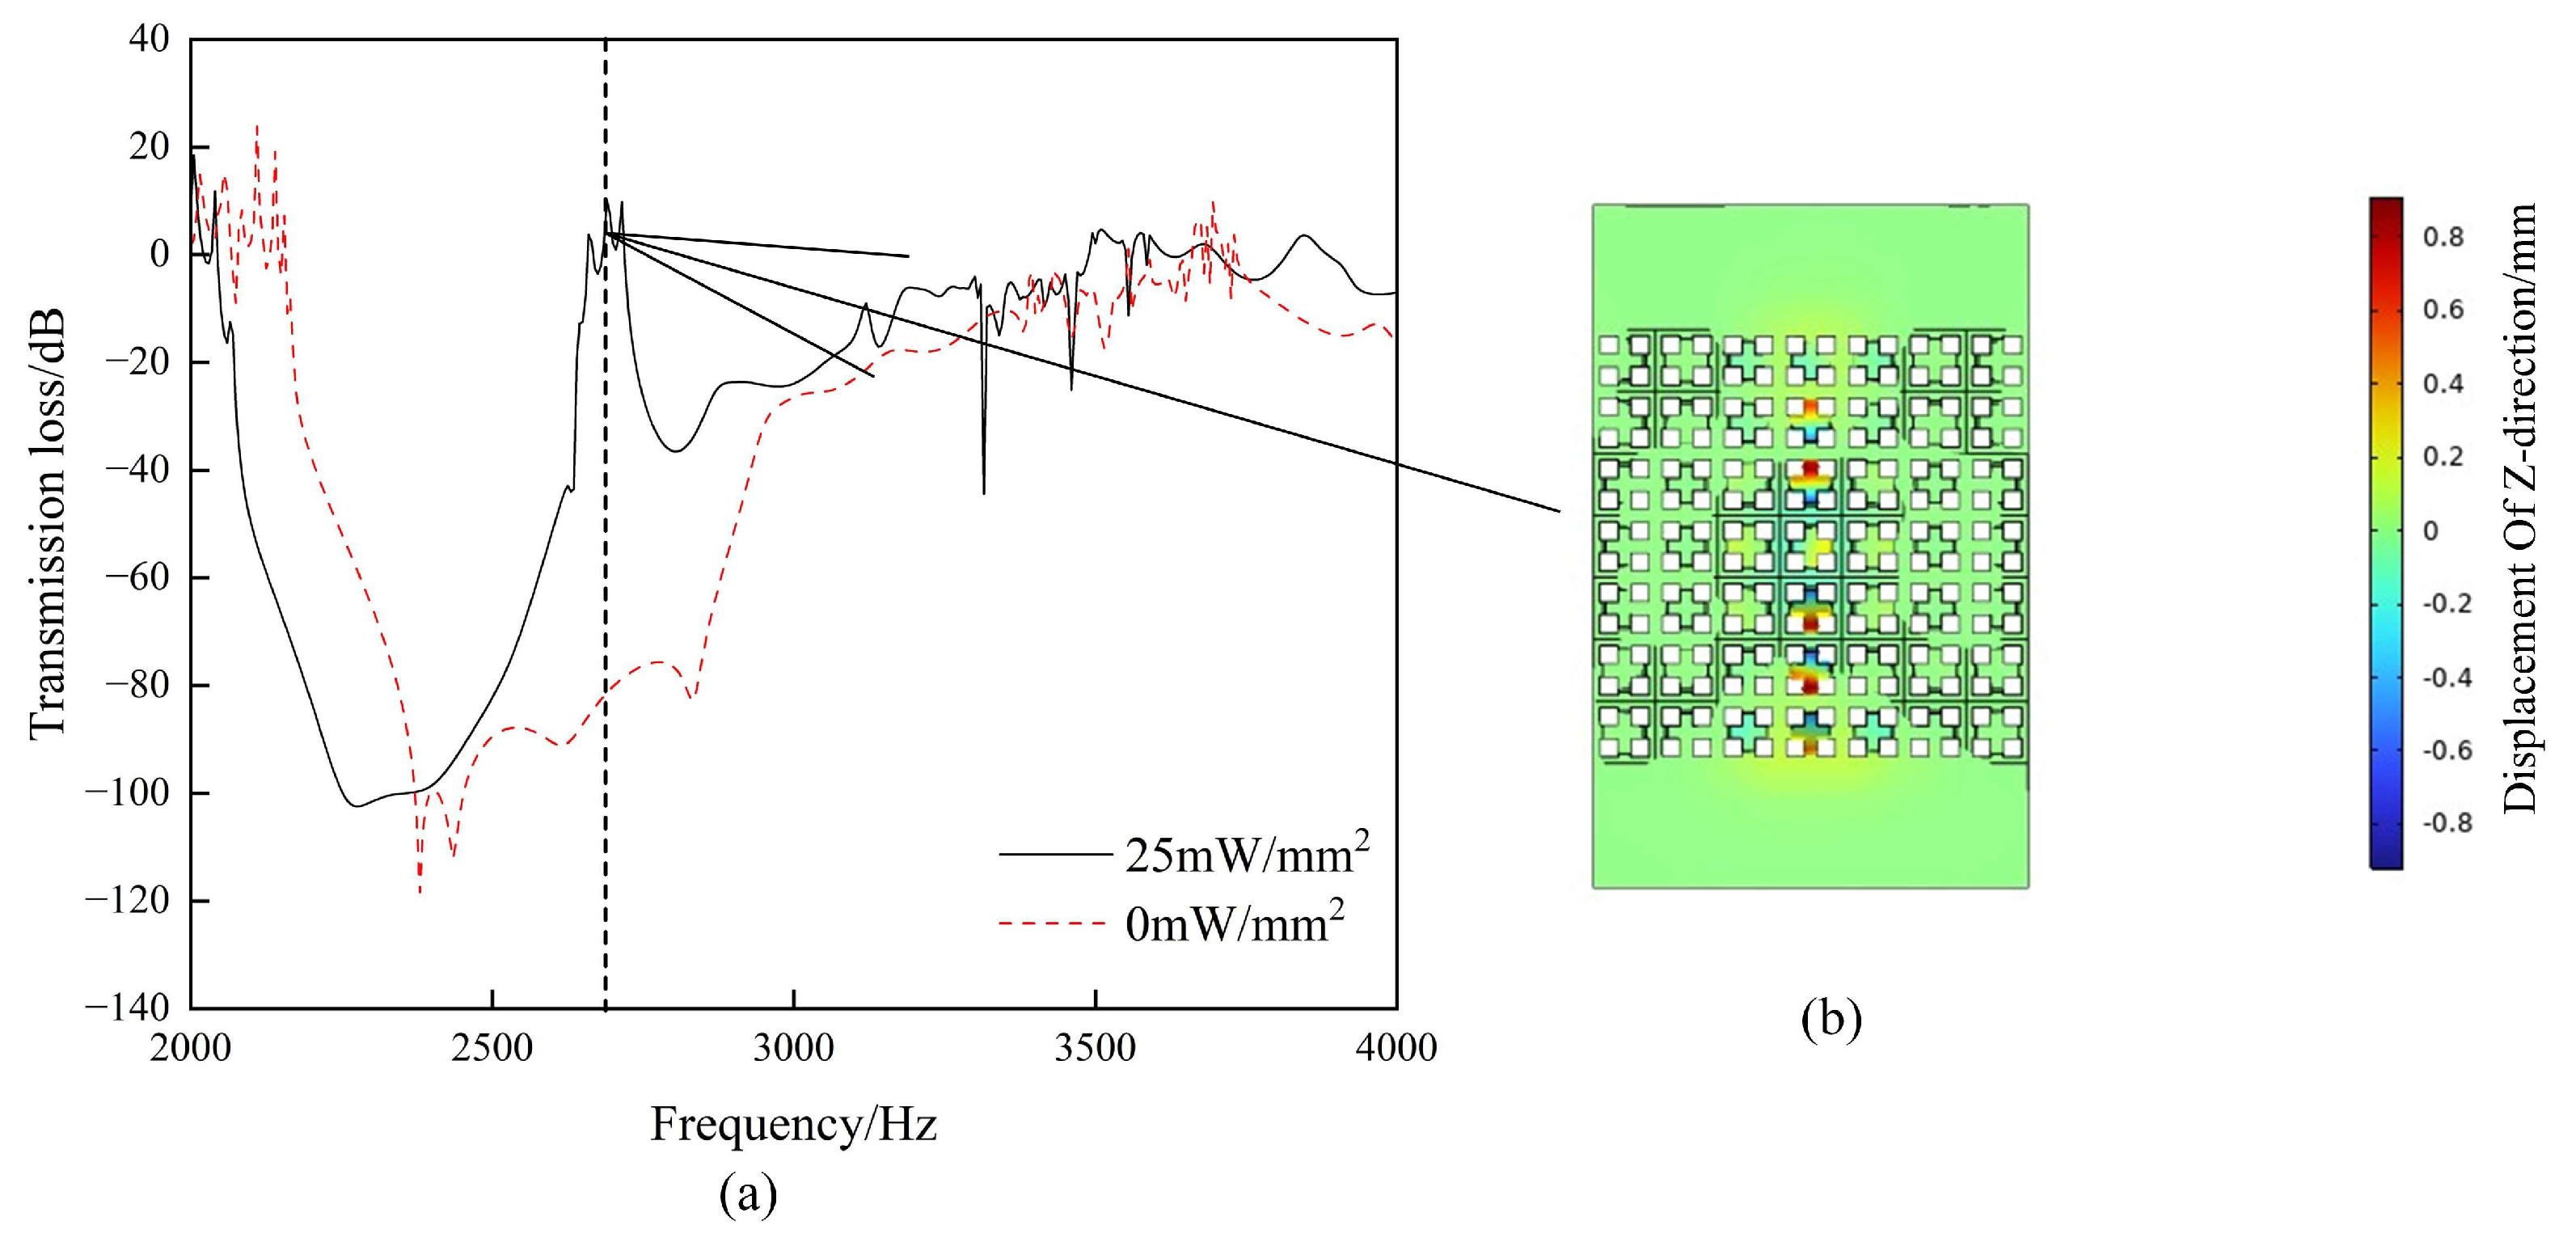
Figure 12a shows that the transmission spectrums of the supercell under the unapplied thermal loading condition and a local injection of 25 mW/mm
2 heat flux were calculated as
The results show a peak range in the transmission spectrum within the bandgap. This corresponds exactly to the transmission spectrum at
Q = 25 mW/mm
2 in
Figure 11.
Figure 12b shows the displacement of the
Z-direction for the injected heat flux condition. The value of the color caliper is the magnitude of the displacement in the
Z-direction. The fluctuations in the bending wave are limited and propagate along the linear defects of the original design. Adjusting the injected heat flux allows the waveguide to turn on or off at different frequencies.


