1. Introduction
Due to their pharmaceutical application, proteins in crystalline form have attracted considerable interest [
1]. On the other hand, relatively large and well-diffracted crystals are required for X-ray studies of the molecular structures of newly expressed proteins. Of course, only spontaneous crystallization can be used in this case, the prerequisite for which is the formation of crystalline embryos, the so-called nuclei.
Starting the crystallization process, the nucleation stage predetermines important characteristics of the produced crystals. Often of interest is the number of crystals grown, which affects important characteristics of the crystalline product. Therefore, the rate of the nucleation of protein crystals, which is determined by the molecular kinetics of this process, is considered in this paper.
Since the nucleation of crystals cannot be observed at the molecular level, there are different conceptions of its mechanism. First, we first present the understanding of kinetics of crystal nucleation according to classical nucleation theory (CNT). Although it was originally developed to explain the nucleation of crystals from small molecules, it is also often used to explain the nucleation of protein crystals. The reason for this is that, by enabling quantitative estimates and predictions concerning the results of many experimental studies, CNT provides a general framework for the fundamental analysis of nucleation processes.
But the assumption of CNT for simultaneous condensation and ordering during a single nucleation process, i.e., the mechanism of this process, is frequently contested, for instance, in the so-called two-stage nucleation mechanism (TSNM) [
2,
3]. In contrast, the basic (thermodynamic) postulate of CNT, that for crystal nucleation to occur it is imperative to overcome an energy barrier, Δ
G*, which happens through interphase fluctuations, remains indisputable. On this basis, the rate
J of crystal nucleation (measured in number of nuclei formed per unit time per unit volume) was calculated in the framework of CNT [
4]:
where
A is a pre-exponential factor, which remains unknown in Volmer’s statistical-thermodynamic derivation [
4], but was calculated by Becker and Döring [
5] and by Zel’dovich [
6]. Δ
G* is the energy barrier for the formation of the critical nucleus under isothermal and isobaric conditions,
kB is the Boltzmann constant, and
T is the absolute temperature.
c1 (molecules per cm
3) is the concentration of the monomers,
ν*
+ is the attachment probability (frequency) of a molecule to the critical nucleus, and
Z is the Zel’dovich factor.
The thermodynamic energy barrier, Δ
G*, is the dominant factor in the crystal nucleation rate expressed by Equation (1), while the effect of the pre-exponential factor,
A, is significantly weaker. Therefore, traditionally, when studying the rate of crystal nucleation, attention has been focused on Δ
G* (e.g., see [
7,
8,
9]), while less attention has been paid to the kinetic pre-exponential factor,
A. (Also, TSNM focuses on the thermodynamic factor).
The barrier Δ
G* (which must be surmounted for nucleation to occur) depends strongly on the supersaturation, Δ
μ:
where
B is a constant thermodynamic parameter.
The logarithm of
J from Equation (1), in combination with Equation (2),
is used for calculating Δ
G* from experimental data (e.g., see [
7,
8,
10]).
In Equation (1), is a dimensionless multiplying factor that shows how A decreases to the actual J when . But, although purely mathematically, J becomes equal to A when , physically, the disappearance of the energy barrier means the occurrence of a fundamentally different kind of phase separation, the so-called spinodal decomposition. The latter is a spontaneous phase separation into two different phases, which does not require nucleation events: nucleation occurs when a homogenous phase becomes metastable, meaning that it remains at a local minimum while another biphasic system becomes lower in free energy. In contrast, spinodal decomposition occurs when a homogenous phase becomes thermodynamically unstable, i.e., it is at the maximum in free energy. Importantly, a phase change due to nucleation begins at discrete points, whereas in spinodal decomposition, the two distinct phases start growing in any location throughout the volume of the system.
The pre-exponential kinetic factor,
in Equation (1), has the same dimensions as
J, but according to CNT it does not depend on the supersaturation. However, using Equation (1),
A can be calculated. For instance, to substantiate his claim that the CNT overestimates the crystal nucleation rate by 10 orders of magnitude, Vekilov [
2] calculated
A for the case of lysozyme crystal nucleation. Based on experimental data for the velocities of propagation of steps on lysozyme crystal faces, he estimated the attachment rate of protein molecules to kink sites to be ≈ 300 s
−1 and placed this value for
ν*
+ into Equation (1). However, since the critical nuclei are too small to have faces with kinks on them, there is a significant difference between molecule joining to kink sites and joining to critical nuclei (incidentally, Vekilov also wrote “This estimate of ν*
+ should be viewed as approximate since the configuration of molecules in a kink on the smooth crystal face during crystal growth may be significantly different than the molecular configuration on the rough surface of a near-critical cluster”).
In fact, the similarity between the two processes is restricted to the circumstance that, in both cases, protein molecules must have the same suitable spatial orientation. However, because, before joining to the kink site, protein molecules diffuse on the crystal face [
11,
12,
13], attachment to the kink site can be easier than to the critical nucleus. The reason for this is that the protein molecules can be stirred to the required spatial orientation for the following reasons.
- -
First, once on the crystal face, the globular protein molecules begin to roll on it, like balls on a floor. Thus, only those protein molecules that reorient themselves towards the crystal face, in such a way as to be attached firmly enough, remain adsorbed—the rest are returned to the solution.
- -
Second, according to the BCF model (the theory of Burton, Cabrera, and Frank [
14]), diffusing on a crystal face, molecules reach the steps on it, and moving along these steps they reach the kink sites, where they embed themselves. Although there is no direct experimental evidence, it is very likely that this mechanism also works in protein crystal growth. The reason for this is that, roaming arbitrarily on the crystal face, protein molecules will fall much more often onto the relatively long steps rather than hit the point like-kink sites directly. And if this is indeed the case, the interaction with the step riser will reorient the protein molecule in the second appropriate for bonding direction.
- -
Directed in the correct spatial orientation, the protein molecules can move to kink sites, where they are integrated.
Evidently, this plausible scenario would lead to a significant increase in the attachment frequency to the kink sites. In contrast, on the extremely small critical nuclei, there are neither faces nor steps. Therefore, the attachment frequency to critical nuclei, ν*+, should differ from the attachment frequency to the kink site.
The aim of this paper is to calculate the value of ν*+ for protein crystal nucleation in solutions. This is done quantitatively by elucidating the molecular-kinetic mechanism by which crystalline bonds between globular proteins are created. Focusing on the way in which protein molecules start to arrange in a crystalline structure, either simultaneously with their condensation (according to CNT) or after a preliminary condensation step (according to TSNM), it was shown that the low ν*+ cannot be attributed to fewer hits between biomolecules. Rather, the reason for the slow nucleation of protein crystals is the fact that only several small patches on the highly inhomogeneous molecule surfaces are capable to form crystalline bonds. And in order to confirm this assumption in a convincing way, the probability of forming complexes of two protein molecules (with which the nucleation begins) and the probability of attachment of a molecule to the critical nucleus were calculated. Also, considering the case of protein crystal growth by direct embedding of molecules from the solution into the kink sites, the probability of such attaching has been revised.
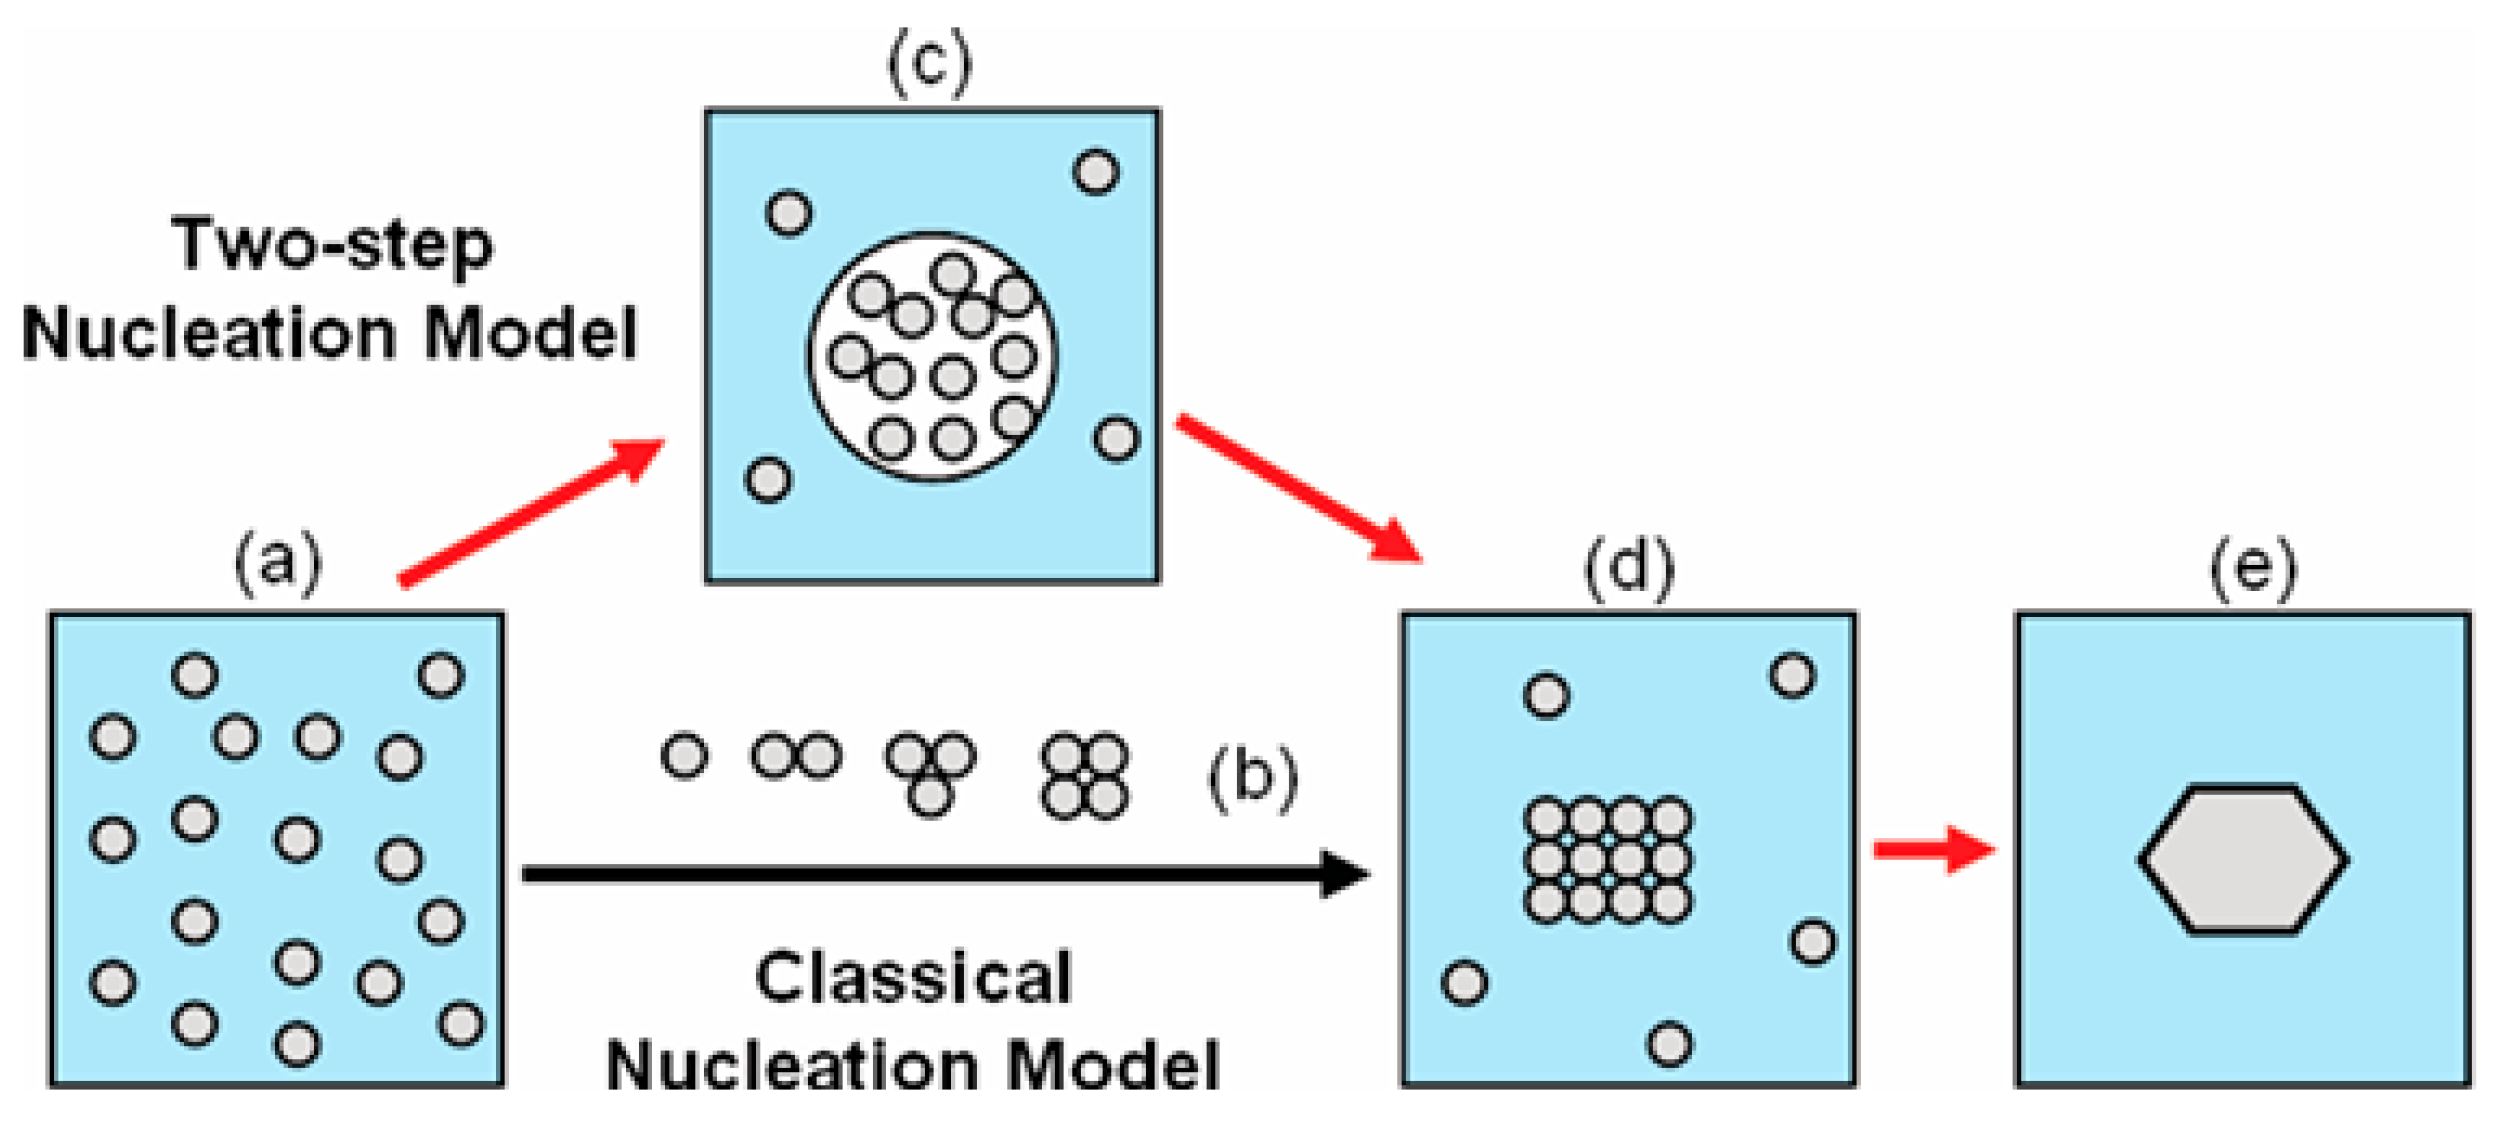
Brief Outline of TSNM
Although CNT is followed by many systems, in other cases it fails to correctly predict nucleation rates, and the deviations can be of many orders of magnitude, e.g., [
15,
16]. Importantly, such experimental results prompted the development of competing theories for crystal nucleation, the most common deviation from CNT being the TSNM [
17,
18,
19,
20]. TSNM assumes nucleation initiation via an intermediate condensed liquid droplets appearing in bulk solution [
15,
21,
22], and afterwards-crystal nuclei are formed inside such highly concentrated droplets (
Figure 1).
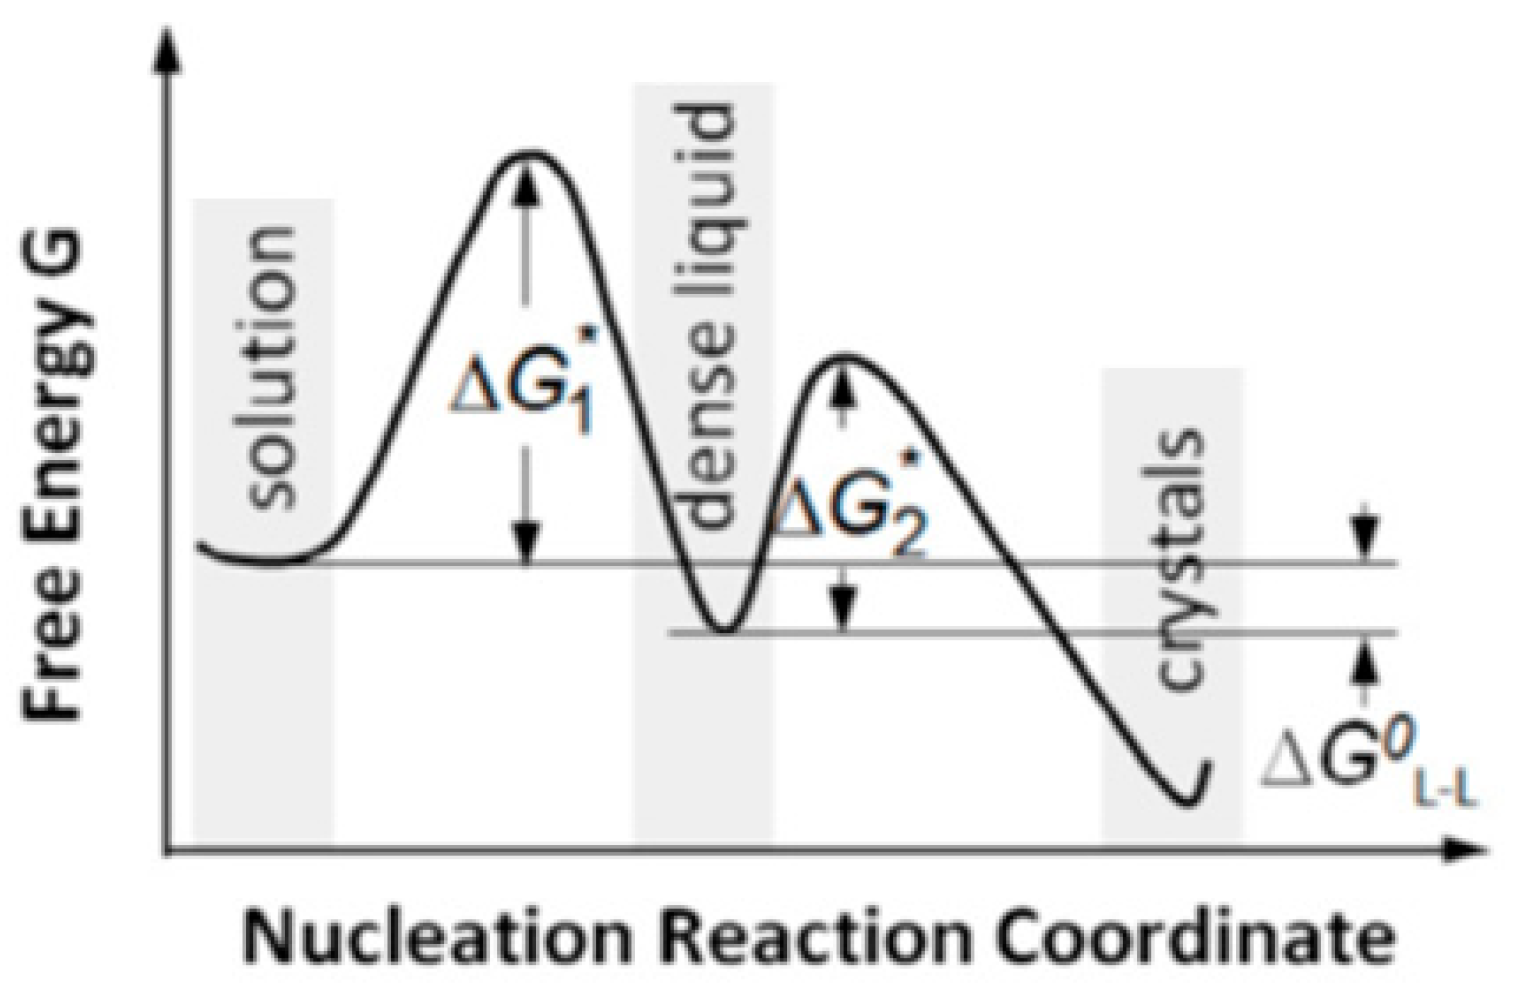
And being only densified, the droplets preserves some similarity to the mother phase, which lowers the phase-transition energy barrier. Therefore, the crystal nucleation
per se occurs at a lower energy barrier–significantly lower than the one needed for direct transition mother-phase-to-crystal occurring via the CNT mechanism. So, the single, relatively high energy barrier for crystal nucleation, which surmounting is required by CNT, is split into two lower barriers (see
Figure 2), which are surmounted easier.
TSNM also predicts rate
J of crystal nucleation [
23]:
where
U2 is rate of transformation of the precursor into a ordered crystal nucleus,
U1 is dissociation rate of the crystal precursor, and
U0 is temperature-dependent and protein-concentration-dependent rate of formation of liquid-like clusters in the supersaturated dilute solution;
E2 is the free-energy change needed for formation of an ordered cluster,
being the free-energy change needed for the formation of the intermediate phase.
Kashchiev [
24] has shown that CNT can provide a general conceptual and mathematical framework for describing the process of two-step nucleation, and to compare TSNM with CNT. And a comparison of TSNM with experimental data was provided by Vekilov [
2].
2. Comparison of CNT with Experiments
Experimentally, various methods have been used for observing crystal nucleation onset and for measuring the rate of protein crystal nucleation. First, as a non-invasive technique, scattering of light [
25,
26,
27,
28] finds wide application. Also, different techniques for measuring induction times for crystal nucleation, i.e., the times when the first crystal(s) are detected, e.g., see [
29,
30], etc. have been used. However, these techniques are indirect. The only quasi-direct method for measuring crystals nucleation rates is the so-called ‘double-pulse method’, DPT [
9,
15,
31,
32,
33,
34]. (Originally, the nucleation/growth separation method was used by Tamann [
31] who studied glass crystallization. Afterwards, Scheludko and Todorova [
32] adapted this method for electro-crystallization studies, calling it ‘double pulse technique’, DPT.) According to DPT, visible crystals are counted, and
J is determined from data for number densities
N of nucleated/grown crystals, relative to nucleating times,
t. Often the experimental points lie on sigmoid curves, e.g.,
Figure 3. In such cases, stationery nucleation rates are determined from the linear parts of
N vs.
t curves.
In this paper, the data from
Figure 3, are used to reaffirm that CNT also applies to the nucleation of protein crystals: It is seen that supersaturation change from 3.22 (in which the curve has a clearly expressed rectilinear part) to 3.69, i.e., for an increase of
B/Δ
μ2 of only about 15%,
J increases from about 1 nucleus.s
−1 to nearly 75 nuclei.s
−1. (Note that supersaturation 3.69 was the upper limit for DPT measurements, since a further supersaturation increase led to uncountable numbers of crystals.) In accordance with CNT, this result can be explained with the lower Δ
G*, which is due to the increase of Δ
μ2 (see Equation (2)).
Importantly, experimental studies have shown that the kinetics of the formation of crystal nuclei from proteins differs significantly from the kinetics of nucleation of crystals from small-molecule substances: Unusually high supersaturations are needed for protein crystal nucleation-typically, c/c
e = 800% and even more. And despite the high supersaturations, the protein crystal nucleation is distinctly slow. For instance, applying dimensionless supersaturations Δ
μ/
kBT between 2.1 and 3.7, Galkin and Vekilov [
15] measured
J for nucleation of hen-egg-white lysozyme (HEWL) crystals between 0.01 and 0.5 nuclei cm
−3 s
−1. Similar results for HEWL crystal nucleation,
J ≈ 0.03 to 0.10 nuclei cm
−2 s
−1, were obtained in my group for nucleation on bare glass, hexamethyl-disilazane and poly-L-lysine templates at dimensionless supersaturations Δ
μ/
kBT from 2.0 up to 2.5 (but under lower concentration than Galkin and Vekilov [
15] have used). Also, for ferritin crystal nucleation on the same templates, Tsekova et al. [
36] measured
J to be from 0.008 till 0.820 nuclei cm
−2 s
−1, with Δ
μ/
kBT between 2 and 4.
Besides, experimental studies have shown that despite the unusually high supersaturations required for the nucleation of biomolecular crystals, the energy barriers Δ
G* for nucleation of lysozyme [
9], insulin [
10], as well as for ferritin [
36] are of the same order of magnitude (10
−13 erg) as the values calculated for crystals constituted by small molecules. Therefore, the slower nucleation of biomolecular crystals should be attributed to a smaller pre-exponential factor
in Equation (1).
Based on these experimental results, the idea arose, as early as 2007, that the reason for the slow kinetics of protein crystal nucleation is rooted in the highly inhomogeneous surfaces of protein molecules [
37]. Considering the case of simultaneous condensation and structuring during the nucleation of protein crystals, i.e., from CNT point of view, it was argued that a collision between two protein molecules leading to the formation of the crystalline bond between them requires not only their sufficiently close approach, but also their suitable spatial orientation. As already noted, the reason is that only several small patches on the protein molecule surface are capable to form crystalline bonds [
37]. In turn, the need to meet the right patches imposes a severe steric restriction for the association of protein molecules, slowing down the process below reasonable values. However, performing computer Brownian dynamic simulations (BDS) of protein–protein molecule association (and approximating the protein molecule by hard spheres of equal radius of 18 Å, which is the typical of some small proteins), Northrup and Erickson proved that rotational diffusion mitigates the steric restriction for forming protein couples [
38]. On this basis, it was inferred [
37] that the rotational diffusional reorientation of a protein molecule toward meeting of the right patches also facilitates its joining to the critical nucleus. The results of the study of Northrup and Erickson [
38] are used in this paper to quantitatively consider: (1) why protein crystals nucleation is that slow, and (2) what is the effect of rotational diffusion on the probability of attachment of protein molecules to critical nuclei.
3. Why Do Protein Crystals Nucleate Much More Slowly than Crystals of Small Molecules?
As already mentioned, the highly inhomogeneous surfaces of protein molecules slows down the process of protein critical nucleation. And since in Equation (1) should be approximately the same for biomolecular and small-molecule crystal nucleation, and c1 can be varied in both cases, the slower nucleation of biomolecular crystals should be attributed to a smaller ν*+. That’s why the answer to the question put above lies in the way the crystalline bond between two protein molecules occurs.
First, by analyzing the molecular-kinetic mechanism of crystal bond formation, it can be shown that the low
ν*
+ can hardly be attributed to fewer hits between biomolecules. Especially for unstirred solutions, in which diffusion is the sole mechanism for the transport of molecules, this is not the case. Although the translational diffusion coefficient,
Dt, for proteins (which is 10
−6 to 5 × 10
−7 cm
2/s) is more than one order of magnitude smaller than the one for small molecules and inorganic crystals, the smaller
Dt is compensated by the small distances between the protein molecules in solutions under crystallization conditions; the reason for this is that such solutions are highly concentrated. According to Rosenberger et al. [
39,
40], the intermolecular distances can be comparable to their diameter, 2
R, where
R is the radius of the protein molecule; evidently, at such a short distance, the diffusing protein molecules move quickly enough.
To estimate the time,
τ, needed to move a protein molecule via translational diffusion at the distance 2
R, let us place the mean-square particle displacement
. And since
is:
with
where
η is the dynamic (or shear) viscosity, the result is:
Thus, for a protein molecule with radius
R = 10 nm, and with water viscosity
η ~ 0.01 poise [
41],
τ = 9.2 × 10
−6 s.
Since, in the volume of the solution (recall that Equation (1) is for homogeneous crystal nucleation), each protein molecule is surrounded (on all sides) by other protein molecules, any movement of a protein molecule at a distance 2R results in its collision with other protein molecules from the overcrowded surrounding. This leads to a very large number of collisions every second: about 1.1 × 10⁵ collisions per protein molecule per sec. Thus, an enormously large number of collisions of protein molecules in one cubic centimeter of solution is happening every second, and if every collision were successful, i.e., leading to the formation of intermolecular bonds, an extremely rapid formation of paired protein molecules should be expected. This would also mean rapid crystal bond formation.
However, this is not the real situation. Generating random collisions of hard spheres, Northrup and Erickson [
38] found that the probability of an effective collision leading to the formation of protein pairs is negligibly small: two protein molecules (of radius 18 Å) collide in a suitable position for their bonding space orientation with a probability of 2 × 10
−7. This gives about 2 × 10
−2 successful collisions per protein molecule per sec, which is very slow. This is the main reason to assume that the slow nucleation of protein crystals is due to the highly inhomogeneous surface of the protein molecules. However, the probability of attachment of protein molecules to the critical nucleus approaches the one that corresponds to the measured rates of protein crystal nucleation because the molecules perform rotational diffusion. Why?
In water solutions, the large protein molecules are subject to incessant collisions with water molecules. And while some of the energy arising from the collision of water molecules with a protein molecule is transferred to its translational kinetic energy, another energy part is transferred to torque [
41]. In plane words, due to the varied speeds, number, and directions of impact of water molecules colliding with a protein molecule, the latter not only performs translational diffusion but also a fluctuating torque generates on it. And due to the equipartition theorem, larger particles rotate more slowly than smaller objects do.
Especially important for the present consideration is the different behavior of large biomolecules and small molecules when they collide in water environments. In such environments, in contrast to small molecules, two biomolecules remain trapped close to each other after their first collision. So, being not completely separated, the biomolecules undergo many (on average, nine [
38]) additional collisions per encounter, and during the time intervals between the collisions, they can perform rotational diffusional reorientation towards a correct match.
4. Probability of Direct Attachment of Protein Molecules to Kink Sites and to Critical Nuclei
For spheres, the Stokes–Einstein–Debye relation gives the coefficient of rotational diffusion,
Dr (in units of radians
2/s), as:
Thus, since Dr is related to the radius of the sphere in power three, small differences in R will have a large impact on Dr. Therefore, when a crystal becomes large enough, so large that it does not rotate any more, only the incoming protein molecule adjusts rotationally to it. This is exactly the case of protein crystal growing by the direct embedding of molecules from the solution into the kink sites. And it is easy to show that, in this case, the probability, pk+, of embedding molecules in the kink sites of a growing crystal is many times greater than the probability of association of two protein molecules, p+.
In fact, the probability of meeting the bonding patches of two molecules in the appropriate spatial orientation (p
+) is tantamount to the probability of the simultaneous appearance of these patches in the same place in space. This means that p
+ is the product of the attachment probabilities (p
k+) of the two individual molecules. Hence, p
k+ is equal to the square root of p
+:
Thus, using the value of p+ ≈ 5.7 × 10⁻⁴ calculated in the section titled Probability of Forming Complexes of Two Protein Molecules, the probability of a protein molecules attaching directly from the solution into the kink sites is pk+ ≈ 2.4 × 10⁻² (about 42 times larger than p+).
Hence, since the critical nucleus rotates slower than the individual protein molecules (see Equation (8)), the probability of attachment of a molecule to the critical nucleus is between 5.7 × 10
−4 and 2.4 × 10
−2, but closer to the lower limit (the reason for this is that particles with a linear scale of about 1 μm do not rotate [
41]). Because larger nuclei rotate more slowly,
ν*
+ is larger for them.
In conclusion, importantly, because the size of the critical nucleus depends on Δμ, ν*+ also depends on Δμ, which is the fundamental difference from the CNT for the nucleation of crystal constituted by small molecules.
5. Time Scale of Rotational Reorientation of Biomolecules
To further clarify the role of the rotational reorientation of biomolecules in the nucleation (and growth) of protein crystals, we begin with the simplest case, this one of a sphere rotating around a fixed axis. Viewed from above this axis, the sphere is seen as a circle (
Figure 4), and a point at the rotating sphere periphery moves to consecutive positions characterized by angles
θ from 0 through 360 degrees, before having a complete rotation, i.e., reaching the starting position at 0 degrees. Obviously, rotating over sufficiently long periods of time, the point has had the entire range of angles,
θ, between the starting
θo and
θo + 2π. Therefore, at large enough times, the sum of all probabilities for possible 2π (radians) angles is equal to 1, meaning that, since the probability is evenly distributed through each angle, there is necessarily a point at some angle
θ along the circle, whose probability is
.
In analogy to the translational diffusion, the mean-square angular deviation
in time
t is:
Thus, using Equation (8), we have:
To calculate the time,
τr, that is needed for the vector
0A in
Figure 4 to visit all points of the circle, i.e., to make a complete circumference of 2π, we use the expression
:
Hence, for a protein molecule with radius R = 10 nm, τr = 2.4 × 10⁻⁴ s.
However, a complete circumference on 2π is superfluous: the bonding patches on the protein molecule surfaces are not points but occupy at least 10% of the protein surface [
38]. Importantly, partial overlaps can occur beforehand. As already seen, even if the bonding patches overlap only partially, there is a chance that this overlap will become a complete overlap (and of course, the larger the patch, the more probable the crystalline bond formation). Therefore, recalling that the protein molecules undergo, on average, nine additional collisions, the above calculated
τr value seems feasible; each collision between water and protein molecules lasts for the order of 10
−12 s, but in each individual collision the momentum of the protein molecule hardly changes. Such change results only from collisions with a great number of water molecules, and on a much longer timescale of about 10
−6 s and greater. Then, an erratic trajectory of the molecule in the configuration space of the physical system is observed [
41]. In conclusion, the calculated time,
τr, which is needed for a complete circumference on 2π is only the upper time limit for bonding between patches to occur. But, since the bonding patches on the protein molecule surfaces differ in size, non-universally valid
τr can be derived.
However, the complication is that, although not completely excluded (especially for small rotations), rotation around one fixed axis is rather an exception; rotation around more axes prevails by far. And roughly, the situation is equivalent to rotating πR circles about a fixed axis and simultaneously rotating each of these axis. This means that the number of positions to be visited increases πR times, i.e., that the desired angular positions on the sphere are reached more rarely. And again, the sizes of the bonding patches on the surfaces of the protein molecules are important for the creation of stable crystalline bonds (of course, the strength of the intermolecular interaction also plays a role). This raises the question of what these patches are.
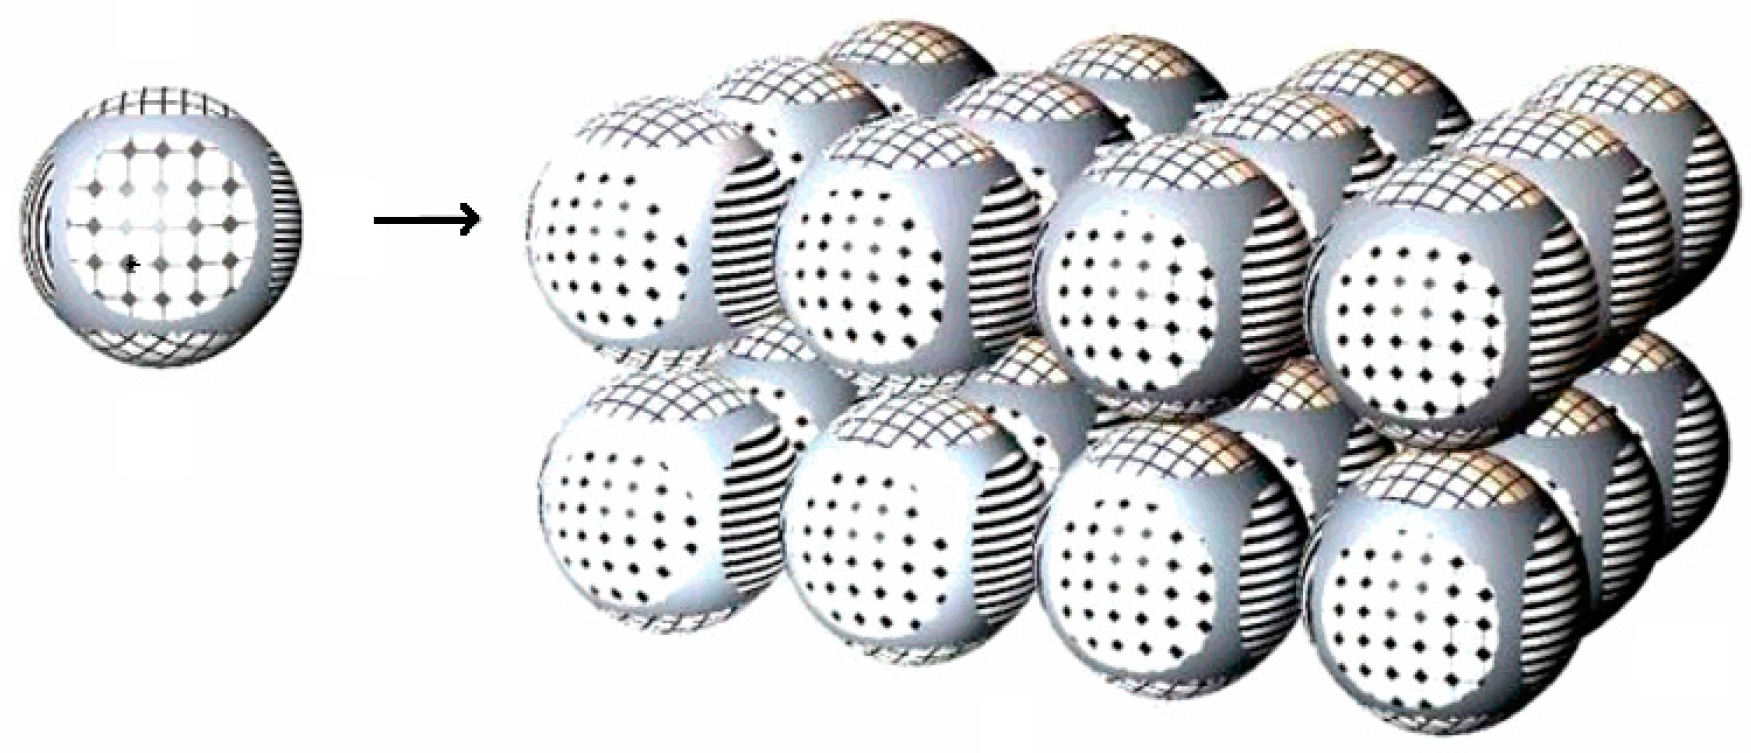
7. Discussions
Frequently, protein molecules that make up crystals are drawn as small circles (for example, see
Figure 1) or small spheres with homogeneous surfaces. However, such sketches are somewhat misleading. As already noted, reality is completely different: the inhomogeneity of the surfaces of protein molecules (e.g., see
Figure 5) determines the mechanism of their binding into crystal lattices. Although not accounted, either by CNT or by modern TSNM, this peculiarity of the protein crystal nucleation explain some deviations of measured nucleation rates from CNT predictions.
In this paper, accounting for the inhomogeneity of the surfaces of protein molecules, the reason for the slow nucleation rate of protein crystals has been revised. In doing so, the physical reasons for the slowness of nucleation are clarified. As a result of the reconsideration of the mechanism of the formation of protein crystal nuclei, quantitative values were calculated for (1) the number of collisions per protein molecule per sec, and how many of the strokes were successful; (2) for the probability of forming complexes of two protein molecules; (3) for the probability of the attachment of protein molecules to critical nuclei; (4) for the probability of direct attachment of protein molecules to kink sites. The study flags up the important fact that, to form crystalline bonds, the meeting protein molecules need to reorient to a suitable spatial position. Therefore, the time it takes for protein molecules to reorient themselves to locations that are suitable for the formation of crystalline bonds has been estimated.
In this paper, we have been looking at the rotation of near-spherical protein molecules. With them, rotation around each axis is equally likely and can be conservative. However, this is not the case with protein molecules, which deviate strongly from the spherical shape; in this case, the picture is substantially more complicated. For instance, according to the tennis racket theorem, rotation of a flat noncircular object (like a tennis racket) around its first and third principal axes is stable, whereas rotation around its second principal axis (which is an axis in the flat noncircular protein molecule that is perpendicular to the protrusion of the molecule) is unstable, i.e., non-conservative.
Importantly, this consideration applies not only to CNT but also to TSNM, according to which the rate determining, i.e., the slower stage of the process, is nucleus structuring [
2], i.e., the creation of crystal bonds between protein molecules.


