Abstract
This study explores the structural and chemical interactions between glacial water, ice Ih, and hydration clusters of divalent cations (Ca2⁺ and Mg2⁺). Ice Ih, with its hexagonal lattice and tetrahedral bonding network, is incompatible with the hydration shells of Ca2⁺ and Mg2⁺, which adopt octahedral geometries in aqueous solutions. During freezing, these hydration clusters become disordered, causing distortions in the ice structure. Slow freezing reduces these distortions, while rapid freezing traps ions in amorphous regions, preventing proper alignment of hydration clusters. Through advanced techniques such as chemical and isotopic analysis, computational modeling, and electrical impedance spectroscopy, this study examines ion exclusion mechanisms and water-clustering behaviors. The results show that both ions are largely excluded from the solid phase during freezing, with Mg2⁺ exhibiting stronger exclusion due to its smaller ionic radius and greater hydration energy. This study also highlights the role of sediments in modulating ion patterns in glacial ice. This work deepens our understanding of ion–ice interactions, offering insights for cryochemistry, hydrology, and environmental science. The integration of experimental and computational methods provides new perspectives on divalent cations’ role in modifying ice’s crystalline structure and explains isotopic variability in glacial waters.
1. Introduction
Various crystalline ice forms are studied, each possessing a unique structure and a specific arrangement of hydrogen atoms. The crystals of all ice modifications consist of H2O molecules interconnected by hydrogen bonds, forming a three-dimensional framework. These frameworks resemble individual tetrahedrons, each composed of four H2O molecules, although significant distortions exist in some ice structures. In the crystalline structure of natural ice (Ih), the hydrogen bonds are oriented toward the tetrahedron’s vertices, with angles approximating 109.5°. However, slight deviations may occur due to lattice dynamics [1]. It is worth noting that the bond angle within the water molecule itself is 104.5°. The tetrahedron closely approximates a regular geometric form with four triangular faces in ice structures Ic, VII, and VIII [2]. Conversely, the tetrahedrons are significantly distorted in ice structures II, III, V, and VI [3]. In structures VI, VII, and VIII [4], two interpenetrating systems of hydrogen bonds can be observed. An oxygen atom is at the center of each tetrahedron, while hydrogen atoms occupy two vertices. The electrons of these hydrogen atoms form covalent bonds with electron pairs of oxygen atoms. The remaining two vertices of the tetrahedron are occupied by non-bonding electron pairs of the oxygen atom, which do not contribute to molecular bonding.
Glacial ice is formed through the accumulation of snow from earlier geological epochs, and there is an intermediate form known as firn. Notably, glacial ice primarily exists in the crystalline form, Ih, characterized by its hexagonal lattice and well-defined tetrahedral hydrogen bonding network. This structure is the dominant form of ice under natural terrestrial conditions. However, other phases, such as ice VI and VII, can form under high-pressure conditions, stabilizing hydration clusters and enabling different ion-lattice interactions [4,5]. The interaction between freezing conditions and the structural behavior of ions and water molecules is critical in glacial ice formation. Ice phases VI and VII, which form under pressures exceeding 1 GPa, are irrelevant to natural terrestrial glaciers and should be explicitly identified as such. Slow freezing, typical of glacier systems, allows hydration shells around Ca2+ and Mg2+ to reorganize, reducing structural distortions in the hexagonal lattice. In contrast, rapid freezing leads to localized defects and amorphous regions, preventing proper alignment with the hydrogen bond network [6,7].
During the melting of ice, glacial water is formed. It has low mineralization, with a Total Dissolved Solids (TDS) value below 50 mg L−1. Water mineralization can increase via dissolving minerals from surrounding rocks [8]. Analyses of ion content have been conducted for glacial ice and water in Antarctica [9], the Austrian [10] and Swiss [11] Alps, the Chilean Andes [12], the Tien Shan [13], Greenland [14], the Himalaya [15], the Caucasus [16], and Canada [17]. Studies of metal ions, such as calcium, magnesium, sodium, etc., in glacial ice have also been performed [18,19]. The ionic radius and hydration energy of Ca2+ and Mg2+ play crucial roles in their interactions with ice Ih. Mg2+ has a smaller ionic radius (0.72 Å) compared to Ca2+ (1.00 Å), which results in a stronger hydration shell and higher hydration energy (−1922 kJ mol−1 for Mag2+ vs. −1590 kJ mol−1 for Ca2+). This stronger hydration effect leads to greater exclusion of Mg2+ from the ice lattice during freezing, as its hydration shell is more energetically unfavorable for incorporation into the hexagonal structure of ice Ih. Ice forms a stable hexagonal lattice due to hydrogen bonding. Positive metal ions, such as Ca2+ and Mg2+, form hydration clusters in aqueous solutions, frequently adopting an octahedral geometry. However, due to their incompatible structures, these ions induce local distortions during freezing in the ice lattice [20]. However, the interaction between these hydration layers and the ice lattice usually leads to local distortions rather than perfect alignment. In contrast, anions like HCO3− form less-structured hydrogen layers due to their delocalized charges and weaker interactions, lacking the symmetry of ice. Consequently, the similarity between ice and positive ion clusters makes them more suitable for comparative analysis.
Analyses of the structuring of hexagonal water clusters of the liquid phase of water were performed with magnetic fields, vortex [21] near hydrophilic and hydrophobic surfaces [22], with hydrogen ions (H+) in water [23].
The study in this article focuses on the dynamic processes of ion–hydration interactions and structural changes during the freezing and melting of distilled and glacial water with low concentrations of calcium and magnesium ions. The crystalline structure of ice Ih has been well studied using various methods, including X-Ray Diffraction (XRD) and Transmission Electron Microscopy (TEM), which are used to analyze stable water crystalline structures [24,25]. Fourier Transform Infrared (FT-IR) spectroscopy reveals differences in hydrogen bonding between water’s liquid and solid phases [26]. Our investigation showed a shift in the O-H stretching band to lower frequencies in ice Ih and the appearance of a characteristic lattice around 840 cm−1 [27]. Electrochemical Impedance Spectroscopy (EIS) demonstrated a decrease in ionic conductivity at temperatures of −0.1 °C and +0.1 °C, which is associated with the formation of stable hexagonal clusters that hinder ion transport.
The main objective of this study was to investigate the presence of Ca2+ and Mg2+ ions at low concentrations in glacial water and ice. Using experimental methods such as FT-IR spectroscopy, ICP-OES analysis, and the EIS method, we studied distilled and glacial water in liquid and solid phases to research physico-chemical indicators, interactions, and structural effects.
2. Materials and Methods
2.1. Fourier Transform Infrared (FT-IR) Spectroscopy
Different distilled water samples were measured using a Fourier-IR spectrometer Bruker Vertex (Bruker, Ettlingen, Germany) and Thermo Nicolet Avatar 360 Fourier transform IR. The spectral parameters were as follows: average IR—370–7800 cm−1; visible wavelength—2500–8000 cm−1; permission—0.5 cm−1; and accuracy of wave number—0.1 cm−1 on 2000 cm−1. The studies were performed at the Institute of General and Inorganic Chemistry, Bulgarian Academy of Sciences (BAS), Sofia, Bulgaria.
2.2. Electrochemical Impedance Spectroscopy (EIS)
The electrical and conductivity studies were conducted at temperatures close to 273.15 K using BioLogic potentiostat/galvanostat (SP-200), Claix, France. Complex electrical impedance spectroscopy [28] was applied in the 1 Hz–1000 kHz frequency range, as in our prior studies [29,30,31]. For the ionic conductivity and permittivity measurements, distilled water was poured between two parallel flat nickel plates, creating a plane electrical capacitance with a gap of 1 mm. The plates’ dimensions were 20 mm/12 mm.
2.3. Physico-Chemical Composition
Adhering to Directive (EU) 2020/2184, the water samples were studied in an accredited laboratory, Eurotest Control, Sofia, Bulgaria, in accordance with European Union standards [32,33].
2.4. Chemical Analysis
Sample Preparation
For liquid glacial water: filtration—filter the water sample through a 0.45 µm membrane filter to remove particulates; pH measurement—measure the initial pH of the sample using a calibrated pH meter.
For ice (solid-phase): melting—melt the ice sample in a clean, sterile environment at 293.15 K. Filtration and pH measurement.
pH adjustment: reagents: NH4Cl: 54 g L−1; 25% solution of NH3. Preparation of ammoniacal buffer (pH = 10): Dissolve 54 g of NH4Cl in 500 mL of distilled water. Add 350 mL of 25% NH3 solution and dilute it to 1 L with distilled water. Verify the pH after preparation.
Adjustment of sample pH: Add 1 mL buffer solution to every 50 mL sample. Measure pH and adjust it to 10 using a pH meter.
Measurement of Ca2+ and Mg2+ ions: Carry out complexometric titration with EDNA.
Reagents: EDTA solution (0.01 M); Eriochrome Black T indicator; and ammoniacal buffer (pH = 10).
Procedure: Add 50 mL of the prepared sample to a clean titration vessel. Then, add 2–3 mL of ammoniacal buffer and 2–3 drops of Eriochrome Black T indicator.
Separation of calcium and magnesium: To determine calcium content, raise the pH to 12 using NaOH, causing magnesium to precipitate as Mg(OH)2. The remaining calcium can then be titrated with EDTA.
Inductively Coupled Plasma Optical Emission Spectroscopy (ICP-OES): Measurements were performed using the PlasmaQuant 9100 series ICP-OES spectrometer (Analytik Jena, Jena, Germany). Standard calibration solutions were prepared at concentrations of 0.1; 0.5; and 1, 5, and 10 ppm. Three measurements were made for the lines corresponding to Ca2⁺ (317.9 nm) and Mg2⁺ (279.6 nm), with a relative standard deviation (RSD) of 0.5%.
2.5. Isotopic Composition
The following method was applied to study the deuterium content in distilled water [34,35]. The preliminary crystallized inorganic salts in D2O were used and dried in a vacuum. The heavy water was distilled over KMnO4 and analyzed using 1H-NMR spectroscopy via a Bruker WM-250 device (Bruker, Ettlingen, Germany) to ensure isotopic composition consistency. However, the relevance of these isotopic variations to the properties of glacial water should be clarified further. Also, we used a Bruker Vertex IR spectrometer with the following spectral parameters: average IR—370–7800 cm−1; visible wavelength—2500–8000 cm−1; permission—0.5 cm−1; and accuracy of wave number—0.1 cm−1 on 2000 cm−1).
3. Results and Discussion
3.1. Three-Dimensional Geometry of Hexagonal Geometry in the Solid Phase of Water and Octahedral Geometry of Water Molecules Around Ions in the Liquid Phase
Due to their high hydration energy and small ionic radii, the hydration shells of Ca2+ and Mg2+ induce localized distortions in the hexagonal lattice of ice Ih [36]. These distortions result from the mismatch between the stable octahedral geometry of hydration clusters and the tetrahedral arrangement of the water molecules in the ice. Slow freezing allows for a more significant reorganization of hydration shells and water molecules, while rapid freezing preserves amorphous or semi-crystalline regions around the ions [37]. Moreover, hydration clusters may become more stable under high-pressure conditions, particularly in denser phases such as ice VI or VII. Recent studies highlight that ion-induced distortions significantly impact the microclusters of ice, emphasizing the need for a deeper analysis of the relationship between freezing conditions and deformation in ice Ih [38]. In glacial systems, freezing occurs under relatively slow and stable conditions, which allows water molecules to form the well-organized hexagonal lattice of ice Ih.
In this structure, each oxygen atom is connected to four neighboring hydrogens through hydrogen bonds, participating in two donor and two acceptor interactions, stabilizing the hexagonal lattice. The periodic arrangement visible in the image suggests a large-scale simulation or model of the crystalline lattice of ice Ih, illustrating its spatial uniformity and hexagonal symmetry. The spacing and alignment between the atoms can be analyzed further to verify standard bond lengths (0.96 Å for O-H) and angles (104.5° Å for H-O-H), confirming the presence of the typical molecular geometry of water.
The hydration shell frequently undergoes distortions during freezing due to the interaction between octahedral clusters and the hexagonal lattice of ice Ih. During glacial ice formation, slow freezing allows water molecules within hydration clusters to align more effectively with the hydrogen bond network of ice Ih, thereby minimizing structural distortions [36].
In aqueous solutions, these ions are surrounded by six water molecules in a stable octahedral configuration as [Ca(H2O)6]2+ and [Mg(H2O)6]2+ [37]. However, this octahedral geometry often becomes partially disrupted during freezing, leading to structural rearrangements. This process creates local distortions in the hydrogen. When these ions interact with the hexagonal ice Ih lattice, they usually induce local distortions, potentially destabilizing the surrounding hydrogen bond network of ice Ih and affecting its stability [38,39]. In such cases, molecules around the ion retain an orientation resembling an octahedral geometry, albeit with slight deviations in bond lengths and angles. These ions frequently create defects or microscopic pockets of hydrated water within the ice structure, though the geometry may not always be intact. Additionally, the deformations induced by hydrated Ca2+ and Mg2+ ions in the hexagonal lattice of ice Ih vary significantly depending on the freezing rate and applied pressure [40]. Rapid freezing tends to preserve the hydrogen shells more effectively, leading to localized disruptions in the hydrogen bond network without full integration into the crystalline lattice. Conversely, slow freezing allows for more significant rearrangement and potential accommodation of these ions within the distorted lattice regions. Furthermore, high-pressure conditions, such as those in ice phases VI or VII, may stabilize compact hydration clusters due to their compatibility with denser lattice structures. This interplay highlights the importance of freezing dynamics and pressure in shaping the structural distortions induced by divalent cations in ice. Rapid freezing maintains the hydration shell more clearly, as amorphous or disordered regions prevent full integration into the crystalline ice structure; furthermore, in high-pressure ice phases such as VI or VII, the octahedral geometry remains stable in terms of adaptation to the denser and more symmetric lattice environment.
3.2. Fourier Transform Infrared (FT-IR) Spectroscopy
Fourier Transform Infrared (FT-IR) analysis was conducted on the distilled water and the ice created from this distillated water (Figure 1. The distilled water, which was chemically pure, had an electric conductivity of 4.3 µS cm−1, a pH = 7.2, and an ORP = +165 mV, was obtained from an accredited laboratory, namely, Eurotest control, Sofia, Bulgaria, under Directive (EU) 2020/2184 [32,33].
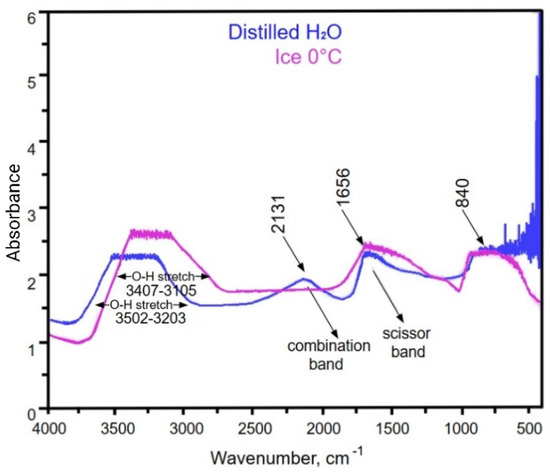
Figure 1.
FT-IR spectra of distilled water and ice.
The FT-IR spectrum represents distilled water frozen under laboratory conditions, resulting in the formation of ice Ih, the predominant crystalline form of ice at ambient pressure and sub-zero temperatures. Ice Ih is characterized by its hexagonal lattice and a well-structured hydrogen-bonding network, which influence its spectral features. In the FT-IR spectrum image (Figure 1), distilled water (blue) is compared with ice (violet).
Spectral Features and Comparison:
- The O-H stretching region for distilled liquid water is 3203–3502 cm⁻1, and the O-H stretching region for ice is 3105–3407 cm⁻1 [41].
- H-O-H bending (1656 cm⁻1): Both distilled water and ice peak at 1656 cm⁻1, corresponding to the “scissor band” created by the bending vibrations of water molecules [41].
- Lattice vibrations (~840 cm⁻1): A distinct feature around 840 cm⁻1 can be observed in the ice spectrum, corresponding to lattice vibrations. This peak is absent in the water spectrum, as the lattice vibrations are unique to the ordered crystalline structure of ice Ih [42,43].
Figure 1 shows that ice exhibits stronger absorption in the O-H stretching region (2831–3806 cm⁻1) and a prominent H-O-H bending peak at 1656 cm⁻1. The FT-IR spectrum reveals differences between liquid water and ice, emphasizing the role of hydrogen bonding in determining their structural and spectral properties. In ice, the hydrogen bonds are stronger and more stable, forming a highly ordered hexagonal lattice (ice Ih), which shifts the O-H stretching vibrations to lower wavenumbers (~3200 cm⁻1). Conversely, liquid water has weaker, more dynamic hydrogen bonds, resulting in a broader absorption band around ~3400 cm⁻1, reflecting its more heterogeneous and less structured network [38]. The stronger peak at 1656 cm−1 in ice highlights the higher structural organization of water molecules in the solid phase. The peak at ~840 cm⁻1 corresponds to the lattice vibrations specific to ice Ih, which are absent in liquid water [44].
3.3. Firn: A Key Intermediate in Glacier Formation
Firn is a transitional stage between snow and glacial ice, formed over the years under the pressure of accumulating snowfall and partial melting and refreezing [45,46,47]. It is an essential component in glaciology, marking the transformation of loose snowflakes into dense, compact ice. Firn typically has a density between 0.55 and 0.83 g cm−3, bridging the gap between freshly fallen snow and the denser ice found more deeply within glaciers. The time required for snow to become firn depends on a glacier’s temperature, accumulation rates, and geographic conditions.
3.4. Electrical Impedance Spectroscopy Analysis of Distilled Water at Freezing Temperatures
Complex electrical impedance spectroscopy is a powerful method for investigating the ionic conductivity and permittivity of condensed matter layers [28]. Figure 2 shows the corresponding real Z′ and imaginary Z″ parts of the complex electrical impedance in a Nyquist plot of a distilled water capacitor. There is a specific contour of a semicircle in the studied frequency range, which can be explained by the simplified parallel circuit arrangement of bulk resistance and bulk capacitance. This could be assumed to be a result of ion movement and the occurrence of water cluster migration [48].
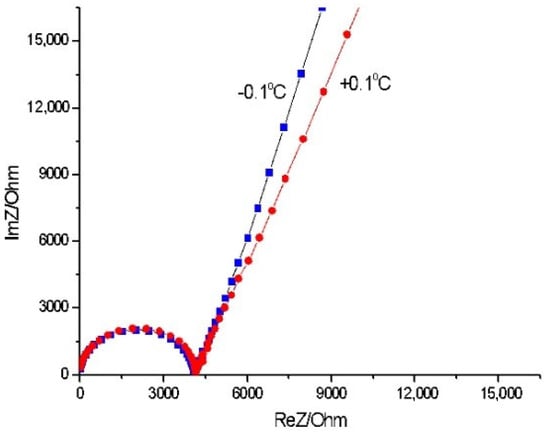
Figure 2.
Nyquist complex impedance plot of real (Z′) and imaginary (Z″) parts of electrical impedance of 1 mm thick distilled water layer at freezing temperatures.
The relation σ = t/(A × R), where t is the gap and A is the electrode area of the capacitor, was used to calculate the ionic conductivity (σ) of the water sample. The bulk resistance, R, was obtained from the intercept of the semicircle with respect to the Z′ axis. The conductivity σ estimated at room temperature was 4.3 µS cm−1. Upon approaching freezing temperatures, conductivity decreased to 0.46 µS cm−1. This could have been due to an enhancement of cluster formation in the water close to the solid-phase ice [49]. Certainly, this deteriorates the ion transport in the water and hence reduces the ionic conductivity of the water film [34,37].
Another aspect of interest regarding the formation of clusters in water is their influence on the dielectric properties of water. These dielectric properties can be estimated by measuring the dielectric permittivity of a material. In an alternating electric field, the relative permittivity is a complex function that is defined as ε* = ε′ − j ε″. The real Z′ and imaginary Z″ parts of complex impedance are used for the evaluation of the real (ε′) and imaginary (ε″) parts of dielectric permittivity using the following relations [50]:
where C0 is vacuum capacitance (C0 = ε0A/t, where ε0 = 8.85 × 10⁻¹² F/m is the permittivity of free space). The angular frequency is given as ω = 2πf, where f is the frequency of the applied electric field. The real part of complex dielectric permittivity ε′ has the same significance as that of the ordinary dielectric constant of the water.
Figure 3 presents the frequency dependency of the imaginary (a) and real (b) parts of the dielectric permittivity of the studied distilled water. The water layer demonstrates a higher dielectric permittivity at positive temperatures close to 0 °C. Water exhibits an increased dielectric response at low frequencies when compared to ice. This can be ascribed to hexagonal water clusters’ ability to decompose into free ions [35,37].
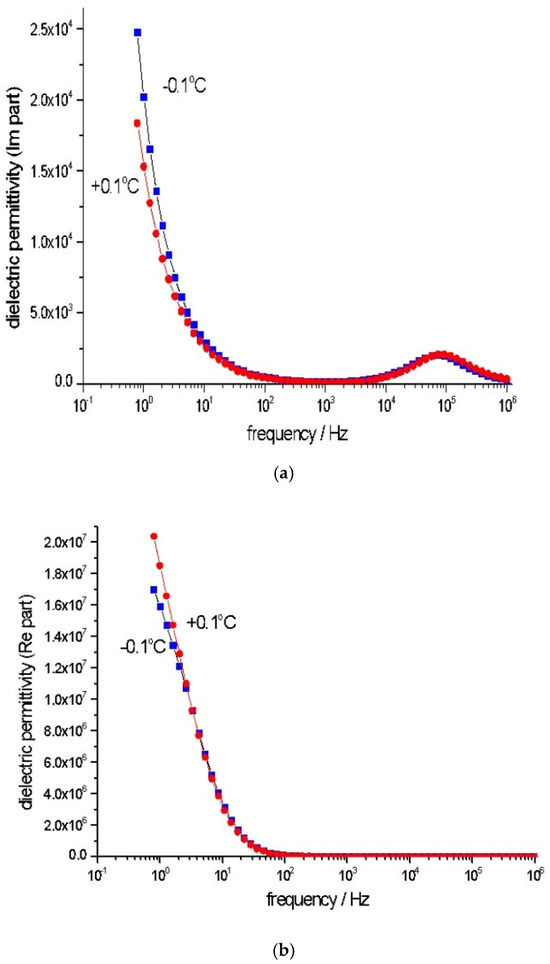
Figure 3.
Frequency spectra of the imaginary (a) and real (b) parts of the dielectric permittivity of a 1 mm thick layer of distilled water at −0.1 °C and +0.1 °C.
Analysis of the Curves
In the ~1–10 Hz frequency range, the dielectric permittivity (ε″) is higher at −0.1 °C than +0.1 °C. This suggests more intense dipolar relaxation and stronger polarization at −0.1 °C, where a greater number of hydrogen-bonded water clusters interact with the electric field. Both temperatures show similar values in the ~10–104 Hz frequency range, indicating that the relaxation mechanism is less dependent on the water type at −0.1 °C and +0.1 °C. The difference between the two curves decreases in the ~104–106 Hz range, and at higher frequencies, dipolar molecules do not have sufficient time to reorient themselves in response to the changing electric fields, leading to similar dielectric behavior. At −0.1 °C, which is close to the freezing point, the formation of hexagonal hydrogen-bonded clusters is favored. These structures lead to higher dielectric losses (ε″) in the ~1–10 Hz range. At +0.1 °C, the water is more liquid-like, with less hexagonal structuring of ice. The reduced number of hydrogen-bonded clusters results in lower dielectric permittivity in the same frequency range. The polarization response is weaker as the molecules are more dynamic and able to orient more freely.
3.5. Physico-Chemical Composition
The results regarding the physicochemical compositions of the four glacial water samples are presented in Table 1. The first results marked with (*) for Ca2+ and Mg2+ ions were measured with Inductively Coupled Plasma Optical Emission Spectroscopy (ICP-OES). The second set of results was obtained in the EU-licensed laboratory Eurotest Control, Sofia, Bulgaria.

Table 1.
Results regarding the physicochemical compositions of four glacial water samples.
For the first group, according to the results of the Student’s t test, the amounts of Ca2+ ions present were not statistically different at a significance level of p < 0.001, and the coefficient of correlation was 0.999. The results indicate a strong positive correlation (r = 0.999) between the two analytical methods used for ion concentration measurement, affirming their reliability.
For the second group, according to the results of the Student’s t test, the results regarding the number of Mg2+ ions were not statistically different at p < 0.001, and the coefficient of correlation was 0.999. The results demonstrate a robust positive correlation (r = 0.999) between the two analytical methods employed for ion concentration measurement, confirming their accuracy and consistency.
The results for Ca2⁺ and Mg2⁺ ions showed no statistically significant differences between the two analytical methods, as determined by the Student’s t-test at p < 0.001. In both cases, the correlation coefficient of r = 0.999 indicates a robust positive correlation, affirming the reliability, accuracy, and consistency of the methods for ion concentration measurement.
3.6. Water Molecules in Ice Ih from Glacial Ice, Clustered in the Presence of Ca2⁺ and Mg2⁺ Ions
Table 2 demonstrates that the concentrations of calcium (Ca2+) and magnesium (Mg2+) ions in the solid phase (ice) measured using the ICP-OES method are significantly lower than those in the liquid phase, which is a result of the ion exclusion process during freezing.
Table 2.
Concentrations of calcium (Ca2+) and magnesium (Mg2+) ions in the liquid (*) and solid phases (ice) of water.
The results show that Mg2+, with its smaller ionic radius and greater hydration energy, is less likely to integrate into the hexagonal structure of glacial ice, whereas Ca2+ exhibits slightly more excellent retention in the solid phase. Experimental methods and computational modeling were used to investigate the exclusion of Mg2⁺ and Ca2⁺ from the ice Ih lattice. Data obtained from ICP-OES and FT-IR analysis confirmed the higher exclusion tendency of Mg2+, attributed to its smaller ionic radius and higher hydration energy. These findings are consistent with theoretical predictions based on differences in hydration energy and the structural incompatibility of hydration shells with the hexagonal ice Ih lattice [36,38,39,51]. These results are consistent with studies showing that slower freezing rates in natural glacial systems promote more effective ion exclusion, whereas rapid freezing tends to trap impurities in amorphous or semi-crystalline regions [52].
The concentration of calcium ions in the liquid phase is 9.3 to 18.3 times higher than in the solid phase. This is likely due to the glacier’s chemical composition and lower mineralization. The differences in magnesium ion concentrations are even more pronounced, with the liquid-phase concentrations being 12 to 20 times higher than those in the solid phase. This reflects the greater tendency of magnesium ions to be excluded from the crystalline ice structure, a phenomenon attributed to their greater hydration energy and smaller ionic radius.
The data confirm the ion exclusion mechanism during freezing, where ions predominantly accumulate in the liquid phase or become trapped within micropores in the ice due to their incompatibility with the crystalline ice lattice. A comparative analysis of the Ca2⁺ and Mg2⁺ ratios in the liquid and solid phases revealed a statistically significant difference (p = 0.047, p < 0.05). A strong positive correlation (r = 0.96) was observed between the ratios of calcium (Ca2+) and magnesium (Mg2+) ions in the liquid phase compared to those in the solid phase in glacial water. This suggests that the ion exclusion processes during freezing are similar for these two ions and influenced by common factors. Both ions are excluded from the crystalline structure of ice due to their inability to integrate into the hexagonal arrangement of water molecules. However, magnesium ions exhibit a greater tendency for exclusion, as indicated by their higher ratios. This is likely due to their greater hydration energy and smaller ionic radii than calcium ions.
The empirical data support the discussion on ion exclusion ratios during freezing, but our analysis could be enhanced by incorporating more recent studies. For instance, Bergstrom et al. [51] demonstrated the spatial distribution of major ions in near-surface glacial ice and highlighted the influence of sediment concentration on ionic patterns. These findings emphasize the importance of external factors, like sediments and freezing conditions, in shaping the ion exclusion dynamics observed in this study. The interaction between hydration clusters around divalent cations like Ca2+ and Mg2+ and the ice Ih structure is highly dependent on the freezing rate. Slow freezing, characteristic of glacier formation, enables the partial rearrangement of hydration shells into configurations compatible with the hexagonal lattice. A discussion on the environmental factors affecting freezing dynamics, such as sediment content, impurity levels, and local variations in freezing rates, would enhance this analysis. These factors significantly influence both the ion exclusion process and microstructure of glacial ice, minimizing structural distortions as water molecules in the hydration clusters align with the hydrogen bond network of ice Ih [53].
Conversely, under rapid freezing conditions, the hydration clusters like [Ca(H2O)6]2+ and [Mg(H2O)6]2+, which are octahedral in structure, are incompatible with the tetrahedral symmetry of ice Ih. This leads to localized amorphous defects [54]. However, this process is less prominent in glaciers due to their gradual accumulation and slower freezing rates, which facilitate better molecular ordering. Scientific studies have highlighted that the exclusion of ions like Ca2+ and Mg2+ during freezing is primarily due to their inability to integrate fully into a crystalline lattice. This leads to the accumulation of these ions in the liquid phase or in micro pockets of water trapped within the ice [55]. Moreover, impurities and micro-inclusions in glacial ice can affect its microstructural and mechanical properties, including its flow dynamics and deformation rates [51]. These findings emphasize the critical role of hydration energy and ionic radii in shaping ion exclusion mechanisms.
3.7. Structure of Water Clusters with Ca2+ and Mg2+ Ions in Glacial Ice
Studies have investigated clusters containing calcium ions in the solid phase of water. The following clusters were described: [Ca(H2O)4]2+, [Ca(H2O)6]2+, [Ca(H2O)7]2+, and [Ca(H2O)8]2+ [20]. Persson proved that some solid-phase structures contain dimeric hydrated calcium ions where two or three water molecules form bridges between calcium ions. For example, in the cluster [(H2O)4Ca(H2O)2Ca(H2O)4]4+, each calcium ion is six-coordinated, which enhances the stability of the hydration cluster under specific conditions [20]. Additional structures with seven- and eight-coordinated calcium ions have also been reported, providing insight into the flexibility of hydration shells under varying environmental conditions [19]. In glacial ice structures, clusters like [Ca(H2O)6]2+ and [(H2O)4Ca(H2O)2Ca(H2O)4]4+ are considered the most compatible with the crystalline lattice [20,41]. These clusters’ coordination numbers and compact geometries help minimize disruption to the crystalline ice matrix.
The octahedral geometry of [Ca(H2O)6]2+ is compact and allows for optimal arrangement of hydrogen bonds and electrostatic interactions. This cluster interacts with the ice lattice with lower energy, as its geometry will enable it to form hydrogen bonds without causing significant distortion to the ice structure. Similarly, the dimeric cluster [(H2O)4Ca(H2O)2Ca(H2O)4]4+ is considered relatively stable in ice due to its compact structure (CN = 6) and ability to form hydrogen bond bridges. However, its compatibility with the hexagonal ice lattice is not perfect.
When Ca2+ and Mg2+ ions are present during freezing, they may form compact hydration clusters that resist full integration into the hexagonal lattice. Experimental data indicate that while [Ca(H2O)6]2+ and [Mg(H2O)6]2+ retain their geometries in some cases, these clusters often lead to microstructural distortions within ice Ih. Molecular simulations and diffraction studies have revealed that these distortions may range from small shifts in hydrogen bond angles to significant local rearrangements of water molecules. Additionally, under high-pressure conditions (e.g., ice phases VI and VII), the compact geometries of these clusters make them more compatible with denser and symmetric ice structures than hexagonal ice Ih.
In glacial systems, freezing occurs under relatively slow and stable conditions, which allow water molecules to form the well-organized hexagonal lattice of ice Ih. The interaction between hydration clusters around divalent cations like Ca2+ and Mg2+ and the ice Ih structure highly depends on the freezing rate. Slow freezing, characteristic of glacier formation, enables the partial rearrangement of hydration shells into configurations compatible with the hexagonal lattice. This minimizes structural distortions, as water molecules in the hydration clusters can align with the hydrogen bond network of ice Ih [53,54]. Conversely, under rapid freezing conditions, hydration clusters such as [Ca(H2O)6]2⁺ and [Mg(H2O)6]2⁺, which are octahedral in structure, are incompatible with the tetrahedral symmetry of ice Ih. This results in localized amorphous defects [55]. This process is less prominent in glaciers due to their gradual accumulation and freezing rates, facilitating better molecule ordering. Scientific studies have highlighted that the exclusion of ions like Ca2+ and Mg2+ during freezing is driven by their inability to integrate into a crystalline lattice fully. This leads to the accumulation of these ions in the liquid phase or within micro pockets of water trapped in ice [53]. Similar mechanisms of ion exclusion have been observed in desalination processes, where hydration energy governs ion retention and transfer through membranes [56,57].
3.8. Isotopic Composition of Deuterium in Glacial Water
Variations in deuterium content between regions are logical and supported by previous observations [58,59]. However, information on the influence of climatic and geographical factors would benefit from further examination, particularly with respect to the isotopic processes driving fractionation. Incorporating regional climatic data would help validate the isotopic interpretations. This includes parameters such as local temperature gradients, altitude effects, and sources of oceanic moisture, all of which shape the isotopic signatures in glacial waters. The variations in the deuterium content of glacial waters reflect the combined effects of climatic, geographical, and isotopic fractional processes. One of the primary mechanisms influencing deuterium variability is Rayleigh distillation, which occurs during water’s phase changes in the hydrological cycle. As water vapor condenses, lighter isotopes (e.g., H216O) preferentially evaporate, leaving the remaining liquid phase enriched in heavier isotopes like HDO. This effect intensifies under colder temperatures and with increasing altitude and latitude. The Rayleigh distillation model provides a robust framework for interpreting these isotopic trends in glacial ice and their relationship with past climatic conditions [60]. Atmospheric fractionation of hydrogen isotopes also plays a critical role. During evaporation, kinetic effects enrich vapor in lighter isotopes, while selective condensation removes heavier isotopes, creating isotopic gradients that are preserved in precipitation and glacial water. These gradients are influenced by regional factors such as temperature, altitude, and distance from oceanic moisture sources, leading to distinct isotopic signatures for each glacier [61]. Recent studies, including isotope analyses of polar ice cores, have demonstrated that (D/H) ratios in glacial ice are potent indicators of paleoclimate conditions, as they reflect variations in temperature and atmospheric circulation patterns over time [62]. Integrating such isotopic models with this study would provide deeper insights into the processes shaping the isotopic compositions of glacial waters.
Pre-crystallized inorganic salts in D2O were used and subsequently dried under vacuum conditions. The heavy water was then distilled in the presence of KMnO4 and analyzed using 1H-NMR spectroscopy via a Bruker WM-250 device to ensure consistency in the isotopic composition. The results revealed variations in the deuterium content of glacial water from different geographical regions (Table 3).
Table 3.
Results revealed variations in the deuterium content of glacial water from different geographical regions, as follows.
These findings indicate variations in deuterium content depending on the geographical origin of the glacial water. The highest deuterium concentration was observed in the Hallstätter (Austrian Alps) samples—103.7 ppm. The lowest concentration was measured in the Mappa (Chilean Andes) samples—91.3 ppm. These variations highlight the relationship between isotopic composition and the climatic and geographical characteristics of water sources. The data provide a foundation for further studies on the properties of glacial waters and their connection to isotopic variations.
4. Conclusions
This study investigates the dynamic processes of ion–hydration interactions and structural changes during the freezing and melting of distilled and glacial water containing low concentrations of calcium and magnesium ions. While the crystalline structure of ice Ih has been well documented through methods such as X-Ray Diffraction (XRD) and Transmission Electron Microscopy (TEM), which primarily analyze static crystalline structures, this research focuses on the dynamic transformation of ion–water interactions during phase transitions and their effect on the ice lattice.
The results demonstrate that the hexagonal lattice of ice Ih, with its well-defined tetrahedral hydrogen bonding network, is incompatible with the hydration shells of divalent cations (Ca2+ and Mg2+), which adopt octahedral geometries in aqueous solutions. Upon freezing, these hydration clusters induce local distortions in the ice lattice, disrupting its symmetry and affecting its microstructure. Both ions are predominantly excluded from the solid phase during freezing, with Mg2+ showing a stronger exclusion effect due to a smaller ionic radius and higher hydration energy (−1922 kJ mol−1) compared to Ca2+ (−1590 kJ mol−1). The exclusion process significantly impacts the physicochemical composition and structural organization of ice Ih, influencing glacial water properties. Fourier Transform Infrared (FT-IR) spectroscopy results confirmed these structural changes, revealing a shift in the O-H stretching band to lower frequencies in ice Ih and the appearance of characteristic lattice vibrations around 840 cm−1, highlighting modifications in hydrogen bonding. Similarly, Electrochemical Impedance Spectroscopy (EIS) results demonstrated that ionic conductivity decreases at −0.1 °C compared to +0.1 °C, a phenomenon attributed to the formation of stable hexagonal water clusters that hinder ion transport. The stronger hydrogen bonding at lower temperatures leads to higher dielectric losses (ε″) in the low-frequency range (~1–10 Hz), whereas at higher frequencies (~104–106 Hz), dipolar molecules are unable to reorient themselves quickly enough, resulting in similar dielectric behavior across both temperatures. These findings provide new insights into the role of divalent cations in modifying the crystalline structure of ice Ih, further emphasizing their inability to integrate into the hexagonal lattice. This study provides a deeper understanding of ion–ice interactions, with significant implications for cryochemistry, hydrology, and environmental contamination, showing that ice Ih may be suitable for drinking and domestic use due to its low ionic content. This article was written in memory of Oleg V. Mosin (1966–2016).
Author Contributions
Methodology, I.I., Y.G.M. and T.P.P.; software, M.T.I., Z.D. and I.G.; validation, M.T.I.; formal analysis, P.V. and F.H.; investigation, I.I., Y.G.M. and T.P.P.; resources, I.I., T.P.P. and G.G.; data curation, I.I. All authors have read and agreed to the published version of the manuscript.
Funding
This research received no external funding.
Data Availability Statement
Data are contained within the article.
Conflicts of Interest
Author Fabio Huether was employed by the company EVODROP AG. Authors Zhechko Dimitrov and Irina Gotova were employed by the company LB-Bulgaricum PLC. The remaining authors declare that the research was conducted in the absence of any commercial or financial relationships that could be construed as a potential conflict of interest.
References
- Leppäranta, M. Structure and properties of lake Ice. In Freezing of Lakes and the Evolution of Their Ice Cover; Springer Praxis Books; Springer: Cham, Switzerland, 2023. [Google Scholar]
- Doi, H.; Takahashi, K.Z.; Aoyagy, T. Mining of effective local order parameters of classify ice polymorphs. Phys. Chem. A 2021, 125, 9518–9526. [Google Scholar] [CrossRef] [PubMed]
- Gao, S.; Zhao, G.; Wang, D. Inherent structures of water using fully ab initio simulations. Phys. Chem. Chem. Phys. 2023, 25, 19175–19181. [Google Scholar]
- Zheligovskaya, E.A.; Lyakhov, G.A. Structural mechanisms of transitions between ices with different densities—Features of water phase diagrams. Phys. Wave Phenom. 2024, 32, 209–219. [Google Scholar] [CrossRef]
- Kuhs, W.F.; Finney, J.L.; Vettier, C.; Bliss, D.V. Structure and hydrogen ordering in ices VI, VII, and VIII by neutron powder diffraction. J. Chem. Phys. 1984, 81, 3612–3623. [Google Scholar] [CrossRef]
- Bohleber, P.; Larkman, P.; Stoll, N.; Clases, D. Quantitative insights on impurities in ice cores at the micro-scale from calibrated LA-ICP-MS Imaging. Geochem. Geophys. Geosyst. 2024, 25, e2023GC011425. [Google Scholar] [CrossRef]
- Ro, S.; Park, J.; Yoo, H.; Han, C.; Lee, A.; Lee, Y.; Kim, M.; Han, Y.; Svensson, A.; Shin, J.; et al. Millennial-scale variability of Greenland dust provenance during the last glacial maximum as determined by single particle analysis. Sci. Rep. 2024, 14, 2040. [Google Scholar] [CrossRef]
- Hindshaw, R.S.; Reynolds, B.C.; Wiederhold, J.G.; Ruben Kretzschmar, R.; Bourdon, B. Calcium isotopes in a proglacial weathering environment: Damma glacier, Switzerland. Geochim. Cosmochim. Acta 2011, 75, 106–118. [Google Scholar] [CrossRef]
- Vasil’chuk, K. Physical Properties of glacial and ground ice. Types and Properties of Water. In Encyclopedia of Life Support Systems (EOLSS); Khublaryan, M.G., Ed.; Developed Under the Auspices of the UNESCO; Eolss Publishers: Paris, France, 2015; Volume 2, pp. 107–152. [Google Scholar]
- Wagner, T.; Seelig, S.; Helfricht, K.; Fischer, A.; Avian, M.; Krainer, K.; Winkler, G. Assessment of liquid and solid water storage in rock glaciers versus glacier ice in the Austrian Alps. Sci. Total Environ. 2021, 800, 149593. [Google Scholar] [CrossRef]
- Del Siro, C.; Scapozza, C.; Perga, M.E.; Lambiel, C. Investigating the origin of solutes in rock glacier springs in the Swiss Alps: A conceptual model. Front. Earth. Sci. 2023, 11, 1056305. [Google Scholar] [CrossRef]
- Fox, E.; Schwartz-Marin, E.; Rangecroft, S. Water resource’ framing for the value and governance of glacier water availability in the semi-arid Chilean Andes. Front. Water 2024, 6, 1367889. [Google Scholar] [CrossRef]
- Zhang, Q.; Chen, Y.; Li, Z.; Xiang, Y.; Li, Y.; Sun, C. Recent changes in glaciers in the Northern Tien Shan, Central Asia. Remote Sens. 2022, 14, 2878. [Google Scholar] [CrossRef]
- Mu, Y.; Wei, Y.; Wu, J.; Ding, Y.; Shangguan, D.; Zeng, D. Variations of Mass Balance of the Greenland Ice Sheet from 2002 to 2019. Remote Sens. 2020, 12, 2609. [Google Scholar] [CrossRef]
- Attaullah, H.; Khan, A.; Khan, M.; Atta, H.; Iqbal, M.S. Implications of accuracy of global glacier inventories in hydrological modeling: A case study of the Western Himalayan Mountain Range. Water 2023, 15, 3887. [Google Scholar] [CrossRef]
- Tielidze, L.G.; Jomelli, V.; Nosenko, G.A. Analysis of regional changes in geodetic mass balance for all Caucasus glaciers over the past two decades. Atmosphere 2022, 13, 256. [Google Scholar] [CrossRef]
- Rivera, A.; Calderhead, A.I. Glacial Melt in the Canadian Rockies and Potential Effects on Groundwater in the Plains Region. Water 2022, 14, 733. [Google Scholar] [CrossRef]
- Lilbæk, G.; Pomeroy, J.W. Ion enrichment of snowmelt runoff water caused by basal ice formation. Hydrol. Process. 2008, 22, 2758–2766. [Google Scholar] [CrossRef]
- Grieman, M.M.; Hoffman, H.M.; Humby, J.D.; Mulvaney, R.; Nehrbass-Ahles, C.; Rix, J.; Thomas, E.R.; Tuckwell, R.; Wolff, E.W. Continuous flow analysis methods for sodium, magnesium and calcium detection in the Skytrain ice core. J. Glaciol. 2022, 68, 90–100. [Google Scholar] [CrossRef]
- Persson, I. Structures of hydrated metal ions in solid state and aqueous solution. Liquids 2022, 2, 210–242. [Google Scholar] [CrossRef]
- Iliev, M.T.; Huether, F.; Ignatov, I.; Gramatikov, P.S. Education of students on Physics and Chemistry with effects of water filtration. Modeling of water clusters and hexagonal structures. Eur. J. Contemp. Educ. 2023, 12, 1546–1560. [Google Scholar]
- Chen, P.; Xu, Q.; Ping, Z.; Chen, Q.; Xu, J.; Cheng, Z.; Qiu, X.; Meng, S.; Yao, N. Identification of a common ice nucleus on hydrophilic and hydrophobic close-packed metal surfaces. Nat. Commun. 2023, 14, 5813. [Google Scholar] [CrossRef]
- Heine, N.; Fagiani, M.R.; Rossi, M.; Wende, T.; Berden, G.; Blum, V.; Asmis, K.R. Isomer-selective detection of hydrogen-bond vibrations in the protonated water hexamer. J. Am. Chem. Soc. 2013, 135, 8266–8273. [Google Scholar] [CrossRef] [PubMed]
- Esmaeildoost, N.; Jönsson, O.; McQueen, T.A.; Ladd-Parada, M.; Laksmono, H.; Loh, N.-T.D.; Sellberg, J.A. Heterogeneous Ice Growth in Micron-Sized Water Droplets Due to Spontaneous Freezing. Crystals 2022, 12, 65. [Google Scholar] [CrossRef]
- Park, J.S.; Noh, N.; Park, J.; Shim, Y.; Park, S.; Qureshi, Y.; Kang, S.; Huh, Y.; Lee, C.-W.; Yuk, J.M. Phase transition of cubic ice to hexagonal ice during growth and decomposition. Nano Lett. 2024, 24, 11504–11511. [Google Scholar] [CrossRef]
- Rowland, B.; Kadagathur, N.S.; Devlin, J.P.; Buch, V.; Feldman, T.; Wojcik, M.J. Infrared spectra of ice surfaces and assignment of surface-localized modes from simulated spectra of cubic ice. J. Chem. Phys. 1995, 102, 8328–8341. [Google Scholar] [CrossRef]
- Bertie, J.E.; Whalley, E. Infrared spectra of ices Ih and Ic in the range 4000 to 350 cm−1. J. Chem. Phys. 1964, 40, 1637–1645. [Google Scholar] [CrossRef]
- Wang, S.; Zhang, J.; Gharbi, O.; Vivier, V.; Gao, M.; Orazem, M.E. Electrochemical impedance spectroscopy. Nat. Rev. Methods Primers. 2021, 1, 41. [Google Scholar] [CrossRef]
- Marinov, Y.G.; Hadjichristov, G.B.; Vlakhov, T.E.; Koduru, H.K.; Scaramuzza, N. Electrochemical impedance and dielectric spectroscopy study of TiO2-nanofilled PEO/PVP/NaIO4 ionic polymer electrolytes. Bulg. Chem. Commun. 2020, 52, 57–61. [Google Scholar]
- Vlakhov, T.; Marinov, Y.G.; Hadjichristov, G.; Scaramuzza, N. Electrical conductivity properties of solid polymer electrolytes PEO-PVP-NaIO4 filled with TiO2 nanoparticles. C. R. Acad. Bulg. Sci. 2022, 75, 804–811. [Google Scholar] [CrossRef]
- Koduru, H.K.; Scarpelli, F.; Marinov, Y.G.; Hadjichristov, G.G.; Rafailov, P.M.; Miloushev, I.K.; Petrov, A.G.; Godbert, N.; Bruno, L.; Scaramuzza, N. Characterization of PEO/PVP/GO nanocomposite solid polymer electrolyte membranes: Microstructural, thermo-mechanical, and conductivity properties. Ionics 2018, 24, 3459. [Google Scholar] [CrossRef]
- Directive (EU) 2020/2184 of the European Parliament and of the Council of 16 December 2020 on the Quality of Water Intended for Human Consumption; European Union: Brussels, Belgium, 2020.
- Ignatov, I.; Valcheva, N. Physicochemical, Isotopic, spectral, and microbiological analyses of water from glacier Mappa, Chilean Andes. J. Chil. Chem. Soc. 2023, 68, 5802–5906. [Google Scholar] [CrossRef]
- Mosin, O.V.; Shvets, V.I.; Skladnev, D.A.; Ignatov, I. Microbiological synthesis of [2H]-inosine with high degree of isotopic enrichment by gram-positive chemoheterotrophic bacterium Bacillus Subtilis. Appl. Biochem. Microbiol. 2013, 49, 255–266. [Google Scholar] [CrossRef]
- Ignatov, I.; Mosin, O.V. Deuterium, Heavy Water and Origin of Life; LAP LAMBERT Academic Publishing: Saarbrücken, Germany, 2016; pp. 1–492. [Google Scholar]
- Gonzalez, J.D.; Florez, E.; Romero, J.; Reyes, A.; Restrepo, A. Microsolvation of Mg2+, Ca2+: Strong influence of formal charges in hydrogen bond networks. J. Mol. Model. 2013, 19, 1763–1777. [Google Scholar] [CrossRef] [PubMed]
- Handle, P.H.; Loerting, T.; Sciortino, F. Supercooled and glassy water: Metastable liquid(s), amorphous solid(s), and a no-man’s land. Proc. Natl. Acad. Sci. USA. 2017, 114, 1336–1344. [Google Scholar] [CrossRef]
- Seetapan, N.; Limparyoon, N.; Fuongfuchat, A.; Gamonpilas, C.; Methacanon, P. Effect of freezing rate and starch granular morphology on ice formation and non-freezable water content of flour and Starch Gels. Int. J. Food Prop. 2016, 19, 1616–1630. [Google Scholar] [CrossRef]
- Schwenk, S.F.; Rode, B.M. Ab initio QM/MM MD simulations of the hydrated Ca2+ ion. Pure Appl. Chem. 2004, 76, 31–47. [Google Scholar] [CrossRef]
- Zeng, Y.; Jia, Y.; Yan, T.; Zhang, W. Binary structure and dynamics of the hydrogen bonds in the hydration shells of ions. Phys. Chem. Chem. Phys. 2021, 23, 11400–11410. [Google Scholar] [CrossRef]
- Voropaev, S.A.; Fedulov, V.S.; Dushenko, N.V.; Jianguo, Y.; Marov, M.Y. Features of IR Spectra of olivines containing isotopologues of water. Cosm. Res. 2024, 62, 482–494. [Google Scholar] [CrossRef]
- Fukazawa, H.; Mae, S. The vibration spectra of ice Ih and polar ice. Phys. Ice Core Rec. 2000, 25, 25–42. [Google Scholar]
- Ewing, G.E.; Foster, M.; Cantrell, W.; Sadtchenko, V. Thin film water on insulator surfaces. In Water in Confining Geometries; Buch, V., Devlin, J.P., Eds.; Springer Series in Cluster Physics; Springer: Berlin/Heidelberg, Germany, 2003; pp. 179–211. [Google Scholar]
- Korepanov, V.; Yu, C.C.; Hamaguchi, H.O. Hyper-Raman investigation of intermolecular vibrations of water and ice. J. Raman Spectrosc. 2018, 49, 1742–1746. [Google Scholar] [CrossRef]
- Heilig, A.; Wendleder, A.; Schmitt, A.; Mayer, C. Discriminating wet snow and firn for alpine glaciers using sentinel-1 Data: A case study at rofental, Austria. Geosciences 2019, 9, 69. [Google Scholar] [CrossRef]
- Florath, J.; Keller, S.; Abarca-del-Rio, R.; Hinz, S.; Staub, G.; Weinmann, M. Glacier monitoring based on multi-spectral and multi-temporal satellite data: A case study for classification with respect to different snow and ice types. Remote Sens. 2022, 14, 845. [Google Scholar] [CrossRef]
- Shang, X.; Cheng, X.; Zheng, L.; Liang, Q.; Chi, Z. Decadal changes in Greenland ice sheet firn aquifers from Radar scatterometer. Remote Sens. 2022, 14, 2134. [Google Scholar] [CrossRef]
- Yang, P.; Zhu, Y.; Hao, Y. Real-time detection of the transport of water cluster across cytomembrane with piezoelectric sensor. Chin. J. Anal. Chem. 2023, 51, 100307. [Google Scholar] [CrossRef]
- Segarra-Martí, J.; Roca-Sanjuán, D.; Merchán, M. Can the Hexagonal Ice-like Model Render the Spectroscopic Fingerprints of Structured Water? Feedback from Quantum-Chemical Computations. Entropy 2014, 16, 4101–4120. [Google Scholar] [CrossRef]
- Deshmukh, K.; Sankaran, S.; Ahamed, B.; Sadasivuni, K.K.; Pasha, K.S.K.; Ponnamma, D.; Sreekanth, P.S.R.; Chidambaram, K. Dielectric Spectroscopy. In Spectroscopic Methods for Nanomaterials Characterization; Thomas, S., Thomas, R., Zachariah, A.K., Mishra, R.K., Eds.; A Volume in Micro and Nano Technologies; Elsevier: Amsterdam, The Netherlands, 2017; Volume 2. [Google Scholar]
- Bergstrom, A.; Welch, K.A.; Gooseff, M.N. Spatial patterns of major ions and their relationship to sediment concentration in near-surface glacier ice, Taylor Valley Antarctica. JGR Earth Surface 2023, 128, e2022JF006980. [Google Scholar] [CrossRef]
- Killawee, J.A.; Fairchild, I.J.; Tison, J.L.; Janssens, L.; Lorrain, R. Segregation of solutes and gases in experimental freezing of dilute solutions: Implications for natural glacial systems. Geochim. Cosmochim. Acta 1998, 62, 3637–3655. [Google Scholar] [CrossRef]
- Stoll, N.; Westhoff, J.; Bohleber, P.; Svensson, A.; Dahl-Jensen, D.; Barbante, C.; Weikusat, I. Chemical and visual characterization of EGRIP glacial ice and cloudy bands within. Cryosphere 2023, 17, 2021–2043. [Google Scholar] [CrossRef]
- Ng, F.S.L. Pervasive diffusion of climate signals recorded in ice-vein ionic impurities. Cryosphere 2021, 5, 1787–1810. [Google Scholar] [CrossRef]
- Bohleber, P.; Roman, R.; Šala, M.; Delmonte, B. Two-dimensional impurity imaging in deep Antarctic ice cores: Snapshots of three climatic periods and implications for high-resolution signal interpretation. Cryosphere 2021, 15, 3523–3538. [Google Scholar] [CrossRef]
- Ricci, B.C.; Skibinski, B.; Koch, K.; Mancel, C.; Celestino, C.Q.; Cunha, I.L.C.; Silva, M.R.; Alvim, C.B.; Faria, C.V.; Andrade, L.H.; et al. Critical performance assessment of a submerged hybrid forward osmosis-membrane distillation system. Desalination 2019, 468, 114082. [Google Scholar] [CrossRef]
- Ignatov, I.; Gluhchev, G.; Ignatov, A.I. Desalination of seawater. Osmotic process for “blue energy” and estimation for desalination. Ukr. J. Phys. 2024, 69, 905–912. [Google Scholar] [CrossRef]
- Lehmann, M.; Siegenthaler, U. Equilibrium oxygen- and hydrogen- isotope fractionation between ice and water. J. Glaciol. 1991, 37, 23–26. [Google Scholar] [CrossRef]
- Müller, T.; Fischer, M.; Lane, S.N.; Schaefli, B. Separating snow and ice melt using water stable isotopes and glacio-hydrological modelling: Towards improving the application of isotope analyses in highly glacierized catchments. Cryosphere 2025, 19, 423–458. [Google Scholar] [CrossRef]
- Rozanski, K.; Araguas-Araguas, L.; Gonfiantini, R. Isotopic patterns in modern global precipitation. In Climate Change in Continental Isotopic Records; Swart, P.K., Lohmann, K.C., McKenzie, J., Savin, S., Eds.; Geophysical Monograph; American Geophysical Union: Washington, DC, USA, 1993; Volume 78, pp. 1–36. [Google Scholar]
- Masson-Delmotte, V.; Stenni, B.; Pol, K.; Braconnot, P.; Cattani, O.; Falourd, S.; Kageyama, M.; Jouzel, J.; Landais, A.; Minster, B.; et al. EPICA Dome C record of glacial and interglacial intensities. Quat. Sci. Rev. 2010, 29, 113–128. [Google Scholar] [CrossRef]
- Galili, N.; Sade, Z.; Halevy, I. Equilibrium fractional of triple-oxygen and hydrogen isotopes between ice and water. Earth Planet. Sci. Lett. 2022, 595, 117753. [Google Scholar] [CrossRef]
Disclaimer/Publisher’s Note: The statements, opinions and data contained in all publications are solely those of the individual author(s) and contributor(s) and not of MDPI and/or the editor(s). MDPI and/or the editor(s) disclaim responsibility for any injury to people or property resulting from any ideas, methods, instructions or products referred to in the content. |
© 2025 by the authors. Licensee MDPI, Basel, Switzerland. This article is an open access article distributed under the terms and conditions of the Creative Commons Attribution (CC BY) license (https://creativecommons.org/licenses/by/4.0/).