Article

Influence of Manganese Addition on Structural, Dielectric, and Wastewater Bioconversion in LiTaO3 Ferroelectric Material

by
Mohamed El Habib Hitar
1,
Latifa Tajounte
1,
Manal Benyoussef
2,
Abdellah Benzaouak
1,
Noureddine Touach
1,
Mohammed Hadouchi
3,
Abdelilah Lahmar
2,*,
Mohammed El Mahi
1 and
El Mostapha Lotfi
1
1
Laboratory of Spectroscopy, Molecular Modeling, Materials, Nanomaterials, Water and Environment, Environmental Materials, ENSAM, Mohammed V University in Rabat, Avenue Ibn Battouta, Rabat 1014, BP, Morocco
2
Laboratory of Physics of Condensed Matter (LPMC), University of Picardie Jules Verne, Scientific, Pole, 33 Rue Saint-Leu, 80039 Amiens Cedex 1, France
3
Laboratoire de Chimie Appliquée des Matériaux, Centre des Sciences des Matériaux, Faculty of Science, Mohammed V University in Rabat, Avenue Ibn Battouta, Rabat 1014, BP, Morocco
*
Author to whom correspondence should be addressed.
Crystals 2025, 15(3), 253; https://doi.org/10.3390/cryst15030253
Submission received: 17 February 2025 / Revised: 2 March 2025 / Accepted: 5 March 2025 / Published: 8 March 2025
(This article belongs to the Special Issue Crystal Structure and Dielectric Properties of Ceramics)

Abstract

:
The present study investigates the effect of manganese incorporation on the structural, dielectric, and waste bioconversion of LiTaO3 ferroelectric material. Conventional solid-state synthesis techniques were utilized to produce powder samples, which were subsequently analyzed using room-temperature X-ray diffraction (XRD) for phase identification. The analysis revealed that the material forms a continuous solid solution within the composition range of 0 to 25 mol% of manganese (Mn), exhibiting R3c-Rombohedral symmetry. Thermal investigations of Raman spectra permitted approaching the ferroelectric–paraelectric phase transition, and dielectric measurements were performed in all investigated samples. The results show that the temperature of ferroelectric-paraelectric phase transition (Tc) decreased with the increasing Mn content. Optical properties of the prepared materials were also measured and tested as photocathodes for microbial fuel cells (MFCs), showing promising performance for x = 0.10, which exceeds values found with other dopants.

1. Introduction

Perovskite-structured oxides, particularly those with ferroelectric properties, have attracted significant interest due to their versatile applications in modern technology [1,2,3,4]. Nowadays, these materials are used in various fields like dielectric capacitors, infrared detectors, actuators, sensors, etc. [5,6]. Other new potential applications in the field of energy have been introduced in recent years, such as energy storage and energy harvesting [7,8].
Many ferroelectric perovskite materials are proposed as the appropriate materials for developing environmentally friendly materials to meet modern technology needs, such as BaTiO3 or SrTiO3 [9,10]. Furthermore, Bi0.5Na0.5TiO3 (NBT)- and Bi0.5K0.5TiO3 (KBT)-based materials have been pointed out as interesting materials for developing electrostatic energy storage capacitors working at high temperatures [11,12]. Their high dielectric permittivity and ferroelectric properties allow them to be promising candidates as capacitors for applications in electronics, aerospace, and power systems, where high temperature stability is required [13,14]. In addition, BCZT (Ba(1−x)CaxZryTi(1−y)O3) systems and BiFeO3-based materials are seen as the appropriate alternatives to replace traditional lead-based compounds, such as PbZr1−xTixO3 (PZT) [15] or PMN-PT(PMN-PbMg1/3Nb2/3O3) [16], to meet environmental requirements. Some ferroelectric perovskites, such as LiNbO3 (lithium niobate) and LiTaO3 (lithium tantalate), are also widely used in the optical field due to their excellent electro-optical properties. These materials were found interesting for the development of optical devices, including modulators, waveguides, and optical switches. Their unique electro-optical characteristics allow them to modulate light with high efficiency, a crucial feature for devices in telecommunications, signal processing, and photonic circuits [17,18,19,20].
It should be mentioned, however, that global warming is worsening water shortages in many regions already plagued by water supply problems; it leads to increased risks of agricultural drought harmful to crops and ecological drought, making ecosystems more vulnerable. This situation encourages the exploitation of unconventional water resources such as the reuse of treated wastewater. Among the alternatives that have been in high demand in recent years are microbial fuel cells (MFCs), in which microorganisms naturally present in natural environments are used as catalysts at the electrodes [21,22]. This promising bioelectrochemical technology is capable of converting the chemical energy of effluents into bioelectricity via microorganisms. Indeed, the organic matter contained in agricultural residues or wastewater can be used as a combustible substrate by these so-called electro-active (EA) micro-organisms. This technology would thus make it possible to couple the production of energy with the treatment and recovery of waste or effluents; it therefore constitutes a source of clean energy, which respects the environment and preserves the health of living beings.
In this context, particular interest has been reserved for perovskites as alternatives to standard catalysts [23]. One of the key strategies was the modulation of the bandgap by appropriate doping. Several studies have shown significant tuning of the bandgap in doped perovskite oxide depending on the doping element and the synthesis process [24]. It is worth mentioning that doping is generally accompanied by the generation of defects likely to behave as recombination centers that leading to a more difficult transfer of charge carriers towards the interface or the surface, which prevents the effectiveness of the catalyst [25]. Therefore, a key solution to this situation is ferroelectric materials as potential candidates because of the presence of a stable intrinsic remnant polarization below the Curie temperature, i.e., the presence of an internal electric field able to prevent the charge carrier recombination.
In addition, if the material is lacunar, there will be the presence of high mobility of oxygen ions, favoring the oxygen reduction reaction (ORR) at the cathode, thus improving the performance of MFCs [26]. In recent years, several research works have increased the interest in cathodes based on lacunar perovskite, such as LiNbO3 and LiTaO3. Numerous studies have emphasized that the nature of the dopant and its quantity play a crucial role in the performance of the cathode in microbial fuel cells (MFCs) [27,28]. The insertion of additional ions has been shown to reduce the band gap and enhance the material’s capacity to absorb better spectral ranges of light, as evidenced by the case of tungsten [27]. In the structure of Li1−xTa1−xWxO3, with 3.85 eV (x = 0.10), there is a discernible shift towards absorption in the visible region. A similar outcome was observed when manganese was inserted into Li1−xMnx/2TaO3 [29], reducing the band gap to 3.48 eV (x = 0.10). Li0.95Ta0.76Nb0.19Mg0.15O3 (LTNMg) exhibits a band gap of 4.03 eV [16]. It is therefore evident that such modifications are critical in enhancing photocatalytic and electrocatalytic efficiencies, specifically in microbial fuel cells, in which reduced band gaps allow for increased absorption and increased charge separation.
In this work, manganese (Mn) was selected as a promising dopant for LiTaO3-based cathodes in MFCs, aiming to achieve optimal performance. The influence of manganese on the structural and dielectric properties of the parent LiTaO3 matrix is highlighted for understanding its impact on MFC efficiency. The waster bioconversion of the studied material is compared to the results obtained with other dopants.

2. Materials and Methods

The mixed oxides were prepared by the solid-state diffusion–reaction technique, using Ta2O5 from Sigma-Aldrich, 99%; Li2CO3 provided by Solvachim, 99%; and MnCO3 from Sigma-Aldrich, 99.9%, as starting materials. Precursors were mixed, milled, and calcined at different calcination temperatures to obtain pure phases. The first calcination was performed at 600 °C for 12 h to allow the release of CO2, followed by heating at 800 °C for 36 h, 1000 °C for 12 h and finally at 1150 °C for 4 h, all in air and at atmospheric pressure, followed by slow cooling. Weight variations were recorded before and after each treatment to investigate the complete removal of CO2 and the compositional stability of the materials.
Powder X-ray diffraction analysis of the synthesized materials was conducted at room temperature utilizing a Siemens D5000 diffractometer (Seimens AG, Karlsruhe, Germany), with Cu-Kα radiation source (λ = 1.5406 Å) in a 2θ range of 10° ≤ 2θ ≤ 70° with a 0.04° step at room temperature.
FullProf software (version 7.95) refined the extracted XRD data using the Le Bail method, which is a whole diffraction pattern profile-fitting method that is used to index the XRD data and refine the unit cell parameters to describe the structure and other characteristics of crystalline materials. It was developed by Armel Le Bail [30]. The morphology and elemental analysis were analyzed using the Quattro S-Feg-Thermofisher Scientific scanning electron microscope (SEM), the detection limit is between 0.1 and 2%. The vibrational properties were examined using a micro-Raman spectrometer (Renishaw) with a 532 nm green laser for excitation. The dielectric measurements, the pellet sintering was realized at 1150 °C for 4 h, with a heating rate of 5 °C, followed by a slow cooling. The ceramic surfaces are coated by silver paste serving as electrodes. Dielectric characterization was performed as a function of the temperature and frequency using an LCR meter HIOKI 3532-50 HiTESTER (42 Hz–5 MHz).

3. Results and Discussion

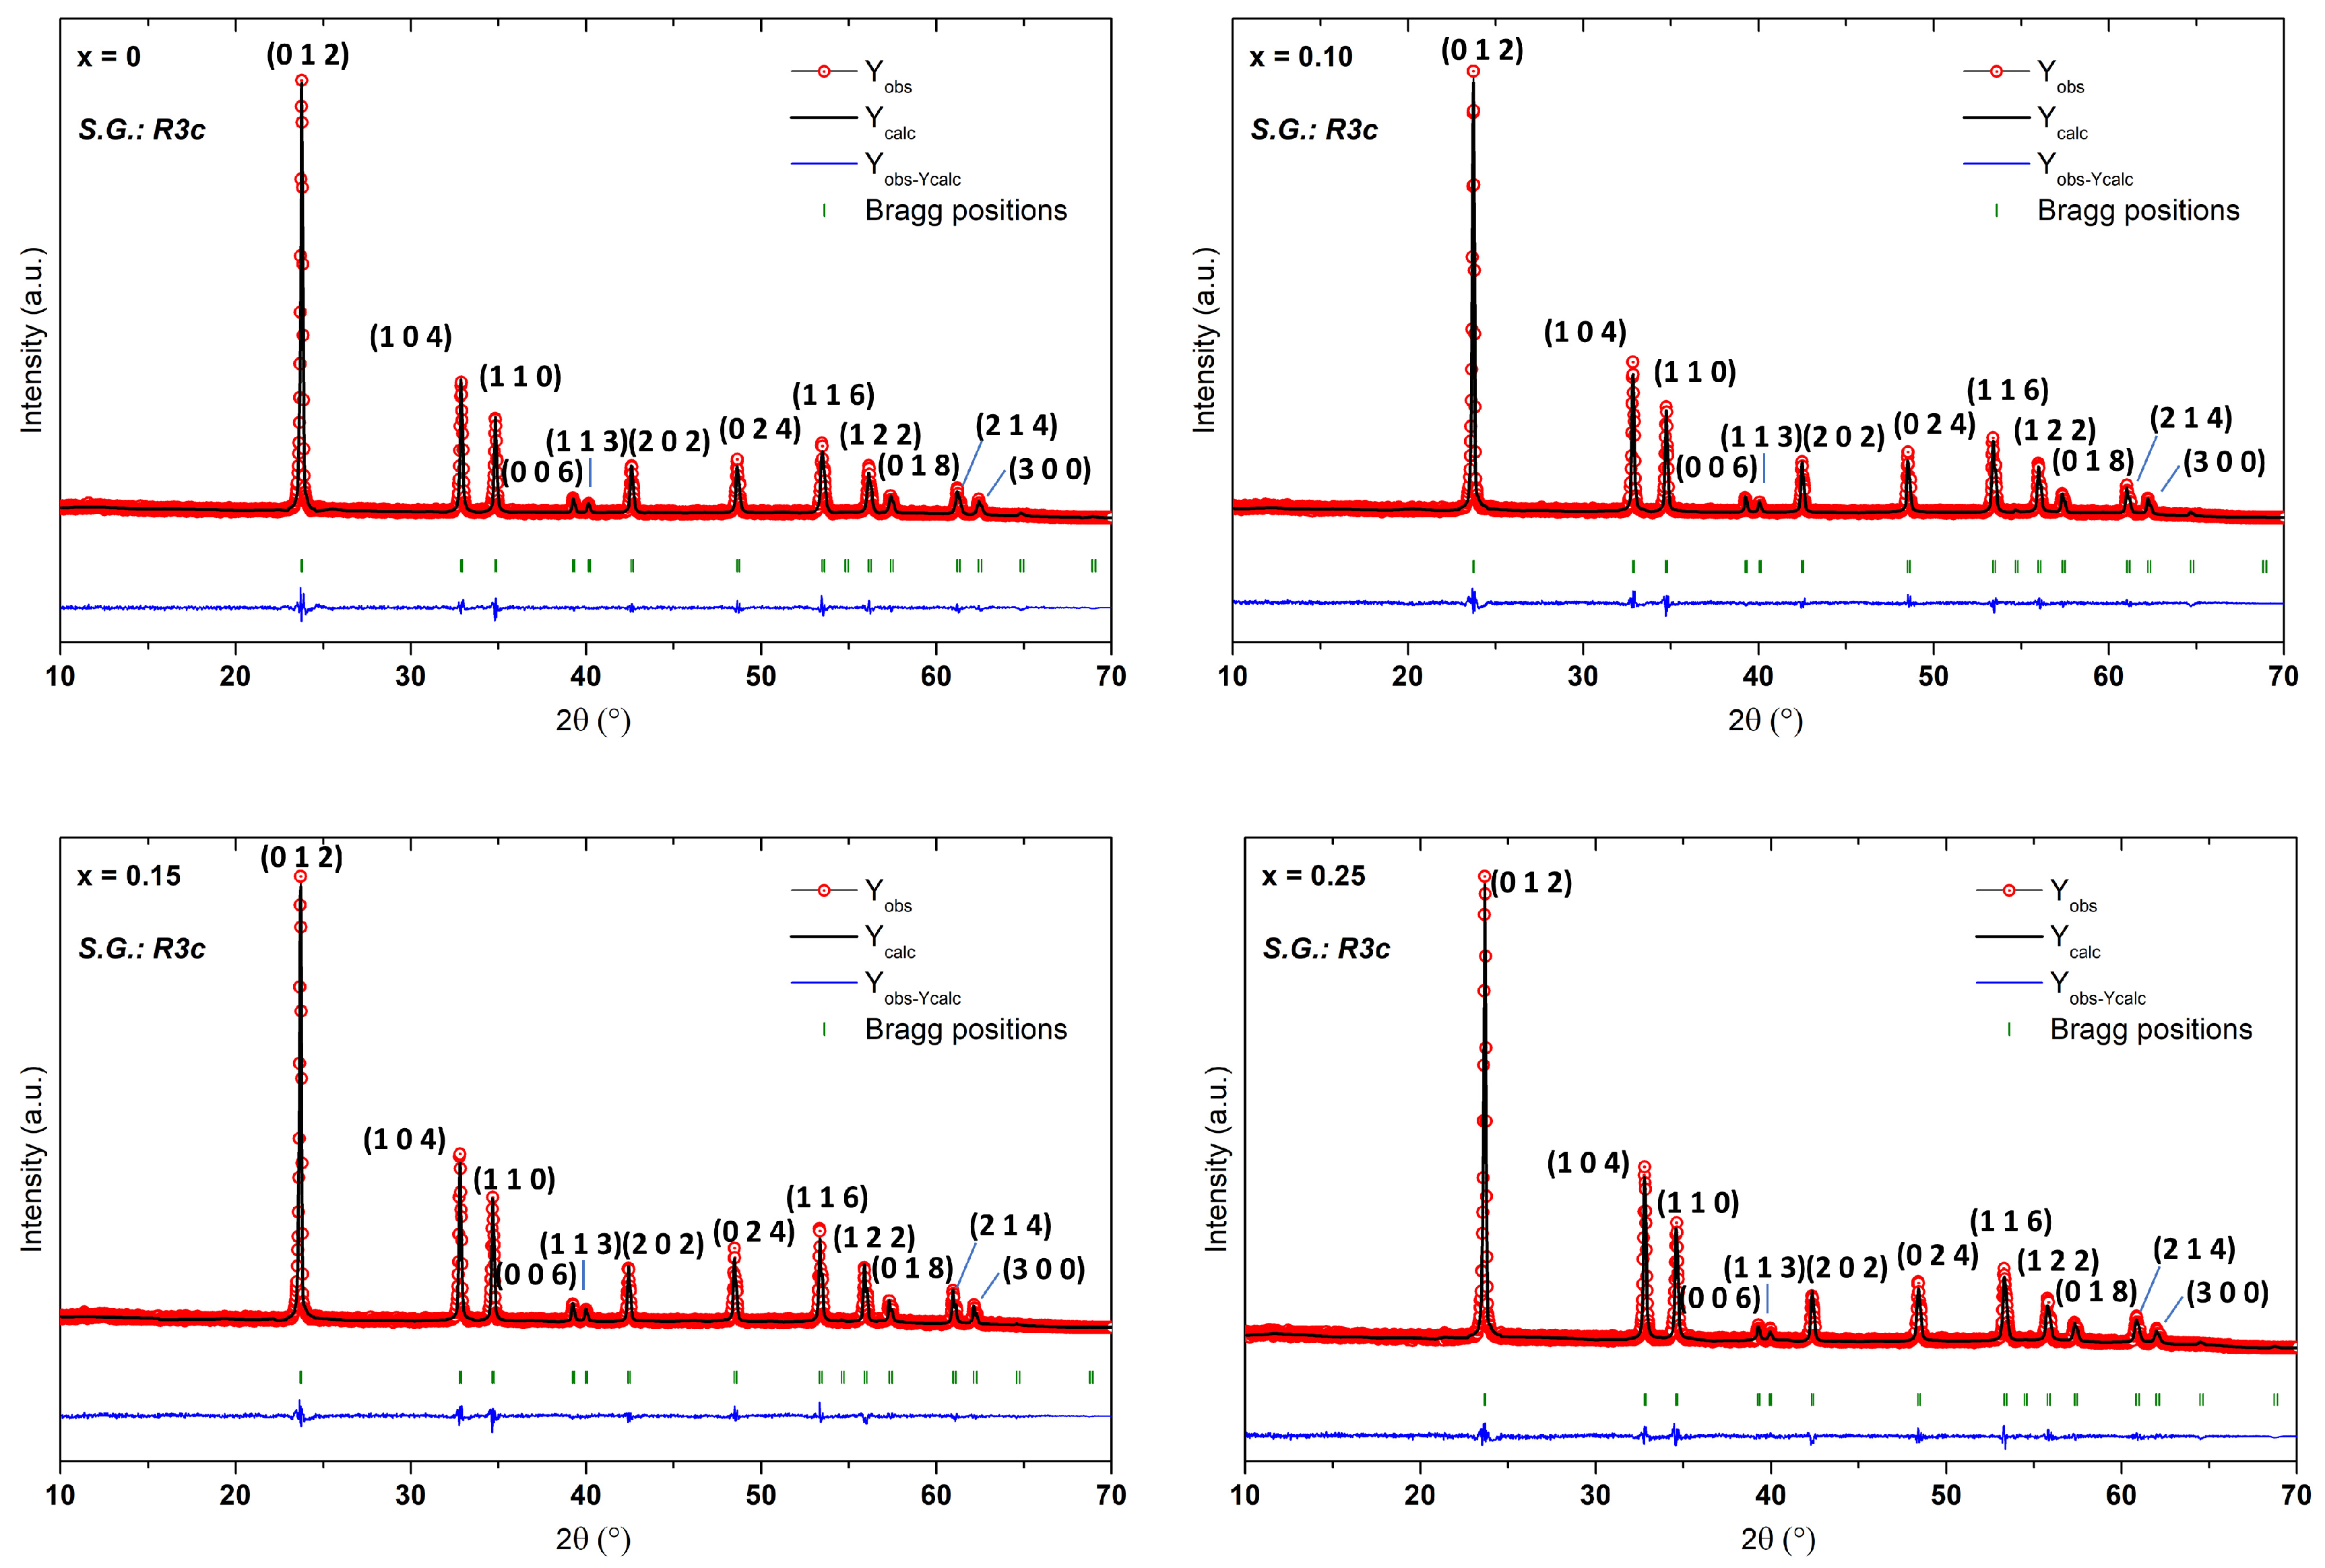
3.1. X-Ray Diffraction Analysis

Le Bail refining was carried out to investigate the structures of the produced compositions. The initial LiTaO3 crystallographic parameters from the synchrotron X-ray study were utilized [31]. As shown in Figure 1, the phases were refined in the rhombohedral system using the R3c space group, which supports the octahedral tilt system and allows for ferroelectricity. The peak form of all XRD patterns was defined using the pseudo-Voigt function. The calculated and observed patterns fit well, showing single-phase formation (Figure 1). The refined crystallographic data are given in Table 1. Figure 2 illustrates how the partial replacement of Mn for Li has caused a progressive increase in a parameter along with a volume-increasing trend. This can be explained by the fact that Mn2+ has larger ionic radii than Li+. In fact, the Mn radius (r(Mn2+) = 0.80 Å) is higher compared to Li+ and Ta5+(r(Li+) = 0.68 Å; r(Ta5+) = 0.68 Å) [32]. Additionally, the calculated a/c ratio showed that the unit cell compactness increases as the Mn concentration rises. The obtained results are in good agreement with the literature [33,34]. Note that this ratio is crucial to obtain key information on the degree of distortion of the material. In our case, the ratio did not exceed unity, the phases obtained therefore remain in the ferroelectric phase. However, the observed change in the value of this ratio with the incorporation of Mn highlights an influence of the alignment of the dielectric dipole that can cause some polarization modulation.

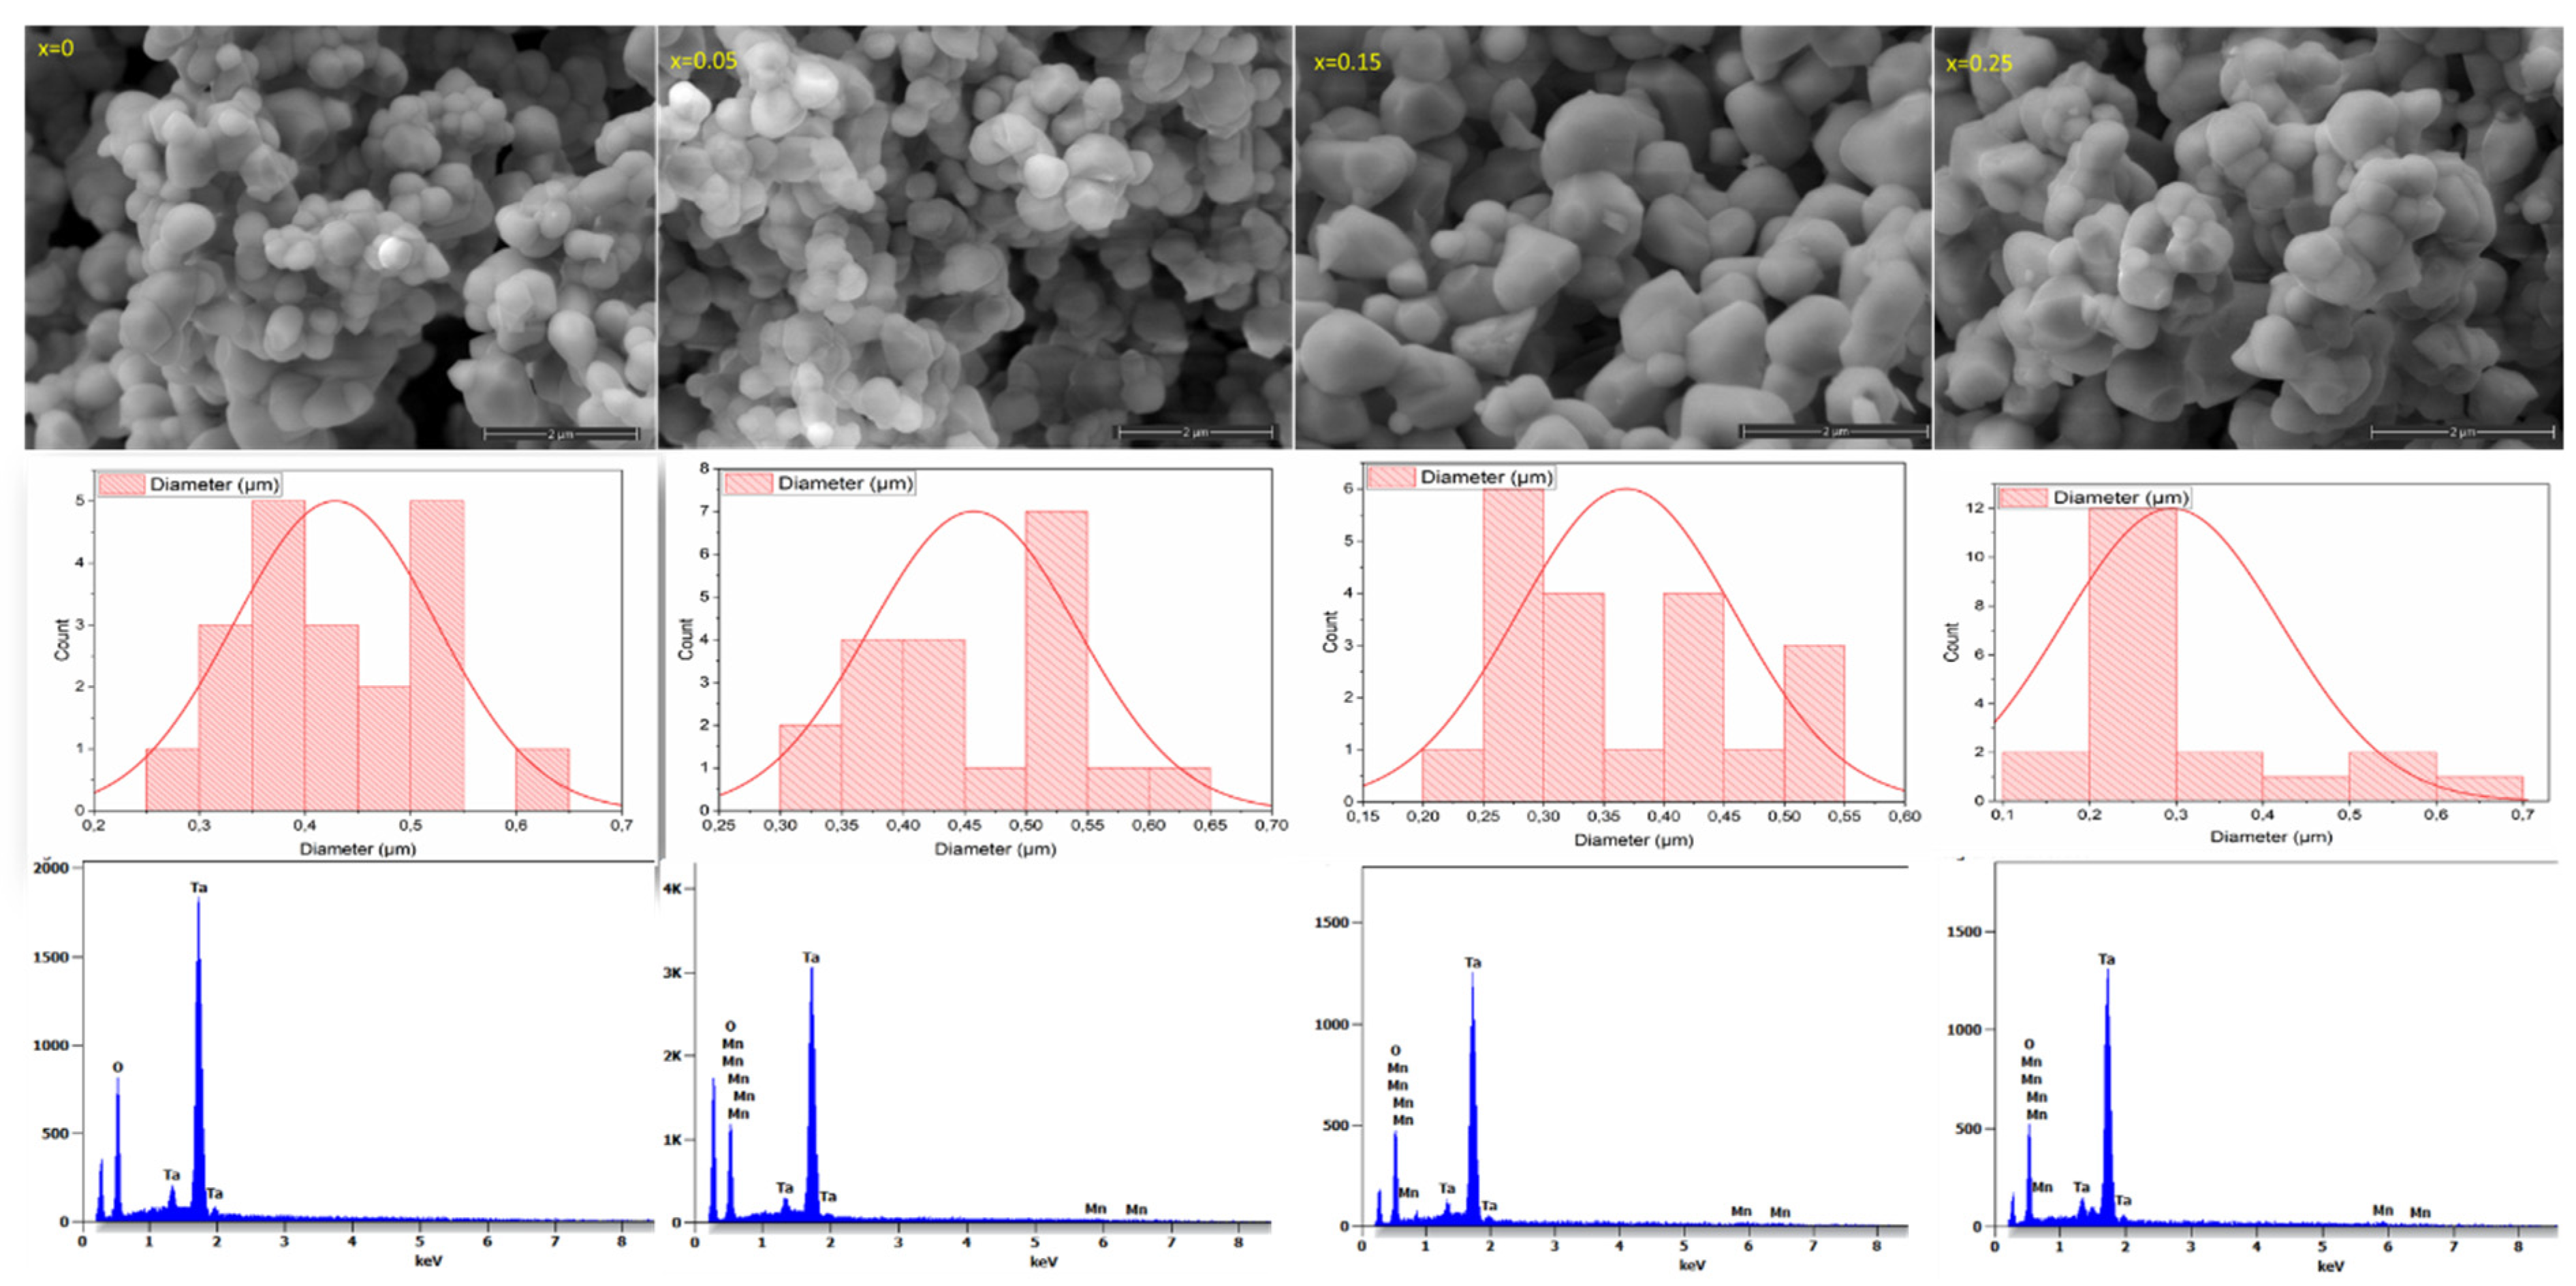
3.2. Scanning Electron Microscopy

SEM shows the microstructure and the grain size distributions of the studied ceramics Li1−xMnx/2TaO3. Round-shaped grains with different sizes are observed for all compositions, as illustrated in (Figure 3). The grain shape loses its uniformity relative to the increase in the Mn amount in the lattice. The rounded grains of the ceramics are gradually becoming larger, especially from the composition x = 0.10. Additionally, with the estimation of the Image J software (Version 1.54p), all compounds show various grain sizes, which are between 0.25 and 0.65 μm. The composition x = 0.10 shows the highest diverse grain size distribution compared to other compositions. The mapping images of the composition x = 0.10 display the uniform spatial distribution of different matrix elements (O, Mn, Ta), which confirm the existence of a single homogeneous phase. The energy dispersive X-ray (EDX) reveals the presence of all the expected elements except Li, due to its low electronic density.

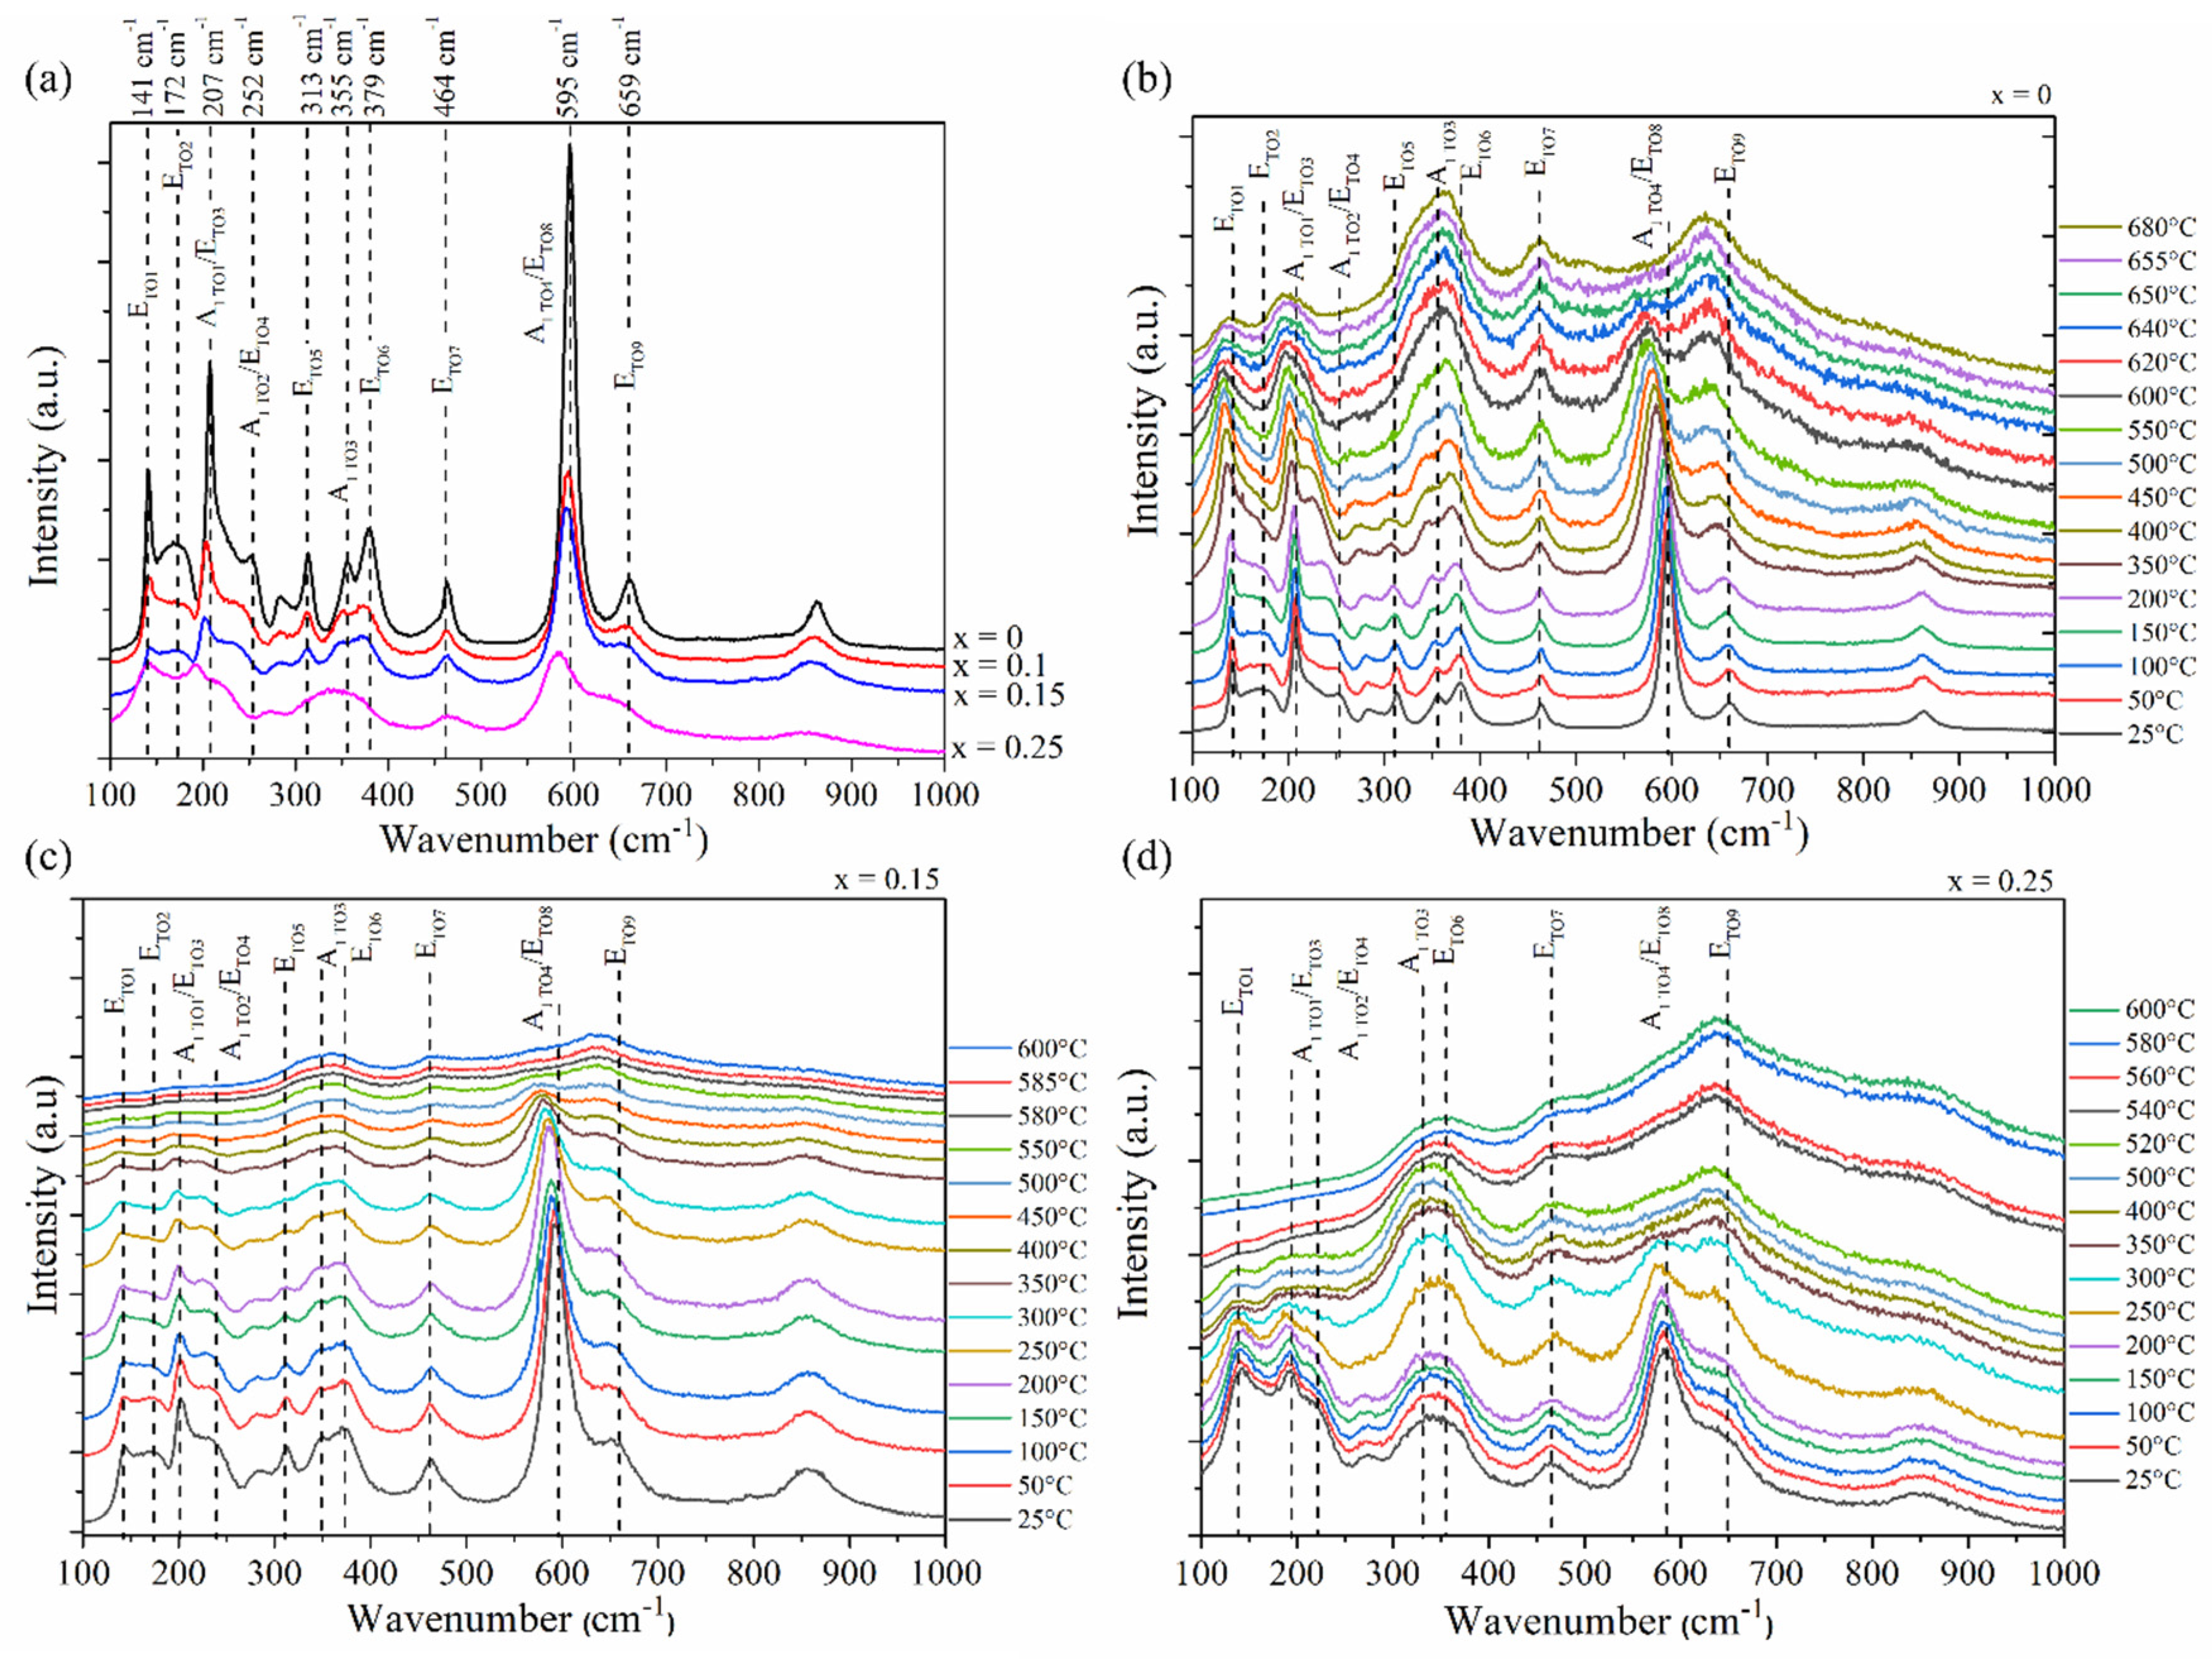
3.3. Raman Investigation of Li1−xMnx/2TaO3 (x = 0–0.25)

Lithium tantalate (LiTaO3) in its ferroelectric phase belongs to the C63V space group, and according to the theoretical group analysis, the vibrational symmetry of the optical modes at the Gamma point are 4A1 + 9E + 5A2. Here, the A1 and E modes are polar phonons that are active in both Raman and infrared spectroscopy, while the A2 modes are nonpolar phonons and remain inactive. Note that the A1 and E modes undergo LO/TO splitting (LO: longitudinal optical, TO: transverse optical). Therefore, the symmetry and the number of polar phonons should be 4A1TO + 4A1LO + 9ETO + 9ELO, as earlier reported in [23]. However, as shown by Repelin et al. [24], in polycrystalline materials, only transverse optical modes’ ETO can be observed. Consequently, Raman spectra are recorded using non-polarized light in the range of 100–1000 cm−1.
Lithium tantalate (LiTaO3) in its ferroelectric phase belongs to the C63V space group, and according to the theoretical group analysis, the vibrational symmetry of the optical modes at the Gamma point are 4A1 + 9E + 5A2. Here, the A1 and E modes are polar phonons that are active in both Raman and infrared spectroscopy, while the A2 modes are nonpolar phonons and remain inactive. Note that the A1 and E modes undergo LO/TO splitting (LO: longitudinal optical, TO: transverse optical). Therefore, the symmetry and the number of polar phonons should be 4A1TO + 4A1LO+ 9ETO+ 9ELO, as earlier reported in [35]. However, as shown by Repelin et al. [36], in polycrystalline materials, only transverse optical modes ETO can be observed. Consequently, Raman spectra are recorded using non-polarized light in the range of 100–1000 cm−1.
The Raman spectra of polycrystalline Li1−xMnx/2TaO3 (x = 0–0.25) are given in Figure 4a. Note that the low frequencies, below 300 cm−1, are mainly assigned to the deformation of the Ta–O framework. The 300–400 cm−1 frequency range is influenced by Li cation displacements. The highest frequency region (550–670 cm−1) mainly involves the Ta–O stretching modes, essentially related to oxygen atom shifts [36].
It should be noted that as the x content increases, a red shift in the ETO2, A1TO1/ETO3, A1TO2/ETO4, A1TO3, ETO6, and A1TO4/ETO8 Raman modes is observed. In addition, a decrease in the Raman intensity along with a broadening of all modes can be reported from the figure. In particular, the substitution of Li by Mn resulted in a disturbance of Raman modes involving Li cation displacements. In fact, the modes in the 300–400 cm−1 range are observed to merge gradually, as x increases. Notably, the ETO2 and ETO5 are observed to vanish for the x = 0.25 composition.
At high temperature (~620 °C), LiTaO3 is known to undergo a phase transition towards a paraelectric phase belonging to the D3d symmetry [37], where only five (1A1g + 4Eg) Raman active phonons are predicted by the group theory. These phonons are nonpolar and, therefore, present no TO-LO splitting. Therefore, we determined the temperature dependency of the Raman spectra for Li1−xMnx/2TaO3 compositions with x = 0, 0.15, and 0.25 to highlight their corresponding ferroelectric to paraelectric phase transitions.
The temperature dependent Raman spectra of pristine LiTaO3, from room temperature to 680 °C, is presented in Figure 4b. In this work, we can clearly observe only five Raman active modes, starting from 650 °C, related to the D3d symmetry, revealing the ferroelectric to paraelectric phase transition. In her work, C. Raptis suggested the existence of an intermediate phase (coexistence of both C3V and D3d symmetries) within 100 °C below the critical point. Note that the ETO5 Raman mode begins to vanish at 550 °C, possibly indicating the onset of the intermediate phase.
In the ferroelectric phase (<550 °C), one can observe a softening of most Raman modes as temperature increases, except for the ETO7 mode, which is observed to be temperature-independent. In addition, one can also observe a considerable broadening as the temperature increases, particularly for the ETO1, A1TO1/ETO3, A1TO4/ETO8, and ETO9 Raman modes. This behavior points out the increasing disorder in the structure as a function of temperature.
Figure 4c presents the temperature dependent Raman spectra of the Li1−xMnx/2TaO3 (x = 0.15) composition. It can be observed that starting from 580 °C, five Raman modes can be distinguished revealing the paraelectric phase of LiTaO3. Compared to the pristine material, the Li1−xMnx/2TaO3 (x = 0.15) composition presents a lower FE/PE phase transition, as confirmed by our XRD and dielectric investigations. For x = 0.25, the phase transition drastically decreased to 400 °C as can be seen in Figure 4d, revealed by the vanishing of the A1TO4/ETO8 Raman mode. Apart from that, similar behavior can be noticed for the temperature-dependent Raman spectra of the substituted compounds compared to the pristine LT, since both softening and broadening are observed as a function of temperature.

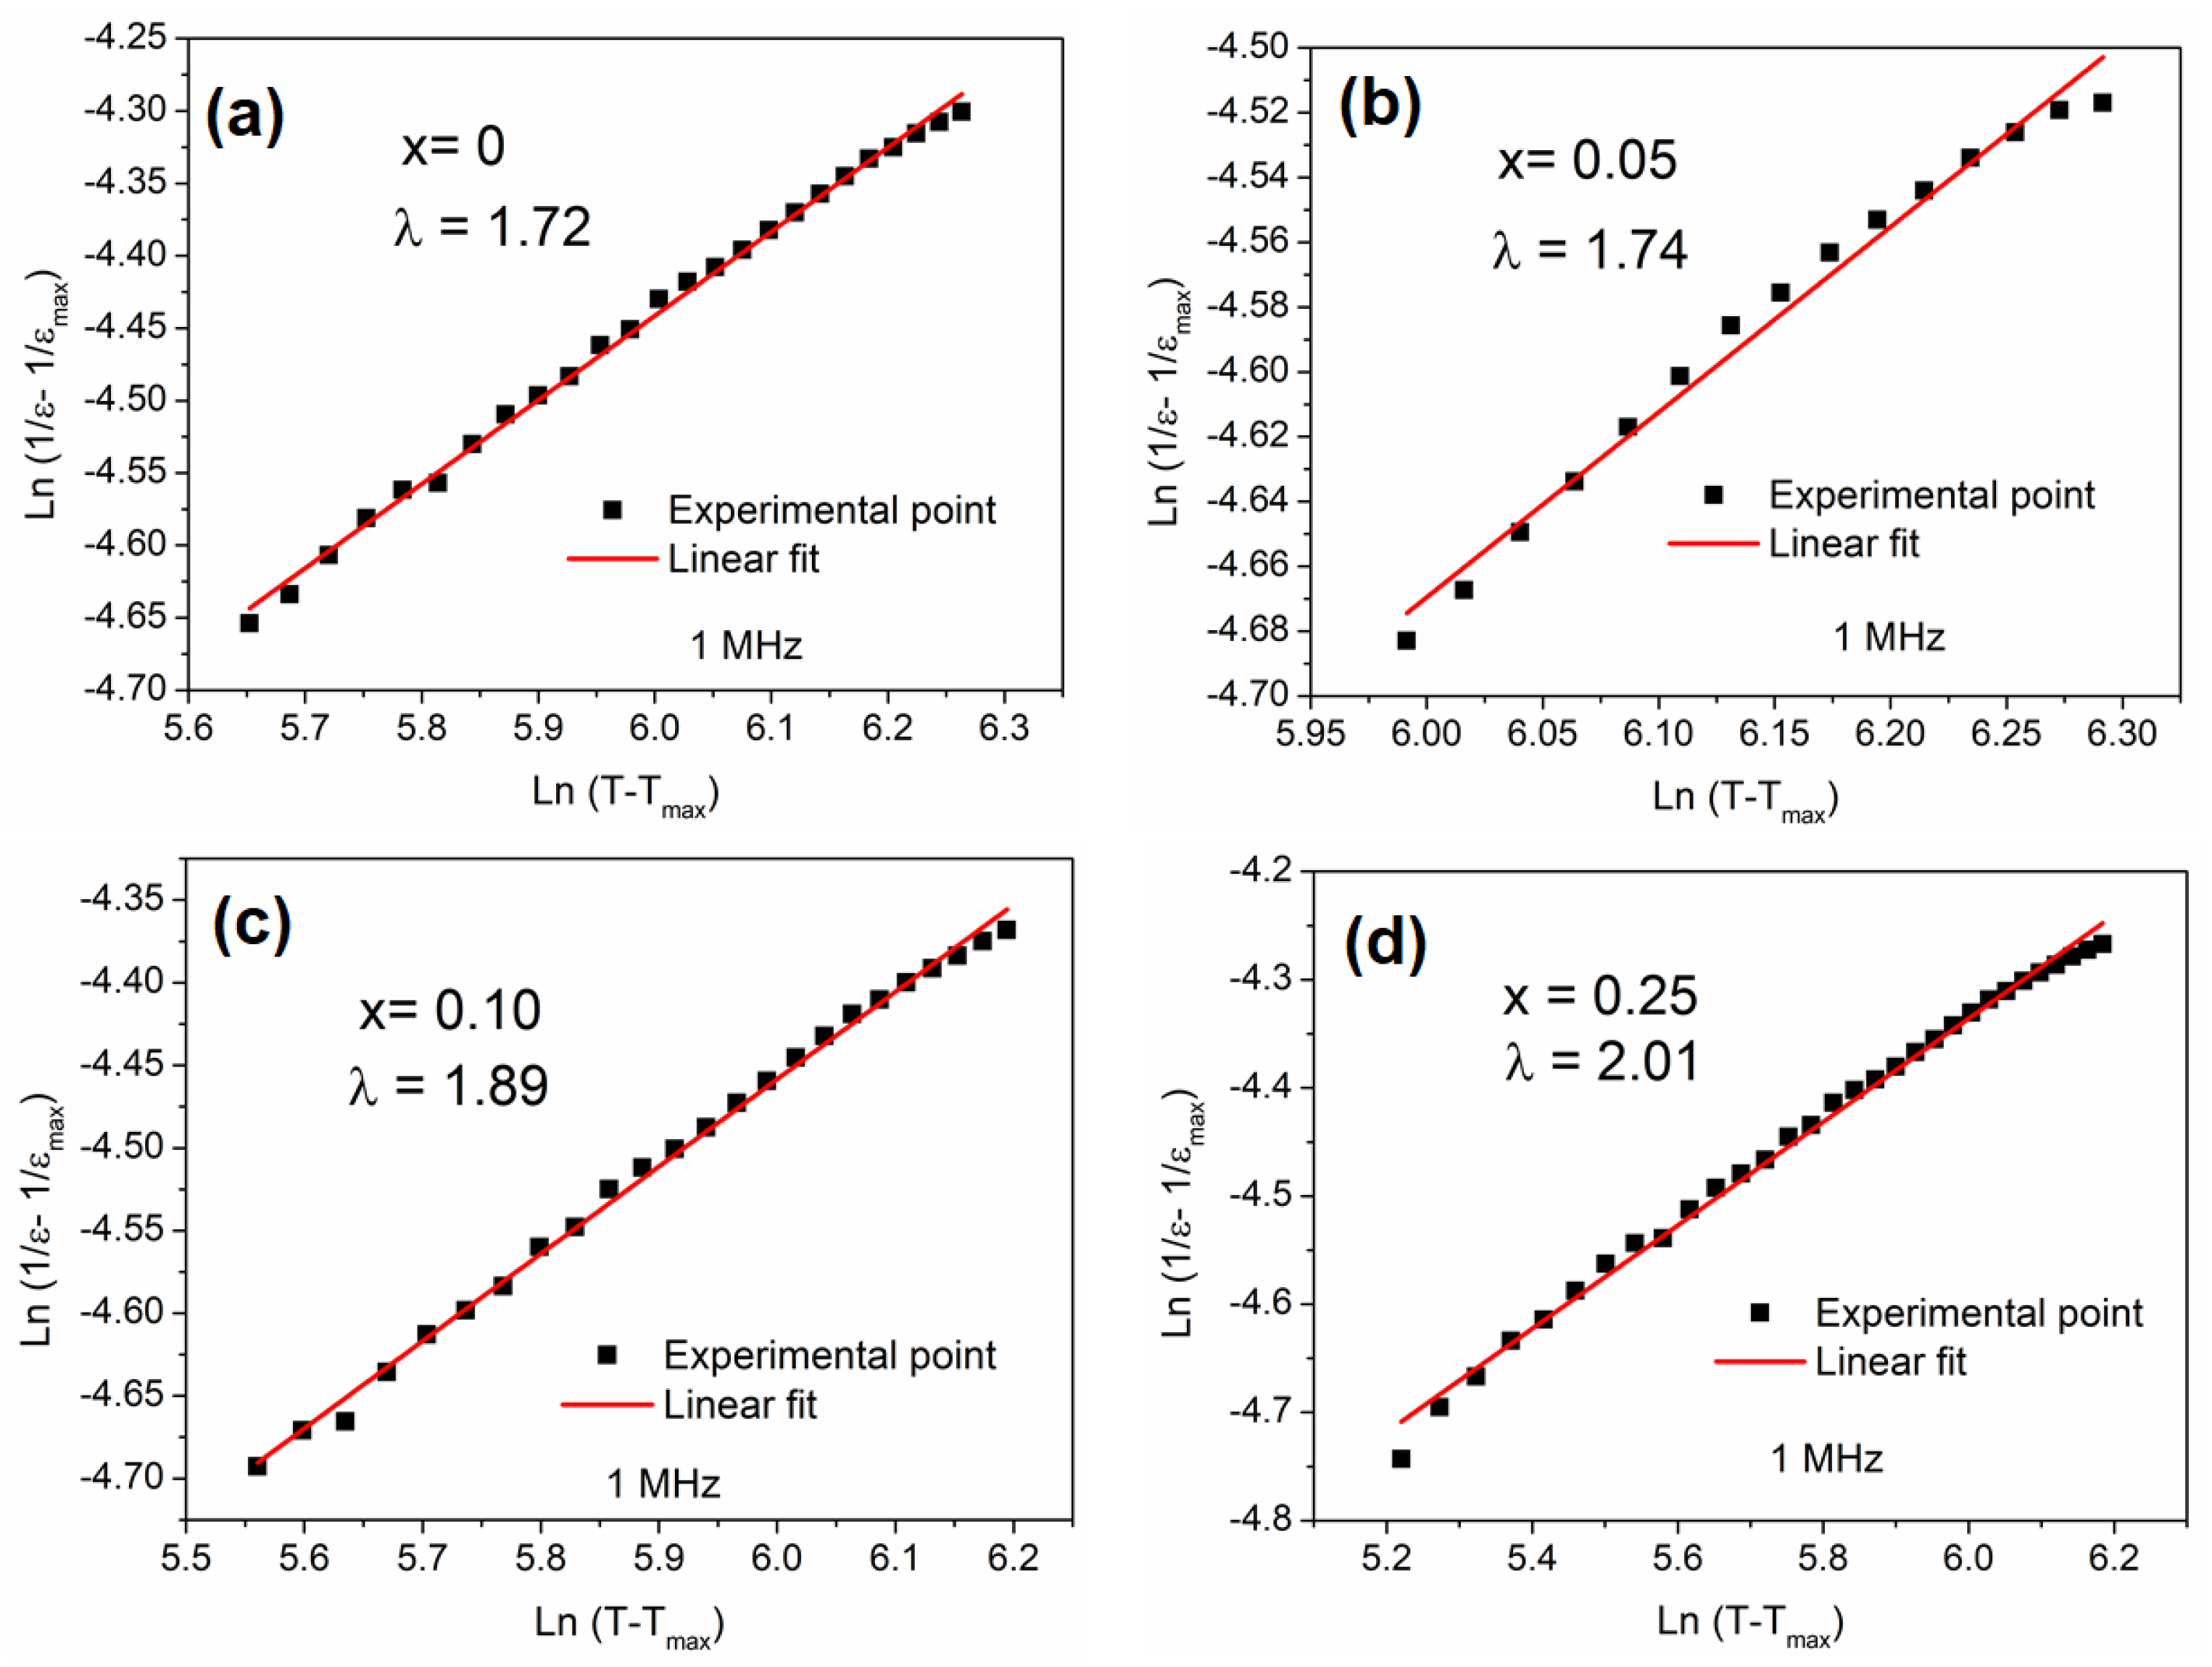
3.4. Dielectric Study

Figure 5a,b illustrates the dielectric constant and dielectric loss evolution as a function of the temperature of the studied samples at 1MHz. As can be seen from Figure 5a, the plots exhibit maxima in the temperature range of 580 to 565 °C, assigned to the ferroelectric–paraelectric phase transition (Tc). For the pristine phase, the dielectric constant is about 1668, which decreased when increasing the Mn amount until 850 for x = 0.15, with an abrupt increase to 1740 for x = 0.25 with a closely vanished peak. It is worth mentioning that the dielectric properties are influenced by the crystal structure, the presence of defects, and the doping element. In fact, the presence of oxygen or lithium vacancies can affect the material’s electronic structure and its ability to respond to an electric field. Local distortions in the crystal lattice can be caused by these vacancies, which decreases the material’s ability to polarize evenly when an electric field is applied. A more disordered lattice typically leads to a reduction in dielectric permittivity. Assani et al. [33] reported that beyond x = 0.15, along the solid solution Li1−xMnx/2TaO3, the created vacancies are not more compensated by Mn2+. This is probably the explanation for the dielectric constant increase for x = 0.25. Similar behavior was reported for the Co-doped LT compound [38]. In Figure 5b, the dielectric loss seems to be stable until 400 °C, then increases with a further increase in the temperature. It is probably that the present defects, particularly oxygen vacancies and/or lithium vacancies, contribute at high temperatures to enhanced dielectric losses, as the movement of defects can lead to additional energy dissipation. Note that the trend is similar to the dielectric constant evolution, with x = 0.15 presenting a weak variation. The presence of Mn in the LiTaO3 matrix seems to modify the temperature at which the ferroelectric to paraelectric phase transition occurs. A decrease in (Tc) is observed when increasing the amount of Mn, as shown in Figure 5c. As reported in the structural analysis, this substitution creates distortions in the crystal lattice, which can probably interfere with the long-range ordering of dipoles in the crystal lattice ferroelectric order, inducing this (Tc) shift.
To evaluate the broadening of the phase transition while incorporating Mn, the modified Curie–Weiss law was used:
1 ε r 1 ε m = ( T T m   ) γ C ,
where ε m is the value of the dielectric permittivity at T m , C is a constant, and γ represents the diffuseness exponent. If γ = 1, the material is in its ferroelectric state. However, at γ = 2, the material is a typical ferroelectric relaxor. Figure 6 represents the plots of ln (1/ ε r − 1/ ε m ) vs. ln (TTm) at 1 MHz for Li1−xMnx/2TaO3 compositions.
As seen in the figure, γ > 1 for all compositions, highlighting the diffuse phase transition for all species. In addition, the value of γ increases with the main content. The presence of Mn3⁺ ions (with a distinct electronic configuration) leads to localized electric fields, which affects the dipolar interactions within the host lattice, responsible for the observed phase transition broadening. Note that for x = 0.25, the transition is broadened and less distinct; the presence of manganese with different oxidation degrees (Mn3+ and Mn2+) may be the origin of this behavior.

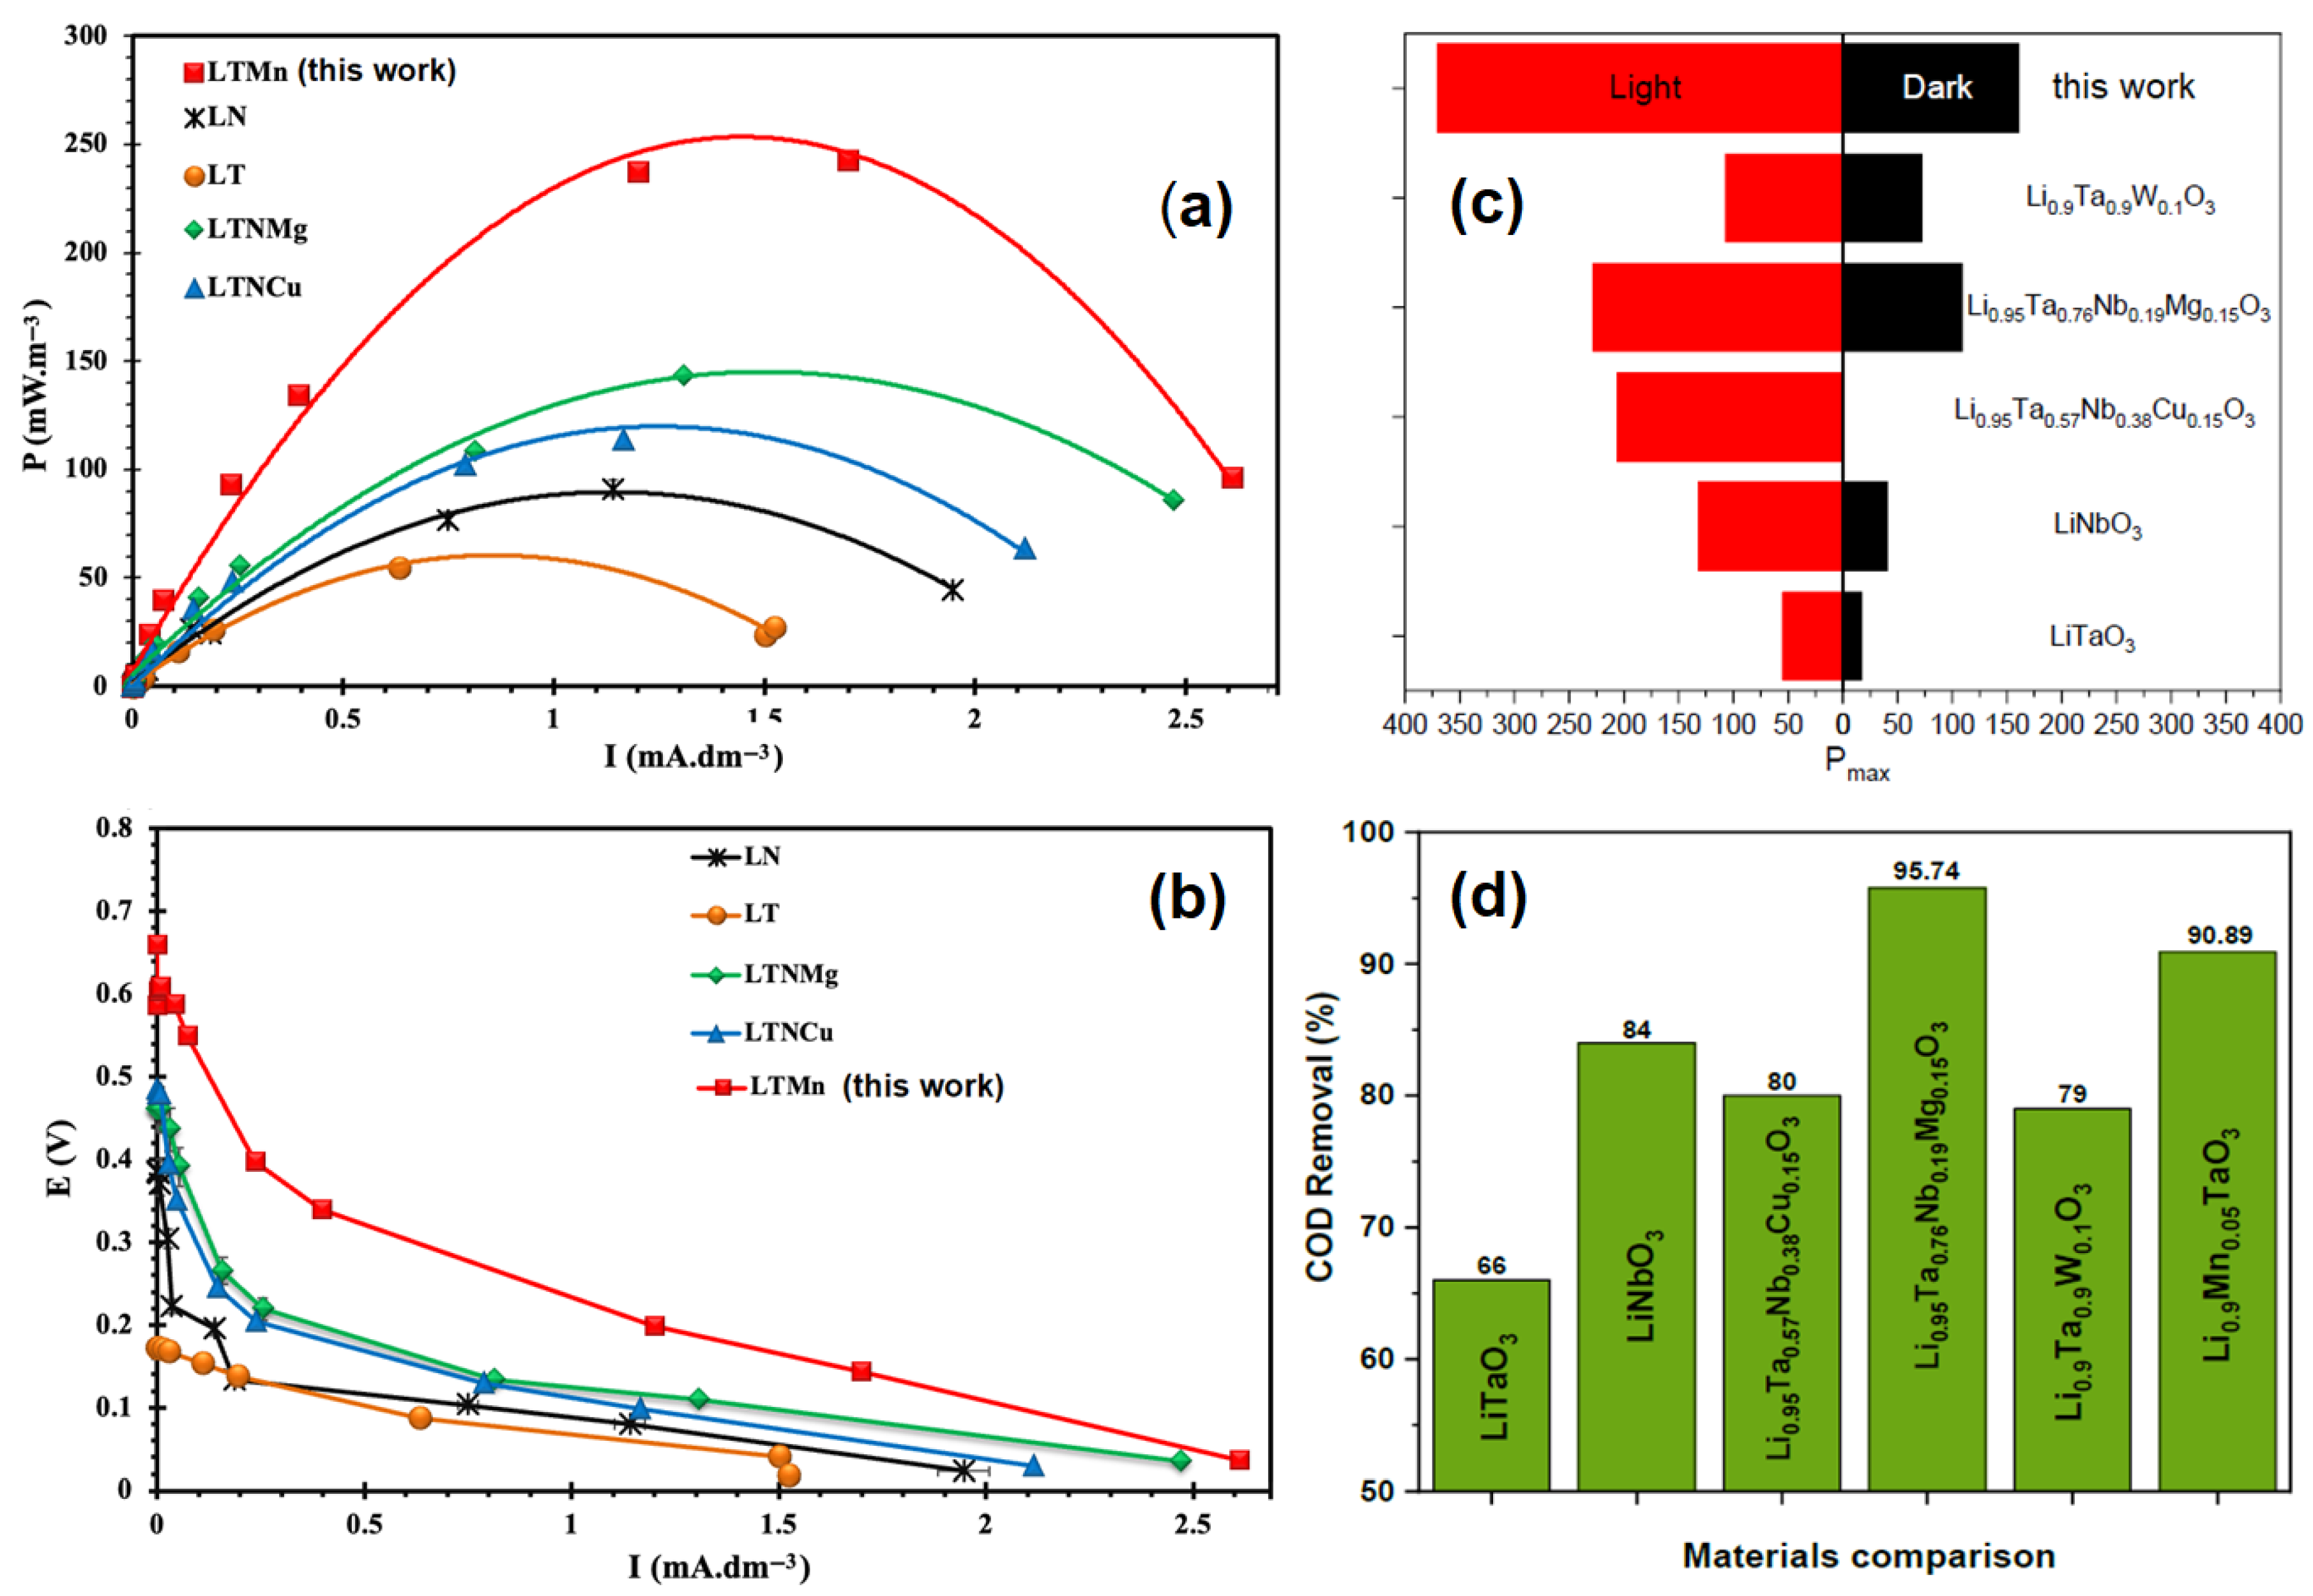
3.5. Optical Properties and MFCs Cathode Investigation

Optical property measurement, with a particular focus on the determination of the material’s band gap energy, serves as a pivotal aspect for the investigation of its potential application in photocatalysis. The estimated bandgap values for all the Li1−xMnx/2TaO3 ceramics obtained from the different types of UV–Vis optical plots are shown in Figure 7 and Table 2. It has been demonstrated that the band gap depends on composition; this gap decreases as the amount of added manganese increases. The present investigation is a continuation of previous work on the modification of LiTaO3 and LiNbO3 matrices by several transition metals (see Introduction). The compound Li1−xMnx/2TaO3 (x = 0.10) has a particularly good performance in photocatalysis compared with other compositions with different x values. The following section will focus on the performance of this compound in the bioconversion of organic compounds contained in wastewater, by comparing it with other materials in its class.
In this study, attention was focused on the generation of eco-friendly electricity by accelerating the decomposition of the organic load contained in wastewater using a LiTaO3-modified Mn2+ ferroelectric photocathode in a single-chamber microbial fuel cell. The compound prepared based on the value of x = 0.10 in Li1−xMnx/2TaO3 (LTMn) was selected among its homologous compounds as the most active. It achieved an electrical power density of around 370 mW/m2 when operating in the light, compared with 160 mW/m2 in the dark as depicted in Figure 8.
In the current study, wastewater purification was monitored by measuring the reduction in chemical oxygen demand (COD). The material Li1−xMnx/2TaO3 (x = 0.10) has been shown to have the capacity to reduce the organic load of pollutants by 90.89% after 168 h of operation. A comparative analysis of this activity in terms of the electricity production and wastewater treatment is relevant. Thus, Figure 8a–d and Table 3 have been designed to situate this material on the scale of materials of the same class. According to these data, a comparison with other materials from the same matrix shows that they have lower maximum power densities, both in the presence and absence of light. It should be noted that the best performances were recorded under lighting conditions and for all materials, thus demonstrating the photocatalytic nature of this class of materials. However, this efficiency differs from the basic compounds LiTaO3 and LiNbO3 to others obtained by modification. For example, the compound Li0.95Ta0.76Nb0.19Mg0.15O3 (LTNMg) demonstrates excellent performance with a power output of 228 mW/m2 under conditions of irradiation. However, this value was considerably lower than that achieved by the x = 0.10 material considered in this study. On the other hand, it remained significantly better than pure LiTaO3 and LiNbO3 and all the materials derived from their modifications, Li0.95Ta0.57Nb0.38Cu0.15O3 (LTNCu) and Li0.9Ta0.9W0.1O3 (LTW), which all achieved significantly lower powers than that obtained for x = 0.10 with manganese.
Regarding the purification performance, in terms of the COD removal, it was observed that, with the exception of that prepared based on Mg, the corresponding x = 0.10 with Mn remained an excellent catalyst. All other compounds displayed purification variability.
Under irradiation conditions, the values of the open circuit voltage (OCV), which are characteristic of the possible capacity for bioelectricity generation, are high for all the materials, with the highest value being 470 mV for LTNMg, suggesting a high energy generation capacity. Similarly, for certain materials there is a large decrease in Rint upon irradiation with the lowest value being 83.4 Ω for Li1−xMnx/2TaO3 (x = 0.10) (LTMn). The results emphasize the importance of both the material composition and the irradiation effects on the overall performance of microbial fuel cells. Li1−xMnx/2TaO3 (x = 0.10) and LTNMg were found to be the most suitable alternatives, showing a suitable combination of high power density and COD removal with low internal resistance, making them promising candidates for use in bioenergy and wastewater treatment. In addition, although LTNMg is an excellent material with effective COD removal, the exceptional power density of Li1−xMnx/2TaO3 (x = 0.10) (LTMn), coupled with its enhanced photocatalytic activity and excellent structural properties, provides a compelling reason to consider the material for application as a cathode in microbial fuel cells. The combination of its high energy production potential and excellent wastewater treatment capability positions Li11−xMnx/2TaO3 (x = 0.10) (LTMn) as a highly attractive candidate for sustainable and efficient energy.

4. Conclusions

In summary, the present study revealed that the prepared material exhibited R3c rhombohedral symmetry, indicating that the crystal structure of LiTaO3 remained relatively stable with the incorporation of Mn at room temperature.
Raman investigation as a function of temperature allowed approaching the ferroelectric–paraelectric phase transition, which occurs between 580 and 565 °C.
Dielectric measurements showed that the temperature of the ferroelectric–paraelectric phase transition (Tc) decreased with the increasing Mn content. This suggests that manganese incorporation influences the material’s dielectric response. The potential of Mn-doped LiTaO3 in waste bioconversion was explored, particularly its role as a photocathode for MFCs. The positive performance in this context indicates that the material may facilitate the conversion of organic waste into bioelectricity, highlighting its utility in sustainable waste management and energy generation from microbial processes.
This promising performance is also highlighted when compared to results obtained using other dopants, positioning manganese-doped LiTaO3 as a strong candidate for future sustainable energy generation technologies.

Author Contributions

Conceptualization, methodology, writing, M.E.H.H.; data curation, formal analysis, investigation, writing, M.B., data curation, writing—review and editing, M.H.; visualization, writing—review and editing, validation, A.B., A.L. and N.T.; conceptualization, methodology, visualization, L.T., project administration, supervision, E.M.L.; funding acquisition, M.E.M. All authors have read and agreed to the published version of the manuscript.

Funding

This work was financially supported by the Moroccan Ministry of Higher Education, Scientific Research, and Innovation, and the OCP Foundation through the APRD research program.

Data Availability Statement

Data is contained within the article.

Acknowledgments

We would like to thank the Moroccan Ministry of Higher Education, Scientific Research and Innovation, and the OCP Foundation who funded this work through the APRD research program.

Conflicts of Interest

The authors declare no conflicts of interest.

References

  1. Krätzig, E.; Schirmer, O.F. Photorefractive centers in electro-optic crystals. In Photorefractive Materials and Their Applications I; Springer: Berlin/Heidelberg, Germany, 1988; pp. 131–166. [Google Scholar] [CrossRef]
  2. Asbani, B.; Gagou, Y.; Trček, M.; Dellis, J.-L.; Amjoud, M.; Lahmar, A.; Mezzane, D.; Kutnjak, Z.; El Marssi, M. Dielectric permittivity enhancement and large electrocaloric effect in the lead free (Ba0.8Ca0.2)1−xLa2x/3TiO3 ferroelectric ceramics. J. Alloys Compd. 2018, 730, 501–508. [Google Scholar] [CrossRef]
  3. El Bachraoui, F.; Chchiyai, Z.; Matrouf, M.; Tamraoui, Y.; Bih, L.; Alami, J.; Ghamouss, F.; Manoun, B. Insights into the structural, dielectric, optical and electrochemical characteristics reveal the limiting parameters toward efficient OER catalysts in the perovskite solid solution Sr1-xLaxTi1-xFexO3 (0.2 ≤ x ≤ 0.8). J. Alloys Compd. 2024, 1008, 176636. [Google Scholar] [CrossRef]
  4. Gallegos-Melgar, A.; Espinosa-Arbelaez, D.G.; Flores-Ruiz, F.J.; Lahmar, A.; Dellis, J.-L.; Lemée, N.; Espinoza-Beltran, F.J.; Muñoz-Saldaña, J. Ferroelectric properties of manganese doped (Bi1/2Na1/2)TiO3 and (Bi1/2Na1/2)TiO3–BaTiO3 epitaxial thin films. Appl. Surf. Sci. 2015, 359, 923–930. [Google Scholar] [CrossRef]
  5. Deng, C.; Zhang, Y.; Yang, D.; Zhang, H.; Zhu, M. Recent Progress on Barium Titanate-Based Ferroelectrics for Sensor Applications. Adv. Sens. Res. 2024, 3, 2300168. [Google Scholar] [CrossRef]
  6. Choi, J.J.; Billinge, S.J.L. Perovskites at the nanoscale: From fundamentals to applications. Nanoscale 2016, 8, 6206–6208. [Google Scholar] [CrossRef]
  7. Chen, P.; Li, T.-T.; Yang, Y.-B.; Li, G.-R.; Gao, X.-P. Coupling aqueous zinc batteries and perovskite solar cells for simultaneous energy harvest, conversion and storage. Nat. Commun. 2022, 13, 64. [Google Scholar] [CrossRef]
  8. Zhang, L.; Miao, J.; Li, J.; Li, Q. Halide Perovskite Materials for Energy Storage Applications. Adv. Funct. Mater. 2020, 30, 2003653. [Google Scholar] [CrossRef]
  9. Clabel H, J.L.; Awan, I.T.; Pinto, A.H.; Nogueira, I.C.; Bezzon, V.D.N.; Leite, E.R.; Balogh, D.T.; Mastelaro, V.R.; Ferreira, S.O.; Marega, E., Jr. Insights on the mechanism of solid state reaction between TiO2 and BaCO3 to produce BaTiO3 powders: The role of calcination, milling, and mixing solvent. Ceram. Int. 2020, 46, 2987–3001. [Google Scholar] [CrossRef]
  10. Pan, Q.; Pu, Y.; Wang, B.; Xie, H.; Zhang, L.; Zhang, J.; Hao, Y.; Yang, Y.; Qian, J. Substantial increase in resistance and suppression of resistance degradation in SrTiO3-based ceramics with colossal permittivity and low dielectric loss. Ceram. Int. 2025, 51, 187–195. [Google Scholar] [CrossRef]
  11. Liu, X.; Hou, Y.; Xu, Y.; Zheng, M.; Zhu, M. Realization of temperature insensitive high energy storage performance via introducing NaNbO3 into NBT-KBT system. J. Alloys Compd. 2020, 844, 156163. [Google Scholar] [CrossRef]
  12. Jyothi, R.; Sekhar, K.S.K.R.C.; Saini, D.S.; Mouli, K.C.; Krishna, Y.R.; Tirupathi, P. Temperature and field-dependent electrical property and energy density correlations studies in KNN-modified NBT–KBT solid solution ceramics. J. Mater. Sci. Mater. Electron. 2023, 34, 629. [Google Scholar] [CrossRef]
  13. Zidani, J.; Zannen, M.; Hadouchi, M.; Alzahrani, H.A.H.; Birks, E.; Khemakhem, H.; Majdoub, M.; El Marssi, M.; Lahmar, A. Structural, electrical and optical properties of lanthanide-doped Na0.4K0.1Bi0.5TiO3 ceramics. Phys. B Condens. Matter 2023, 653, 414680. [Google Scholar] [CrossRef]
  14. Benyoussef, M.; Zannen, M.; Belhadi, J.; Manoun, B.; Dellis, J.-L.; El Marssi, M.; Lahmar, A. Dielectric, ferroelectric, and energy storage properties in dysprosium doped sodium bismuth titanate ceramics. Ceram. Int. 2018, 44, 19451–19460. [Google Scholar] [CrossRef]
  15. Habouti, S.; Lahmar, A.; Dietze, M.; Solterbeck, C.-H.; Zaporojtchenko, V.; Es-Souni, M. Substrate heterostructure effects on interface composition, microstructure development and functional properties of PZT thin films. Acta Mater. 2009, 57, 2328–2338. [Google Scholar] [CrossRef]
  16. Katzke, H.; Dietze, M.; Lahmar, A.; Es-Souni, M.; Neumann, N.; Lee, S.G. Dielectric, ultraviolet/visible, and Raman spectroscopic investigations of the phase transition sequence in 0.71Pb(Mg1/3Nb2/3)O3-0.29PbTiO3 crystals. Phys. Rev. B Condens. Matter Mater. Phys. 2011, 83, 174115. [Google Scholar] [CrossRef]
  17. Haertling, G.H. Ferroelectric Ceramics: History and Technology. J. Am. Ceram. Soc. 1999, 82, 797–818. [Google Scholar] [CrossRef]
  18. Fakhri, M.A.; Bader, B.A.; Khalid, F.G.; Numan, N.H.; Abdulwahhab, A.W.; Hashim, U.; Salim, E.T.; Munshid, M.A.; Salim, Z.T. Optical and morphological studies of LiNbO3 nano and micro photonic structural. AIP Conf. Proc. 2018, 2045, 020017. [Google Scholar] [CrossRef]
  19. Mondain, F.; Brunel, F.; Hua, X.; Gouzien, É.; Zavatta, A.; Lunghi, T.; Doutre, F.; De Micheli, M.P.; Tanzilli, S.; D’Auria, V. Photorefractive effect in LiNbO3-based integrated-optical circuits for continuous variable experiments. Opt. Express 2020, 28, 23176–23188. [Google Scholar] [CrossRef]
  20. Lyu, T.; Dorenbos, P.; Li, C.; Wei, Z. Wide Range X-Ray to Infrared Photon Detection and Energy Storage in LiTaO3:Bi3+,Dy3+ Perovskite. Laser Photon Rev. 2022, 16, 2200055. [Google Scholar] [CrossRef]
  21. Kharti, H.; Touach, N.; Lotfi, E.M.; El Mahi, M.; Mouhir, L.; Fekhaoui, M.; Benzaouak, A. Bioenergy generation and wastewater treatment with nickel pyrophosphate as a novel cathode catalyst in single-chamber microbial fuel cells. Renew. Energy 2024, 231, 121011. [Google Scholar] [CrossRef]
  22. Elhenawy, S.; Khraisheh, M.; AlMomani, F.; Al-Ghouti, M.; Hassan, M.K. From Waste to Watts: Updates on Key Applications of Microbial Fuel Cells in Wastewater Treatment and Energy Production. Sustainability 2022, 14, 955. [Google Scholar] [CrossRef]
  23. Gopal, V.; Palanisamy, G.; Lee, J.; Abu-Yousef, I.A.; Majdalawieh, A.F.; Mahasneh, A.; Prabu, K.M.; Kanan, S. Fabrication of SrTiO3 anchored rGO/g-C3N4 photocatalyst for the removal of mixed dye from wastewater: Dual photocatalytic mechanism. Sci. Rep. 2024, 14, 16259. [Google Scholar] [CrossRef] [PubMed]
  24. Huamán, J.L.C.; Rivera, V.A.G. (Eds.) Perovskite Ceramics; Elsevier: Amsterdam, The Netherlands, 2023. [Google Scholar] [CrossRef]
  25. Clabel H, J.L.; Chacaliaza-Ricaldi, J.; Marega, E., Jr. Potential Application of Perovskite Structure for Water Treatment: Effects of Band Gap, Band Edges, and Lifetime of Charge Carrier for Photocatalysis. Front. Nanotechnol. 2022, 4, 827925. [Google Scholar] [CrossRef]
  26. Sharma, M.; Jalalah, M.; Alsareii, S.A.; Harraz, F.A.; Xue, W.; Thakur, N.; Salama, E.-S.; Li, X. Microalgal cycling in the cathode of microbial fuel cells (MFCs) induced oxygen reduction reaction (ORR) and electricity: A biocatalytic process for clean energy. Chem. Eng. J. 2024, 479, 147431. [Google Scholar] [CrossRef]
  27. Benzaouak, A.; Touach, N.-E.; Ortiz-Martínez, V.; Salar-García, M.; Hernández-Fernández, F.; Ríos, A.d.L.; El Mahi, M.; Lotfi, E.M. Ferroelectric solid solution Li1−xTa1−xWxO3 as potential photocatalysts in microbial fuel cells: Effect of the W content. Chin. J. Chem. Eng. 2018, 26, 1985–1991. [Google Scholar] [CrossRef]
  28. Touach, N.; Benzaouak, A.; Toyir, J.; El Hamidi, A.; El Mahi, M.; Lotfi, E.M.; Kacimi, M.; Liotta, L.F. Bioenergy Generation and Wastewater Purification with Li0.95Ta0.76Nb0.19Mg0.15O3 as New Air-Photocathode for MFCs. Catalysts 2022, 12, 1424. [Google Scholar] [CrossRef]
  29. Hitar, M.E.H.; Benzaouak, A.; Touach, N.-E.; Kharti, H.; Assani, A.; El Mahi, M.; Lotfi, E.M. Sustainable electricity generation using LiTaO3-Modified Mn2+ ferroelectric photocathode in microbial fuel Cells: Structural insights and enhanced waste bioconversion. Chem. Phys. Lett. 2024, 837, 141055. [Google Scholar] [CrossRef]
  30. Le Bail, A. Whole powder pattern decomposition methods and applications: A retrospection. Powder Diffr. 2005, 20, 316–326. [Google Scholar] [CrossRef]
  31. Hsu, R.; Maslen, E.N.; Boulay, D.D.; Ishizawa, N. Synchrotron X-ray Studies of LiNbO3 and LiTaO3. Acta Crystallogr. B 1997, 53, 420–428. [Google Scholar] [CrossRef]
  32. Shannon, R.D.; Prewitt, C.T. Effective ionic radii in oxides and fluorides. Acta Crystallogr. B 1969, 25, 925–946. [Google Scholar] [CrossRef]
  33. Assani, A.; Zriouil, M.; Elouadi, B. Investigation of new LiTaO3-related solid solutions in the ternary system Li2O-Ta2O5-(MnO)2: Crystal chemistry and ferroelectric properties. Ann. Chim. Sci. Matér. 1998, 23, 229–232. [Google Scholar] [CrossRef]
  34. Yang, W.; Zhang, Y. Effects of MnO2 addition on the microstructure and dielectric properties of LiTaO3 ceramics. Vacuum 2020, 173, 109130. [Google Scholar] [CrossRef]
  35. Yang, X.; Lan, G.; Li, B.; Wang, H. Raman Spectra and Directional Dispersion in LiNbO3 and LiTaO3. Phys. Status Solidi (b) 1987, 142, 287–300. [Google Scholar] [CrossRef]
  36. Repelin, Y.; Husson, E.; Bennani, F.; Proust, C. Raman spectroscopy of lithium niobate and lithium tantalate. Force field calculations. J. Phys. Chem. Solids 1999, 60, 819–825. [Google Scholar] [CrossRef]
  37. Raptis, C. Assignment and Temperature Dependence of the Raman Modes of LiTaO3 Studied over the Ferroelectric and Paraelectric Phases. Phys. Rev. B 1988, 38, 10007–10019. [Google Scholar] [CrossRef]
  38. Zhang, Y.; Yao, Y.; He, S. Sinterability and Dielectric Properties of LiTaO3-Based Ceramics with Addition of CoO. Materials 2020, 13, 1506. [Google Scholar] [CrossRef] [PubMed]
  39. Benzaouak, A.; Touach, N.; Ortiz-Martínez, V.M.; Salar-García, M.J.; Hernández-Fernández, F.J.; Ríos, A.P.d.L.; El Mahi, M.; Lotfi, E.M. Ferroelectric LiTaO3 as novel photo-electrocatalyst in microbial fuel cells. Environ. Prog. Sustain. Energy 2017, 36, 1568–1574. [Google Scholar] [CrossRef]
  40. Touach, N.; Ortiz-Martínez, V.; Salar-García, M.; Benzaouak, A.; Hernández-Fernández, F.; de Ríos, A.P.; El Mahi, M.; Lotfi, E. On the use of ferroelectric material LiNbO3 as novel photocatalyst in wastewater-fed microbial fuel cells. Particuology 2017, 34, 147–155. [Google Scholar] [CrossRef]
Figure 1. Refined XRD patterns of Li1−xMnx/2TaO3 compositions.
Crystals 15 00253 g001
Figure 2. Unit cell parameters’ evolution in Li1−xMnx/2TaO3 compositions.
Crystals 15 00253 g002
Figure 3. SEM micrographs with grain sizes’ distribution of Li1−xMnx/2TaO3 (x = 0–0.25), EDS mapping images of the elements (O, Mn, Ta), and EDX of the composition x = 0.10.
Crystals 15 00253 g003aCrystals 15 00253 g003b
Figure 4. (a) Room temperature of Raman spectra of Li1−xMnx/2TaO3 powders (x = 0–0.25). Temperature dependence of Raman spectra of Li1−xMnx/2TaO3 at (b) x = 0, (c) x = 0.15, and (d) x = 0.25.
Crystals 15 00253 g004
Figure 5. Thermal evolution of the studied samples at 1 MHz: (a) dielectric constant; (b) dielectric loss; (c) Curie temperature (Tc).
Crystals 15 00253 g005
Figure 6. Variation of ln (1/ ε r − 1/ ε m ) as a function of ln (TTm) at 1 MHz for the ceramics: (a) x = 0; (b) x = 0.05; (c) x = 0.10; (d) x = 0.25.
Crystals 15 00253 g006
Figure 7. Absorbance spectra and the corresponding band gap of Li1−xMnx/2TaO3 compositions: (a) x = 0; (b) x = 0.05; (c) x = 0.10; (d) x = 0.15.
Crystals 15 00253 g007
Figure 8. (a,b) Power density and polarization curves, (c) maximum power density in light and dark conditions, and (d) COD removal comparison of the studied photocatalysts tested in MFCs.
Crystals 15 00253 g008
Table 1. Crystal data and structure refinement details of Li1−xMnx/2TaO3 compositions.
Composition (x)0.00.050.100.150.25
T (K)298
Crystal system, space groupTrigonal,
R3c
Lattice parameters (Å)a = 5.1500 (4),
c = 13.7560 (12)
a = 5.1625 (4),
c = 13.7599 (12)
a = 5.1639 (4),
c = 13.7617 (11)
a = 5.1710 (3),
c = 13.7658 (10)
a = 5.1828 (5),
c = 13.7584 (15)
V3)315.97 (4) 317.59 (4)317.80 (4)318.77 (4)320.06 (5)
Reliability factors and goodness of fit χ2Rp = 8.842,
Rwp = 12.411,
Rexp = 9.491,
χ2 = 1.709
Rp = 8.923,
Rwp = 12.846,
Rexp = 10.077,
χ2 = 1.625
Rp = 9.332,
Rwp = 12.460,
Rexp = 9.323,
χ2 = 1.786
Rp = 9.115,
Rwp = 11.873,
Rexp = 9.280,
χ2 = 1.637
Rp = 9.466,
Rwp = 13.032,
Rexp = 9.668,
χ2 = 1.817
Table 2. Band gaps of the prepared ceramics.
x Valuex = 0.00x = 0.05x = 0.10x = 0.15x = 0.25
Eg (eV)3.83.63.53.383.45
Table 3. Comparison of recent results of photocatalysts tested in MFCs.
MaterialEg (eV)Pmax (mW/m2) (light)Pmax (mW/m2) (dark)COD Removal (%)OCV (mV) (Light)Rint (Ω) (Light)References
LiTaO34.81551766349657[39]
LiNbO34.081314084400277[40]
Li0.95Ta0.57Nb0.38Cu0.15O3 -205.35-80376187.79[28]
Li0.95Ta0.76Nb0.19Mg0.15O3 4.0322810995.74470411[28]
Li0.9Ta0.9W0.1O33.85107.27279316877.5[27]
Li1−xMnx/2TaO3 (x = 0.10)3.4837016090.8937783.4[This work]
Disclaimer/Publisher’s Note: The statements, opinions and data contained in all publications are solely those of the individual author(s) and contributor(s) and not of MDPI and/or the editor(s). MDPI and/or the editor(s) disclaim responsibility for any injury to people or property resulting from any ideas, methods, instructions or products referred to in the content.

