
The Effect of Aluminum Deformation Conditions on Microhardness and Indentation Size Effect Characteristics

 ,
,  ,
,  , , , ,
  , and
, and
Abstract
1. Introduction
2. Materials and Methods
3. Results
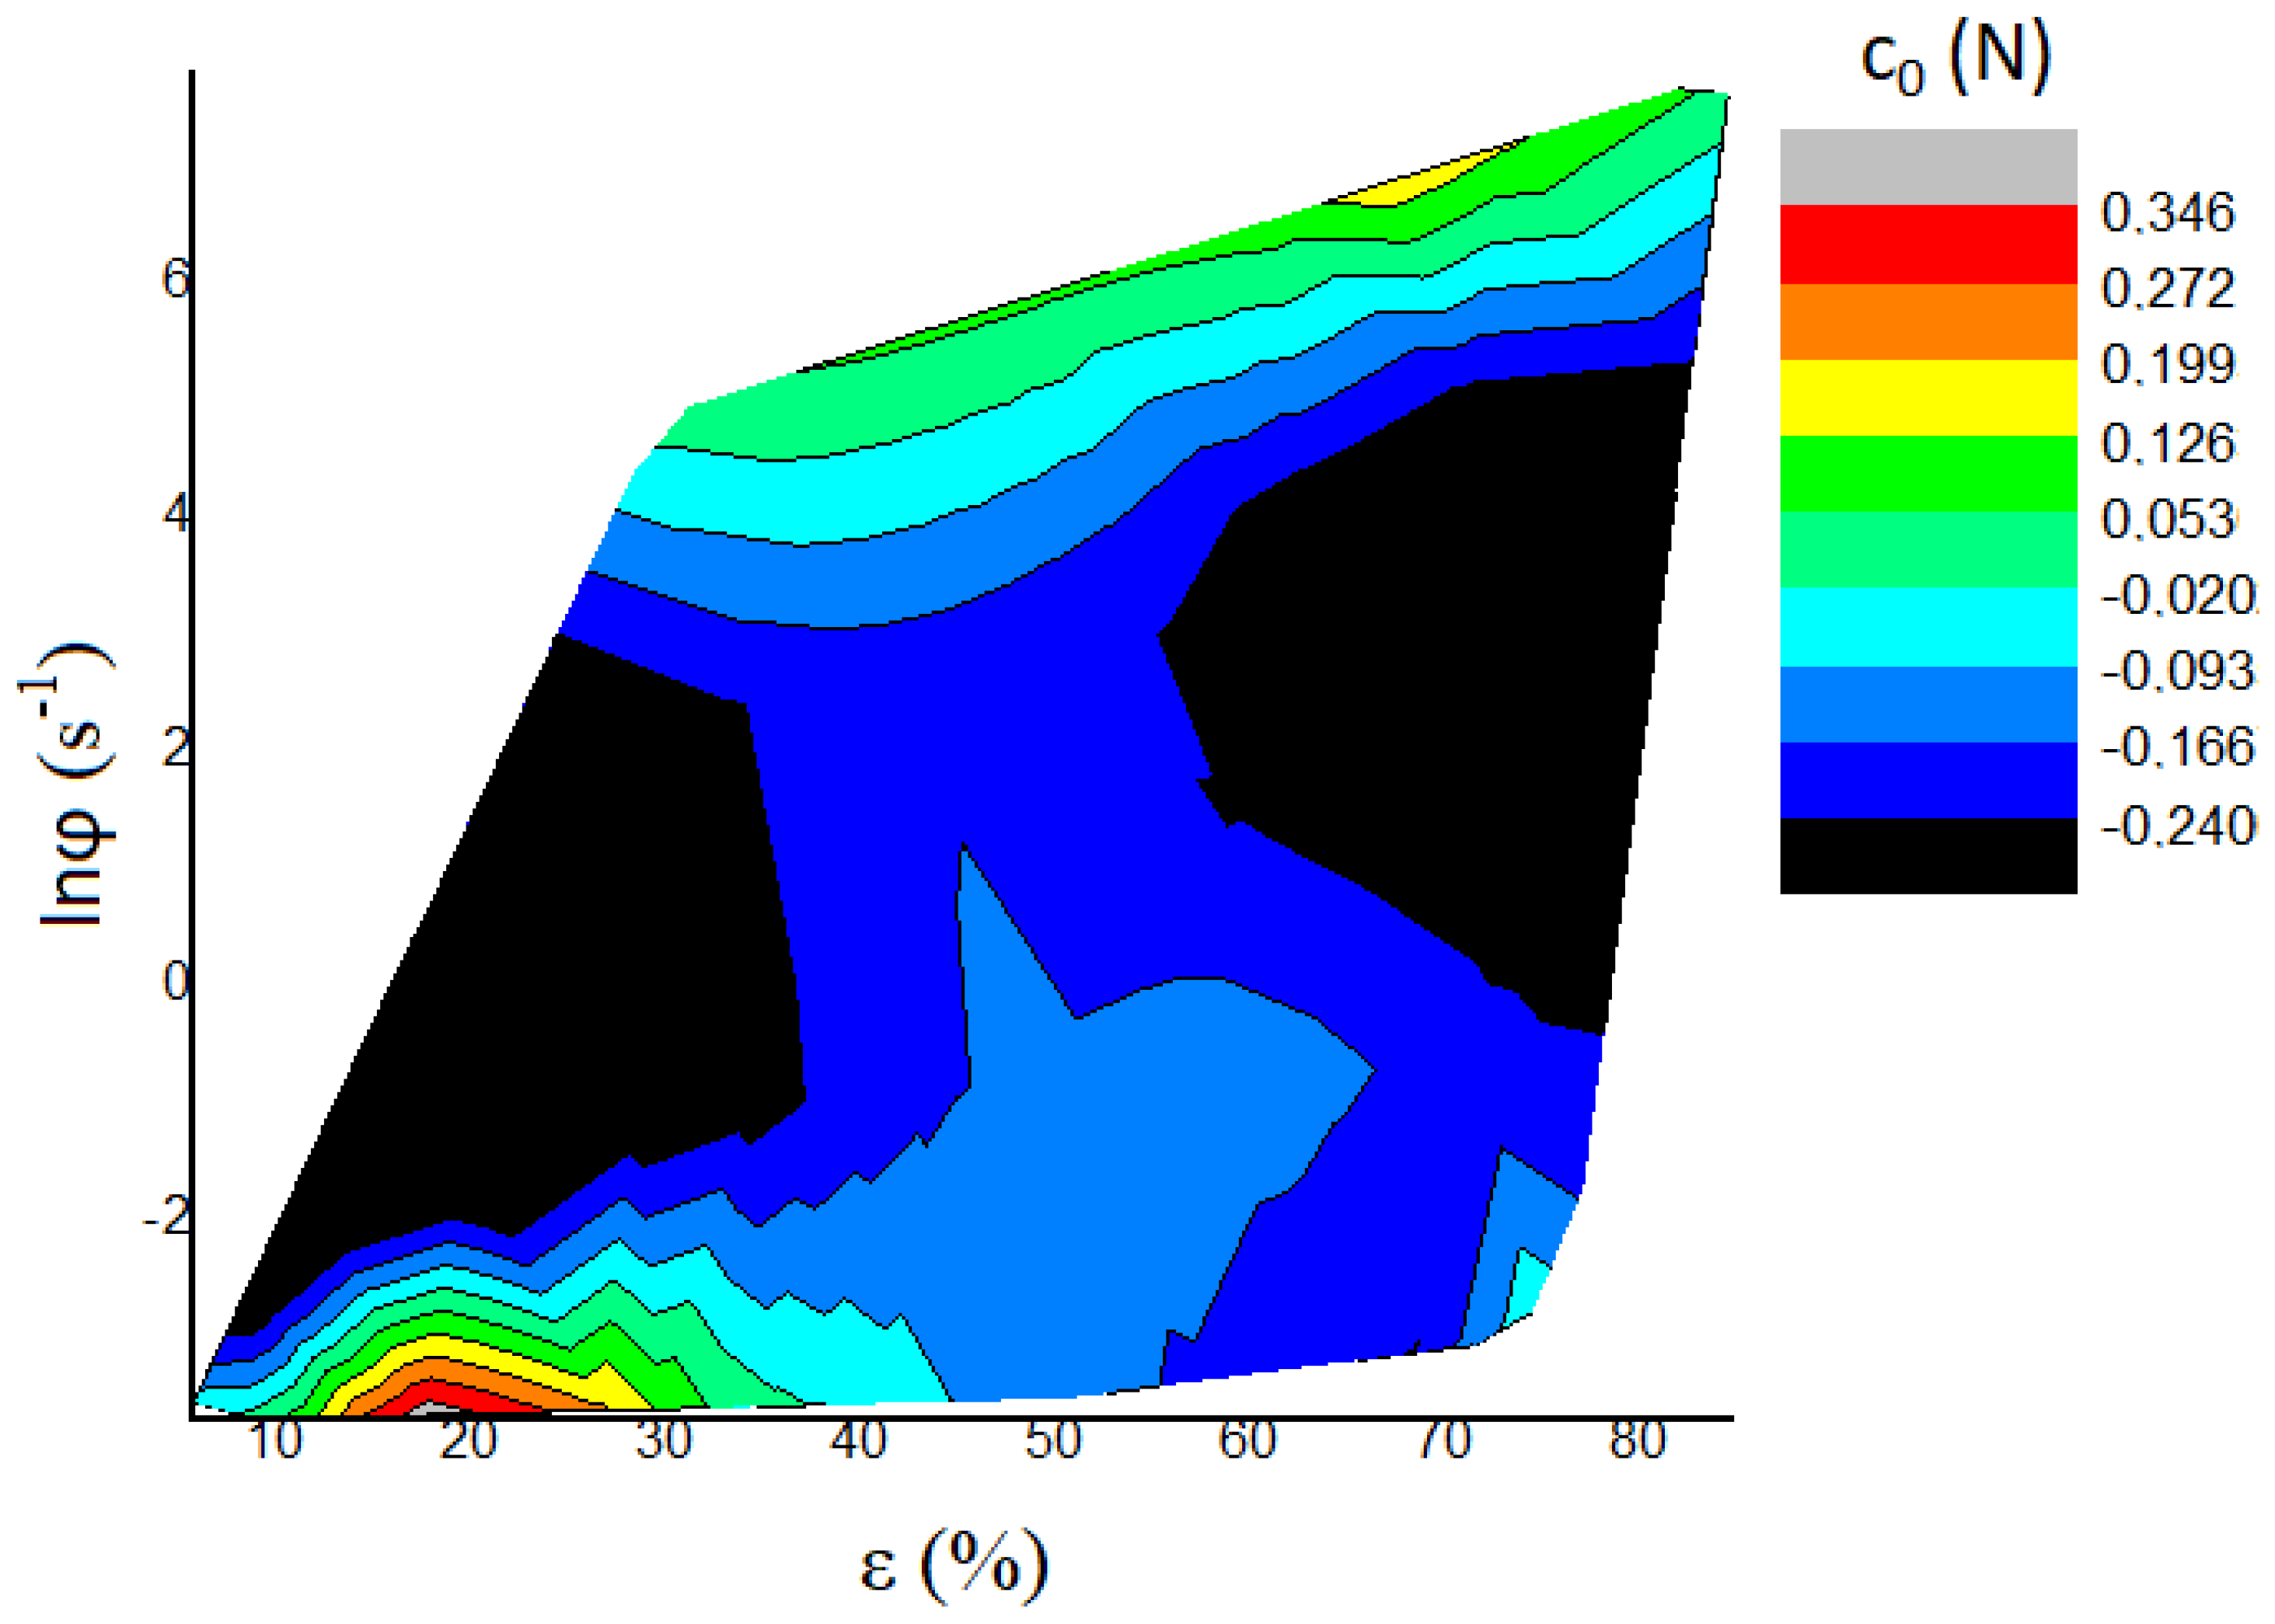
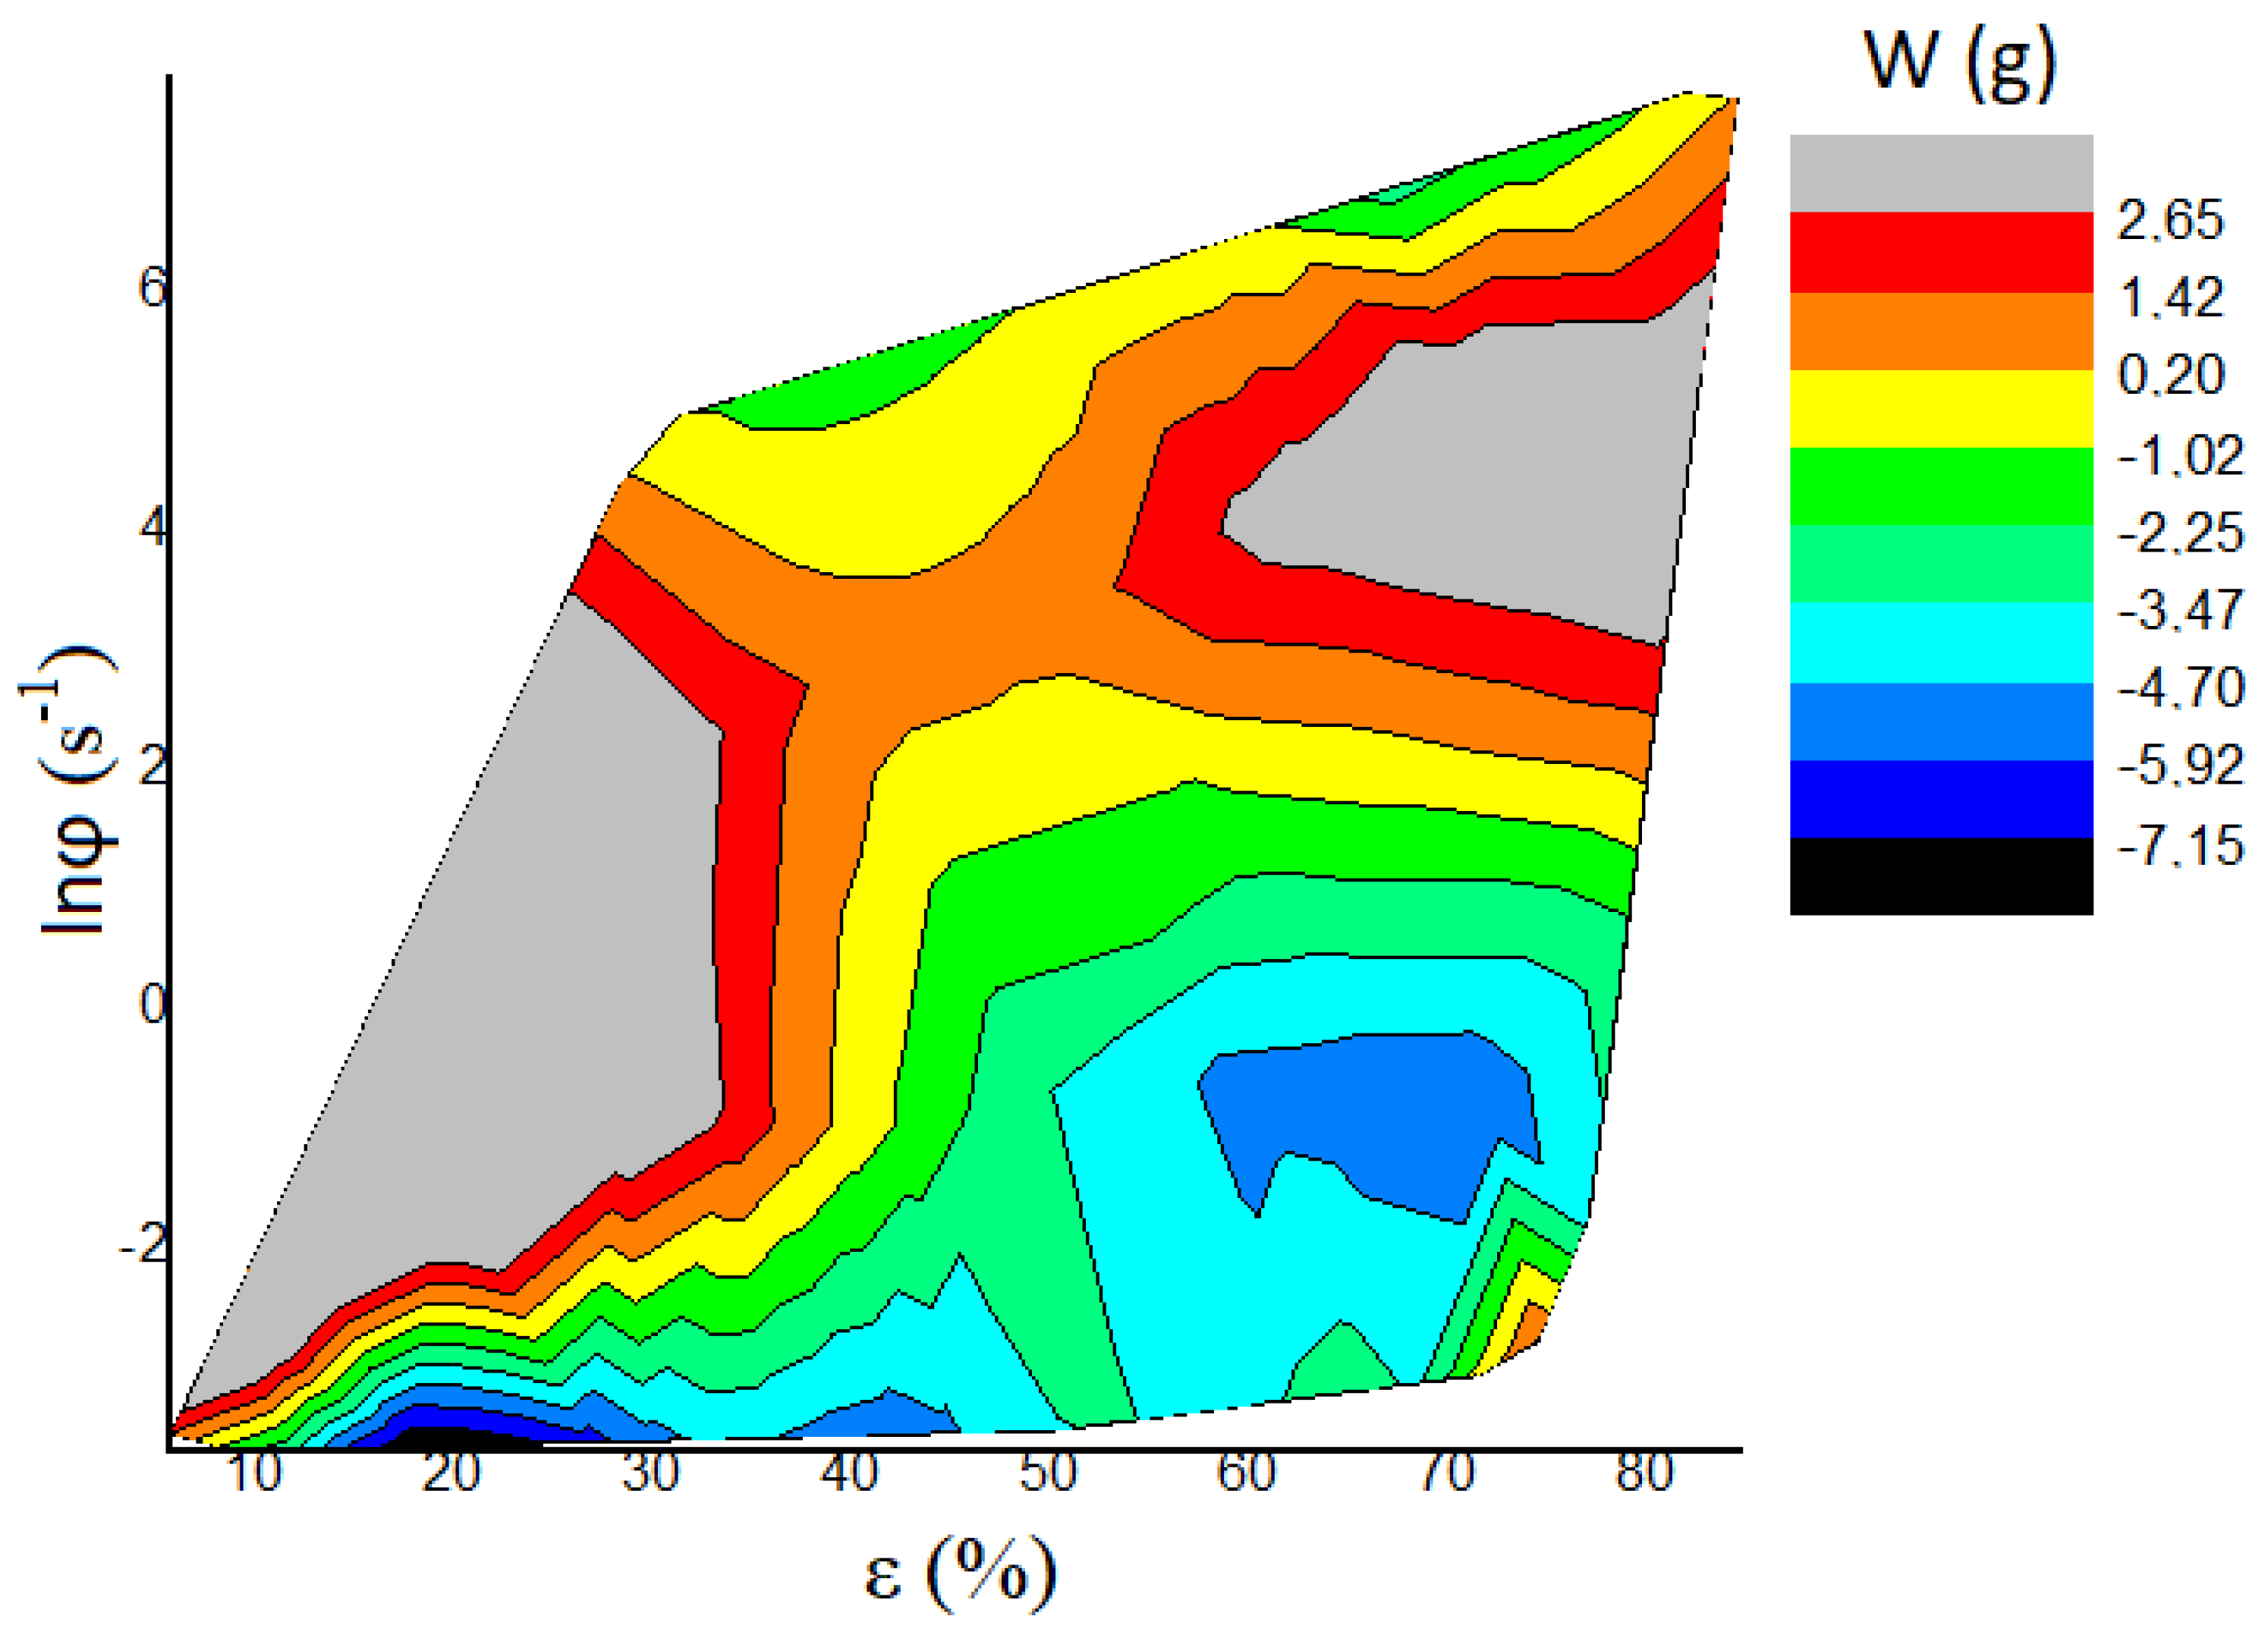
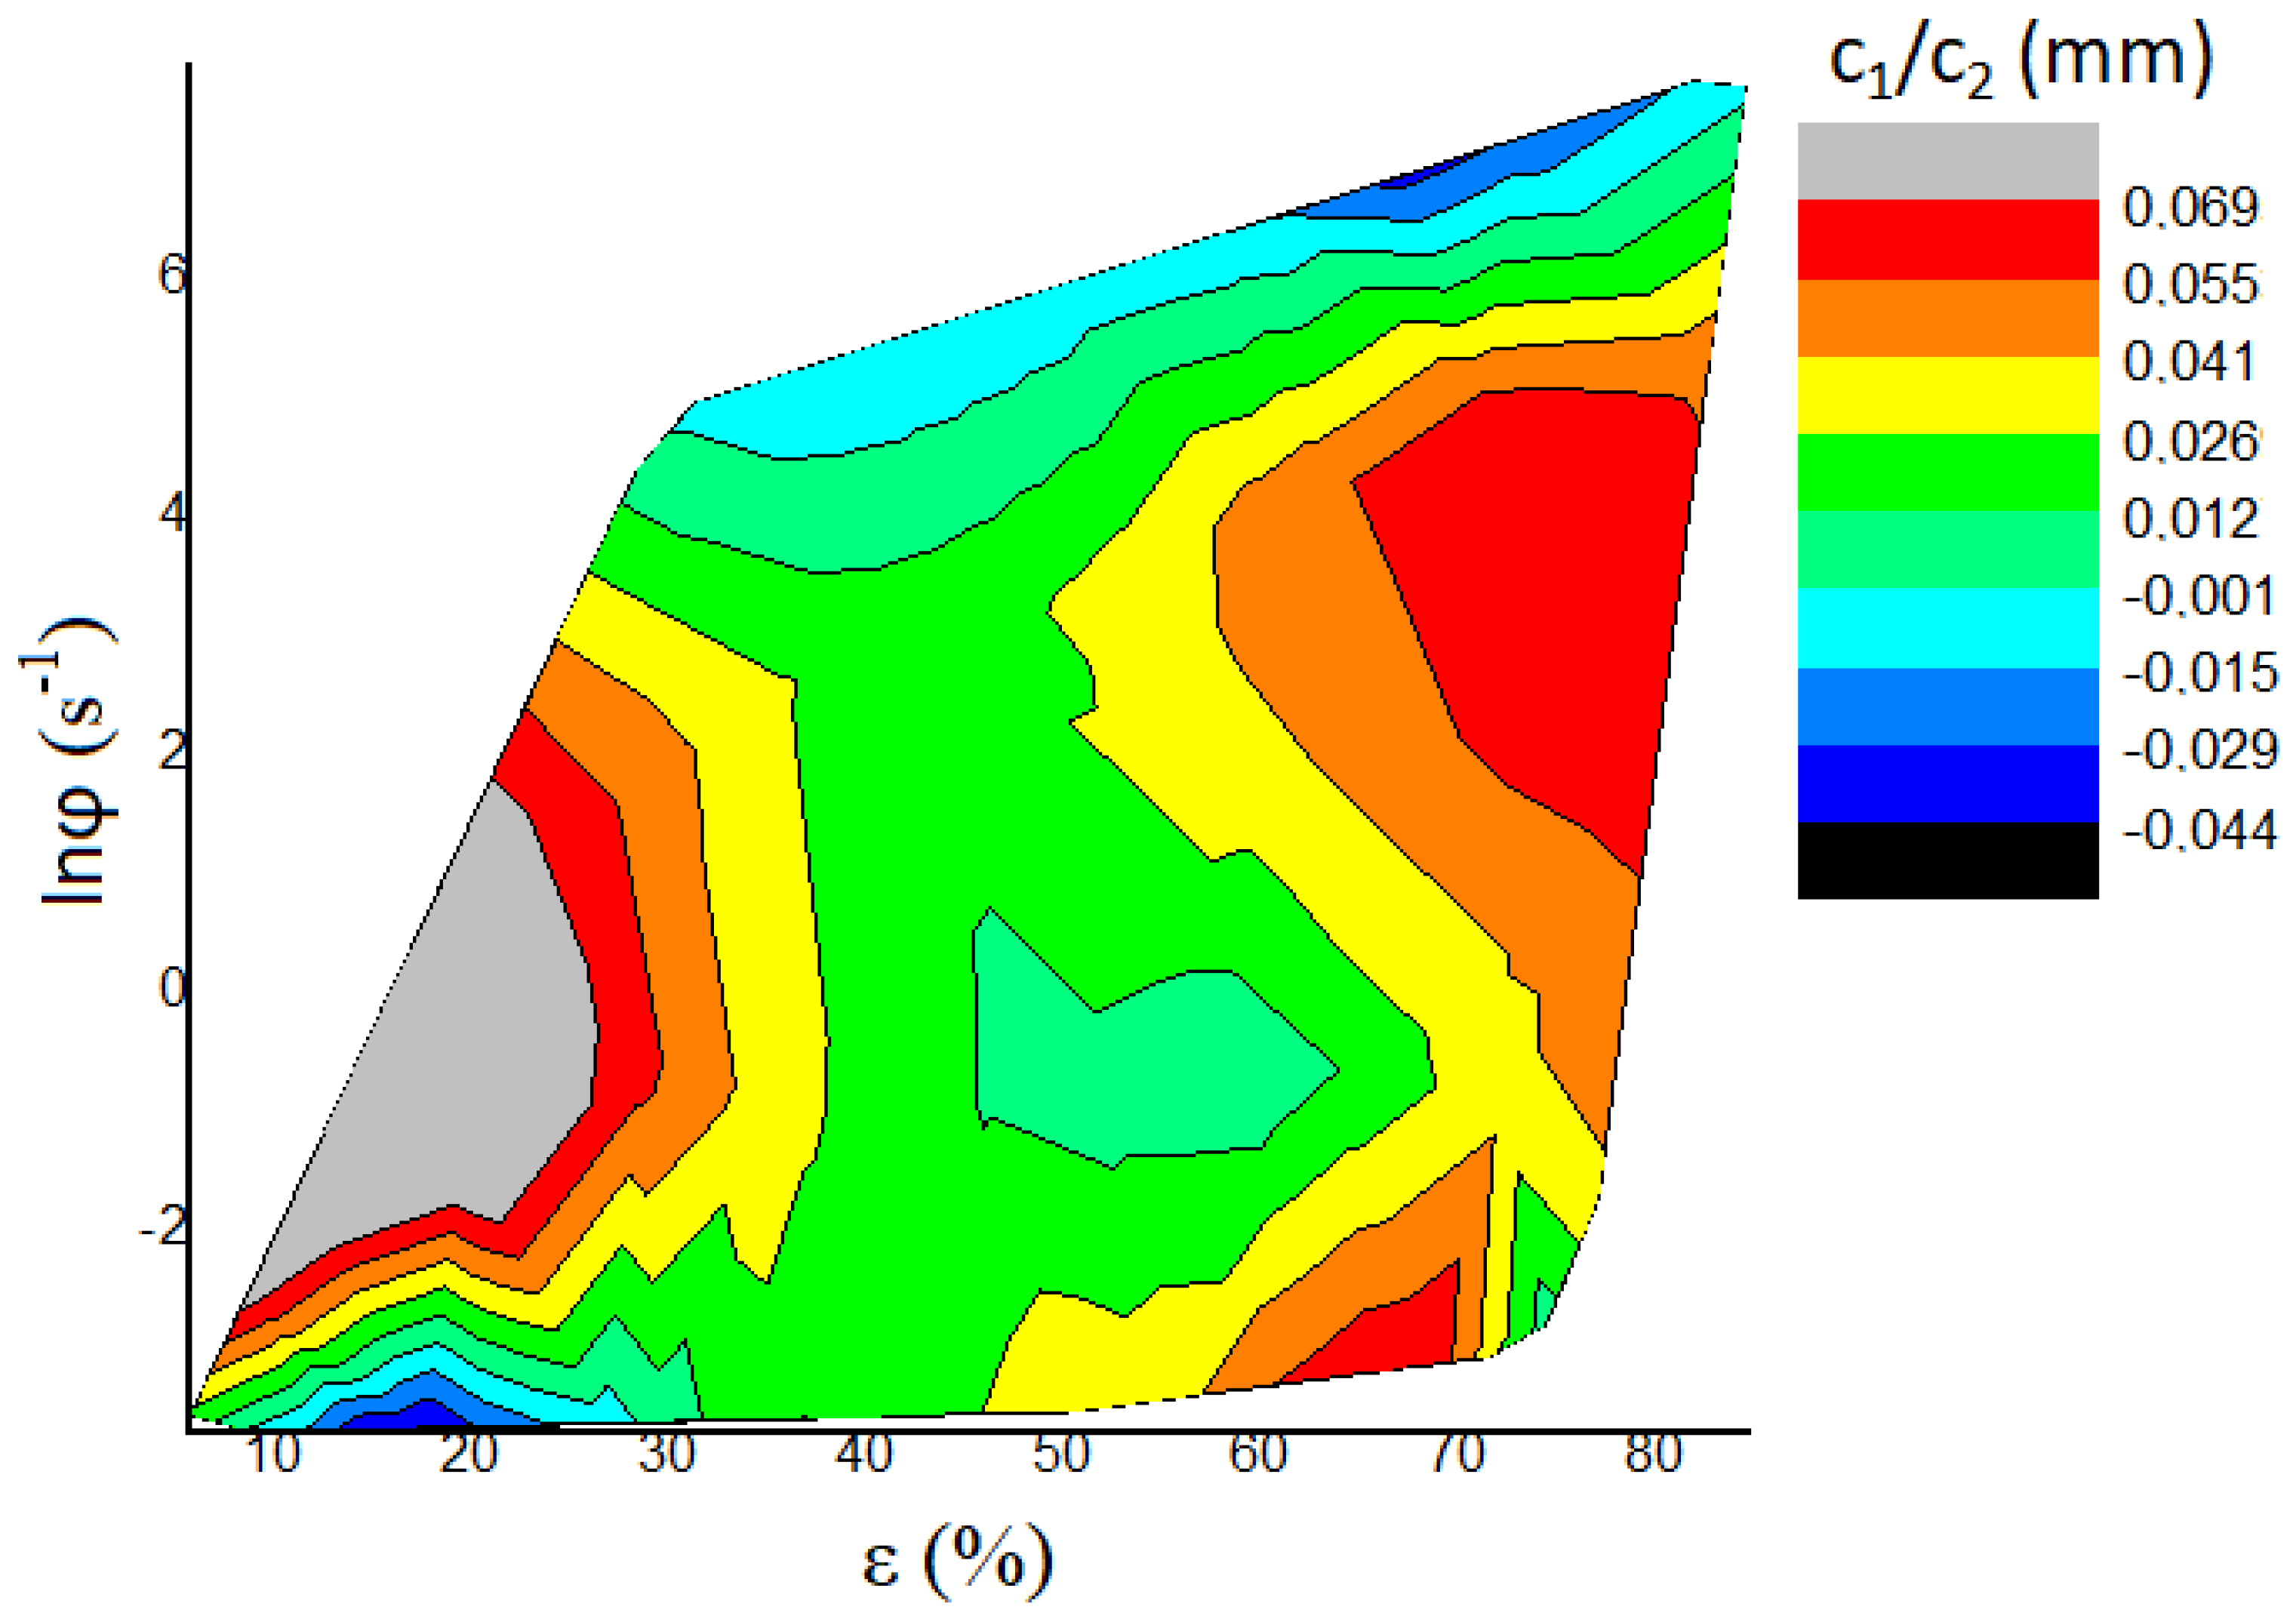
4. Deformation Maps
- (a)
- Temperature or homologous temperature (x-axis) and normalized shear stress or shear stress at 20 °C (y-axis);
- (b)
- Normalized shear stress/shear stress at 20 °C (x-axis) and shear strain rate (y-axis).

5. Discussion
6. Conclusions
Author Contributions
Funding
Data Availability Statement
Conflicts of Interest
References
- ISO 6507-1; Metallic Materials—Vickers Hardness Test Part 1—Test Method. International Organization for Standardization ISO: Brussels, Belgium, 2018.
- Tabor, D. The Hardness of Metals; Oxford Classic Texts in the Physical Sciences; Clarendon Press: Oxford, UK; Oxford University Press: New York, NY, USA, 2000; ISBN 978-0-19-850776-5. [Google Scholar]
- Sangwal, K.; Surowska, B.; Błaziak, P. Analysis of the Indentation Size Effect in the Microhardness Measurement of Some Cobalt-Based Alloys. Mater. Chem. Phys. 2003, 77, 511–520. [Google Scholar] [CrossRef]
- Sangwal, K. On the Reverse Indentation Size Effect and Microhardness Measurement of Solids. Mater. Chem. Phys. 2000, 63, 145–152. [Google Scholar] [CrossRef]
- Gong, J.; Wu, J.; Guan, Z. Examination of the Indentation Size Effect in Low-Load Vickers Hardness Testing of Ceramics. J. Eur. Ceram. Soc. 1999, 19, 2625–2631. [Google Scholar] [CrossRef]
- Ren, X.J.; Hooper, R.M.; Griffiths, C.; Henshall, J.L. Indentation Size Effect in Ceramics: Correlation with H/E. J. Mater. Sci. Lett. 2003, 22, 1105–1106. [Google Scholar] [CrossRef]
- Navrátil, V.; Novotná, J. Some Problems of Microhardness of Metals. J. Appl. Math. 2009, 2, 241–244. Available online: https://www.researchgate.net/publication/268268064_SOME_PROBLEMS_OF_MICRO-HARDNESS_OF_METALS (accessed on 7 January 2025).
- Petrík, J.; Blaško, P.; Markulík, Š.; Šolc, M.; Palfy, P. The Indentation Size Effect (ISE) of Metals. Crystals 2022, 12, 795. [Google Scholar] [CrossRef]
- Petrík, J.; Blaško, P.; Petryshynets, I.; Mihaliková, M.; Pribulová, A.; Futáš, P. The Influence of the Degree of Tension and Compression of Aluminum on the Indentation Size Effect (ISE). Metals 2022, 12, 2063. [Google Scholar] [CrossRef]
- Billy, J.; Karel, V.; Kokarda, V.; Petrík, J.; Hoch, P. Štruktúrne zmeny v dvojfázových Ti zliatinách po spracovaní v β oblasti a ich vplyv na mechanické vlastnosti. Kov. Mater. 1987, 25, 247–258. [Google Scholar]
- Billy, J.; Lukáč, I.; Petrík, J.; Kokarda, V.; Hroch, P. Výskyt lokalizovaných sklzových pásov v Ti zliatinách pri neizotermickom kovaní za tepla. Kov. Mater./Met. Mater. 1988, 26, 188–199. [Google Scholar]
- Markulik, Š.; Nagyová, A.; Turisová, R.; Vilinský, T. Improving Quality in the Process of Hot Rolling of Steel Sheets. Appl. Sci. 2021, 11, 5451. [Google Scholar] [CrossRef]
- ČSN 42 4004; Hliník Tvářený 42 4004 pro Elektrotechniku Al 99.5 (Wrought Aluminum 42 4004 for Electrical Engineering Al 99.5). Uřad pro Normalisaci a Měření: Prague, Czech Republic, 1979.
- Available online: https://www.makeitfrom.com/material-properties/1350-E-Al99.5-EC-3.0257-1E-A91350-Aluminum (accessed on 4 March 2025).
- Gravimetric Map of the Slovak Republic. 2024. Available online: https://www.geology.sk/maps-and-data/mapovy-portal/geophysical-maps/gravimetric-map-of-the-slovak-republic/?lang=en (accessed on 18 April 2024).
- ISO 6507-2; Metallic Materials—Vickers Hardness Test Part 2—Verification and Calibration of Testing Machines. International Organization for Standardization ISO: Brussels, Belgium, 2018.
- Sargent, P.M. Indentation Size Effect and Strain-Hardening. J. Mater. Sci. Lett. 1989, 8, 1139–1140. [Google Scholar] [CrossRef]
- Liu, N.; Yang, X.; Yu, Z.; Zhao, L. Indentation Size Effect of Germanium Single Crystal with Different Crystal Orientations. Trans. Nonferrous Met. Soc. China 2020, 30, 181–190. [Google Scholar] [CrossRef]
- Li, H.; Bradt, R.C. The Microhardness Indentation Load/Size Effect in Rutile and Cassiterite Single Crystals. J. Mater. Sci. 1993, 28, 917–926. [Google Scholar] [CrossRef]
- Kim, H.; Kim, T. Measurement of Hardness on Traditional Ceramics. J. Eur. Ceram. Soc. 2002, 22, 1437–1445. [Google Scholar] [CrossRef]
- Petřkovská, L.; Fojtík, F.; Nováková, J. Residual stress measuring at conventional and high-speed milling. Trans. VŠB—Tech. Univ. Ostrav. 2010, LVI, 283–290. [Google Scholar]
- Rossini, N.S.; Dassisti, M.; Benyounis, K.Y.; Olabi, A.G. Methods of Measuring Residual Stresses in Components. Mater. Des. 2012, 35, 572–588. [Google Scholar] [CrossRef]
- Li, X.; Liu, J.; Wu, H.; Miao, K.; Wu, H.; Li, R.; Liu, C.; Fang, W.; Fan, G. Research Progress of Residual Stress Measurement Methods. Heliyon 2024, 10, e28348. [Google Scholar] [CrossRef]
- Kelley, K.; Maxwell, S.E. Sample Size for Multiple Regression: Obtaining Regression Coefficients That Are Accurate, Not Simply Significant. Psychol. Methods 2003, 8, 305–321. [Google Scholar] [CrossRef]
- Pandis, N. Multiple Linear Regression Analysis. Am. J. Orthod. Dentofac. Orthop. 2016, 149, 581. [Google Scholar] [CrossRef]
- Ashby, M.F. A First Report on Deformation-Mechanism Maps. Acta Metall. 1972, 20, 887–897. [Google Scholar] [CrossRef]
- Sargent, P.M.; Ashby, M.F. Deformation Maps for Titanium and Zirconium. Scr. Metall. 1982, 16, 1415–1422. [Google Scholar] [CrossRef]
- Frost, H.J.; Ashby, M.F. Deformation-Mechanism Maps: The Plasticity and Creep of Metals and Ceramics, 1st ed.; Pergamon Press: Oxford, UK, 1982; ISBN 978-0-08-029338-7. [Google Scholar]
- Fisher, D. A Compendium of Deformation-Mechanism Maps for Metals; Materials Research Foundations, 1st ed.; Materials Research Forum LLC: Millersville, PA, USA, 2022; Volume 116, ISBN 978-1-64490-169-4. [Google Scholar]
- Prasad, Y.V.R.K.; Rao, K.P.; Sasidhara, S. Hot Working Guide—A Compendium of Processing Maps; ASM International: Almere, The Netherlands, 2015. [Google Scholar]
- Mohamed, F.A.; Langdon, T.G. Deformation Mechanism Maps Based on Grain Size. Met. Trans. 1974, 5, 2339–2345. [Google Scholar] [CrossRef]
- Ji, H.; Peng, Z.; Pei, W.; Xin, L.; Ma, Z.; Lu, Y. Constitutive Equation and Hot Processing Map of TA15 Titanium Alloy. Mater. Res. Express 2020, 7, 046508. [Google Scholar] [CrossRef]
- Dado, M.; Hnilica, R.; Kotus, M.; Kotek, L. Use of virtual realityin machinery safety education. In Proceedings of the 10th International Conference of Education, Research and Innovation, Seville, Spain, 16–18 November 2017. [Google Scholar]
- ASQ. Design of Experiments (DoE) Tutorial. Retrieved from Design of Experiments. 2018. Available online: https://asqasktheexperts.com/2012/06/19/design-of-experiments-doe/ (accessed on 22 February 2023).
- McDonald, J.H. Handbook of Biological Statistics, 3rd ed.; Sparky House Publishing: Baltimore, MD, USA, 2014; Available online: http://www.biostathandbook.com/multipleregression.html (accessed on 7 May 2023).
- Sigma Zone. Quantum XL Software for Microsoft® Excel. 2023. Available online: http://www.sigmazone.com/QuantumXL.htm (accessed on 5 January 2023).
- Xia, L.; Liu, K.; Cao, Y.; Jiang, C. Ion-Irradiation Induced Hardening Behavior of Zirconium Alloys: A Combination of Experimental and Theoretical Study. Int. J. Refract. Met. Hard Mater. 2024, 118, 106432. [Google Scholar] [CrossRef]
- Lai, L.; Brandenburg, J.-E.; Chekhonin, P.; Duplessi, A.; Cuvilly, F.; Etienne, A.; Radiguet, B.; Rafaja, D.; Bergner, F. Microstructure-Informed Prediction of Hardening in Ion-Irradiated Reactor Pressure Vessel Steels. Metals 2024, 14, 257. [Google Scholar] [CrossRef]
- Zhang, Y.; Wang, J.; Ma, B.; Zhan, Q.; Luo, L.; Wu, Y. A Model to Evaluate the Radiation-Hardening in Shallow Ion-Irradiated Metallic Materials. Nucl. Instrum. Methods Phys. Res. Sect. B Beam Interact. Mater. At. 2024, 548, 165250. [Google Scholar] [CrossRef]
- Xi, L.; Zhang, Y.; Geng, X.; Gu, D.; Shi, K.; Ramasamy, P.; Prashanth, K.G.; Eckert, J. Irradiation-Induced Atomic Migration and Its Effect on the Surface and Mechanical Properties of Laser Additive Manufactured MWCNTs/Al–Mg–Sc–Zr Composites. J. Mater. Res. Technol. 2025, 35, 4043–4054. [Google Scholar] [CrossRef]
- Luo, Q.; Kitchen, M. Microhardness, Indentation Size Effect and Real Hardness of Plastically Deformed Austenitic Hadfield Steel. Materials 2023, 16, 1117. [Google Scholar] [CrossRef]
- Ma, X.; Li, F.; Sun, Z.; Hou, J.; Li, J.; Fang, X. Strain Rate Dependence of the Indentation Size Effect in Ti–10V–2Fe–3Al Alloy. Mater. Sci. Technol. 2019, 35, 1107–1113. [Google Scholar] [CrossRef]
- Shrestha, P.; Smedskjaer, M.M.; Bauchy, M.; Hoover, C.G. Impact of Strain Rate on the Indentation Size Effect: Evidence of an Intimate Link between Size Effect, Strain Rate and Ductility in Soda-Lime Silica Glass. J. Non-Cryst. Solids 2024, 637, 123031. [Google Scholar] [CrossRef]
- Asumadu, T.K.; Mensah-Darkwa, K.; Gikunoo, E.; Klenam, D.E.P.; Vandadi, M.; Rahbar, N.; Kwofie, S.; Soboyejo, W.O. Strain Gradient Plasticity Phenomenon in Surface Treated Plain Carbon Steel. Mater. Sci. Eng. A 2023, 871, 144806. [Google Scholar] [CrossRef]
- Petruš, O.; Sedlák, R.; Csanádi, T.; Naughton-Duszová, A.; Vojtko, M.; Hvizdoš, P.; Dusza, J. Indentation Size Effect in the Hardness Measurements of High Entropy Carbides. Ceram. Int. 2023, 49, 24207–24215. [Google Scholar] [CrossRef]
- Aranda, V.A.; Klyatskina, E.; Barba-Pingarrón, A.; Figueroa, I.A.; Amigó, V.; Gonzalez, G. Nanoindentation and Orientation Imaging Analysis of High Entropy Ti–Nb–Zr–Ta–Mo Alloys Exhibiting Dendrite Microstructure. J. Mater. Res. Technol. 2025, 35, 1732–1740. [Google Scholar] [CrossRef]
- Chinh, N.Q.; Olasz, D.; Sáfrán, G.; Langdon, T.G. Indentation Size Effects and Its Relevance to Ultrafine-Grained Materials. Mater. Sci. Eng. A 2025, 923, 147733. [Google Scholar] [CrossRef]


| Tester | ε (%) | (s−1) | ln () | T (°C) | Calibration | Microhardness | ||||||||
|---|---|---|---|---|---|---|---|---|---|---|---|---|---|---|
| rrel (%) | Erel (%) | Urel (%) | HV | HV0.01 | HV0.025 | HV0.05 | HV0.1 | HPSRA1 | ||||||
| 1 | DWT | 68.57 | 568.555 | 6.343 | 23.9 | 2.49 | −1.14 | 6.05 | 51 | 51 | 55 | 50 | 50 | 49 |
| 2 | DWT | 62.64 | 479.265 | 6.172 | 23.9 | 2.49 | −1.14 | 6.05 | 49 | 48 | 52 | 48 | 47 | 47 |
| 3 | DWT | 65.28 | 521.244 | 6.256 | 23.9 | 2.49 | −1.14 | 6.05 | 51 | 51 | 53 | 50 | 49 | 49 |
| 4 | DWT | 29.73 | 133.093 | 4.891 | 22.7 | 3.07 | −1.82 | 6.98 | 40 | 38 | 41 | 40 | 41 | 41 |
| 5 | DWT | 67.41 | 600.643 | 6.398 | 20.3 | 2.19 | −2.35 | 7.20 | 52 | 54 | 51 | 50 | 54 | 54 |
| 6 | DWT | 80.50 | 1506.624 | 7.318 | 20.3 | 2.19 | −2.35 | 7.20 | 50 | 51 | 49 | 49 | 50 | 50 |
| 7 | DWT | 84.62 | 2506.770 | 7.827 | 22.7 | 3.21 | −1.99 | 7.14 | 53 | 56 | 52 | 51 | 52 | 52 |
| 8 | HLR | 69.55 | 0.051 | −2.981 | 28.0 | 3.1 | 3.71 | 8.46 | 43 | 31 | 44 | 49 | 48 | 50 |
| 9 | HLR | 50.55 | 0.030 | −3.504 | 28.0 | 3.1 | 3.71 | 8.46 | 40 | 29 | 44 | 43 | 44 | 46 |
| 10 | HLR | 58.43 | 0.036 | −3.323 | 28.0 | 3.1 | 3.71 | 8.46 | 44 | 32 | 44 | 50 | 49 | 51 |
| 11 | HLR | 16.61 | 0.028 | −3.560 | 28.0 | 3.1 | 3.71 | 8.46 | 38 | 33 | 37 | 35 | 45 | 46 |
| 12 | WPM | 63.39 | 0.130 | −2.043 | 28.0 | 3.07 | −1.82 | 6.98 | 35 | 36 | 43 | 47 | 48 | 50 |
| 13 | WPM | 69.87 | 0.120 | −2.119 | 28.0 | 3.1 | 3.71 | 8.46 | 41 | 30 | 42 | 45 | 45 | 47 |
| 14 | WPM | 43.53 | 0.080 | −2.522 | 28.0 | 3.1 | 3.71 | 8.46 | 38 | 31 | 37 | 42 | 42 | 44 |
| 15 | WPM | 9.15 | 0.025 | −3.682 | 28.4 | 3.1 | 3.71 | 8.46 | 28 | 25 | 28 | 28 | 29 | 30 |
| 16 | WPM | 10.64 | 0.029 | −3.551 | 28.4 | 3.1 | 3.71 | 8.46 | 29 | 27 | 31 | 30 | 30 | 30 |
| 17 | WPM | 20.48 | 0.059 | −2.838 | 28.4 | 3.1 | 3.71 | 8.46 | 32 | 28 | 34 | 35 | 32 | 32 |
| 18 | WPM | 31.02 | 0.054 | −2.916 | 28.4 | 3.1 | 3.71 | 8.46 | 36 | 32 | 37 | 39 | 37 | 37 |
| 19 | WPM | 54.33 | 0.125 | −2.078 | 26.6 | 3.47 | 4.63 | 9.67 | 38 | 29 | 41 | 41 | 41 | 43 |
| 20 | WPM | 54.01 | 0.095 | −2.357 | 28.4 | 3.1 | 3.71 | 8.46 | 43 | 34 | 46 | 47 | 45 | 46 |
| 21 | WPM | 50.40 | 0.114 | −2.170 | 28.1 | 3.47 | 4.63 | 9.67 | 40 | 31 | 41 | 44 | 44 | 46 |
| 22 | WPM | 63.08 | 0.112 | −2.192 | 28.1 | 3.47 | 4.63 | 9.67 | 42 | 34 | 42 | 45 | 46 | 48 |
| 23 | WPM | 45.15 | 0.091 | −2.392 | 29.9 | 3.47 | 4.63 | 9.67 | 36 | 29 | 37 | 38 | 38 | 39 |
| 24 | ZWICK | 5.80 | 0.029 | −3.536 | 19.0 | 7.34 | 4.91 | 9.28 | 30 | 30 | 32 | 30 | 29 | 29 |
| 25 | ZWICK | 16.20 | 0.038 | −3.269 | 19.0 | 7.34 | 4.91 | 9.28 | 34 | 32 | 35 | 33 | 35 | 35 |
| 26 | ZWICK | 27.20 | 0.064 | −2.748 | 19.5 | 2.16 | 0.85 | 5.62 | 37 | 35 | 37 | 39 | 39 | 39 |
| 27 | ZWICK | 56.10 | 0.056 | −2.880 | 19.5 | 2.16 | 0.85 | 5.62 | 44 | 38 | 45 | 45 | 46 | 47 |
| 28 | ZWICK | 65.40 | 0.070 | −2.659 | 19.0 | 7.34 | 4.91 | 9.28 | 43 | 37 | 44 | 48 | 45 | 46 |
| 29 | ZWICK | 73.10 | 0.049 | −3.012 | 20.0 | 2.16 | 0.85 | 5.62 | 43 | 38 | 43 | 46 | 47 | 48 |
| 30 | ZWICK | 75.10 | 0.094 | −2.366 | 19.0 | 2.16 | 0.85 | 5.62 | 44 | 37 | 45 | 48 | 46 | 47 |
| 31 | ZWICK | 76.50 | 0.092 | −2.383 | 19.5 | 2.16 | 0.85 | 5.62 | 45 | 38 | 47 | 49 | 48 | 49 |
| Tester | n | Amoc | Aln | c0 (N) | c1 (N mm−1) | c2 (N mm−2) | W (N) | W (gf) | A1 (N mm−2) | c1/c2 (mm) | |
|---|---|---|---|---|---|---|---|---|---|---|---|
| 1 | DROP WEIGHT | 1.9620 | 238.50 | 5.474 | −0.004 | 0.887 | 249.3 | 0.010 | 1.10 | 260.1 | 0.0036 |
| 2 | DROP WEIGHT | 1.9690 | 232.40 | 5.448 | −0.016 | 1.560 | 229.3 | 0.011 | 1.15 | 247.7 | 0.0068 |
| 3 | DROP WEIGHT | 1.9700 | 243.50 | 5.495 | −0.032 | 2.563 | 227.5 | 0.012 | 1.28 | 258.3 | 0.0113 |
| 4 | DROP WEIGHT | 2.0405 | 239.94 | 5.480 | 0.016 | −1.124 | 228.19 | −0.007 | −0.69 | 216.01 | −0.0049 |
| 5 | DROP WEIGHT | 1.9840 | 260.90 | 5.564 | 0.089 | −5.969 | 358.3 | −0.012 | −1.24 | 283.3 | −0.0167 |
| 6 | DROP WEIGHT | 1.9750 | 241.70 | 5.487 | 0.040 | −2.477 | 293.8 | −0.003 | −0.36 | 263.8 | −0.0084 |
| 7 | DROP WEIGHT | 1.9380 | 226.10 | 5.421 | 0.048 | −2.757 | 308.1 | 0.001 | 0.10 | 273.8 | −0.0089 |
| 8 | HLR | 2.4338 | 920.90 | 6.825 | −0.240 | 10.044 | 153.33 | −0.040 | −4.09 | 265.9 | 0.0655 |
| 9 | HLR | 2.3723 | 687.10 | 6.533 | −0.165 | 6.367 | 171.96 | −0.034 | −3.50 | 240.71 | 0.0370 |
| 10 | HLR | 2.4258 | 916.33 | 6.820 | −0.215 | 8.808 | 171.35 | −0.042 | −4.23 | 271.15 | 0.0514 |
| 11 | HLR | 2.2463 | 433.45 | 6.072 | 0.345 | −21.154 | 482.24 | −0.070 | −7.15 | 244.79 | −0.0439 |
| 12 | WPM | 2.2959 | 602.07 | 6.400 | −0.072 | 1.875 | 242.14 | −0.036 | −3.64 | 263.56 | 0.0077 |
| 13 | WPM | 2.4022 | 777.32 | 6.656 | −0.180 | 6.867 | 175.36 | −0.040 | −4.10 | 250.5 | 0.0392 |
| 14 | WPM | 2.3110 | 541.87 | 6.295 | −0.084 | 2.192 | 209.34 | −0.039 | −3.95 | 232.77 | 0.0105 |
| 15 | WPM | 2.1295 | 215.88 | 5.375 | 0.008 | −1.114 | 166.79 | −0.019 | −1.94 | 156.67 | −0.0067 |
| 16 | WPM | 2.0790 | 198.56 | 5.291 | −0.018 | 0.543 | 155.09 | −0.005 | −0.51 | 160.13 | 0.0035 |
| 17 | WPM | 2.1255 | 251.25 | 5.526 | −0.157 | 7.161 | 103.23 | 0.006 | 0.61 | 171.31 | 0.0694 |
| 18 | WPM | 2.1300 | 289.81 | 5.669 | −0.110 | 5.024 | 146.79 | −0.003 | −0.29 | 198.03 | 0.0342 |
| 19 | WPM | 2.3136 | 542.50 | 6.296 | −0.121 | 4.398 | 179.78 | −0.030 | −3.00 | 226.3 | 0.0245 |
| 20 | WPM | 2.2482 | 508.77 | 6.232 | −0.179 | 8.441 | 150.68 | −0.012 | −1.26 | 244.49 | 0.0560 |
| 21 | WPM | 2.3364 | 622.82 | 6.434 | −0.122 | 4.287 | 196.6 | −0.035 | −3.60 | 243.38 | 0.0218 |
| 22 | WPM | 2.2964 | 579.71 | 6.363 | −0.070 | 1.737 | 235.29 | −0.036 | −3.66 | 254.81 | 0.0074 |
| 23 | WPM | 2.2340 | 392.56 | 5.973 | −0.126 | 5.061 | 152.38 | −0.017 | −1.73 | 203.85 | 0.0332 |
| 24 | ZWICK | 1.9840 | 151.50 | 5.020 | −0.054 | 2.938 | 125.6 | 0.013 | 1.39 | 152.7 | 0.0234 |
| 25 | ZWICK | 2.0710 | 221.60 | 5.401 | 0.060 | −3.547 | 222.1 | −0.015 | −1.56 | 186.5 | −0.0160 |
| 26 | ZWICK | 2.1050 | 275.40 | 5.618 | −0.019 | 0.261 | 205.5 | −0.013 | −1.30 | 208.3 | 0.0013 |
| 27 | ZWICK | 2.1490 | 374.30 | 5.925 | −0.023 | 0.392 | 241.6 | −0.016 | −1.64 | 246.1 | 0.0016 |
| 28 | ZWICK | 2.2000 | 440.10 | 6.087 | −0.146 | 7.004 | 164.8 | −0.009 | −0.98 | 242.9 | 0.0425 |
| 29 | ZWICK | 2.1920 | 427.70 | 6.058 | −0.025 | −0.042 | 253 | −0.026 | 2.65 | 252.5 | −0.0002 |
| 30 | ZWICK | 2.2096 | 461.34 | 6.134 | −0.121 | 5.518 | 188.1 | −0.015 | −1.47 | 250.52 | 0.0293 |
| 31 | ZWICK | 2.2200 | 491.60 | 6.197 | −0.110 | 4.924 | 202.2 | −0.016 | −1.73 | 258.7 | 0.0244 |
| Zwick | WPM | DWT | |
|---|---|---|---|
| HLR | 0.6387 | 0.2954 | 0.2511 |
| DWT | 0.0742 | 0.0093 | |
| WPM | 0.5256 |
| Zwick | WPM | DWT | |
|---|---|---|---|
| HLR | 0.0013 | 0.0429 | 0.0001 |
| DWT | 0.0001 | 0.0001 | |
| WPM | 0.0332 |
Disclaimer/Publisher’s Note: The statements, opinions and data contained in all publications are solely those of the individual author(s) and contributor(s) and not of MDPI and/or the editor(s). MDPI and/or the editor(s) disclaim responsibility for any injury to people or property resulting from any ideas, methods, instructions or products referred to in the content. |
© 2025 by the authors. Licensee MDPI, Basel, Switzerland. This article is an open access article distributed under the terms and conditions of the Creative Commons Attribution (CC BY) license (https://creativecommons.org/licenses/by/4.0/).
Share and Cite
Blaško, P.; Petrík, J.; Šolc, M.; Mihaliková, M.; Girmanová, L.; Pribulová, A.; Futáš, P.; Furman, J.; Marzena, K.-C. The Effect of Aluminum Deformation Conditions on Microhardness and Indentation Size Effect Characteristics. Crystals 2025, 15, 252. https://doi.org/10.3390/cryst15030252
Blaško P, Petrík J, Šolc M, Mihaliková M, Girmanová L, Pribulová A, Futáš P, Furman J, Marzena K-C. The Effect of Aluminum Deformation Conditions on Microhardness and Indentation Size Effect Characteristics. Crystals. 2025; 15(3):252. https://doi.org/10.3390/cryst15030252
Chicago/Turabian StyleBlaško, Peter, Jozef Petrík, Marek Šolc, Mária Mihaliková, Lenka Girmanová, Alena Pribulová, Peter Futáš, Joanna Furman, and Kuczyńska-Chałada Marzena. 2025. "The Effect of Aluminum Deformation Conditions on Microhardness and Indentation Size Effect Characteristics" Crystals 15, no. 3: 252. https://doi.org/10.3390/cryst15030252
APA StyleBlaško, P., Petrík, J., Šolc, M., Mihaliková, M., Girmanová, L., Pribulová, A., Futáš, P., Furman, J., & Marzena, K.-C. (2025). The Effect of Aluminum Deformation Conditions on Microhardness and Indentation Size Effect Characteristics. Crystals, 15(3), 252. https://doi.org/10.3390/cryst15030252