
Effect of Heat Treatment on Microstructures and Mechanical Properties of a Ti-Al-V-Cr-Fe-Based Alloy


Abstract
1. Introduction
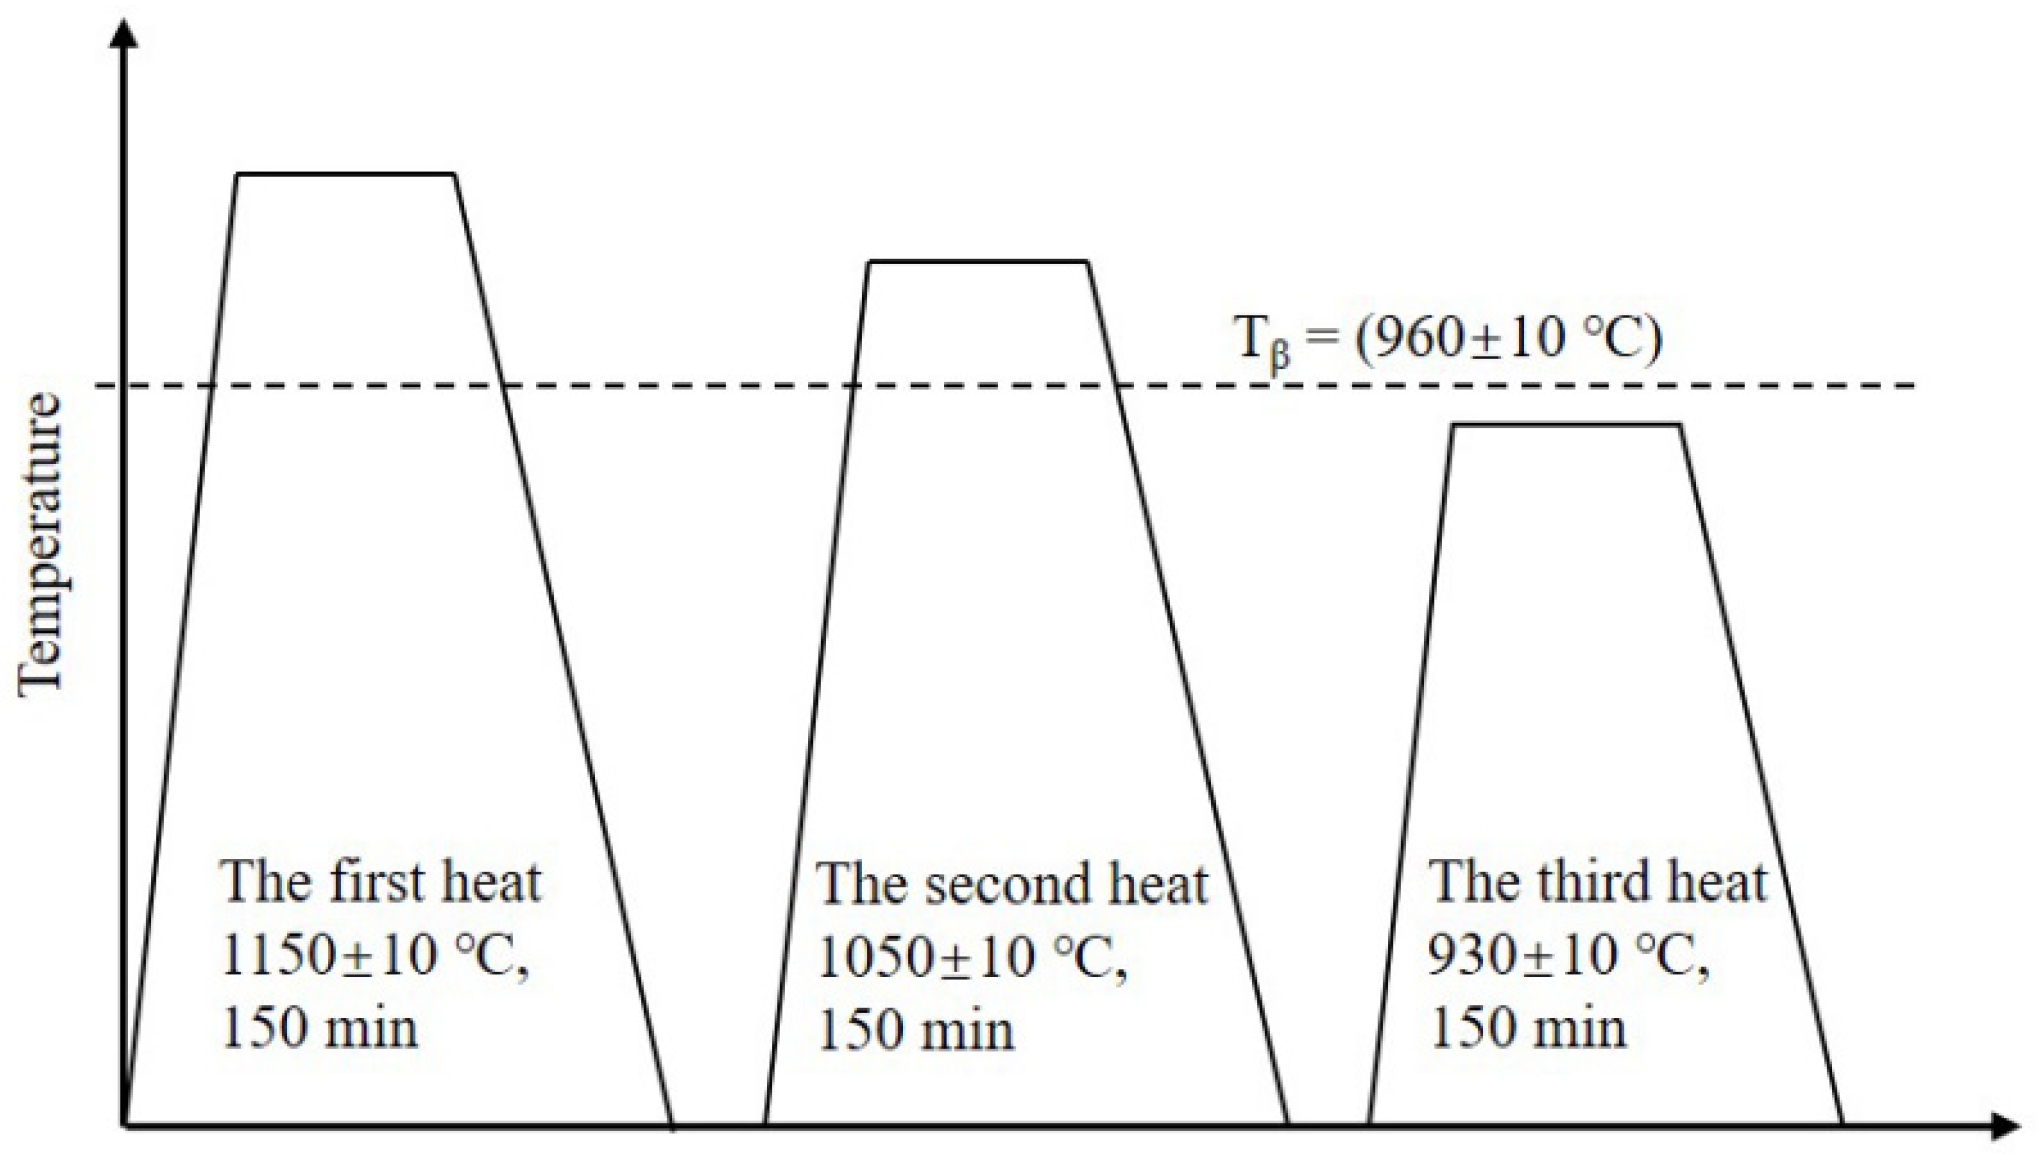
2. Experiment
3. Results and Discussion
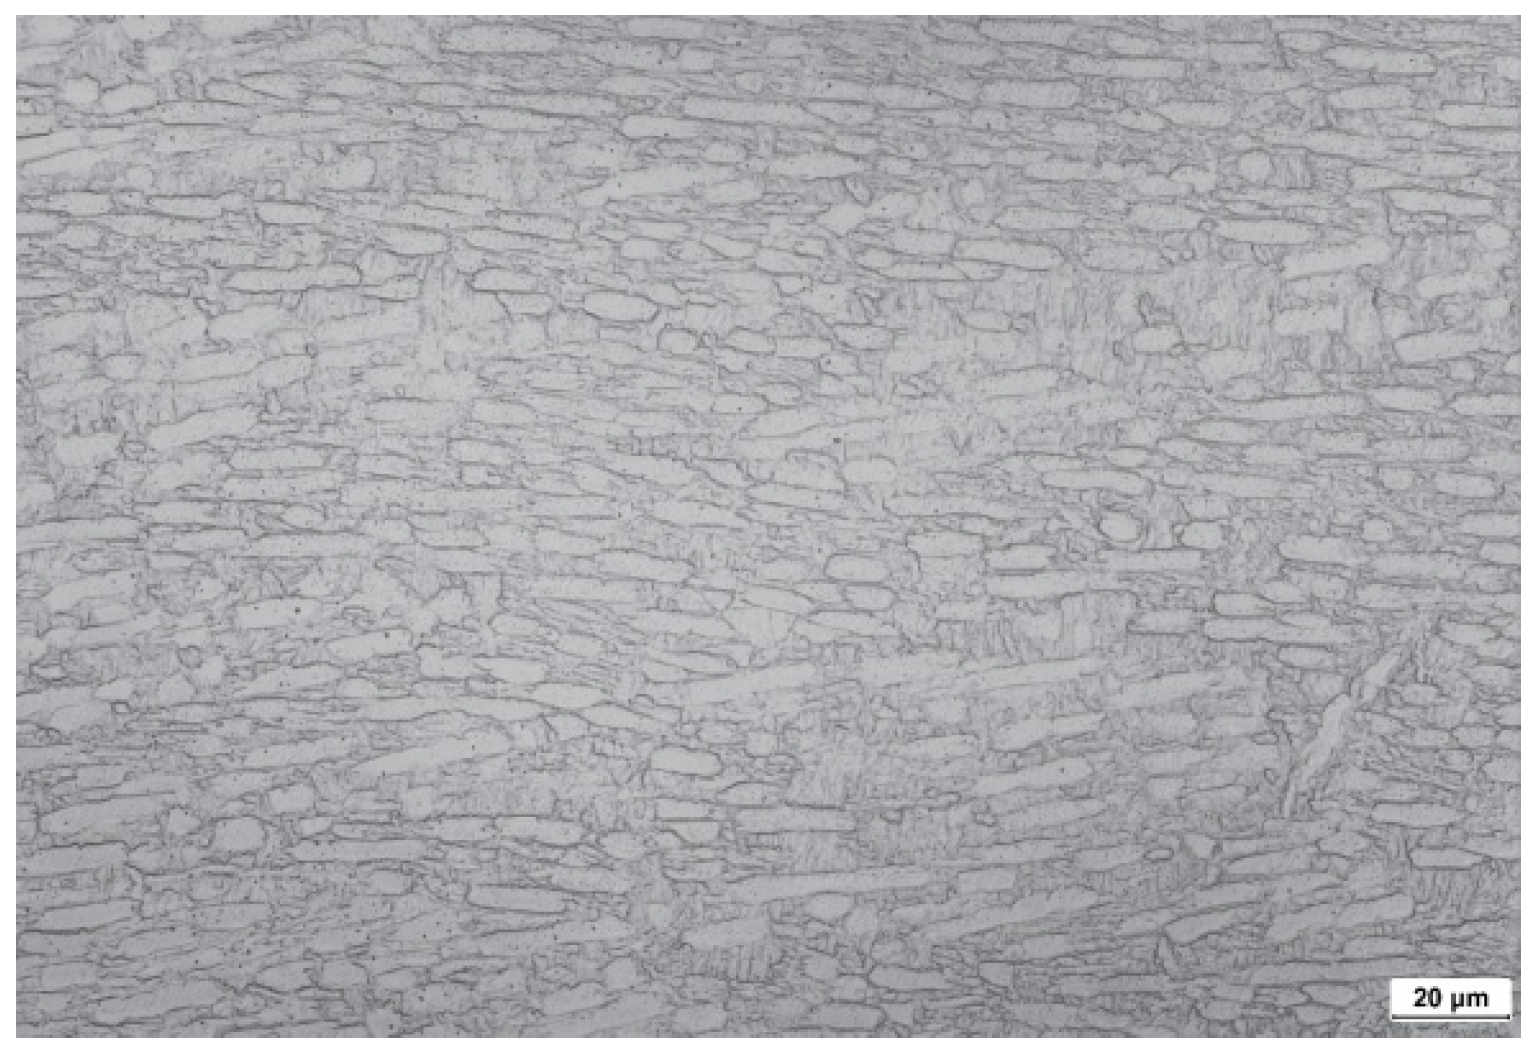
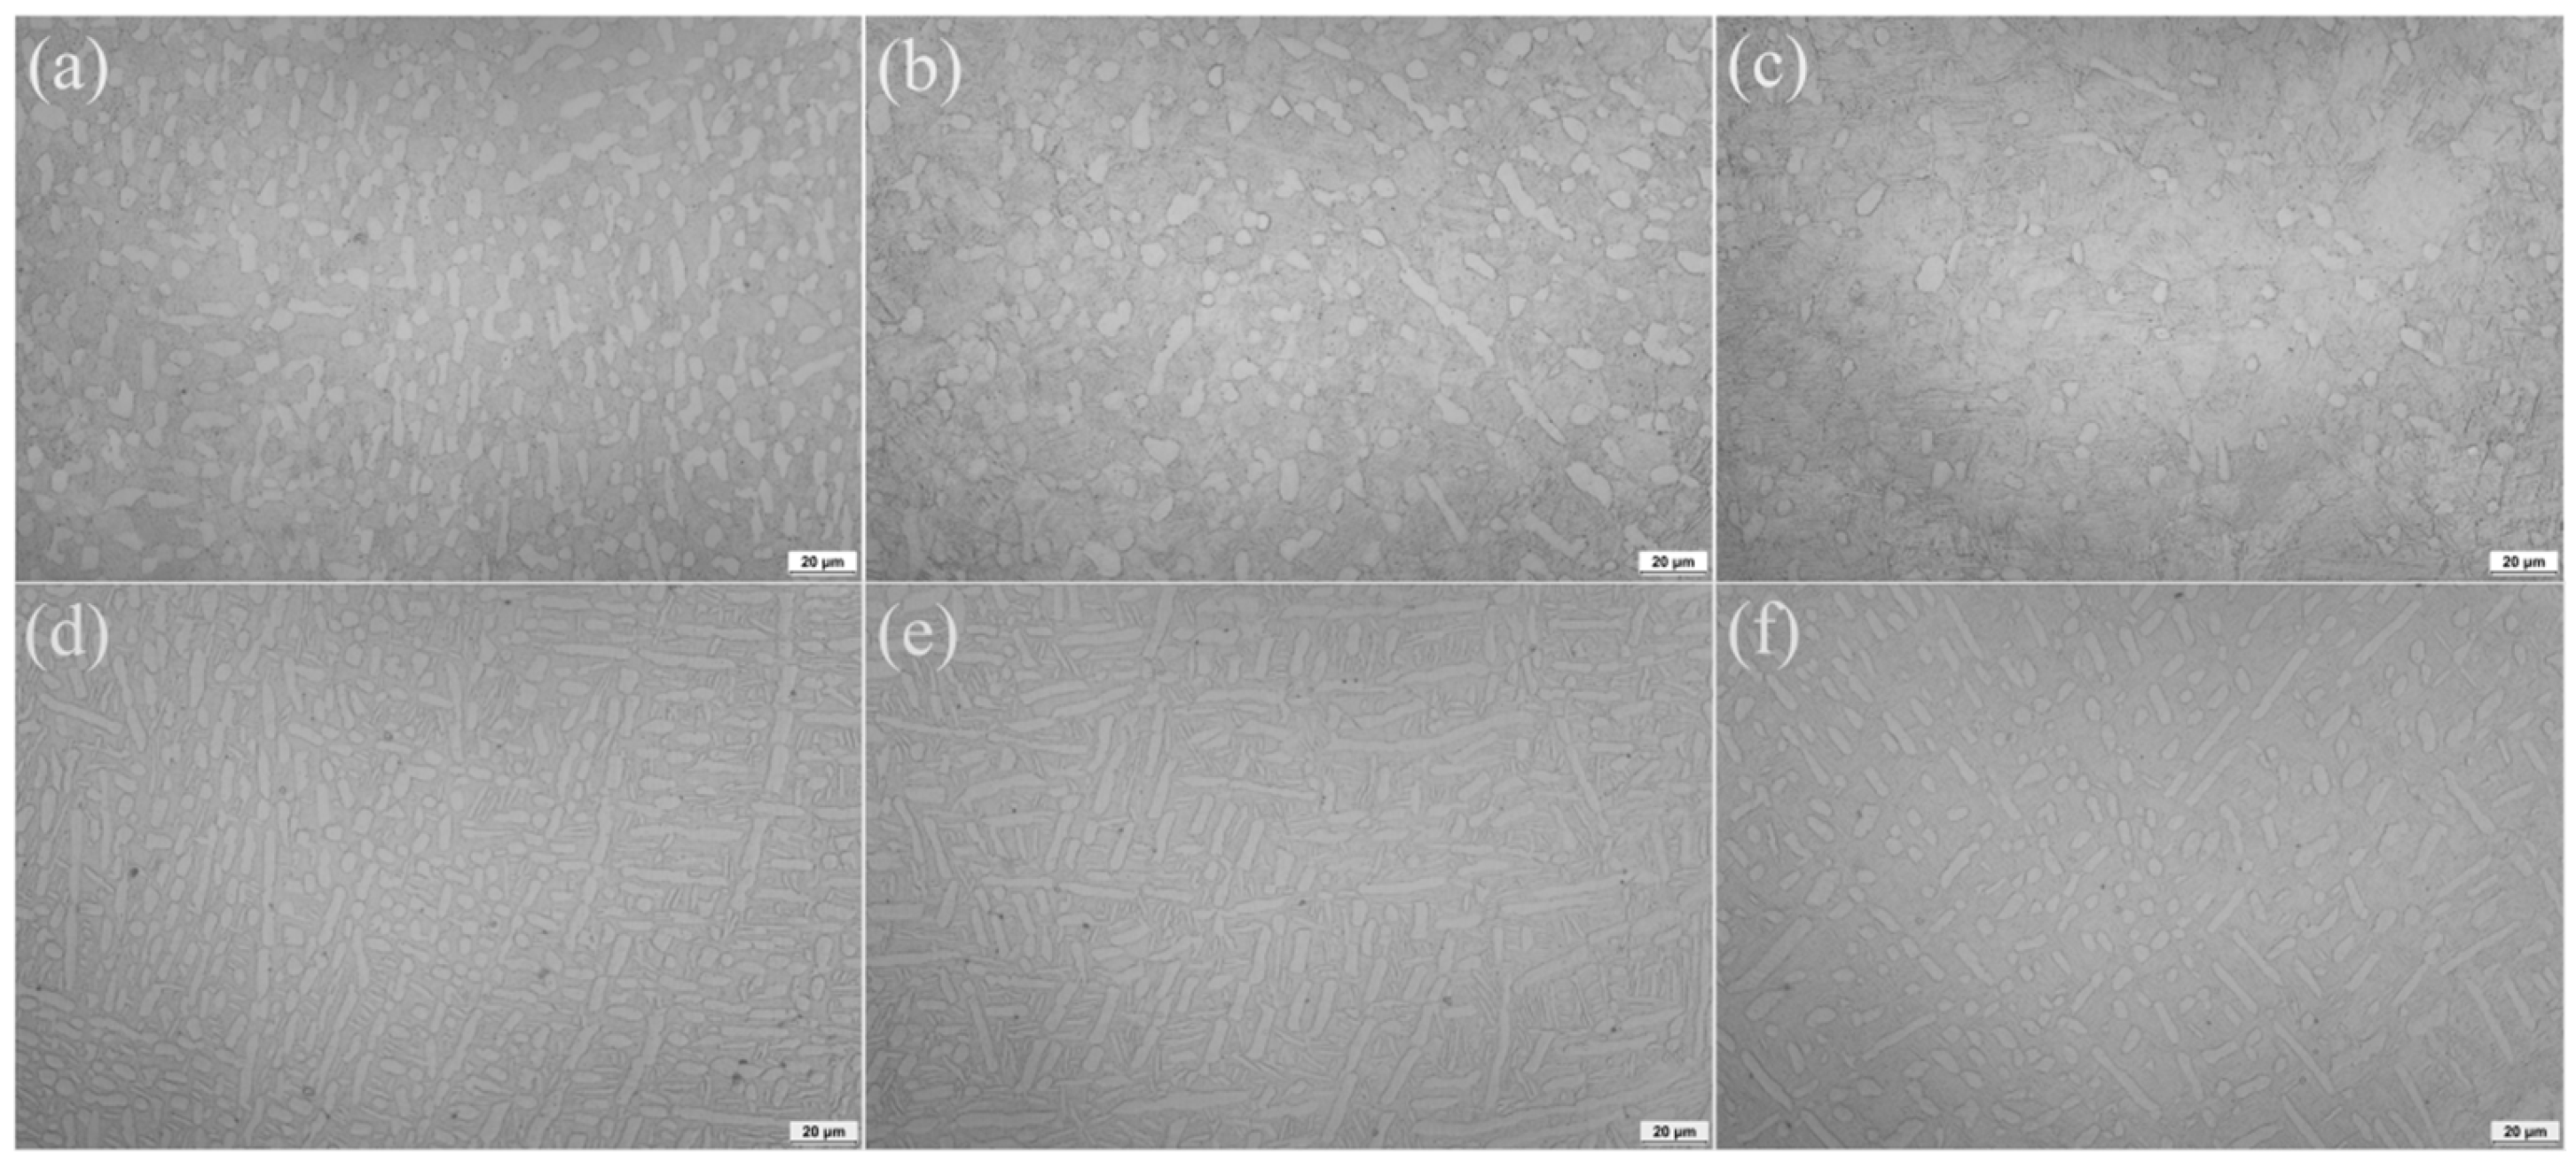
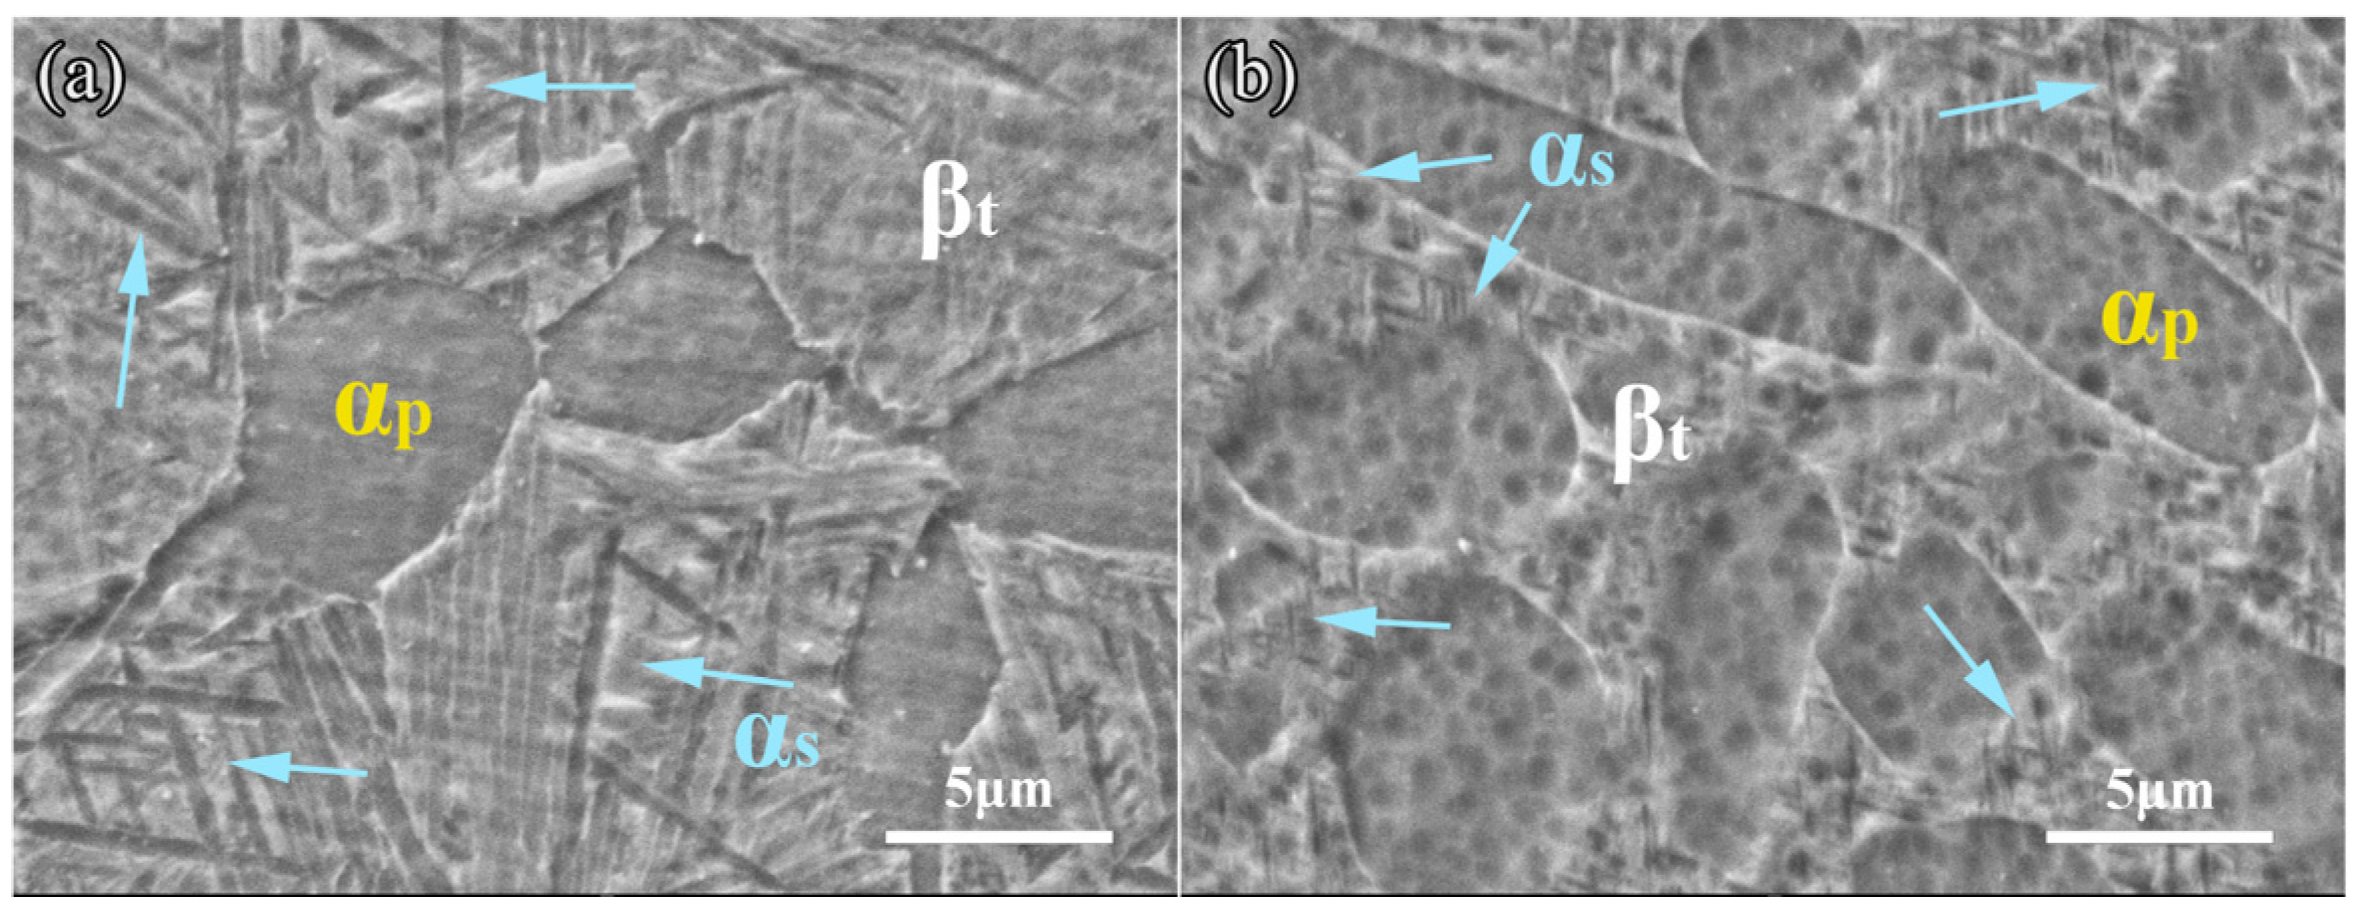
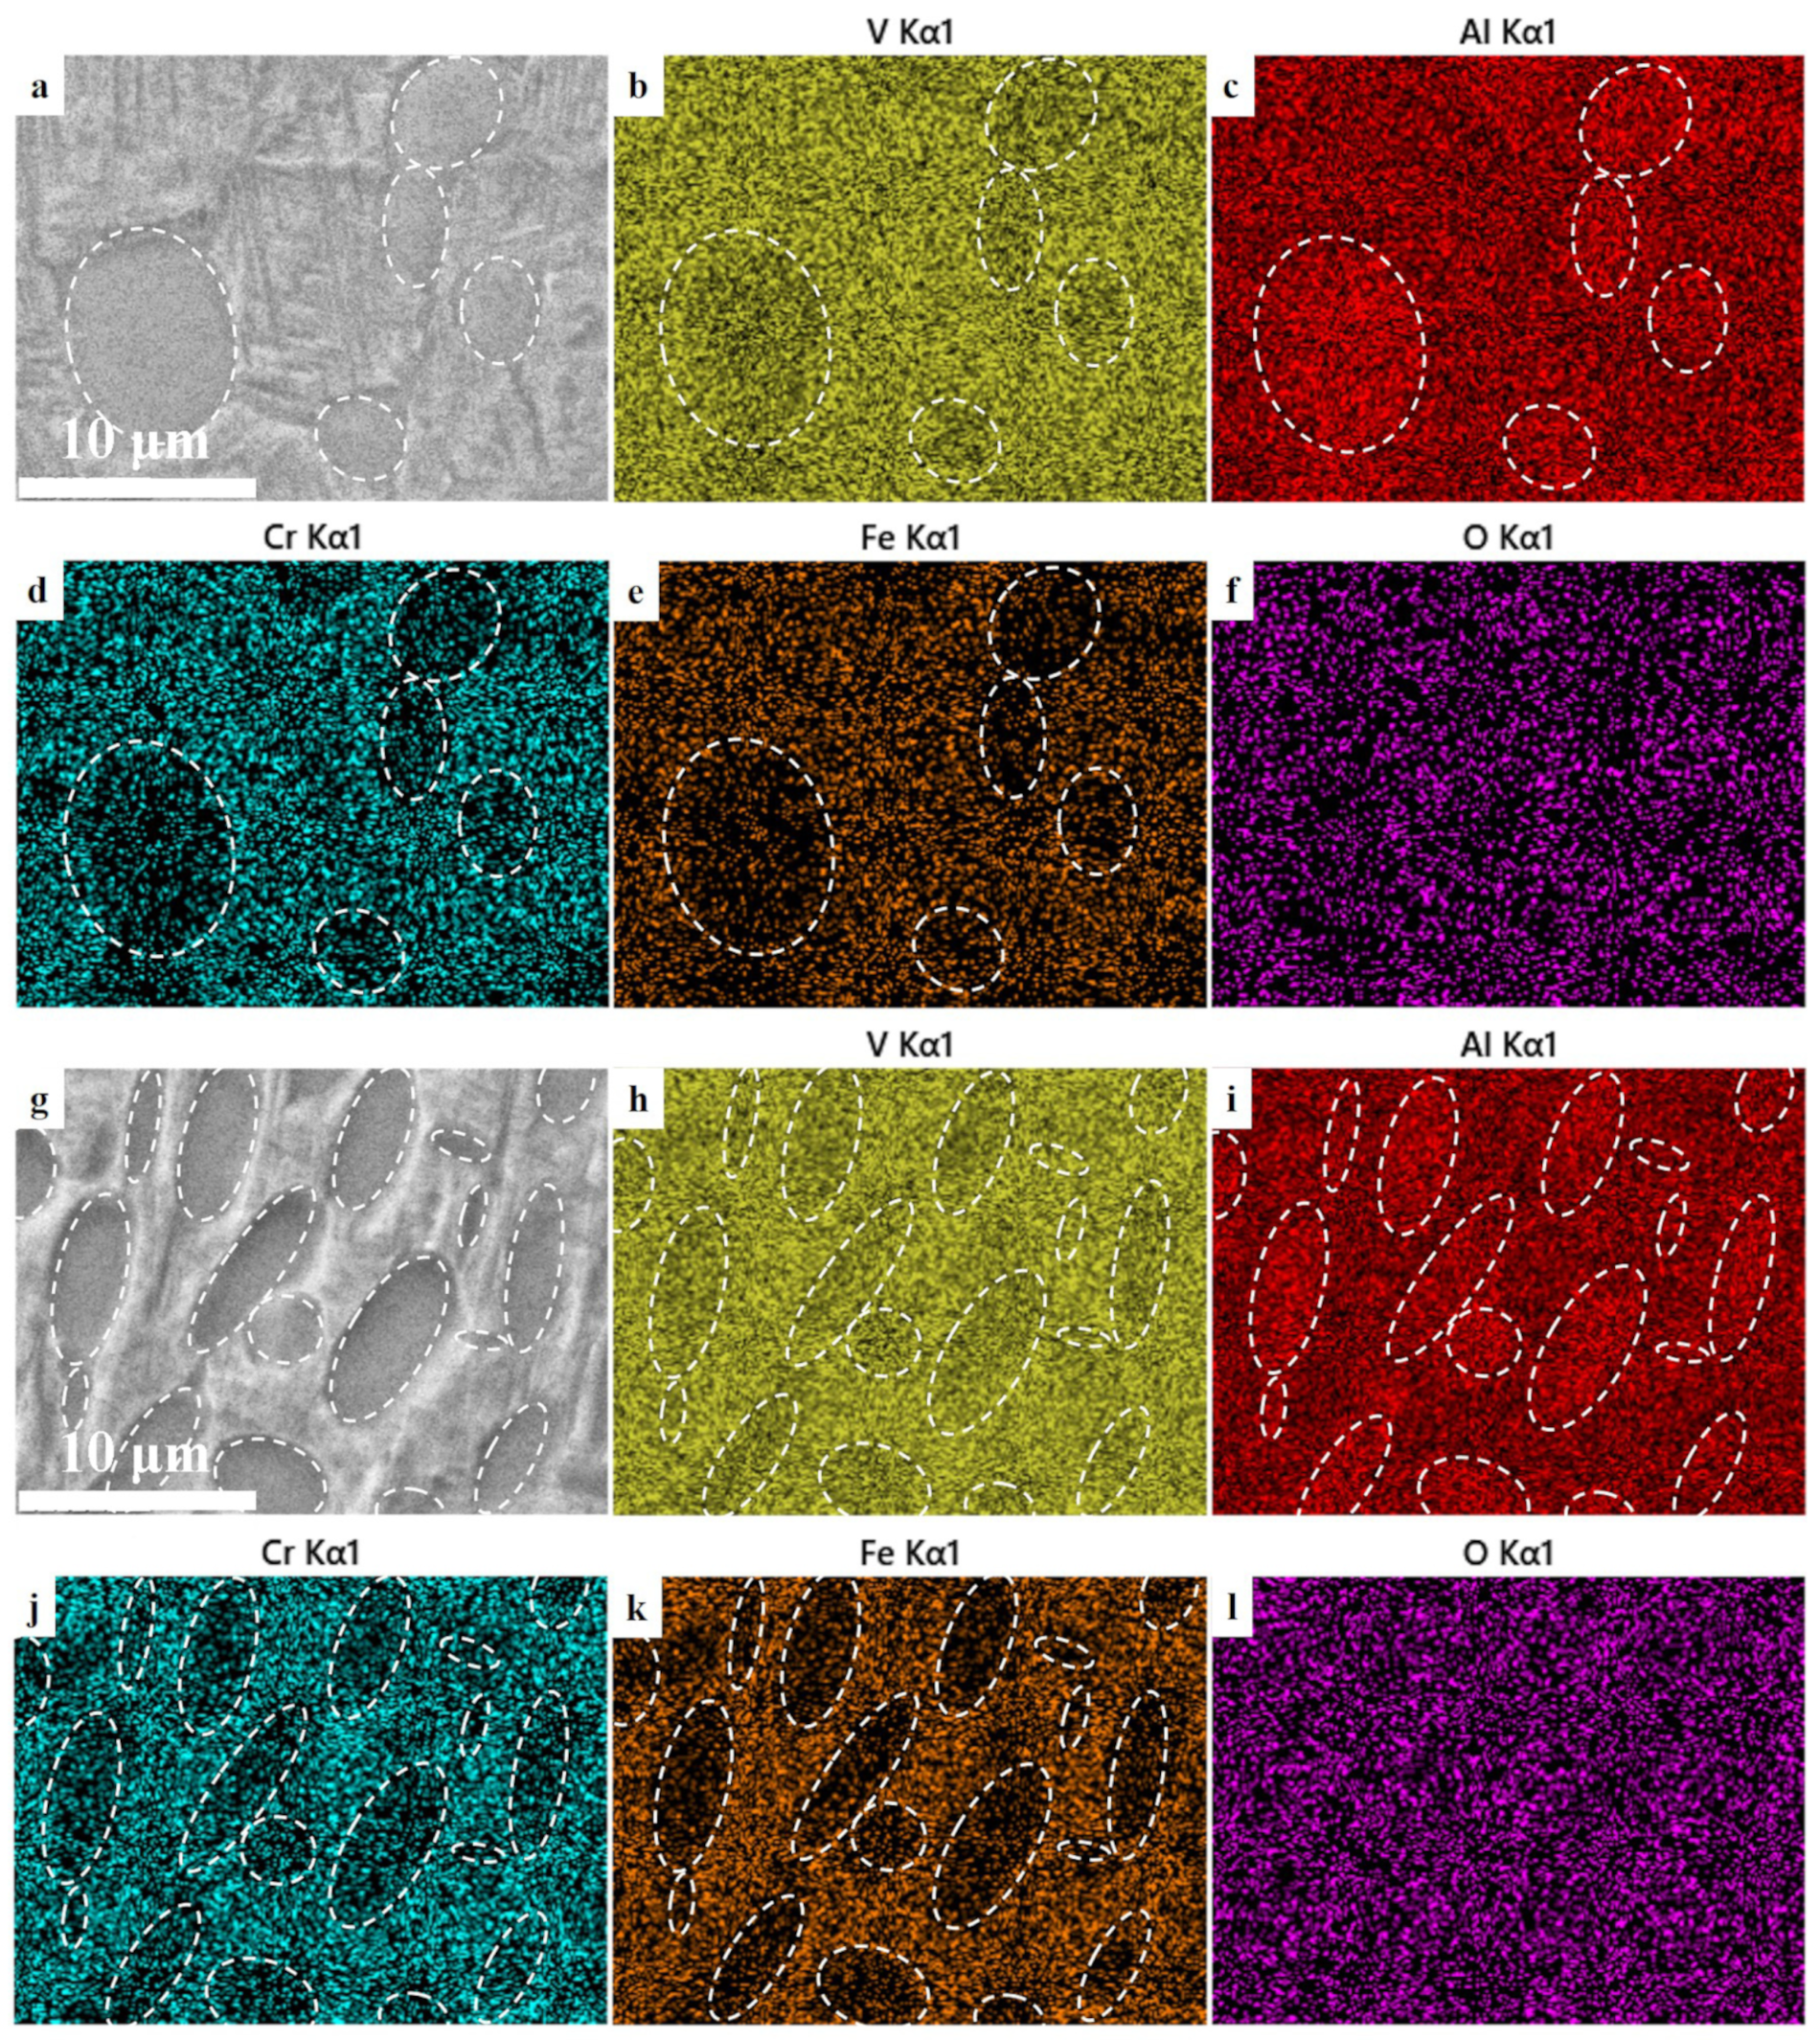
3.1. Microstructures
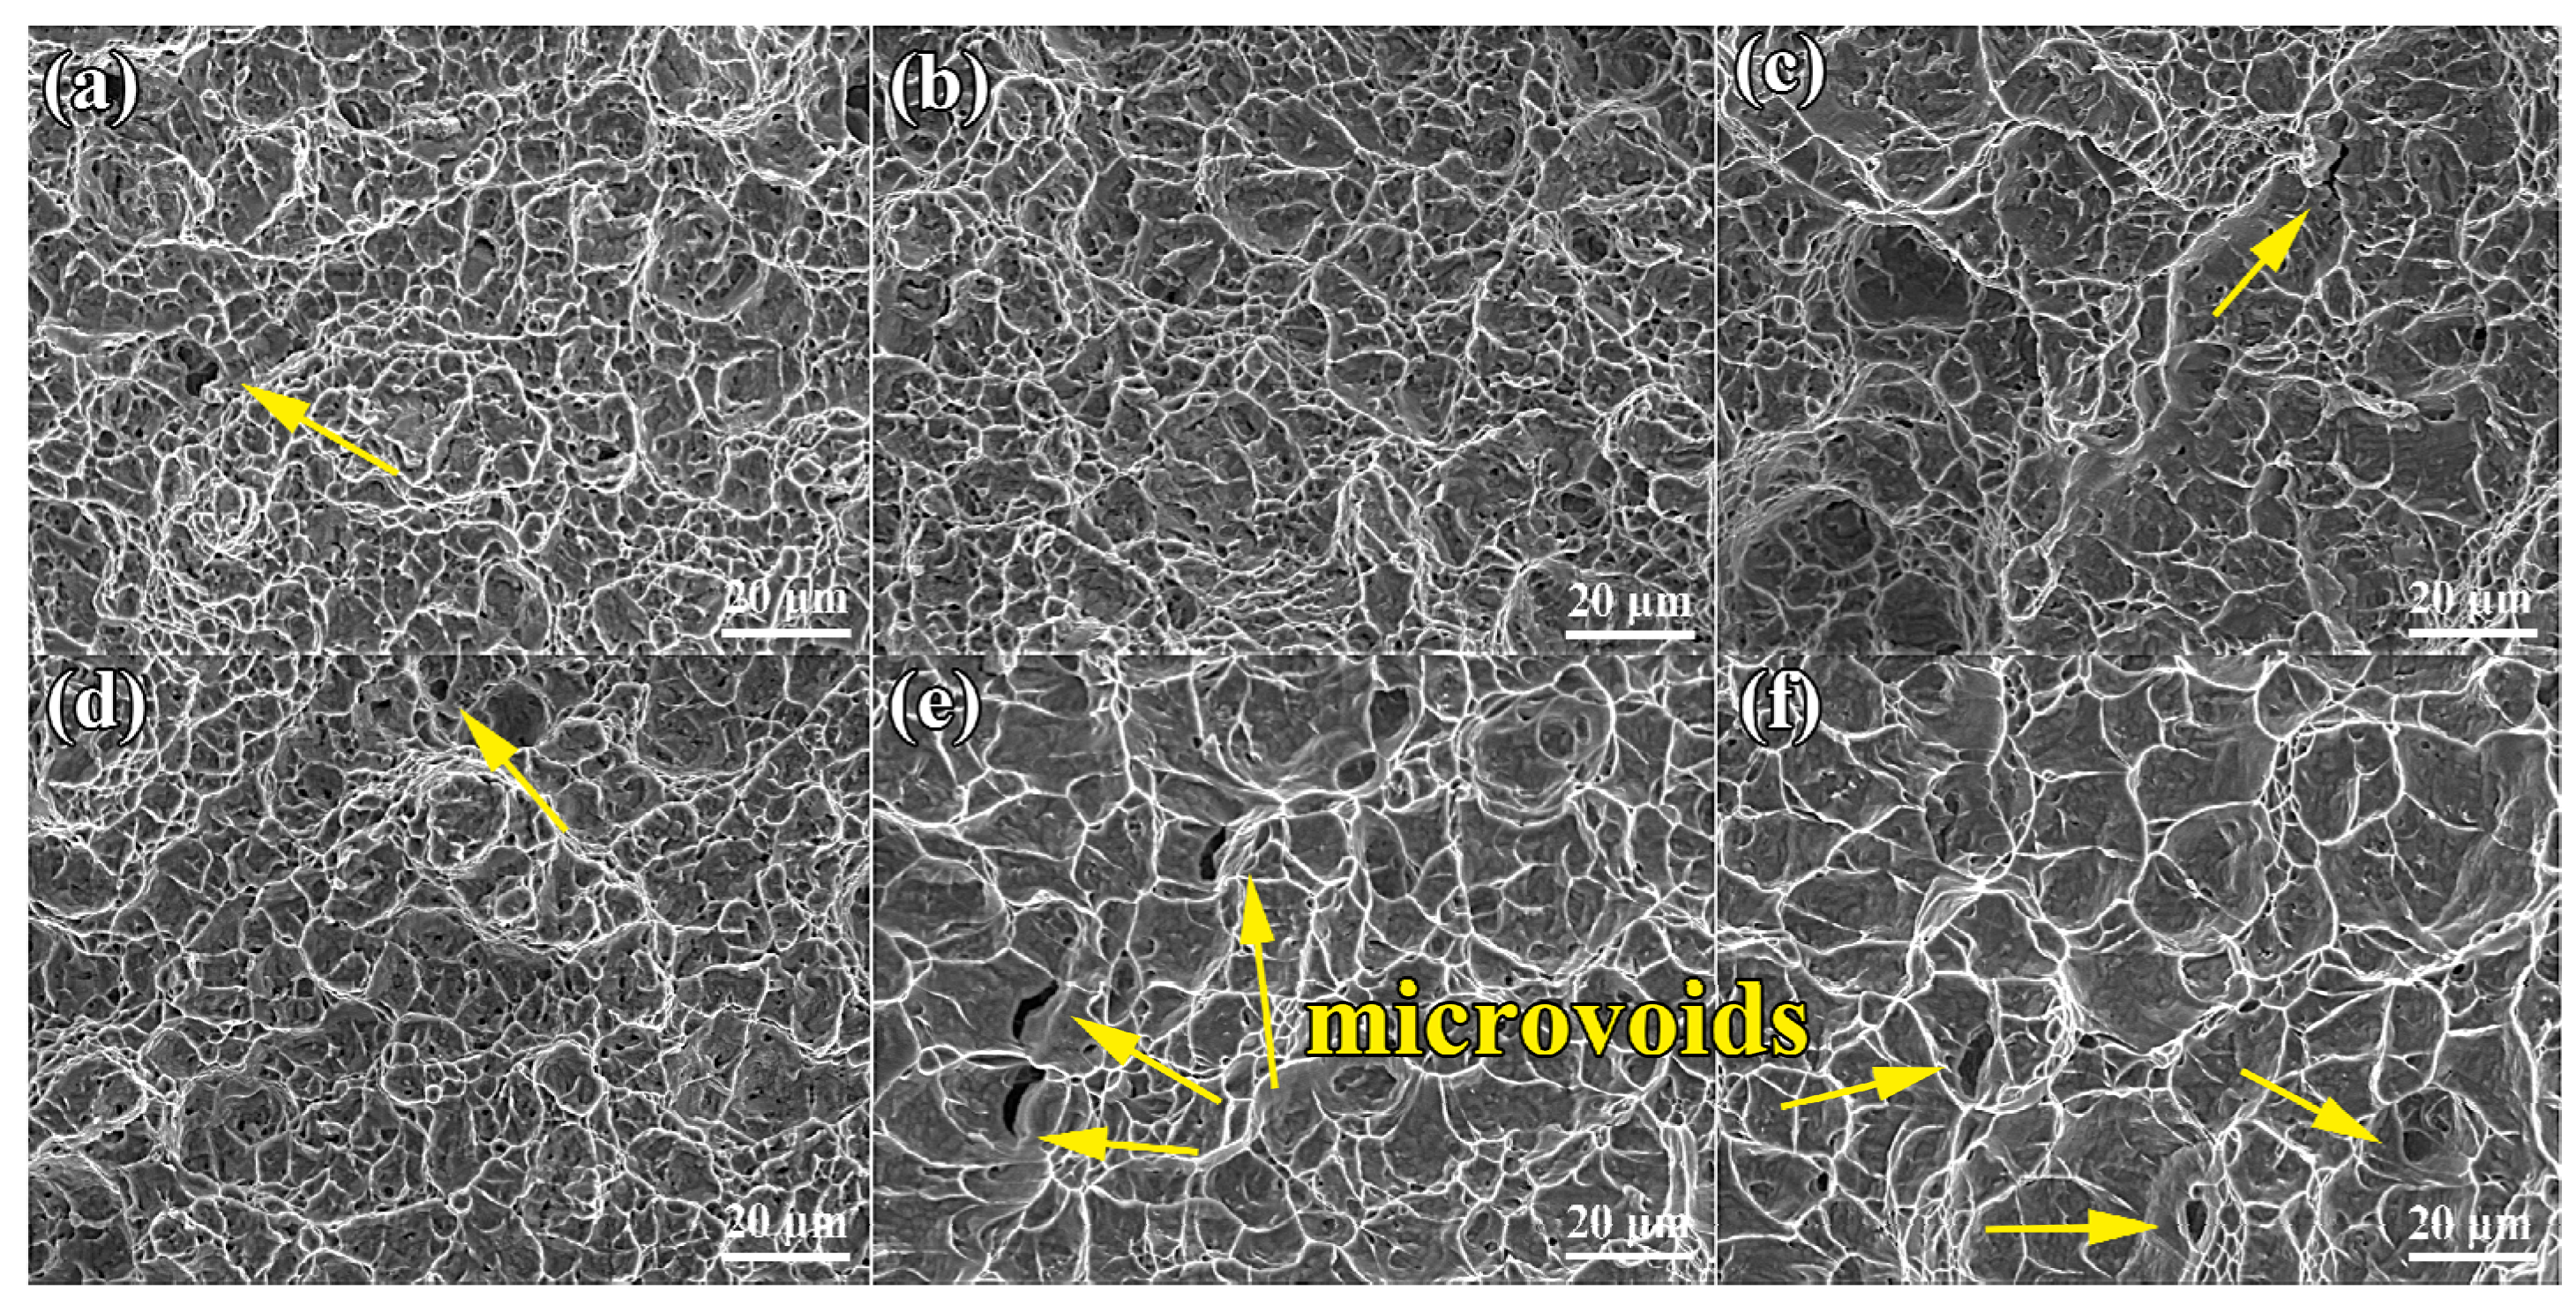
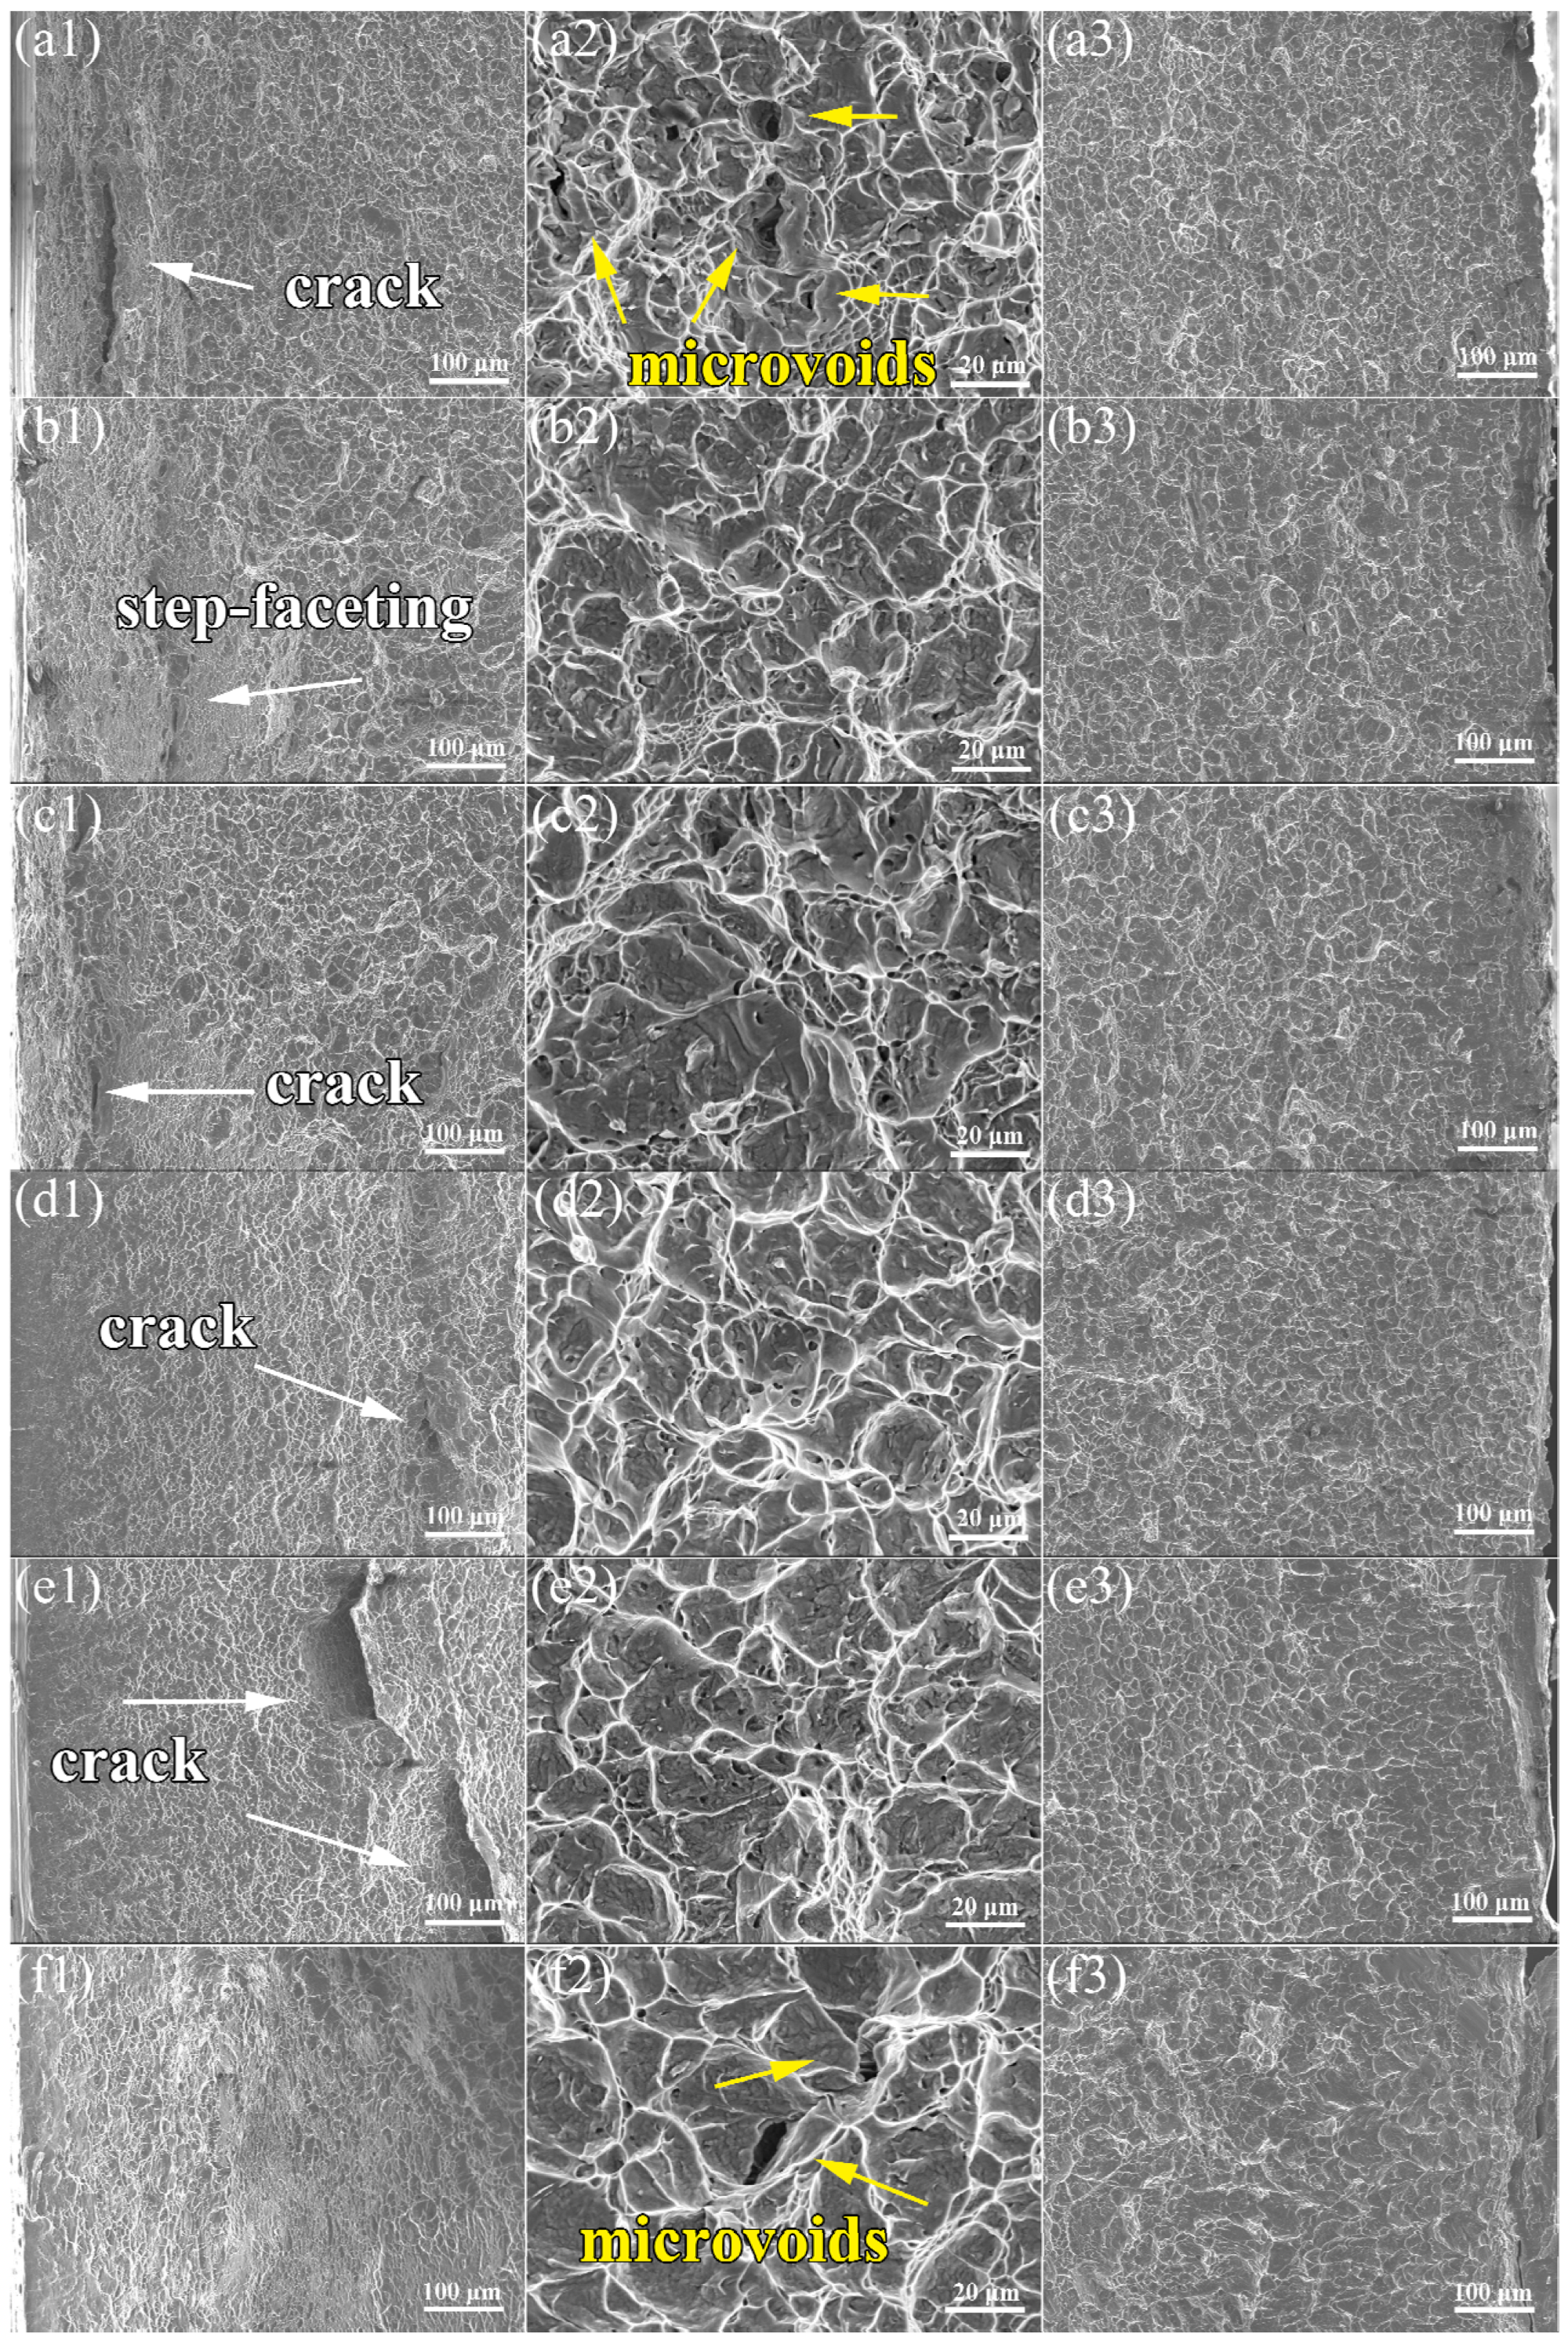
3.2. Mechanical Properties
4. Conclusions
Supplementary Materials
Author Contributions
Funding
Data Availability Statement
Acknowledgments
Conflicts of Interest
References
- Chang, H.; Dong, Y.C.; Dan, Z.H.; Li, F.; Guo, Y.H.; Zhou, L. Current Status and Development Trend of Titanium Alloy for Marine Engineering in China. Mater. China 2020, 39, 585–590. [Google Scholar]
- Williams, W.L. Development of structural titanium alloys for marine applications. Ocean Eng. 1969, 1, 375–383. [Google Scholar] [CrossRef]
- Gurrappa, I. Characterization of titanium alloy Ti-6Al-4V for chemical, marine and industrial applications. Mater. Charact. 2003, 51, 131–139. [Google Scholar] [CrossRef]
- Kang, L.M.; Yang, C. A Review on High-Strength Titanium Alloys: Microstructure, Strengthening, and Properties. Adv. Eng. Mater. 2019, 21, 1801359. [Google Scholar] [CrossRef]
- Yu, Y.; Li, J.Q. Current Application and Prospect of Titanium Alloys in Marine Engineering. Dev. Appl. Mater. 2018, 3, 111–116. [Google Scholar]
- Geographic, N. Deepsea Challenger Pilot Sphere. Available online: http://www.deepseachallenge.com/the-sub/pilot-sphere (accessed on 10 August 2024).
- WHOI. Sixty Years of Deep Ocean Research, Exploration, and Discovery with Human-Occupied Vehicle Alvin. 2024. Available online: https://www.whoi.edu/press-room/news-release/alvin-60 (accessed on 10 January 2025).
- Global Dynamics. Alcin a Manned Deep-Ocean Research Project. 2025. Available online: http://gdynx.com/res_dev3.php (accessed on 12 January 2025).
- Busby, R.F. Manned Submersibles. 2025. Available online: http://mannedsubmersibles.org (accessed on 12 January 2025).
- Nanba, N.; Morihana, H.; Nakamura, E. Development of Deep Submergence Research Vehicle SHINKAI 6500. Technol. Rev. Mitsubishi Heavy Ind. Ltd. 1990, 27, 157–168. [Google Scholar]
- Qiang, F.; Xin, S.W.; Tu, X.Y.; Wang, H.; Guo, P.; Hou, H.; Lian, Z.; Zhang, L.; Hou, W. Low-temperature superplastic deformation mechanism of ultra-fine grain Ti-6Al-4V alloy by friction stir processing. J. Mater. Res. Technol. 2024, 30, 7413–7419. [Google Scholar] [CrossRef]
- Zhang, W.J.; Ding, H.; Yang, W.J.; Li, J.Z. Effect of Initial Microstructure on Grain Refinement and Enhanced Low Temperature Superplaticity in Friction Stir Processed Ti-6Al-4V Alloy. Defect Diffus. Forum 2018, 385, 189–194. [Google Scholar] [CrossRef]
- Sha, A.X.; Li, X.W.; Chu, J.P. Common Annealing of TA15 Alloy. Chin. J. Rare Met. 2003, 27, 213–215. [Google Scholar]
- Zhang, J.Y.; Yang, Y.Q.; Chen, Y.; Wen, L.; Zhou, Y.G. Effect of Annealing on the Structure and Properties of TA15 Titanium Alloy. Heat Treat. Met. 2003, 28, 46–48. [Google Scholar]
- Zhao, Y.; Guo, H.Z.; Shi, Z.F.; Zhang, Y.Q.; Yao, Z.K.; Tan, L.J.; Wang, T. Effect of Annealing on Microstructure and Microhardnesws of TA15 Titanium Alloy Processed by Equal Channel Angular Pressing. Adv. Mater. Sci. Technol. 2011, 675–677, 735–738. [Google Scholar]
- Wu, C.; Zhan, M. Effect of solution plus aging heat treatment on microstructural evolution and mechanical properties of near-β titanium alloy. Trans. Nonferrous Met. Soc. China 2019, 29, 997–1006. [Google Scholar] [CrossRef]
- Oryshchenko, A.S.; Gorynin, I.V.; Leonov, V.P.; Kudryavtsev, A.S.; Mikhailov, V.I.; Chudakov, E.V. Marine Titanium Alloys: Present and Future. Inorg. Mater. Appl. Res. 2015, 6, 571–579. [Google Scholar] [CrossRef]
- An, F.P.; Zhang, L.J.; Ning, J.; Zhang, B.; Sun, Z.; Na, S.J. Influence of annealing on the microstructure and Charpy impact toughness of wire arc additive manufactured Ti5111 alloy. Mater. Sci. Eng. A 2022, 860, 144255. [Google Scholar] [CrossRef]
- Wang, Q.; Ren, J.Q.; Zhang, B.B.; Xin, C.; Wu, Y.K.; Zhang, L. Simultaneously improved strength and elongation at cryogenic temperature in Ti-5Al-1V-1Sn-1Zr-0.8Mo alloy with a bimodal structure. Mater. Sci. Eng. A 2021, 824, 141792. [Google Scholar] [CrossRef]
- Mao, P.L.; Cao, Z.X. A Study of Effect of Compositions on Mechanical Properties of Titanium Alloy STi80. J. Shanghai Iron Steel Res. 2001, 4, 10–13. [Google Scholar]
- Yang, J.; Ren, X.L.; Wang, T.; Sun, F.; Zhang, S.; Lei, J.; Li, S.; Chen, H.; Luo, J. Research on preparation of oversized forging billet for Ti80 titanium alloy in ocean engineering. Forg. Stamp. Technol. 2021, 46, 19–22. [Google Scholar]
- Yang, S.L.; Sun, E.J.; Liu, X.Q.; Song, D.; Tao, H.; Zhang, N.; Li, B.; Yu, Y. Effect of Heat Treatment on Microstructure and Properties of Ti6321 Alloy Slab with Different Microstructures. Rare Met. Mater. Eng. 2020, 49, 1002–1008. [Google Scholar]
- Liang, Z.; Miao, J.; Brown, T.; Sachdev, A.K.; Williams, J.C.; Luo, A.A.A. Low-cost and high-strength Ti-Al-Fe-based cast titanium alloy for structural applications. Scr. Mater. 2018, 157, 124–128. [Google Scholar] [CrossRef]
- Bodunrin, M.O.; Chown, L.H.; van der Merwe, J.W.; Alaneme, K.K. On the substitution of vanadium with iron in Ti–6Al–4V: Thermo-Calc simulation and processing map considerations for design of low-cost alloys. Mater. Sci. Eng. A 2020, 791, 139622. [Google Scholar] [CrossRef]
- Chirico, C.; Romero, A.V.; Gordo, E.; Tsipas, S.A. Improvement of wear resistance of low-cost powder metallurgy β-titanium alloys for biomedical applications. Surf. Coat. Technol. 2022, 434, 128207. [Google Scholar] [CrossRef]
- Gunawarman, B.; Niinomi, M.; Akahori, T.; Souma, T.; Ikeda, M.; Toda, H. Mechanical properties and microstructures of low cost β titanium alloys for healthcare applications. Mater. Sci. Eng. C 2005, 25, 304–311. [Google Scholar] [CrossRef]
- Li, C.-L.; Narayana, P.; Reddy, N.; Choi, S.-W.; Yeom, J.-T.; Hong, J.-K.; Park, C.H. Modeling hot deformation behavior of low-cost Ti-2Al-9.2Mo-2Fe beta titanium alloy using a deep neural network. J. Mater. Sci. Technol. 2019, 35, 907–916. [Google Scholar] [CrossRef]
- Luo, L.S.; Su, B.X.; Wang, Y.; Wang, L.; Su, Y.Q.; Guo, J.J. A High-Strength and Corrosion-Resistant Ti-Al-Zr-Sn-Mo-Nb Alloy and Its Preparation Metho. CN110218908A, 10 September 2019. [Google Scholar]
- Chang, H.; Li, J.J.; Gao, H.; Dong, Y.C.; Li, D.; Ni, H.J.; Zhou, L. A Low-Cost Near-β High-Strength Titanium Alloy Adding Fe and Its Preparation Method. CN106521236A, 22 March 2017. [Google Scholar]
- Chen, F.W.; Xu, G.L.; Cui, Y.W.; Chang, H. Optimization of low-cost Ti35421 titanium alloy: Phase transformation, bimodal microstructure, and combinatorial mechanical properties. Materials 2019, 12, 2791. [Google Scholar] [CrossRef]
- Ge, P.; Zhou, W.; Mao, X.N. Effect of rolling deformation on microstructure and properties of Ti-5322 sheet. J. Mater. Eng. 2009, 37 (Suppl. S1), 154–157+162. [Google Scholar]
- Luo, X.; Xu, J.J.; Wang, Y.Q.; Yang, Y.Q.; Umer, M.A.; Zhang, S.Q. Effect of solution and aging treatment on microstructure and tensile properties of Ti-5322 alloy. Heat Treat. Met. 2020, 45, 24–28. [Google Scholar]
- Song, P.; Li, W.B.; Zheng, Y.; Guan, Z.W.; Wang, X.M.; Xu, W.X.; Ge, P. The constitutive behavior of Ti-5Al-3V-2Cr-2Fe under high-velocity impact: Experimental, modeling, and validation. J. Alloys Compd. 2019, 811, 151946. [Google Scholar] [CrossRef]
- GB/T 228.1-2021; Metallic Materials—Tensile Testing—Part 1: Method of Test at Room Temperature. China Standard Press: Beijing, China, 2021.
- GB/T 229-2020; Metallic Materials—Charpy Pendulum Impact Test Method. China Standard Press: Beijing, China, 2020.
- An, Y.; Kou, W.J.; Gao, T.; Sun, Q. Effect of solid solution temperature on aging precipitation behavior and properties of Ti-1300 alloy. Heat Treat. Met. 2020, 9, 29–36. [Google Scholar]
- Liu, Q.M.; Zhang, Z.H.; Yang, H.Y.; Liu, S.F. Effects of Solid Solution Temperature on the Structure and Properties of TC16 Titanium Alloy Bars. Adv. Mater. Res. 2014, 881–883, 1588–1591. [Google Scholar] [CrossRef]
- Zhou, W.; Qu, H.L.; Zhao, Y.Q. Effect of Heat Treatment on Microstructure and Mechanical Properties of TC4 Alloy. Hot Work. Technol. 2005, 8, 26–27. [Google Scholar]
- Liu, J.Q. Microstructure and Impact Toughness Resistance of TC4 Titanium Alloy. Hot Work. Technol. 2013, 42, 63–66. [Google Scholar]
- Li, Z.; Su, B.; Chen, C.; Luo, L.; Wang, L.; Su, Y.; Guo, J. Composition Optimization, Microstructure and Mechanical Properties of Ti-Al-Nb-Zr-Mo Alloy with High Strength and Corrosion Resistance. Spec. Cast. Nonferrous Alloys 2020, 40, 591–595. [Google Scholar]


| Position | Element Composition/wt.% | ||||||
|---|---|---|---|---|---|---|---|
| Al | Cr | Fe | V | H | N | O | |
| Upper | 5.47 | 1.02 | 1.02 | 3.80 | 0.0034 | 0.008 | 0.20 |
| Bottom | 5.47 | 0.92 | 0.88 | 3.66 | |||
| Average UTS/MPa | Average YS/MPa | Average E/GPa | |
|---|---|---|---|
| (a) 900 °C/1 h, AC + 500 °C/4 h, AC | 1201 | 1107 | 118 |
| (b) 920 °C/1 h, AC + 500 °C/4 h, AC | 1178 | 1077 | 118 |
| (c) 940 °C/1 h, AC + 500 °C/4 h, AC | 1187 | 1073 | 115 |
| (d) 800 °C/1.5 h, AC | 954 | 823 | 99 |
| (e) 840 °C/1.5 h, AC | 1027 | 884 | 106 |
| (f) 880 °C/1.5 h, AC | 1027 | 937 | 115 |
Disclaimer/Publisher’s Note: The statements, opinions and data contained in all publications are solely those of the individual author(s) and contributor(s) and not of MDPI and/or the editor(s). MDPI and/or the editor(s) disclaim responsibility for any injury to people or property resulting from any ideas, methods, instructions or products referred to in the content. |
© 2025 by the authors. Licensee MDPI, Basel, Switzerland. This article is an open access article distributed under the terms and conditions of the Creative Commons Attribution (CC BY) license (https://creativecommons.org/licenses/by/4.0/).
Share and Cite
Fang, H.; Xin, S.; Wang, H.; Tu, X.; Qiang, F.; Lian, Z.; Guo, P. Effect of Heat Treatment on Microstructures and Mechanical Properties of a Ti-Al-V-Cr-Fe-Based Alloy. Crystals 2025, 15, 250. https://doi.org/10.3390/cryst15030250
Fang H, Xin S, Wang H, Tu X, Qiang F, Lian Z, Guo P. Effect of Heat Treatment on Microstructures and Mechanical Properties of a Ti-Al-V-Cr-Fe-Based Alloy. Crystals. 2025; 15(3):250. https://doi.org/10.3390/cryst15030250
Chicago/Turabian StyleFang, Honglin, Shewei Xin, Huan Wang, Xingyang Tu, Fei Qiang, Zhiwei Lian, and Ping Guo. 2025. "Effect of Heat Treatment on Microstructures and Mechanical Properties of a Ti-Al-V-Cr-Fe-Based Alloy" Crystals 15, no. 3: 250. https://doi.org/10.3390/cryst15030250
APA StyleFang, H., Xin, S., Wang, H., Tu, X., Qiang, F., Lian, Z., & Guo, P. (2025). Effect of Heat Treatment on Microstructures and Mechanical Properties of a Ti-Al-V-Cr-Fe-Based Alloy. Crystals, 15(3), 250. https://doi.org/10.3390/cryst15030250