Article

Color Mechanism Analysis and Origin Comparison of Pink-Purple Sapphires from Vietnam and Madagascar

1
School of Gemology, China University of Geosciences, Beijing 100083, China
2
The Museum of China University of Geosciences, Beijing 100083, China
*
Author to whom correspondence should be addressed.
Crystals 2025, 15(3), 229; https://doi.org/10.3390/cryst15030229
Submission received: 21 January 2025 / Revised: 20 February 2025 / Accepted: 26 February 2025 / Published: 27 February 2025
(This article belongs to the Section Mineralogical Crystallography and Biomineralization)

Abstract

:
Extensive research has already been conducted on sapphires, yet there remains a notable absence of methods available to identify the provenance of pink-purple sapphires, particularly those originating from Vietnam and Madagascar. This study examined pink-purple sapphires from Vietnam and Madagascar by conducting basic gemological tests, microscopic observations, infrared spectroscopy, Raman spectroscopy, UV–Vis–NIR spectroscopy, and LA ICP MS, while also drawing comparisons with pink-red corundum from other locations. In appearance, the Vietnamese samples have a foggy appearance and orange iridescence, while the Madagascan samples show a relatively strong purple hue. The color origin analysis reveals that the absorption peaks of the ultraviolet spectrum caused by Cr3+ in the yellow-green and blue-purple regions account for the pink color of the Vietnamese and Madagascan samples. The lower UV wavelength position of the two main peaks in the Madagascan samples, as compared to the Vietnamese ones, indicates that Fe3+ d–d transitions, as well as transitions between Fe2+—Ti4+ and Fe3+—Ti3+ ions, enhance blue light transmission and cause the samples to tend towards a purple hue. Regarding inclusions, the Vietnamese samples are characterized by white and blue bands, cloudy inclusions, and extensive yellow-orange staining, whereby the cloudy inclusions give them their special appearance, and their calcite and apatite inclusions indicate that they come from marble-type deposits. The presence of many small-grained zircon formations, especially clusters, in the Madagascan samples indicates that they come from alkaline basalt. Chemical analysis confirmed the origin of the samples from the two locations. Compared with the pink-red corundum of the same marble type (Myanmar and Yunnan, China), the Vietnamese samples have lower V, Mg, and Ga contents and a higher Fe content. Compared with the pink-red corundum of the high-iron type (Thailand, Cambodia, and Tanzania), the Madagascan samples have lower Fe and higher Ga contents overall. This study possesses considerable significance in tracing and identifying the origin of pink-purple sapphires.

1. Introduction

Ruby and sapphire are varieties of corundum. The mechanisms responsible for the coloration and geological origins of pink-purple sapphires and rubies share some similarities. Generally, pink-purple sapphires exhibit a light color. In the literature, pink-purple gemstones are often referred to as rubies. However, in this study, we use the term “pink-purple sapphire” to denote this particular shade of pink-purple corundum. The pink-purple hue of sapphires is a composite color, and predominantly composed of a red tone, induced by chromium (Cr), and a blue tone, attributed to other elements, such as iron (Fe), titanium (Ti), and vanadium (V). Unlike rubies, which have higher concentrations of Cr (1562–2009 ppm [1]; 2468–7015 ppm [2]; 1501–4328 ppm [3]), pink-purple sapphires have lower Cr contents (89.8–108 ppm [4]; 640–1142 ppm [5]). Even with heat treatment, lighter pink-purple sapphires are generally not sold as rubies, as heat treatment primarily removes some of the blue hue rather than deepening the red hue [6,7]. Pink-purple sapphires can be found in various mines worldwide, such as in Myanmar, Vietnam, Sri Lanka, Mozambique, and Madagascar [8,9,10]. Nowadays, one of the primary challenges faced by gemological laboratories is tracing the provenance of gemstones [11,12], given that their value can be significantly influenced by their origin, with pink-purple sapphires being no exception.
The fingerprinting and geochemical investigation of rubies may indicate the provenance of placer deposits [13,14]. Trace element data can be used to easily distinguish between marble-type and metamorphic rubies [9], and this method can also be used to trace the origins of pink-purple sapphires. Pink-purple sapphires from Greenland [15], Cambodia [16], Australia [17], India [18], and Thailand [19] have been systematically studied by other scholars to determine their basic gemological properties, inclusions, UV spectra, infrared spectra, and trace elements. However, there are few studies on pink-purple sapphires from Vietnam and Madagascar. Robert E. Kane, Khoi, and others have provided information on the inclusions, major elements, and UV–Vis spectra of Vietnamese pink-purple sapphires [20,21]. Karampelas and others provided infrared data, Raman spectra, and inclusion information for Madagascar pink-purple sapphires in their study on heat treatment [22]. Previous studies have mainly explored the relationship between individual gemstones’ properties and their deposits’ geology to determine their geographic origin.
This study selected 10 Madagascan and 10 Vietnamese pink-purple sapphires (Figure 1), which were not heat-treated and contained inclusions of origin characteristics. The Vietnamese samples have a foggy appearance and are iridescent orange. Basic gemological testing, microscopy, infrared spectroscopy, Raman spectroscopy, UV–Vis–NIR spectroscopy, and LA ICP MS were used to determine the gemological and chemical elemental characteristics of the samples and to compare them with pink-red corundum from other locations in order to determine the unique color origin and origin characteristics of pink-purple sapphires from Vietnam and Madagascar.

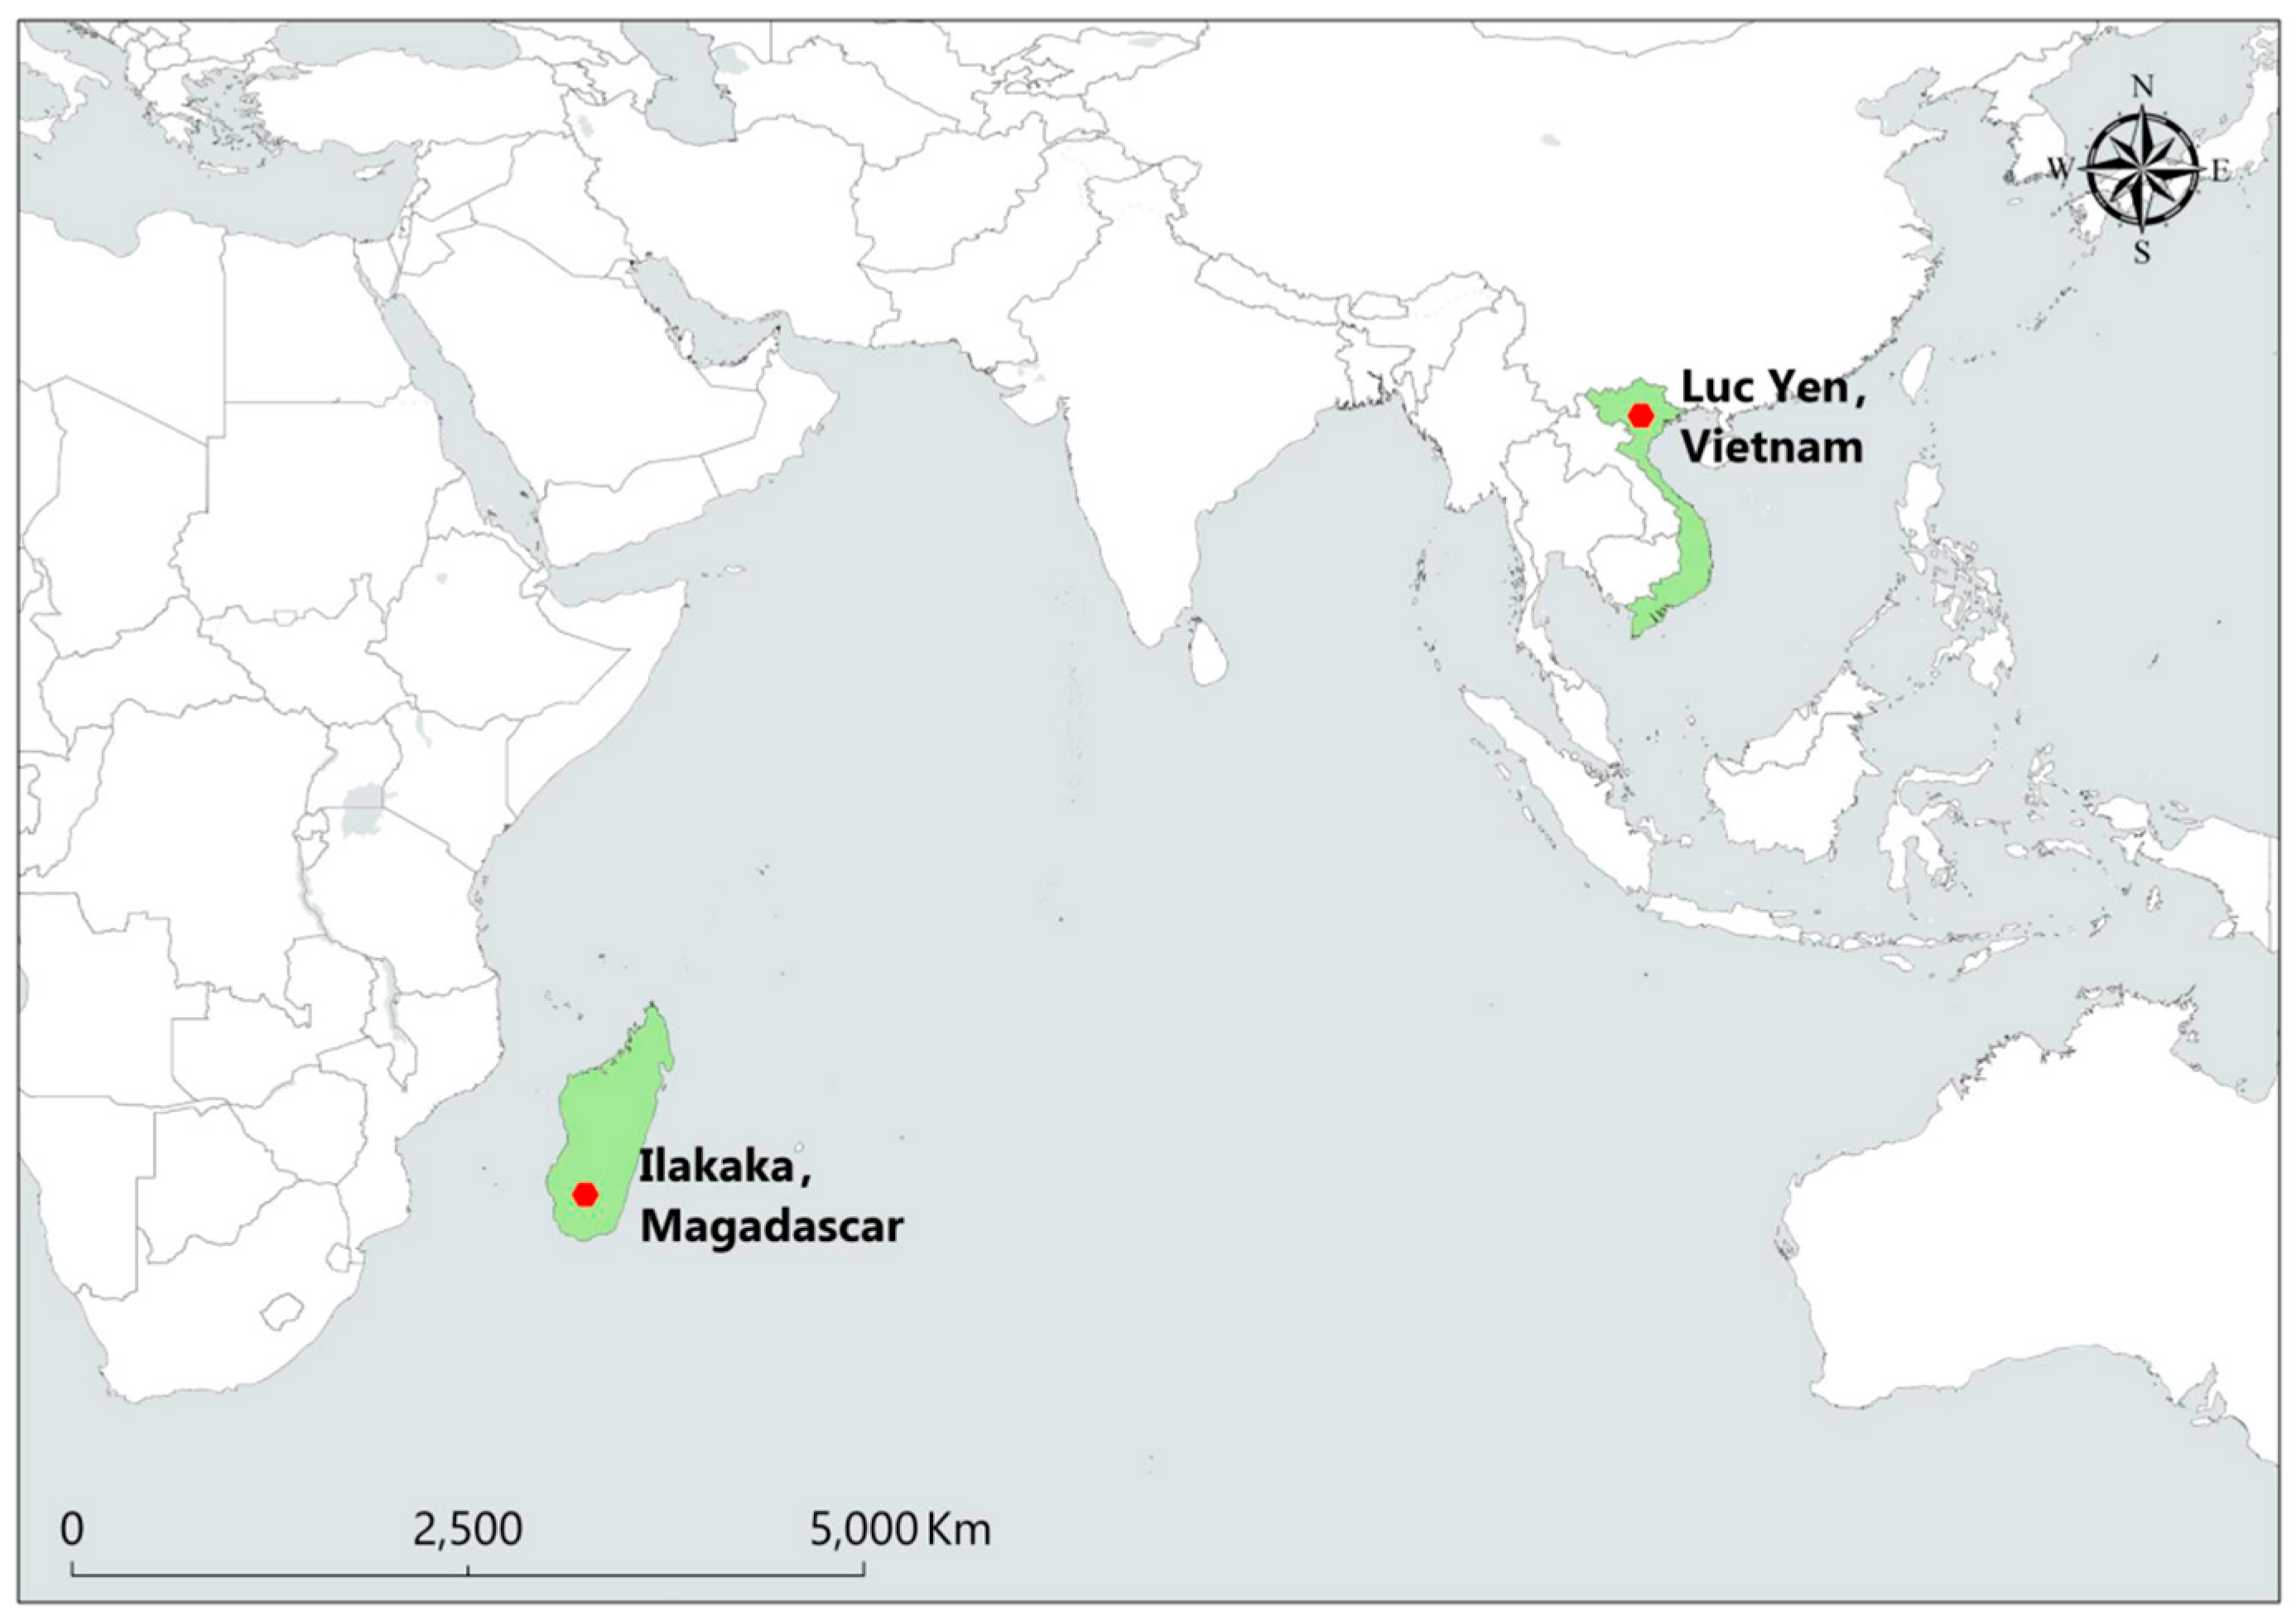
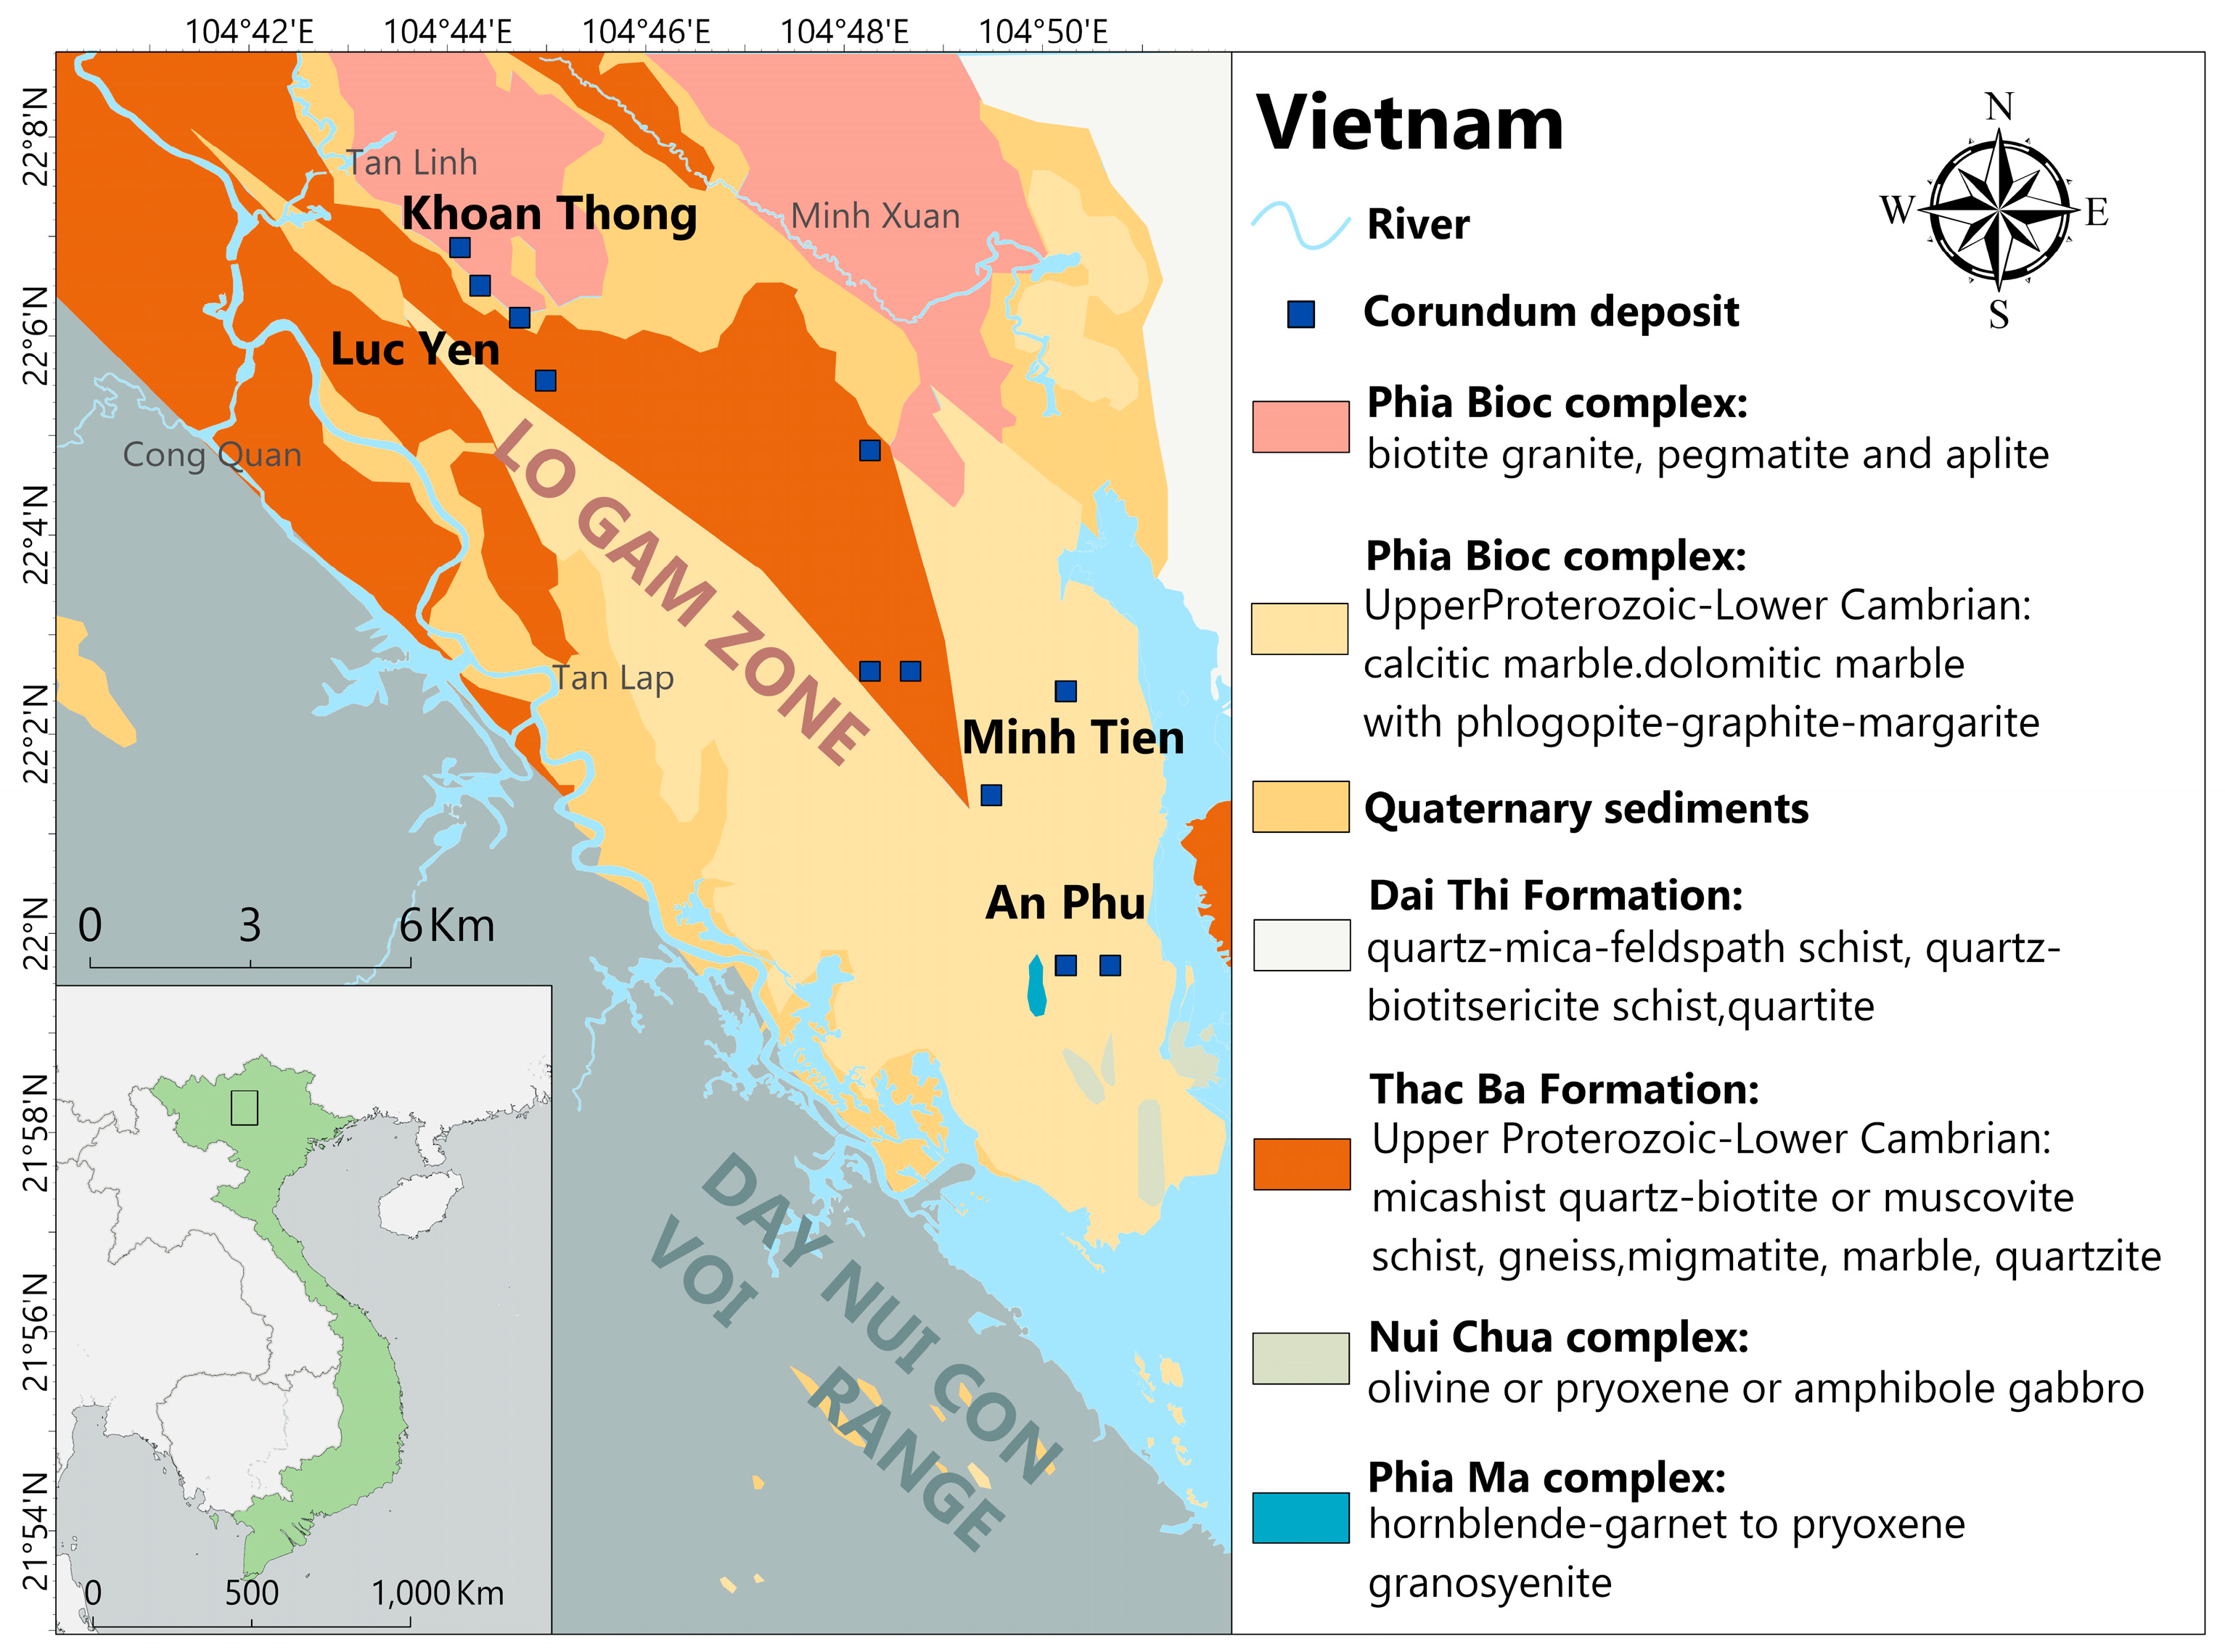
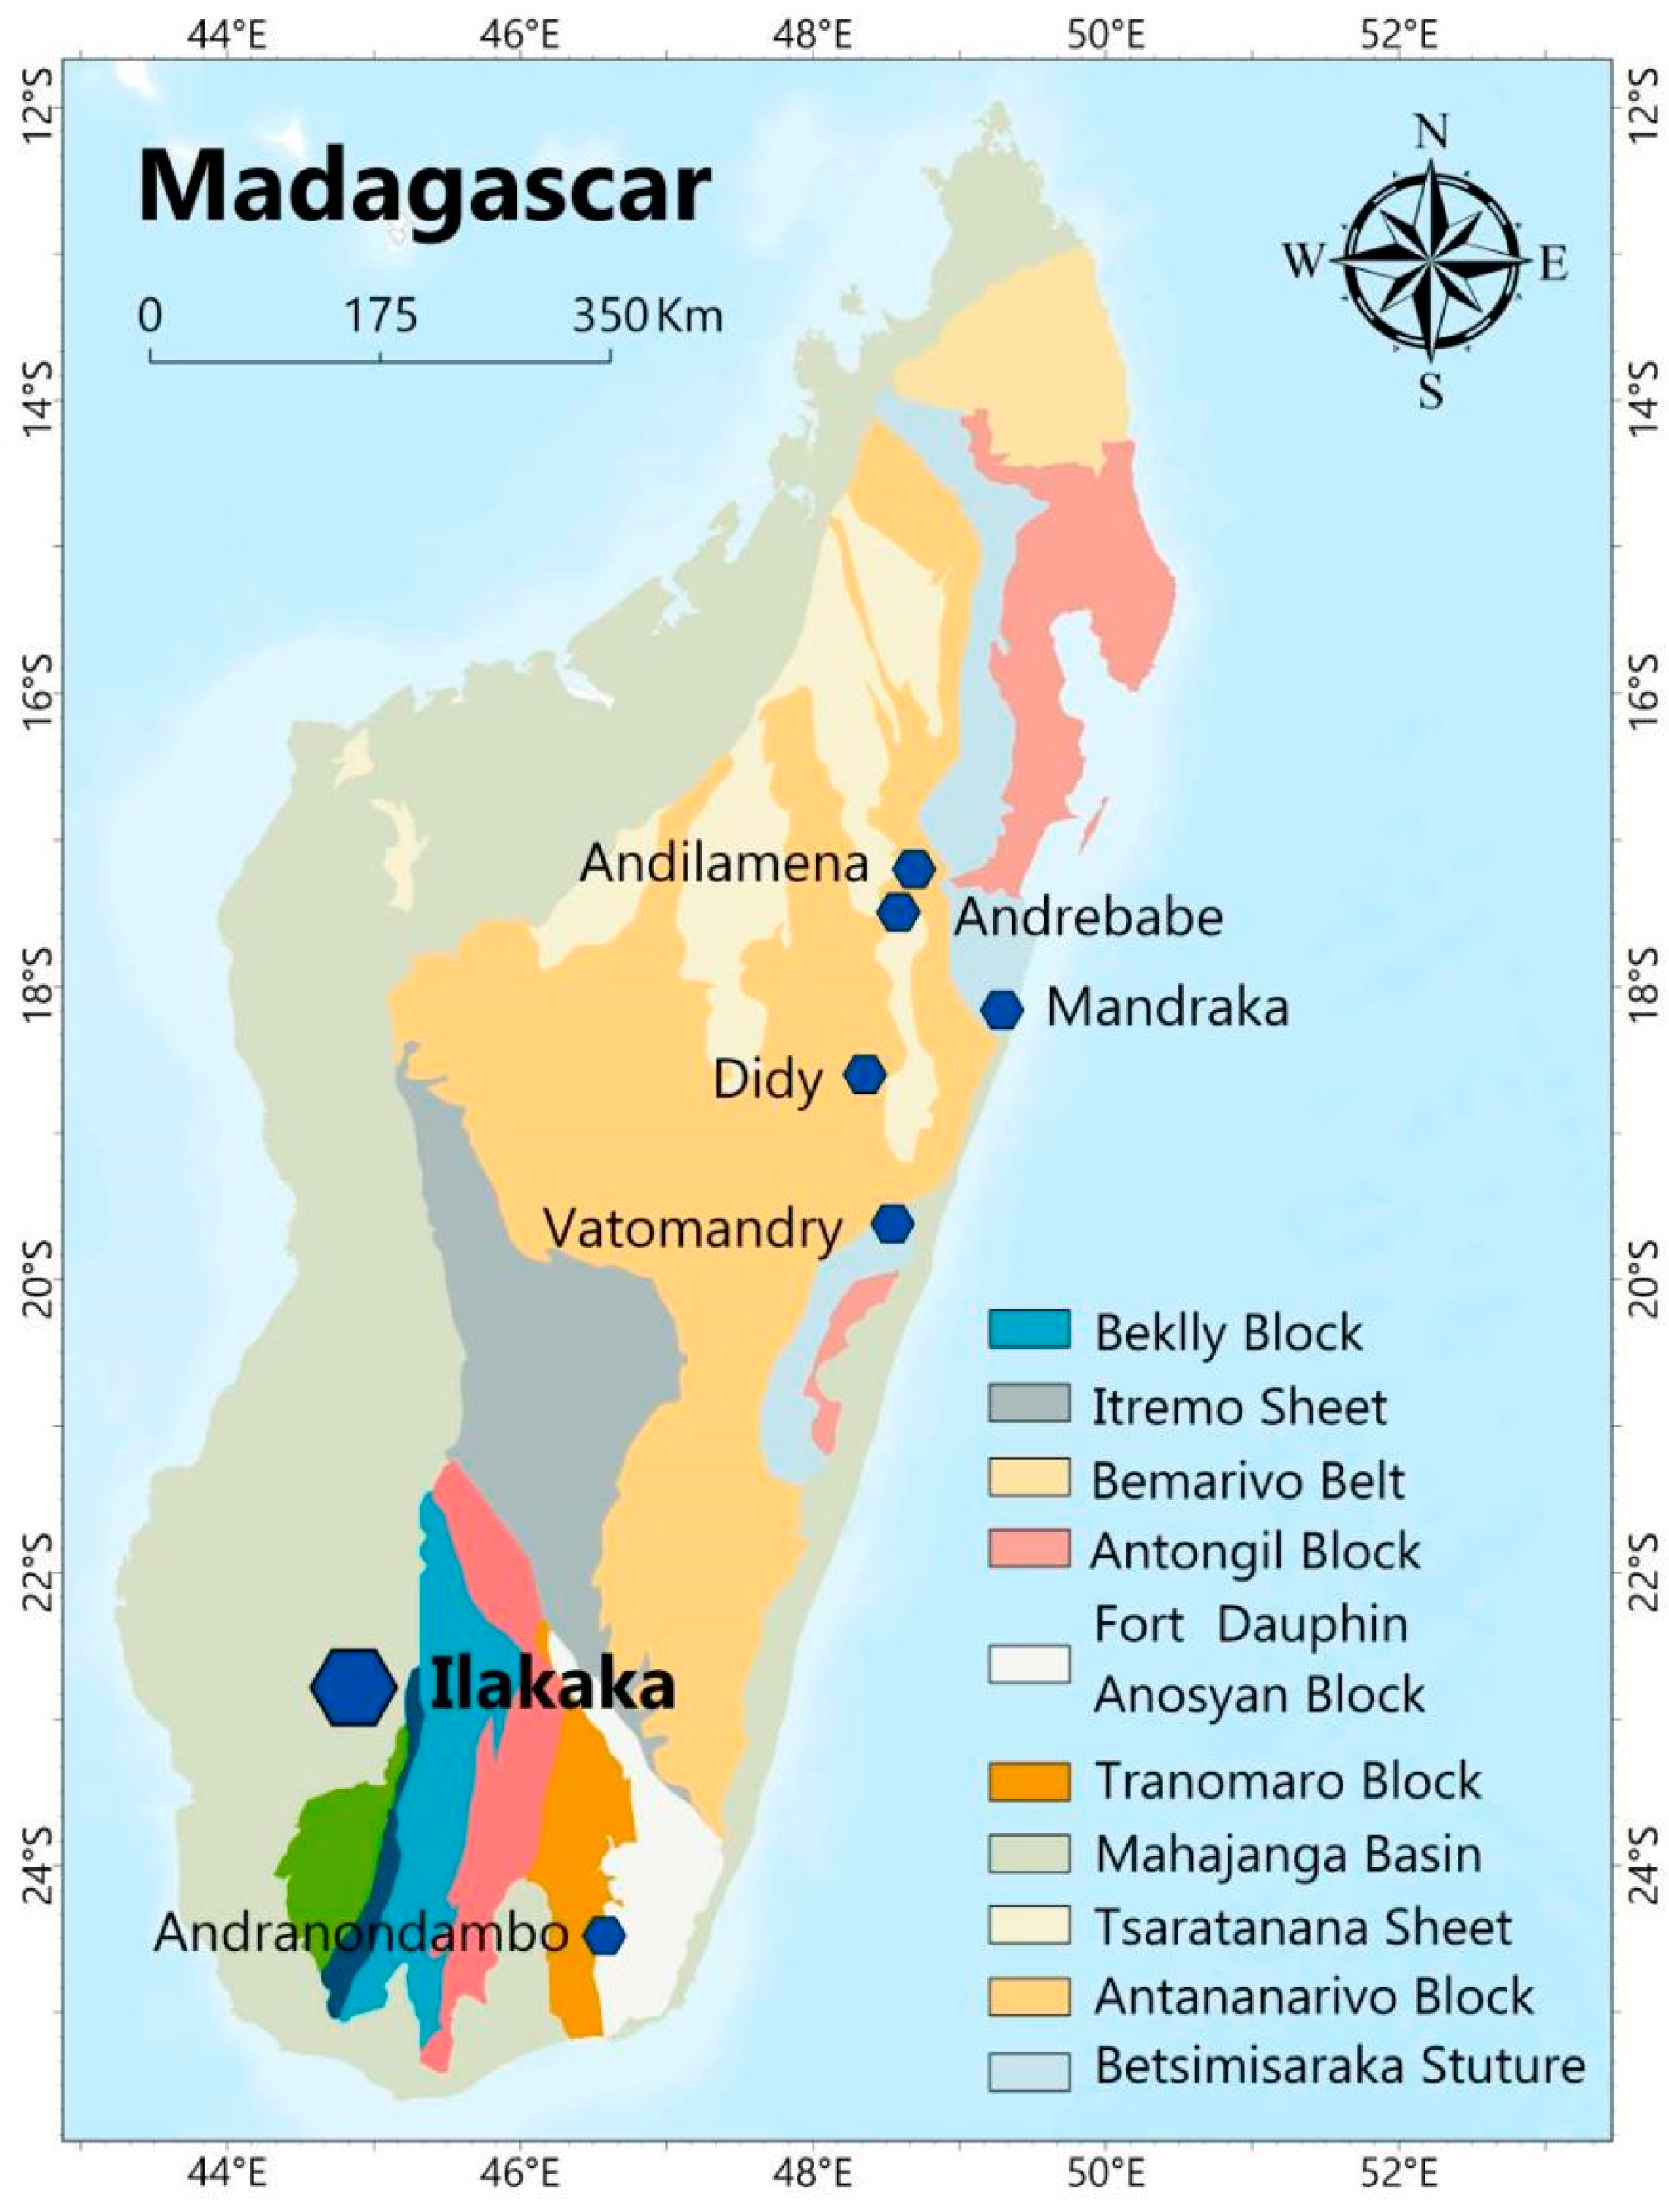
2. Geological Setting

Luc Yen is located in Yen Bai Province and consists of two geological units, separated by a fault. The fault is part of the Red River shear zone, with the Day Nui Con Voi metamorphic zone to the southwest and the Lo Gam tectonic zone to the northeast (Figure 2). The corundum deposits in Luc Yen are all located in the Lo Gam tectonic zone, a unit with a structure formed by deformation superimposed on pre-existing Indochinese structures during the Himalayan orogeny [23]. The strata in this area are composed of a series of sediments, metamorphosed into marble, gneiss, calc–silicate, dolomite, and amphibolite, which are sometimes intruded by granite and pegmatite dikes [24]. The mineralized marble belt where the Luc Yen corundum deposit is located is similar to the geological conditions where rubies are mined in the Mogok area of Myanmar and the Hunza Valley of Pakistan [20].
Today, sapphires are primarily mined from secondary deposits, consisting of gravel concentrates in karst caves and alluvial fans throughout the Luc Yen region [20]. The corundum crystals mined in this area are primarily pink, purple to red, and blue; colorless sapphires coexist with rubies, and gray-to-brown and bipyramidal sapphires and trapiche rubies are also present [25].
About 750–500 million years ago, Madagascar was part of Gondwana’s supercontinent, sandwiched between East Africa, southern India, and Sri Lanka. Today, this region is known as the Mozambique (Pan-African) Orogenic Belt, and it is home to the world’s richest corundum deposits. Many areas of the belt are now the world’s largest producers of rubies and sapphires. Ilakaka is located in the southern part of Madagascar (Figure 3), where colored sapphires are produced in high volumes, with mining and trade concentrated in and around Ilakaka [26].
Madagascar’s gem-quality sapphires are mostly metamorphic and are concentrated in the Precambrian granulite area in the southern part of the country [13]. These rocks were eroded during the late orogenic period to the late basement uplift and deposited along the western edge of the Mozambique Basin to form Late Paleozoic–Mesozoic sedimentary strata, forming large paleoplacer sedimentary deposits in local areas. The Ilakaka sapphire deposit was formed during this period and was discovered in 1998 [28]. According to research conducted by Giuliani et al., the mines in this area are a highly mixed blend of red and blue sapphires from different deposits. The sapphires produced are mainly pink (about 80%), with other varieties including blue, purple, orange, padparadscha, yellow, and colorless [5,10,13].

3. Materials and Methods

3.1. Sample Description

A total of 20 sapphire samples (10 from Vietnam and 10 from Madagascar) were collected and examined in this study. These sapphire samples are all faceted gemstones weighing from 0.36 to 1.59 ct (Figure 4), and they are pink to purple in color. The samples from Vietnam were numbered from V-1 to V-10, and the samples from Madagascar were numbered from M-1 to M-10. The Vietnamese samples often exhibit a characteristic foggy appearance, with V-1, V-2, V-3, V-5, and V-10 being distinctly foggy, and V-4 and V-6 having moderately foggy appearances.

3.2. Conventional Gemological Testing

The refractive index, specific gravity, and ultraviolet fluorescence characteristics of the samples were tested using a refractometer, the hydrostatic weighing method, and ultraviolet light, respectively. The testing was conducted at the Gemology Experimental Teaching Center of the Gemology College, China University of Geosciences, Beijing, China (CUGB).

3.3. Microscopic Analysis and Spectroscopy

The standard gemological tests (gemstone microscopic observations, infrared spectrum testing, laser Raman spectrum testing, and UV–visible spectrum testing) were conducted at the Gem Testing Laboratory within the School of Gemmology at CUGB. The internal characteristics and photomicrographs were observed using a Nanjing Baoguang GI-MP22 binocular gemological microscope at 10 × 65× magnification. The techniques of incident, dark field, reflected, and oblique illumination were used to investigate the gems’ internal characteristics.
The instrument used for the infrared spectroscopy test was a BRUKER Tensor 27 (Bremen, German). The test conditions were as follows: the scanning range was 400–4000 cm−1, the sample scanning time (Beijing, China) was 8 scans, and the scanning speed was 7.5k Hz. The power supply was 85–265 V, the power frequency was 47–65 Hz, the temperature was 18–35 °C, the humidity was <70%, the resolution was 4 cm−1, the grating setting was 6 mm, the sample scanning times were 50–100, and the test mode was the absorption mode.
Raman spectra were obtained using the HR-Evolution micro-Raman spectrometer, manufactured by HORIBA, Japan. A microscope equipped with ×50 objectives was used to focus on the samples under precise test conditions: the aperture was set to 0.865 µm; the power output was maintained at 100 mW; the spectral range was 200–4000 cm−1; the integration time was 10 s; and the laser wavelength was 532 nm. Since the sample gemstones have strong fluorescence characteristics, all of the Raman spectra were baseline-corrected to make the results more accurate. The mineral inclusions were identified and compared with the RRUFF databases.
Ultraviolet–visible absorption spectra were collected using an UV-3600 UV–Vis–NIR spectrophotometer (Shimadzu Corporation, Kyoto, Japan) to measure the absorption value.

3.4. Chemical Analysis

The in situ microanalysis of minerals can produce a lot of information [29,30,31,32]. The laser ablation–inductively coupled plasma mass spectrometry (LA-ICP-MS) analyses were completed in the Guild Gem Laboratory (Shenzhen, China). The LA-ICP-MS analysis equipment consisted of an Applied Spectra IncJ-100 femto-second laser ablation system (343 nm) and a Thermo X-Series ICP-MS: the laser spot diameter was 50 µm; the laser frequency was 10 Hz; the laser energy density was 8 J/cm2; and the calibration reference materials were NISTSRM 610 and NIST SRM 612 (the mass discrimination and the time-dependent drift of sensitivity were corrected 1 time per 11 samples with the calibration reference materials). The internal standard element was 29 Si. Each analysis consisted of ~15 s of background acquisition of a blank measurement of gas, followed by 40 s of data acquisition from the sample. Chemical element analysis and calibration were completed using Iolite software. In order to prevent them from exerting an influence on the results, inclusions were avoided in the selection of experimental sampling points.

4. Results

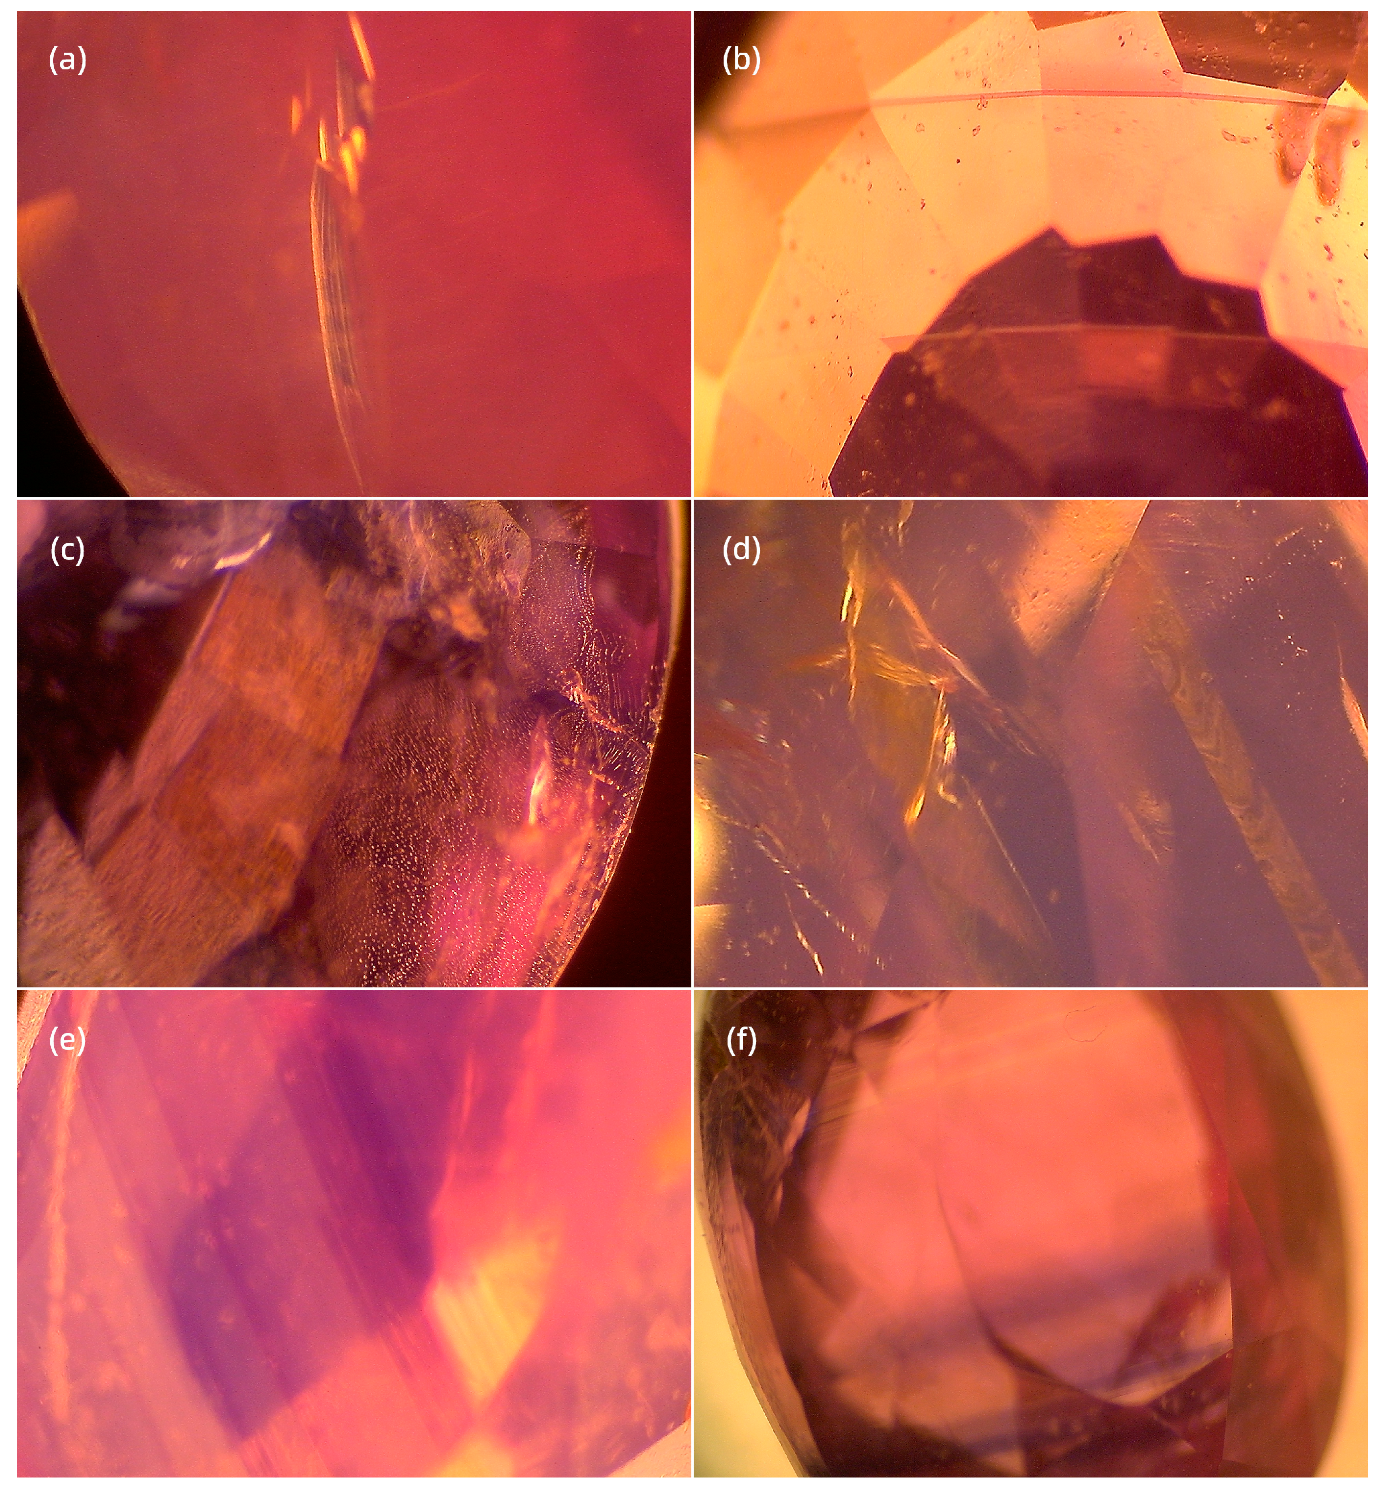
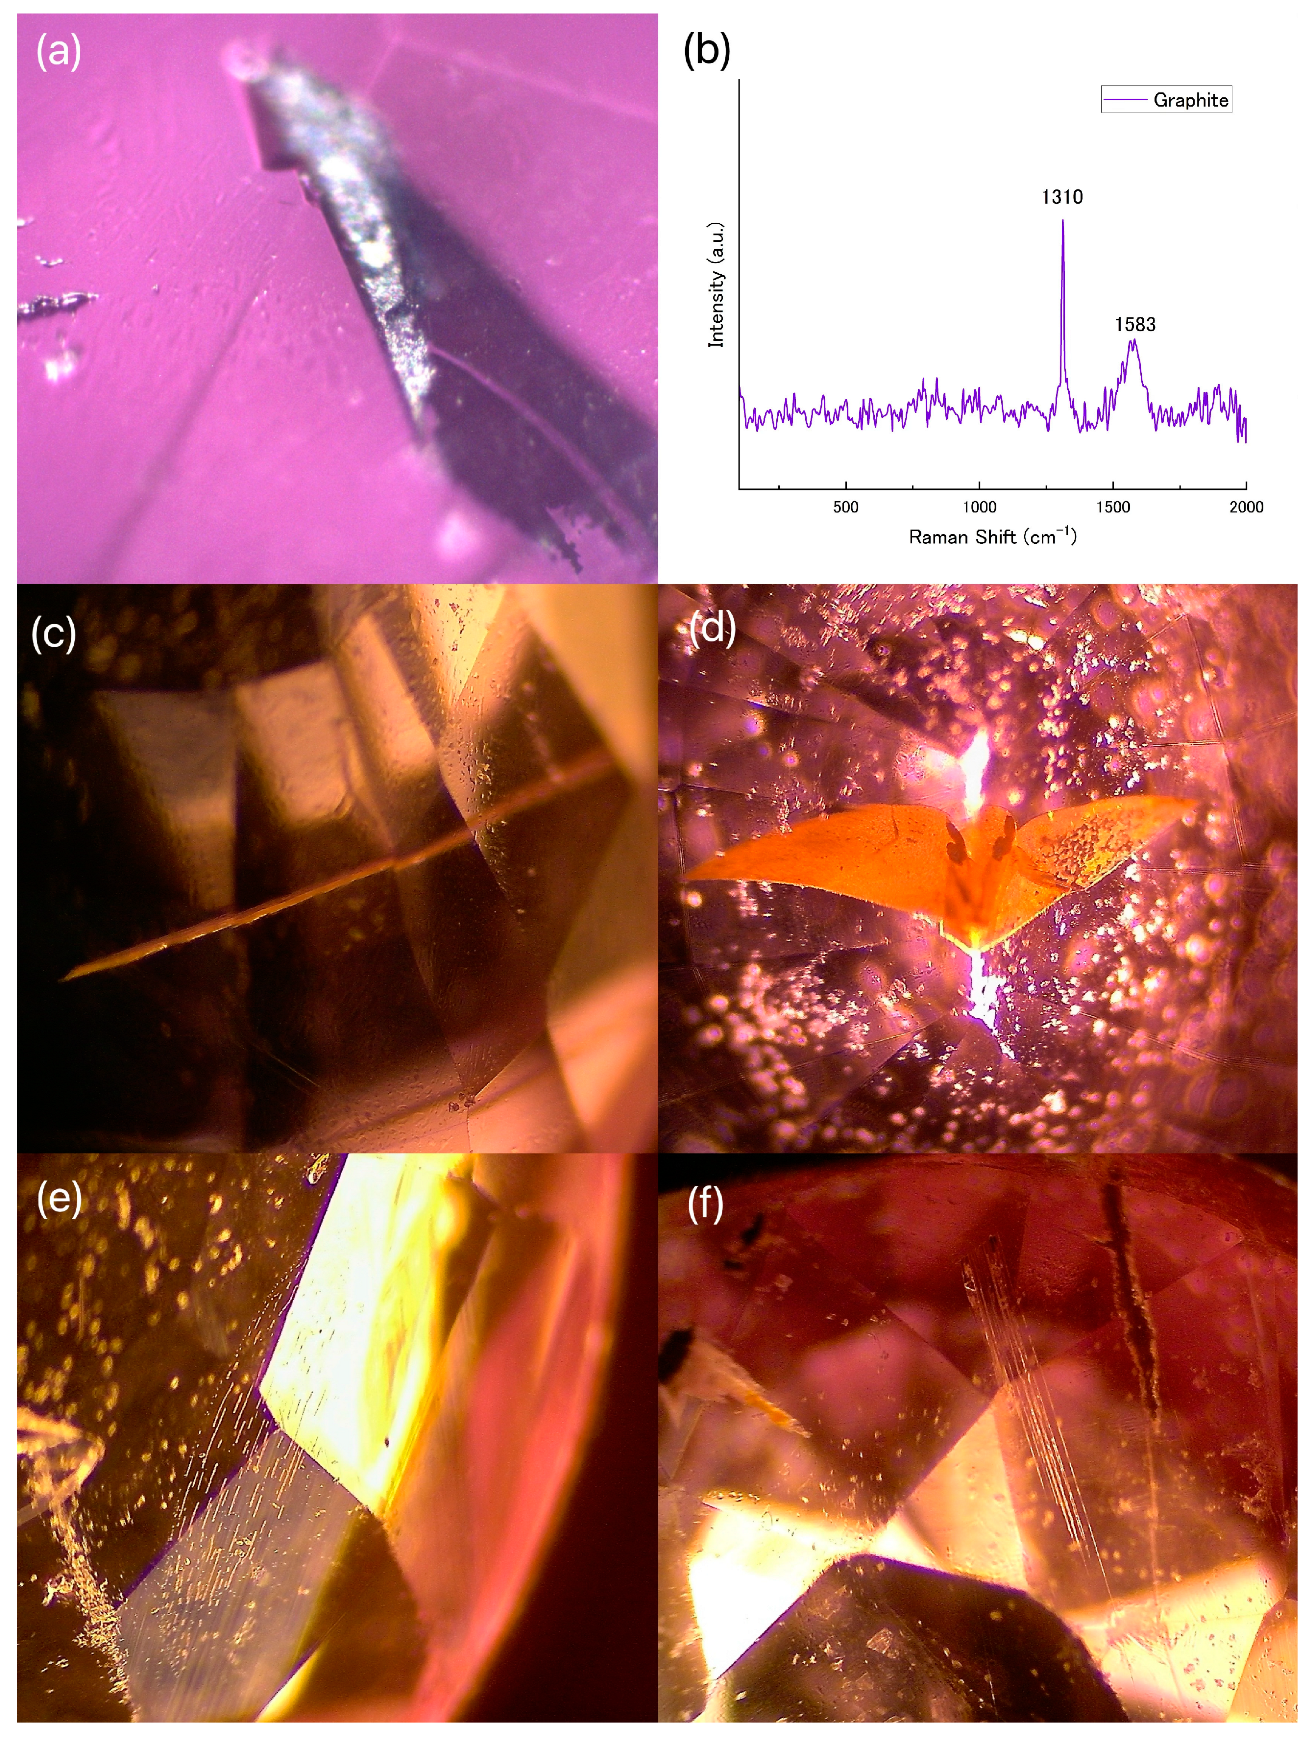
4.1. Gemological Properties and Internal Features

The gemological properties of the samples from the two provenances are presented in Table 1. The Vietnamese samples have RI ranges of 1.758–1.769 and SG ranges of 3.78–4.14, while the Madagascan samples have RI ranges of 1.759–1.768 and SG ranges of 3.89–4.04. Most Vietnamese pink-purple sapphires have fewer purple tones, while the Madagascan samples have more purple tones and are darker in color. Orange iridescence and a foggy appearance can be seen in some of the Vietnamese samples; these features are unique to the Vietnamese samples. The samples from both origins have moderate-to-red solid fluorescence under long waves (Figure 5).
As shown in Figure 6, Figure 7 and Figure 8, the Vietnamese sapphire samples contain various types of inclusions, including colorless transparent solid inclusions, opaque solid matter, fluid inclusions, disseminated materials, color zoning, and cloudy substances.
The colorless transparent solid inclusions are diverse in shape, with some having well-preserved geometric forms. Many exhibit an eroded appearance and are relatively large in volume, and Raman spectroscopy was used to detect apatite and calcite (Figure 6a,b), strongly indicating the geographic origin of the samples.
The opaque inclusions occur as flakes, needle tubes, etc. (Figure 6 and Figure 7). Most are small in size and randomly distributed within the sample, and some have a metallic luster. Raman spectroscopy was used to detect ilmenite [33] (Figure 6c). Some were also found in fracture planes, with larger particles showing Raman spectra of graphite and sulfur (Figure 6d,e), both of which indicate a metamorphic origin. Particularly unique is the dark, elongated prismatic mineral V-5, which is large in size and accompanied by healed fractures and cloudy inclusions (Figure 7a). According to the literature, its appearance is similar to that of pargasite [34].
In multiple samples of Vietnamese pinkish-purple sapphires, there are one or two relatively thick and long tubular structures, which are roughly parallel to each other (Figure 7b).
Vietnamese pinkish-purple sapphires also commonly contain a large number of gas–liquid inclusions, including irregular granular, elongated (Figure 6f), and fingerprint-like (Figure 7c) shapes. The Raman spectroscopy detected characteristic bands of CO2 vibration modes (Figure 6f). In almost all of the samples, healed fractures were observed to be filled with yellowish-orange disseminated inclusions, most likely iron oxide or hydroxide (Figure 7d), which is a typical feature of Vietnamese pinkish-purple sapphires.
Vietnamese pinkish-purple sapphires are characterized by distinctive inclusions: white, colorless, and bluish-purple banded inclusions are observed in V-3, V-9, and V-10, and cannot be clearly seen under a high-magnification microscope (Figure 7e,f). Previously, other researchers also observed the presence of bluish-purple zoning in a large number of Vietnamese rubies, indicating that these zones are typical representatives of Vietnamese materials [9,20]. However, they are not unique to Vietnamese gemstones; similar zones have also been observed in some rubies from Afghanistan and Nepal, as well as in pink sapphires from Montana and Sri Lanka [20].
Cloud-like inclusions are also common in the Vietnamese samples (Figure 8). There are two types: one type has irregular contours, such as those observed in V-3, and is composed of small white particles that are uniformly distributed throughout the cloud. When using fiber optic light, the cloud-like inclusions appear blue (Figure 8a), and the sample exhibits orange iridescence (Figure 8g). The second type of cloudy inclusion, such as those shown in V-5 (Figure 8b) and V-8 (Figure 8d,e), is composed of larger white particles with indistinct contours and areas of different densities. Upon further magnification, the samples were found to consist of various lengths of small needle-like inclusions and dust-like inclusions arranged in a roughly oriented manner (Figure 8c,f). Due to the extremely small size of the inclusions within the experimental samples, Raman spectroscopy was unable to accurately determine their composition. Nevertheless, according to the relevant literature, these minute needle-like particles have been identified as rutile in corundum specimens from various regions [20]. Among them, the V-5 particles exhibit a smaller size and denser cloud formation, with the samples displaying an orange iridescent color (Figure 8h), while V-8 has more distinct particles and does not exhibit any orange iridescence (Figure 8i). In addition, the Vietnamese samples without cloud-like inclusions do not exhibit any orange iridescence (Figure 8j); the samples from Madagascar do not have cloud-like inclusions and do not exhibit any orange iridescence (Figure 8k). It is hypothesized that the orange iridescence can be attributed to light scattering caused by minute inclusions within the sample.
The Madagascan samples exhibit many diverse inclusions, mainly comprising colorless transparent solid inclusions, dark opaque solid inclusions, gas–liquid inclusions, and impregnation inclusions.
Colorless transparent solid inclusions are typically irregularly granular in shape, ranging in size from 10 μm to 100 μm, but most are less than 50 μm. Other forms, such as hexagonal plate-like, prismatic (Figure 9b), and parallel (Figure 10f) forms, can also be observed. Granular zircon crystals are scattered throughout the sample (Figure 9a), which is a typical feature of Ilakaka purple–blue sapphires, indicating their geological origin. Zircon inclusions are distributed in a discrete (Figure 9c) or clustered manner (Figure 9e), and some zircon particles are surrounded by disc-shaped or arc-shaped fractures (Figure 9d), which are caused by the metasomatic effects of radiation damage from the presence of trace amounts of U and Th in the zircon [35]. Aggregates are usually composed of fewer than 10 crystals. Notably, the M-6 sample is filled with larger white snowflake-like inclusions, which upon closer inspection, were found to be aggregates of dozens of small zircon crystals (Figure 9e). The tubular inclusions in the Madagascan samples often exist in multiple parallels and are finer (Figure 10f), which is significantly different from the tubular inclusions found in Vietnamese samples. Raman spectra that could be utilized were not obtained for this tube, but, based on the literature, it is speculated to be an etch tube.
Opaque solid inclusions often appear in flake-like or needle-tube shapes and frequently protrude from the surface (Figure 10). The Raman spectrum of a black opaque inclusion indicates graphite, with the graphite inclusions being flake-like, well crystallized, and large in grain size (Figure 10a,b). Some samples contain yellow-brown needle-tube inclusions, which may be growth tubes stained with iron compounds (Figure 10c), and the prominent growth tubes are characteristic of Madagascar sapphires [36]. Notably, sample M-10 has a large “bat”-shaped flake-like yellow-brown substance at its center. Due to the considerable depth of the inclusions, the acquisition of reliable Raman spectra was not feasible (Figure 10d).
Gas–liquid inclusions are visible in the samples; they exist in irregular granular, tubular, and fingerprint-like forms, among others. The arrangement of the tubular gas–liquid inclusions generally has a certain directionality (Figure 10e).

4.2. Spectra Analysis
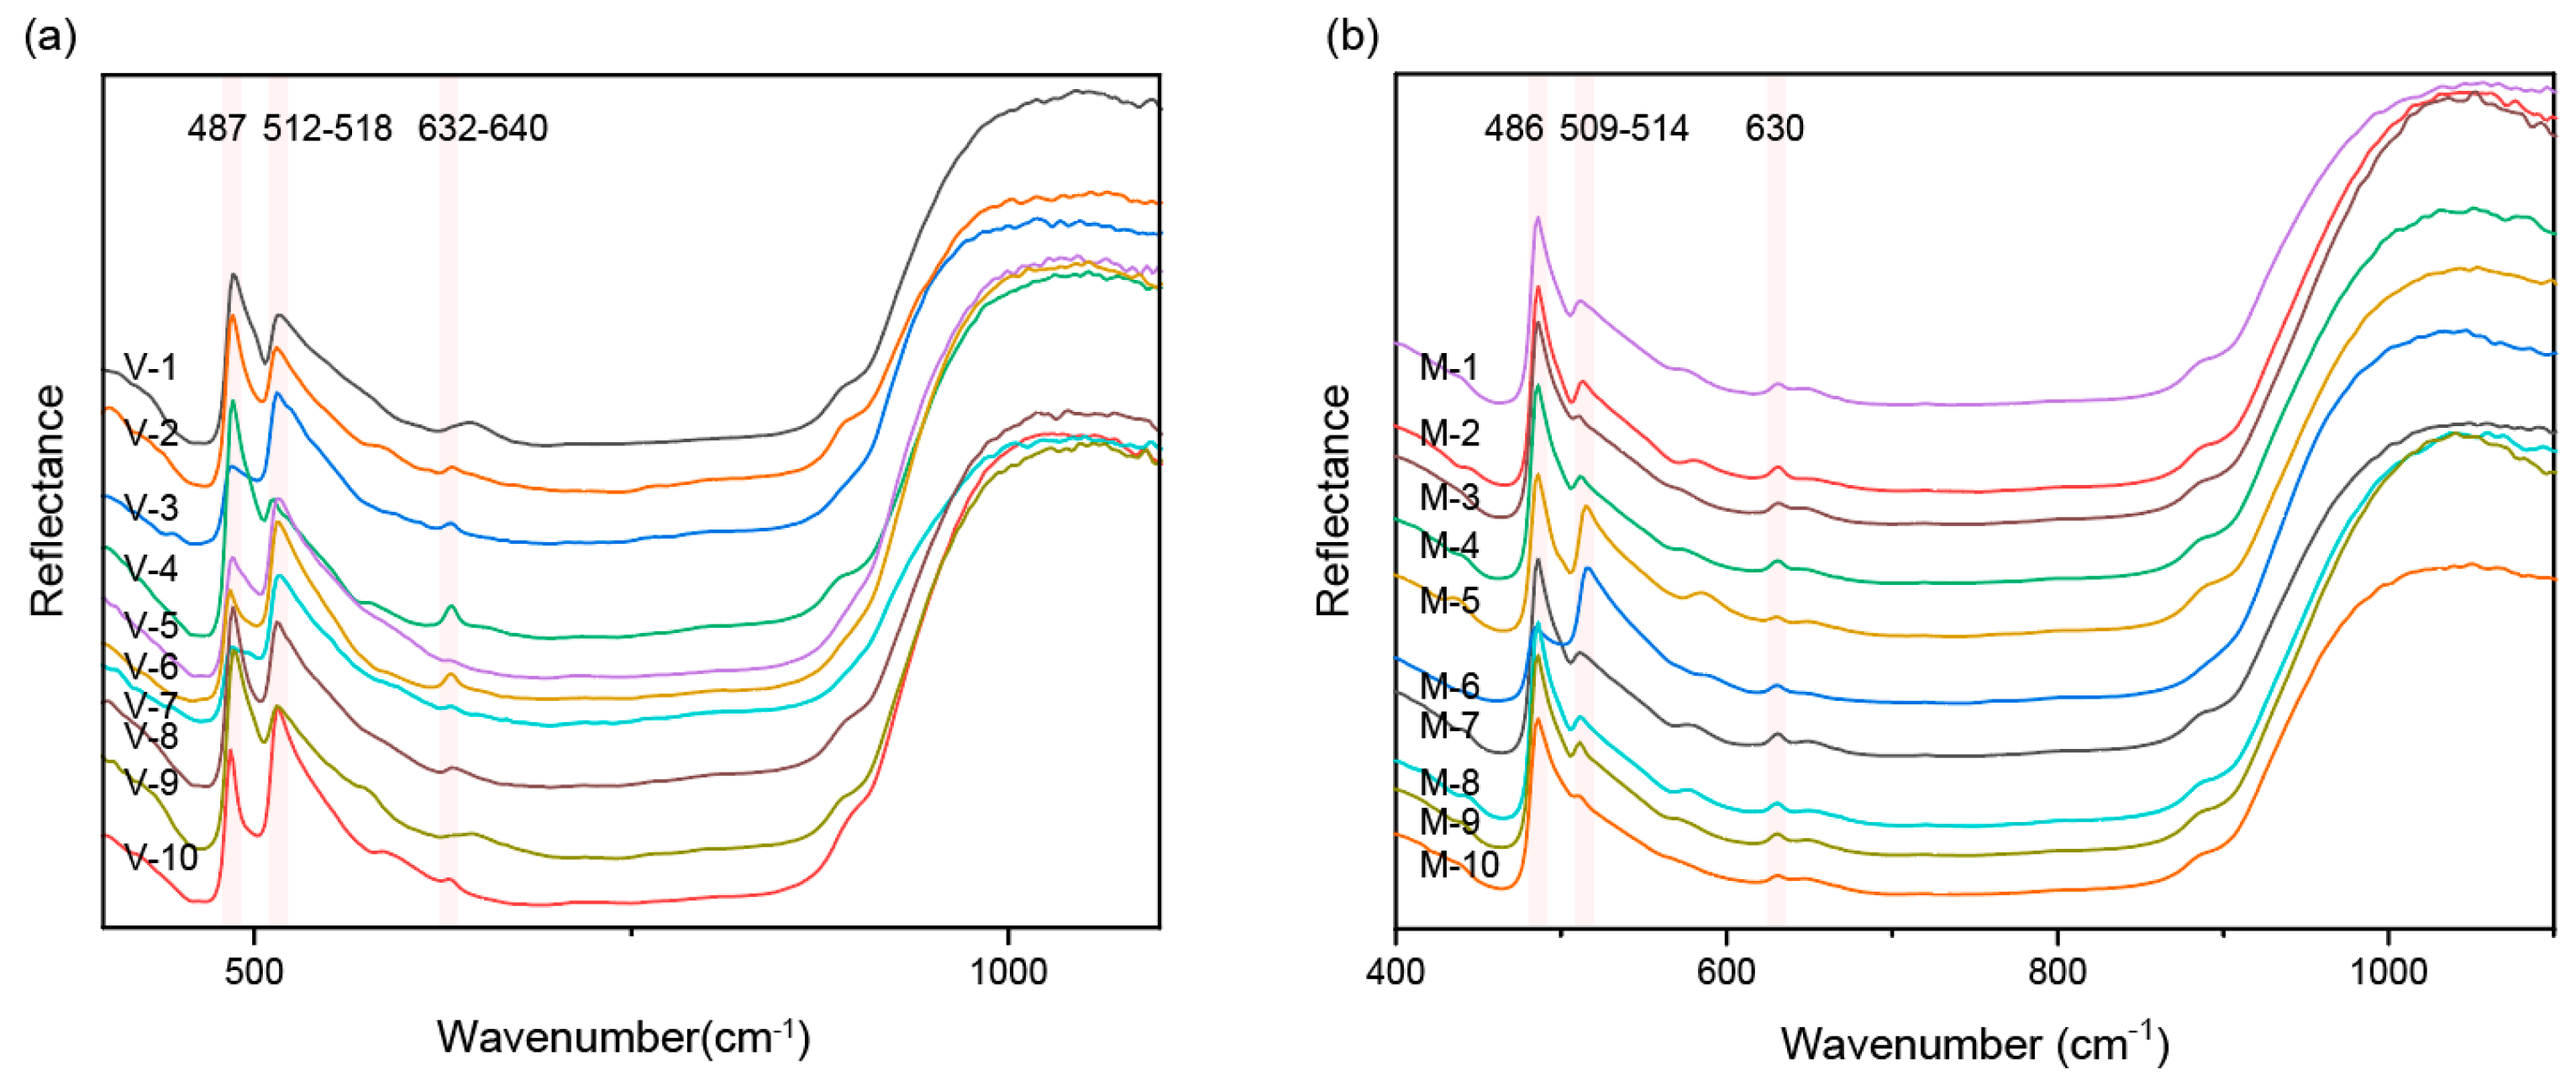
4.2.1. FTIR Spectra

The infrared spectra of the pink sapphires from Vietnam and Madagascar were measured (Figure 11). The infrared spectra of the samples from both origins show the corundum pattern, with the Vietnamese samples having a stronger band at 512–518 cm−1. The infrared spectra measured in this study show four absorption bands at 400–800 cm−1—a strong band at 487 cm−1, a strong band at 505–514 cm−1, a shoulder band at 570–586 cm−1, and a band at 630–640 cm−1—all of which are absorption bands of Al-O in Al2O3.
In the measured spectrum, the peak intensity changes significantly at 487 cm−1 and 509 cm−1. The observed spectral differences may arise from the isomorphic substitution of Al3+ by Fe3+ and Cr3+ in the crystal lattice. The disparity in ionic charges and radii between the substituting cations (Fe3+: 0.645 Å, Cr3+: 0.615 Å) and host Al3+ (0.535 Å) induces local distortion in the oxygen-coordinated octahedral sites, thereby reducing the symmetry of the coordination environment. This structural modification manifests spectroscopically as enhanced absorption intensity in the Vietnamese specimen (509–514 cm−1) compared to its Madagascan counterpart. The absorption band of the Vietnamese sample at 509–514 cm−1 is more significant than that of the Madagascan sample.

4.2.2. UV–Vis–NIR Spectra

The UV absorption spectra of the pink sapphires from Vietnam and Madagascar are shown in Figure 12. The samples from both places exhibit a shoulder peak at approximately 330 nm, an absorption band in the blue-purple area around 410 nm, and a broad absorption band in the yellow-green area around 560 nm. Additionally, minor absorption peaks are visible at 659, 668, and 693 nm. The transmission window, spanning 450–510 nm in the blue-green area of visible light and 615–700 nm in the red area, contributes to the pink hue of the sapphire. The darker the color of the sample, the higher the overall absorption intensity of the UV–Vis–NIR spectrum. The intensity difference between the broad band centered around 410 nm and 560 nm is large. While most of the samples demonstrate strong absorption in the yellow-green area, some samples also have strong absorption in the blue-purple area, which is potentially influenced by the cutting orientation. Furthermore, due to their larger size, the Madagascan samples display overall absorption intensity in the UV–Vis–NIR spectrum compared to the Vietnamese sample.
As the sample color shifts from pink to pink-purple, the maximum value of the spectrum peak at 560 nm shifts toward a high wavelength. Specifically, in the Vietnamese samples, the pink V-1 peaks at 566 nm, whereas the pink-purple sample V-10 has bands at 572 nm. In the Madagascan samples, the pink M-1 peaks at 558 nm at 560 nm, while the pink-purple sample M-10 peaks at 563 nm. The two absorption broad bands center at 414 nm and 560 nm in the Madagascan samples are shifted toward the short-wave direction relative to the Vietnamese samples, transmitting more blue light and making the gemstone have a more potent purple. In addition, a clear absorption peak can be observed at 388 nm in the Madagascan pink sapphires, while this peak is weakly present in the Vietnamese samples. The shoulder peak at 450 nm and the small absorption peaks at 659, 668, and 693 nm in the Vietnamese samples are more robust than those in the Madagascan samples.

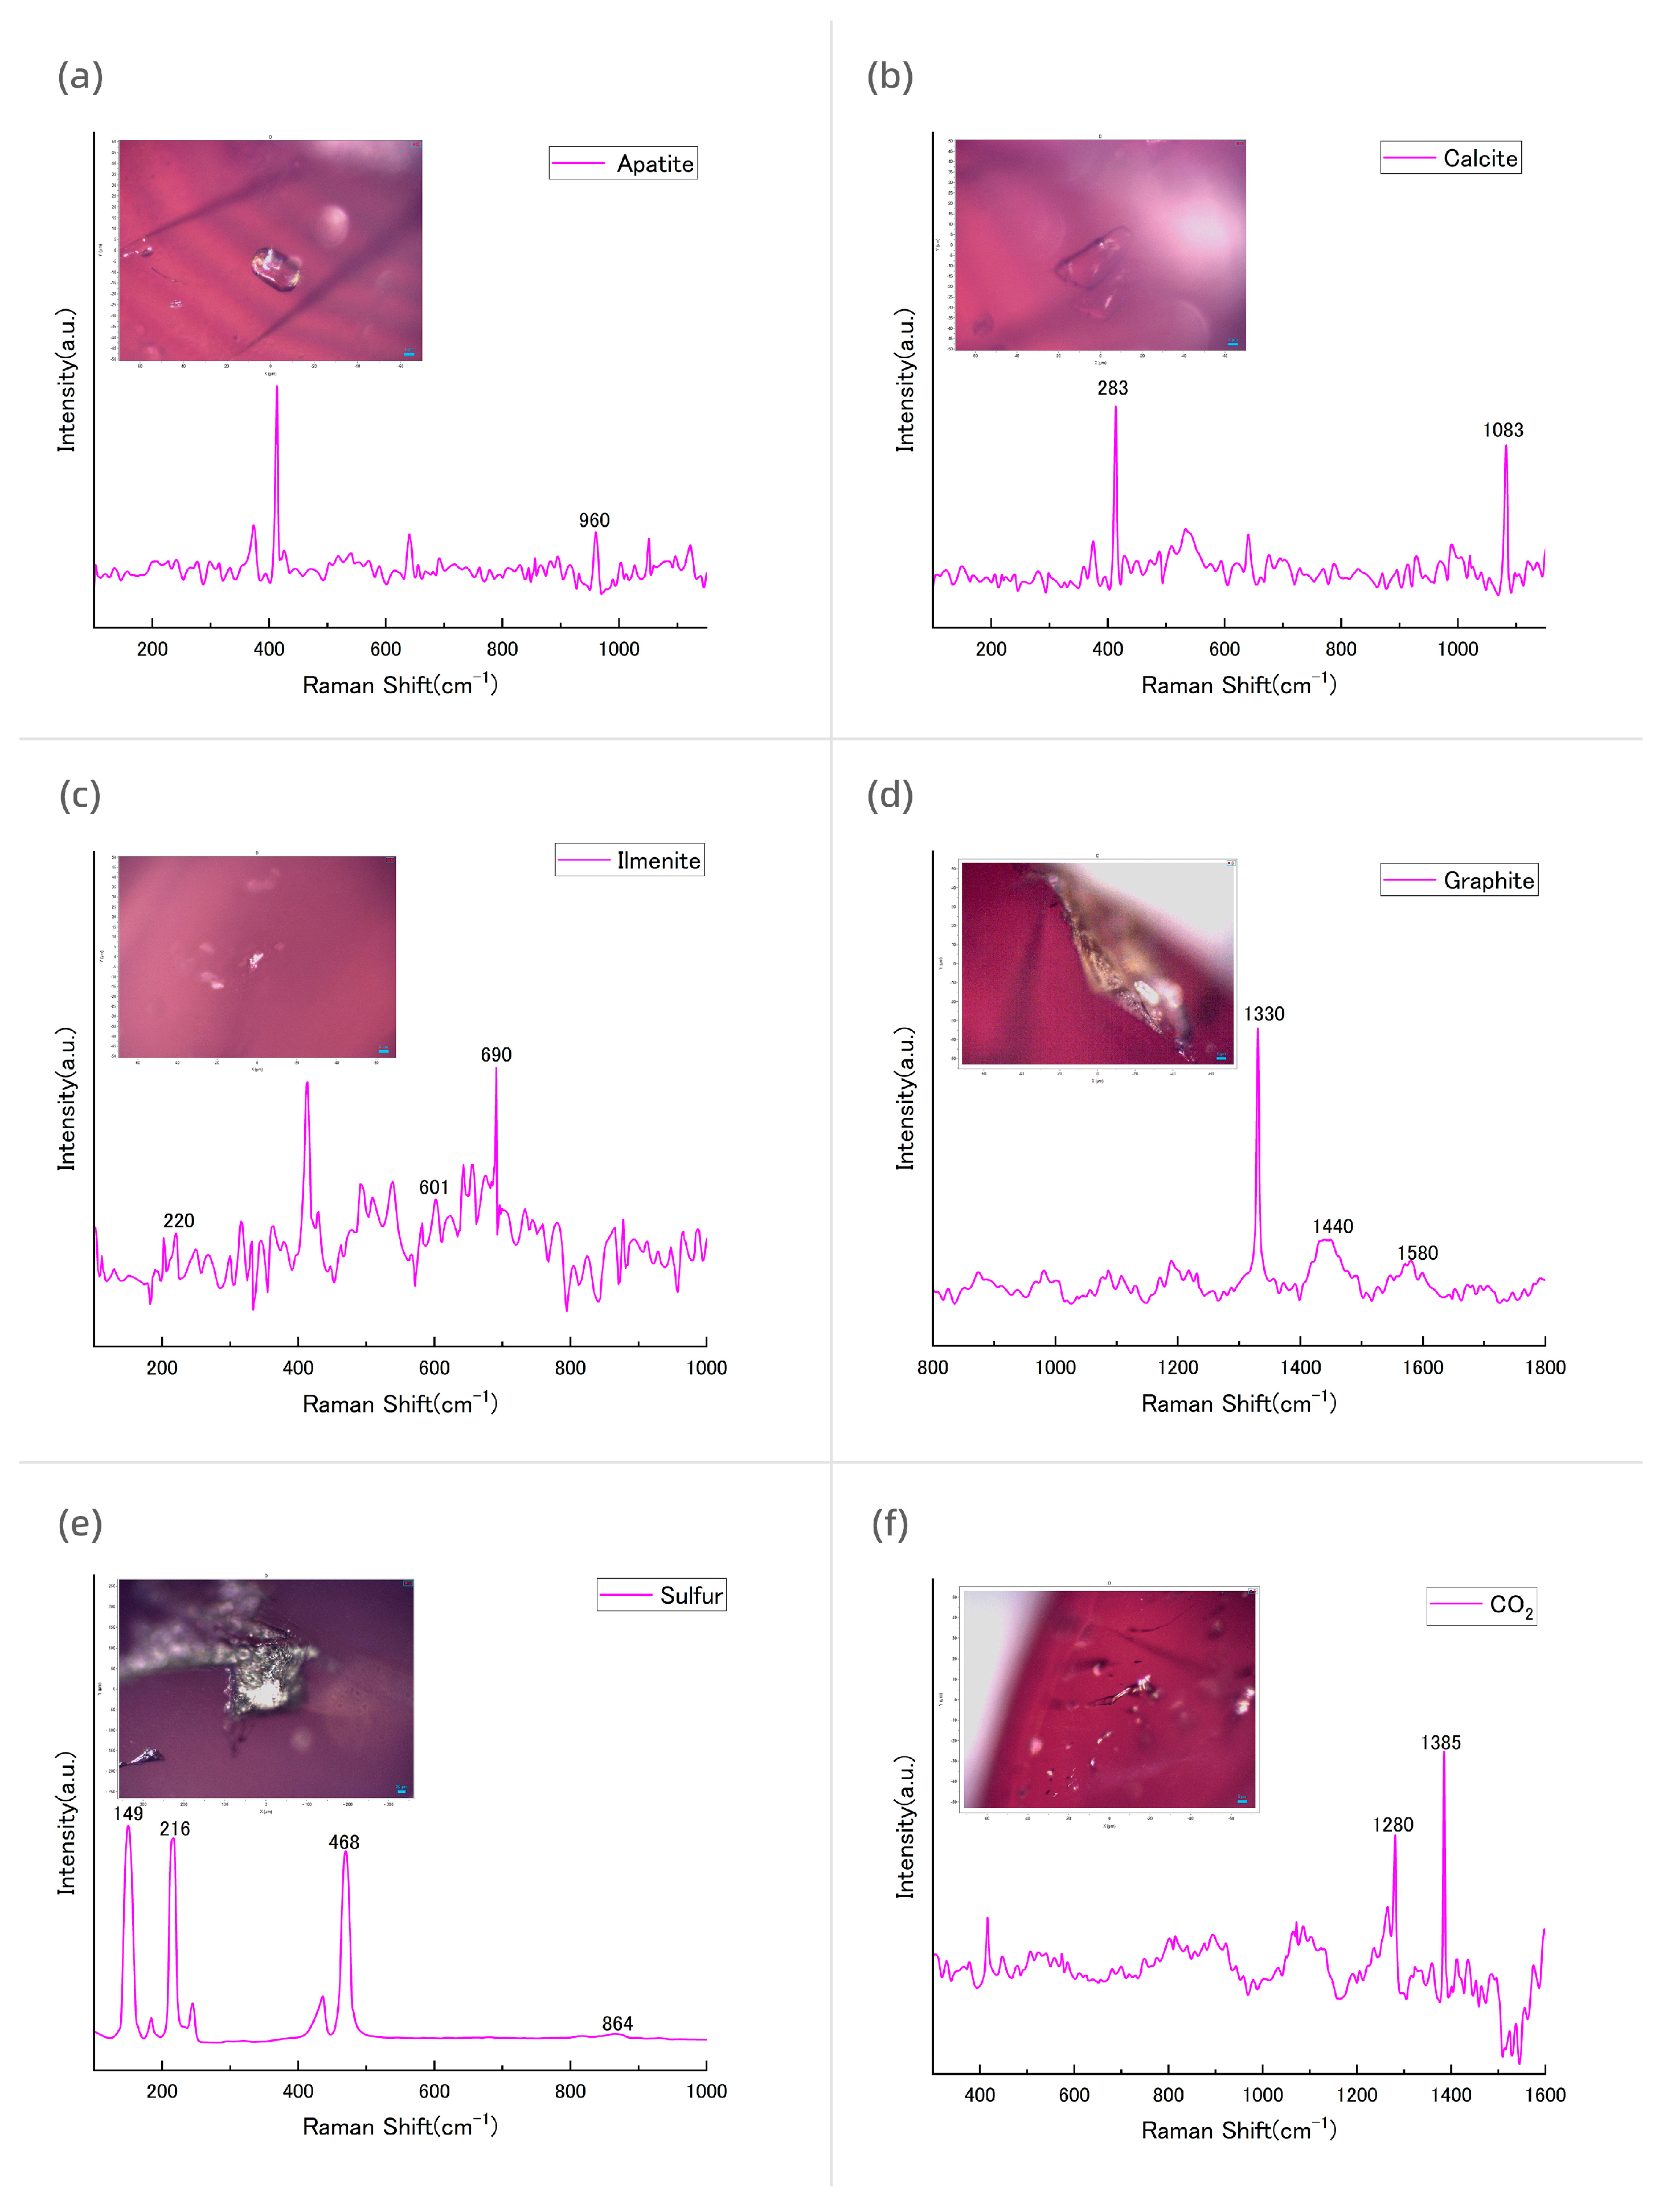
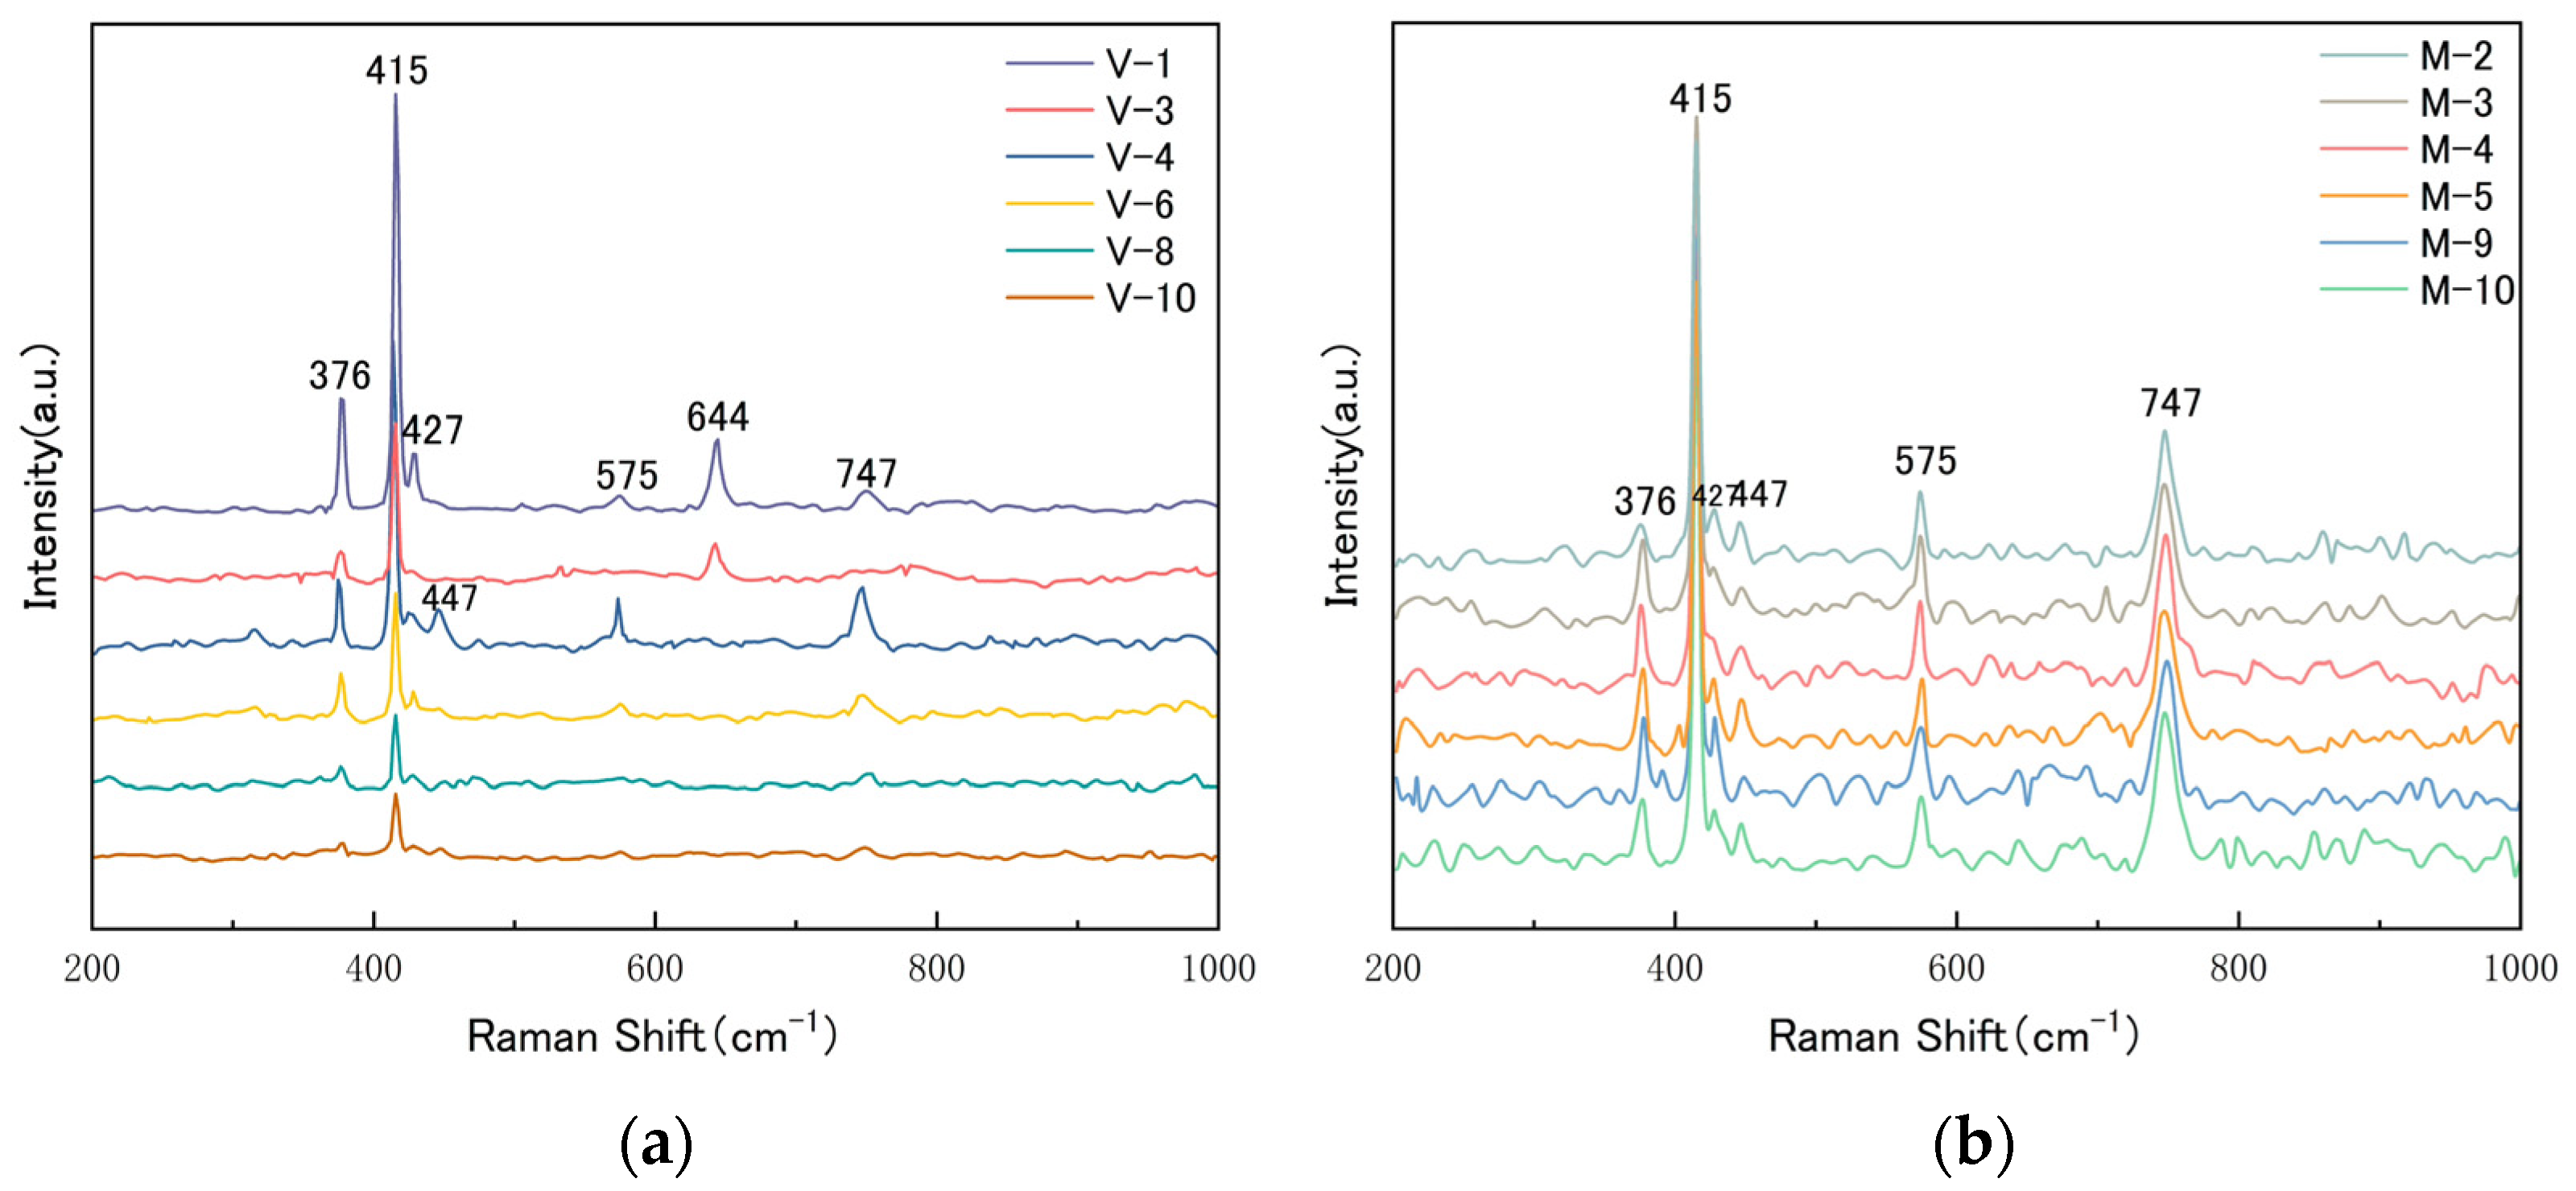
4.2.3. Raman Spectra

The Raman spectra of pink sapphires from Vietnam and Madagascar have a similar pattern (Figure 13). The purple sapphires from Vietnam and Madagascar both exhibit typical bands at 376 cm−1, 415 cm−1, 427 cm−1, 447 cm−1, 575 cm−1, and 747 cm−1. However, in some Vietnamese samples, the characteristic peaks at 447 cm−1 and 575 cm−1 disappear, and a new peak appears at 644 cm−1. This difference may be caused by the different relative angles between the laser beam and the samples, which are due to the anisotropy of the sapphires. The Raman spectra of the samples from both locations, as well as those reported in other studies, show significant similarities, with only slight differences in the intensity and wavenumber of the Raman peaks.
In corundum’s crystal structure, O2− ions are arranged in the densest hexagonal packing configuration along the direction perpendicular to the cubic axes, with Al3+ filling two-thirds of the octahedral voids formed by O2−. The [AlO6] octahedra are connected in plane along the optical axis direction and perpendicular to the optical axis. According to group theory analysis, the normal vibration modes of corundum are Tg = 2A1g + 3A2g + 5Eg + 2A1u + 2A2u + 4Eu, among which 2A1g and 5Eg are Raman-active. These correspond to the axial displacement of O2− (A1g and Eg), the oblique displacement of O2− (Eg), the displacement perpendicular to the secondary axis (Eg), and the displacement of Al3+ (A1g and 2Eg) [37]. Characteristic peaks were observed in the samples, where the peaks at 415 cm−1 and 644 cm−1 were mainly due to the A1g vibration mode of sapphire, and the peaks at 376 cm−1, 427 cm−1, 447 cm−1, 575 cm−1, and 745 cm−1 belonged to the Eg vibration mode of sapphire [38,39].

4.3. Chemical Compositions

The trace elements of the sapphires from Madagascar and Vietnam are displayed in Table 2. Inclusions were avoided in the selection of the experimental sampling points to prevent them from influencing the results. Elements such as Fe, Cr, Ti, and Ga may enter the crystalline structure of corundum and take the place of Al, while also becoming a part of the corundum structure, because of their similarities to Al. These trace elements can be highly advantageous in distinguishing sapphires from different locales, since they are closely related to the surrounding environment of the corundum.
As shown in Table 2, the samples from Vietnam (V-1 to V-10) contain below 0.73 (as shown in Table A1 in Appendix A) to 32.88 ppmw of Mg, 12.51 to 277.06 ppmw of Ti, 8.82 to 48.70 ppmw of V, 132.56 to 842.88 ppmw of Cr, bdl to 700.86 ppmw of Fe, and 10.25 to 74.49 ppmw of Ga (Table 2). The amounts of Mg, Ti, V, Cr, Fe, and Ga in the Madagascan samples (M-1 to M-10), respectively, ranged from 10.95 to 37.85 ppmw, 16.10 to 67.10 ppmw, 4.63 to 38.60 ppmw, 58.00 to 283.98 ppmw, 132.10 to 1281.26 ppmw, and 27.45 to 78.95 ppmw (Table 2). Compared with the Vietnamese pink sapphires, the Madagascan pink sapphires may contain more Fe and less Cr and Ti; meanwhile, in terms of the Mg, V, and Ga element content, the difference between the two is not significant. The coefficient of variation in Table 2 shows the uniformity of the element distribution of samples from different origins. The coefficient of variation of each element in the Vietnamese samples is higher than that in Madagascan samples, indicating that the chemical composition of the Vietnamese pink sapphires may vary more (Table 2).

5. Discussion

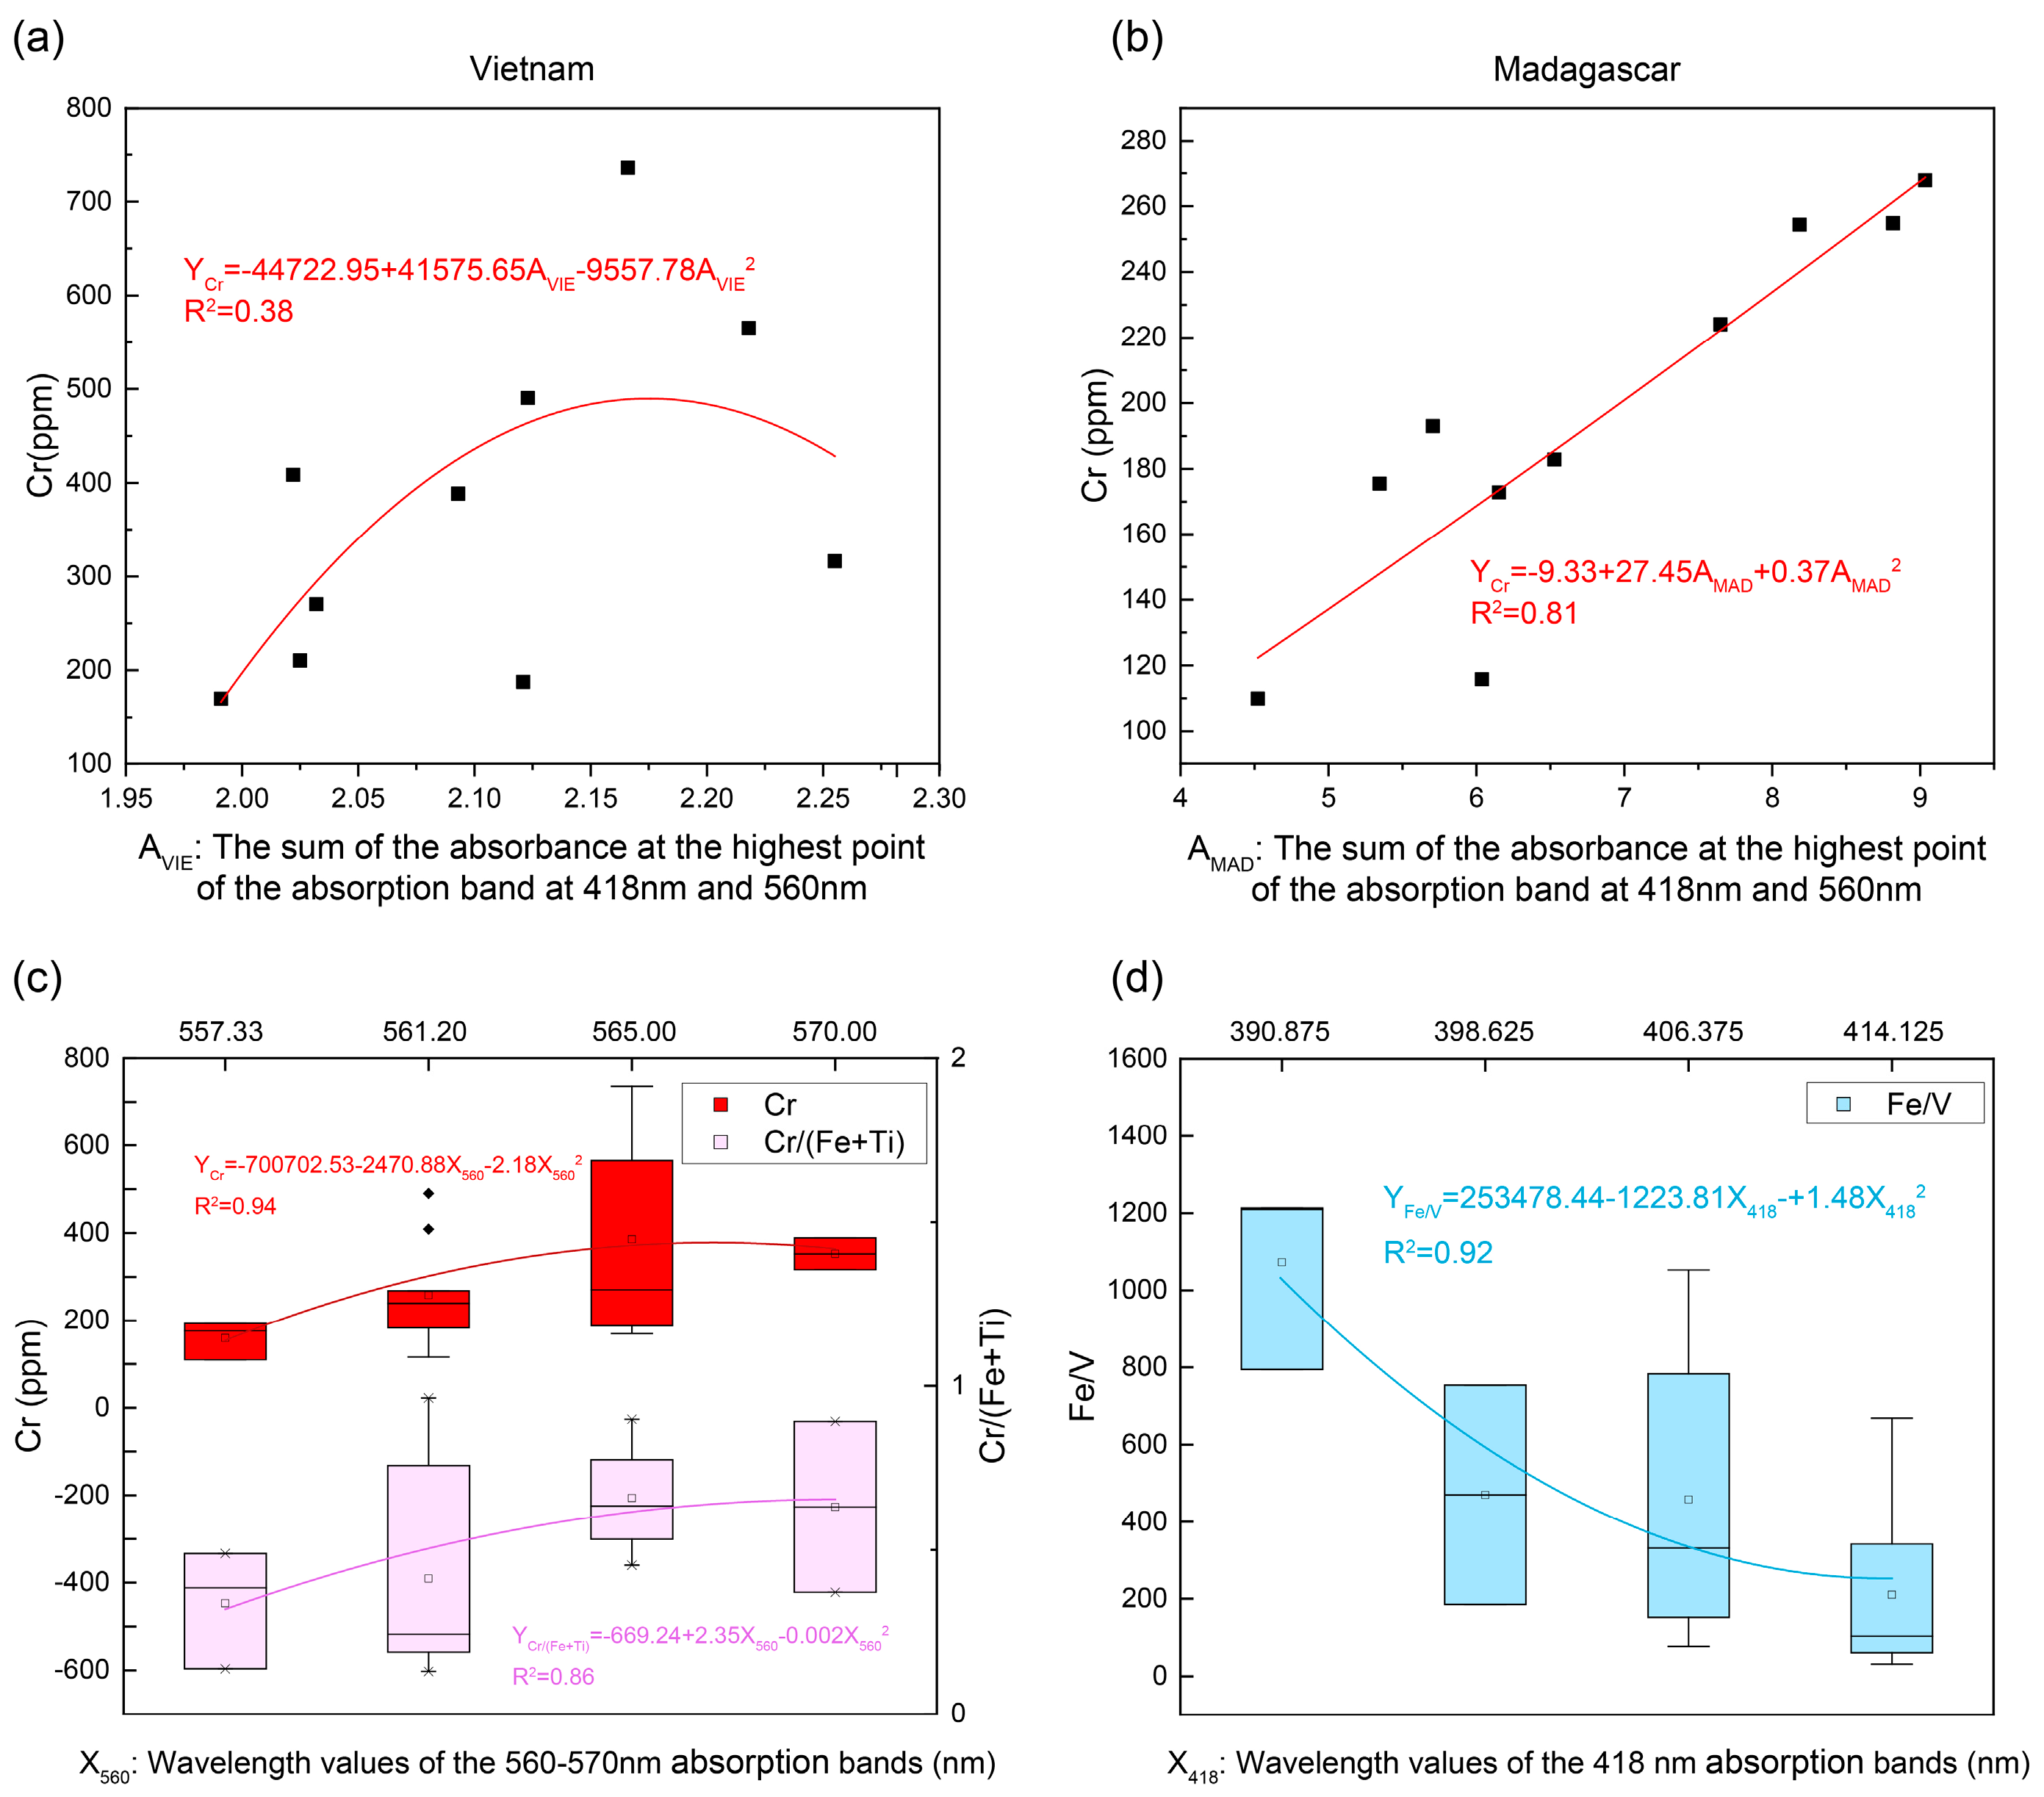
5.1. Analysis of the Coloration Mechanism and Special Appearance of Pink-Purple Sapphires

The absorption broadbands in the blue-purple region centered at 414 nm and the yellow-green region centered at 560 nm have a significant impact on the gems’ color, which comes from the d–d electronic transitions of Cr3+ from 4A24T2 and 4A24T1. However, they are also affected by Fe, Ti, and V [40]. The apparent absorption peaks of the Madagascan samples at 388 nm overlap with the Cr3+ absorption peak at 414 nm (Figure 14b), changing the absorption peak’s shape and shifting it to the short-wave direction. The absorption peak here is caused by the 6A14T2(D)d electronic transition of a single Fe3+ [40]. There are also peaks at 418 nm caused by the d–d transition of V3+ [41] and a weak shoulder peak caused by Fe at 450 nm in the vicinity [42], which may cause changes in the peak position and absorption intensity. The broad band at 560 nm overlaps with the absorption bands caused by Fe2+—Ti4+ and Fe3+—Ti3+ at 558 nm and the absorption band of the d–d electron transition of Ti3+ at 535 nm, resulting in changes in the width of the absorption peak and shifts to both long and short waves [40,43].
The experimental results show that the Cr content is positively correlated with the sum of the absorption intensities at 414 nm and 560 nm of the pink-purple sapphires, indicating that Cr is the main factor affecting the absorption at both locations. Due to the different sizes of the samples from Vietnam and Madagascar, the two sets of data are discussed separately. Figure 14a,b show the relationship between the Cr content and the absorption intensities at 414 nm and 560 nm of the pink-purple sapphires from Vietnam and Madagascar, respectively. The correlation in the Vietnamese samples is weak (R2 = 0.38), while the correlation in the Madagascan samples is strong (R2 = 0.81) (Figure 14a).
The absorption broad bands at 414 nm and 560 nm show shifts of different magnitudes. Here, the relationship between the peak shift and the chemical composition of the 20 samples is observed in its entirety. The wavelength of the highest point of the broad peak at 418 nm is recorded as X418, which shows a strong negative correlation with the ratio of Fe/V and the goodness of fit R2 = 0.92 (Figure 14d). This shows that, when the Fe content is greater than the V content, the spectrum peak shifts to a lower wavelength, and, when the V content is greater relative to the Fe content, the spectrum peak shifts to a higher wavelength. This is consistent with the data of the Fe3+ absorption peak at 388 nm and the V3+ absorption peak at 418 nm. The wavelength of the highest point of the broad peak at 560 nm is recorded as X560, which shows a positive correlation with the Cr content, R2 = 0.94 (Figure 14c). X560 and Cr/(Fe+Ti) are also positively correlated, with R2 = 0.86 (Figure 14c), indicating that Cr is a more critical factor in the shift; the more Fe+Ti content there is, the further the yellow-green zone broad band shifts to the short-wave direction. This is consistent with the absorption band data produced by Fe2+—Ti4+ and Fe3+—Ti3+ at 558 nm.
Absorption peaks that do not contribute much to color sometimes also have significance in origin identification. The Madagascar pink-purple sapphires have high iron content. The prominent 330 nm shoulder peak in the ultraviolet region and the apparent peak at 388 nm are related to the d–d transition of Fe3+—Fe3+, indicating the high iron content of the sample. Vietnamese pink-purple sapphires are marble-hosted, and the absorption peak caused by the d–d transition of Fe3+ is often more apparent at 450 nm [44]. The fluorescence emission peak caused by 2E→4A2 of Cr3+ at 693 nm is more evident in low-iron pink-red corundum, which is consistent with the observed results.
Compared to the pinkish-purple sapphires from Madagascar, some samples of pinkish-purple sapphires from Vietnam exhibit characteristic features: a cloudy appearance and orange iridescence when illuminated with fiber optic light. These characteristic appearances do not show a significant correlation with trace elements. Upon conducting microscopic analysis of the inclusions and the cloudy appearance and orange iridescence of all samples (Table 3), it was found that the cloudy appearance is caused by cloudy inclusions, and the intensity of the orange iridescence shows a strong correlation with the density of the cloudy inclusions, with no significant correlation to the yellowish-orange stains. It is speculated that the orange iridescence is caused by the scattering of light by the needle-shaped and dust-like fine particles that make up the cloudy inclusions [20].

5.2. Origin Identification

Classical measurements of the gemological properties of gems, together with chemical and isotopic “fingerprints” obtained by spectrometric techniques, have improved the discrimination of their origins [1,9,13].

5.2.1. Inclusions

The samples from Vietnam and Madagascar show distinct differences in their inclusions. The Vietnamese samples exhibit characteristic color zoning and cloudy inclusions. The Madagascan samples contain a large number of small, granular zircon crystals that are colorless and transparent, occurring both discretely and in clusters, with some displaying tension cracks, which are the main features of the pinkish-purple sapphires from Madagascar; meanwhile, the Vietnamese colorless transparent crystals are larger in size, fewer in number, and mostly occur individually, with Raman spectroscopy identifying calcite and apatite. Additionally, the needle-like inclusions in the Vietnamese samples are often present singly or in pairs, being relatively thick and long, whereas, in the Madagascan samples, multiple inclusions are present simultaneously; they are arranged in parallel, being finer. The fluid inclusions in the Vietnamese samples are mostly of a molten appearance, and almost all open fractures in the Vietnamese samples are stained with yellowish-orange iron, which is less common in the Madagascan samples.
Inclusions serve as indicators of geological conditions and can be an important basis for identifying the origin of gems. Referring to Palke’s classification method for rubies, the pinkish-purple sapphires can be roughly divided into marble-type and high-iron-type samples. The calcite and apatite in the Vietnamese samples are characteristic minerals of marble genesis, while the zircon in the Madagascan samples indicates that they originate from alkaline basalt, belonging to the high-iron type. By comparing the inclusions of pink-red corundum of both the marble type and high-iron type, more origin characteristics can be obtained.
Samples of pink-red corundum of the marble type from Vietnam were compared with those from other sources. The key characteristic of the pinkish-purple sapphires from Vietnam is their denser and rougher cloudy inclusions; the pink-red corundum from Mong Hsu in Myanmar and Afghanistan may also have cloudy inclusions, but those from Mong Hsu are usually smaller, and those from Afghanistan are darker. The pink-red corundum from Afghanistan often has characteristic hexagonal patterns [9,20]. The pink-red corundum from Mogok in Myanmar has arrow rutile needles, and the pink-red corundum from Yuanjiang has developed polysynthetic twinning and many fractures [43].
Samples of pink-red corundum of the high-iron type from Madagascar are compared with those from other sources. From the perspectives of gemology and geology, the pink-red corundum from Madagascar is most similar to that from Mozambique and Tanzania, which may both exhibit angular granular clouds, but the more characteristic and common inclusions in the Madagascan pinkish-purple sapphires are the widely distributed small granular zircons, especially clusters of zircons. The pink-red corundum from Mozambique commonly has gray–green amphibole and hexagonal mica flakes with stress-fractured edges and characteristic reflective flaky particle areas. In the pink-red corundum from Tanzania, straight and hexagonal growth structures are usually observed; they are often accompanied by small opaque inclusions and platy rutile [9,45]. The most prominent feature of the pink-red corundum from Thailand/Cambodia is the absence of rutile fibers and the presence of negative crystals, molten inclusions, and partially healed faded halos [9].
However, not every faceted gem contains inclusions that can be used to diagnose a specific origin. Even if microscopic observations cannot be used to reach a conclusion, their use in combination with trace element chemical composition analysis always provides the final evidence.

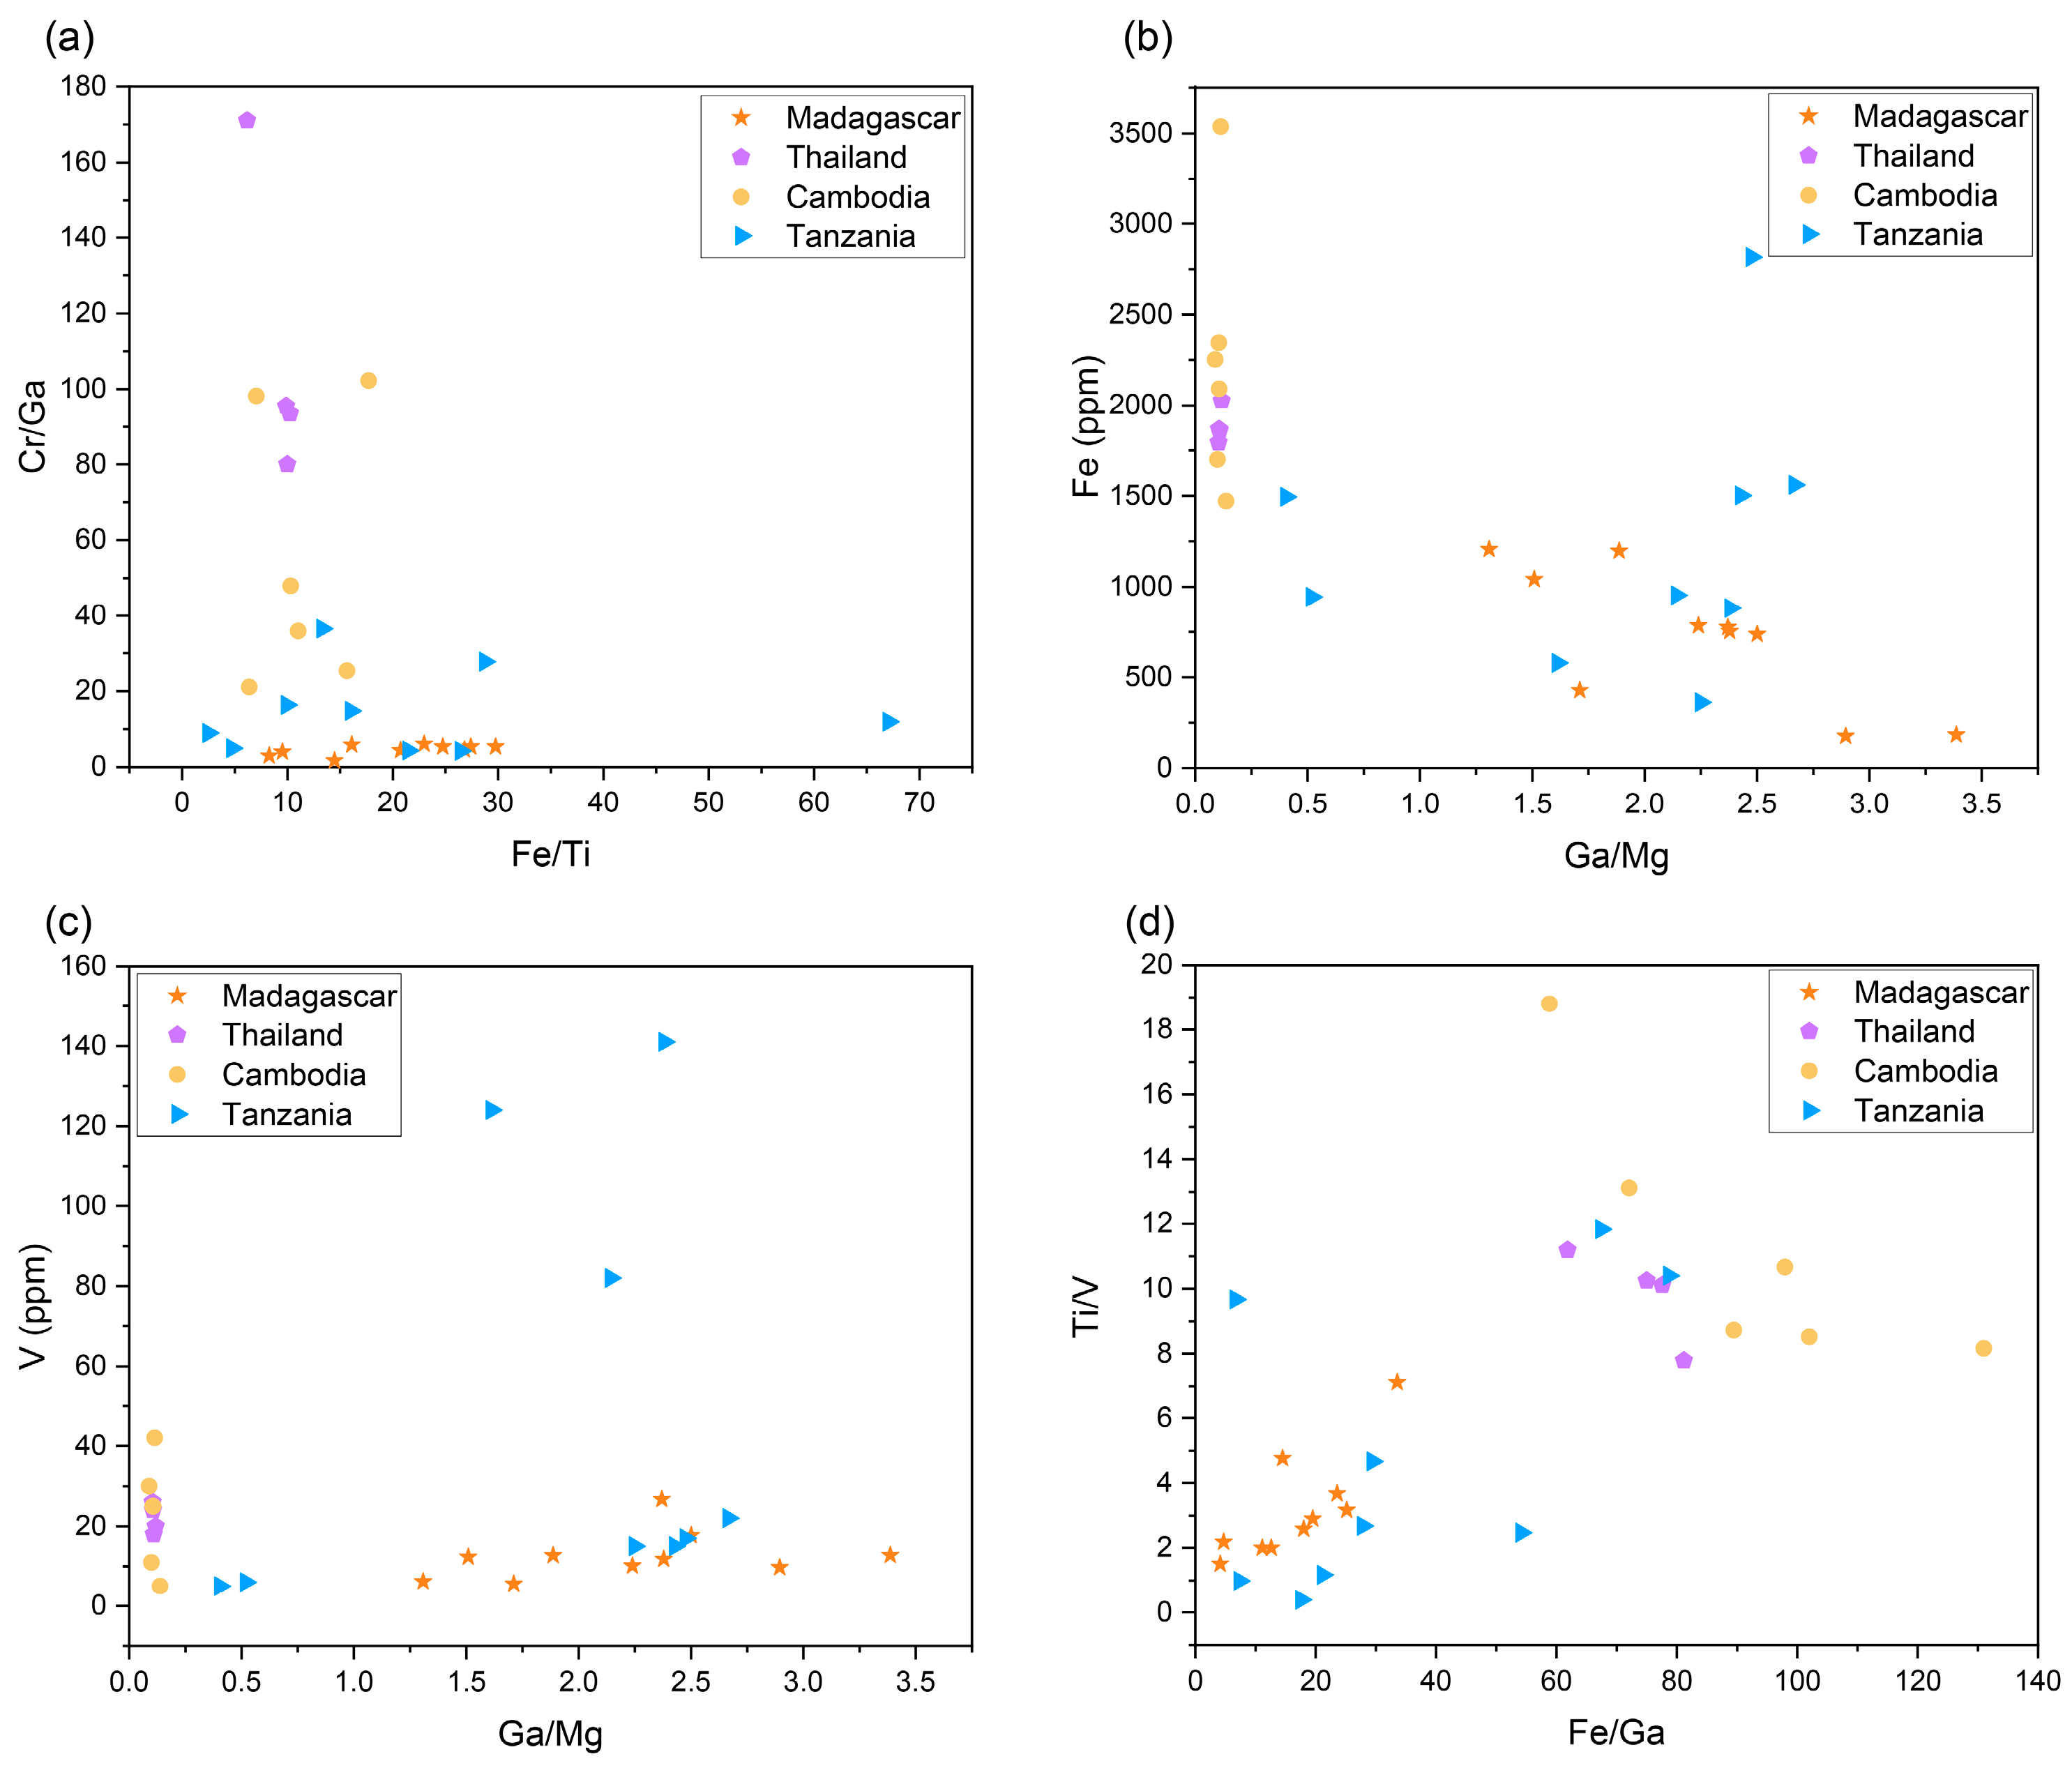
5.2.2. Chemical Composition Analysis

Trace elements reveal the origin of the colors of various corundum gems and serve as an essential basis for identifying their origins. Since pink sapphires contain a large amount of Cr, they can be roughly divided into marble-hosted pink sapphires and high-iron pink sapphires based on Palke’s classification of ruby origins [9]. Vietnamese sapphires, formed during the Himalayan orogeny, are marble-hosted pink sapphires with low Fe content [9,20], which resemble Southeast Asian and Central Asian rubies, despite the lower Cr content causing a lighter color (Figure 15a). The Madagascan samples are high-iron pink sapphires from alkaline basalt placers [8], sharing the same deposit type of rubies there, while they contain less Cr and Fe, which produces a lighter color (Figure 15b). Vietnamese and Madagascar pink sapphires can usually be distinguished by their trace elements, specifically by their Fe and Cr content (Figure 15c).
To characterize the trace element profiles of Vietnamese pink sapphires, comparative chemistry composition analysis was conducted on the Vietnamese samples and their marble-hosted pink-red counterparts from other locations. Marble-hosted pink-red corundum samples from Myanmar, Yuanjiang in Yunnan, China, and Vietnam all exhibit low Fe content. Notably, the red-pink corundum from Myanmar contains high concentrations of Ti (average 454 ppm), V (average 287 ppm), and Ga (average 72 ppm), as detailed in Table 4. A comparison of the contents of V, Mg, and Ga among the three types of marble-hosted red-pink corundum reveals that the Vietnamese sapphires have significantly lower contents of V and Mg (Figure 15d,e). Cr/Ga and Fe/Ti are standard trace element tools used for determining the deposit type of rubies [46]. Deposits with Fe/Ti ratios higher than 10 are classified as basalt deposits, while deposits with Fe/Ti ratios lower than 10 are marble-type deposits [47]. Figure 15f indicates that, except for two Vietnamese samples, all of the other samples from Vietnam and Yunnan are within the range of marble-hosted deposits. The Vietnamese samples contain more Fe and less Cr, resulting in a lighter red hue.
The chemical characteristics of high-iron pink sapphires from Madagascar were compared with those of high-iron red-pink corundum from Thailand, Cambodia, and Tanzania. The Madagascan samples exhibit lower trace element levels, except for Ga, compared to those of other origins (Table 5). Madagascan pink sapphires come from metamorphic rock deposits in the Ilakaka granulite area [13], and most of their Fe/Ti ratios are higher than 10 (Figure 16a). The Fe/Ti ratio of the high-iron red-pink corundum in Thailand and Cambodia is higher than ten and the gem is of basalt origin. A few samples with a Fe/Ti ratio lower than ten show that the red-pink corundum in Thailand and Cambodia is partially metamorphic. There is magmatic corundum in these two origins [48]. The Fe/Ti range of the Tanzanian red-pink corundum overlaps with Madagascar’s, but a higher Cr content results in higher Cr/Ga ratios (Figure 16a).
The Ga/Mg ratio and total Ga concentration are also often regarded as discriminant factors in the origin of gem-grade corundum. Corundum with a “metamorphic” origin usually has a low Ga value (<100 ppm) and Ga/Mg < 3 [49]. Figure 16b, c show that the Ga/Mg ratio of red-pink corundum from Thailand and Cambodia is very low because the Mg content is relatively high. The Ga/Mg ratio of red-pink corundum from Tanzania and Madagascar, which are also metamorphic in origin, is significantly higher. In addition, the red-pink corundum from Thailand and Cambodia has a higher Fe content, making it easier to distinguish from Madagascar sapphire. The Fe/Ga and Ti/V ratio diagram is another way to distinguish the origin of corundum (Figure 16d). When the Fe/Ga ratio is >75, it is basaltic corundum [47]. The red-pink corundum from Thailand and Cambodia differs from the samples from Tanzania and Madagascar.

6. Conclusions

This study comprised a comprehensive analysis of 20 pink-purple sapphires from Vietnam and Madagascar, utilizing basic gemological tests, microscopic inclusion observations, and LA-ICP-MS chemical composition analysis, as well as Raman, infrared, and UV–Vis–NIR spectroscopy.
There are obvious differences in the inclusions of purple sapphire between the Vietnamese and Madagascan samples. The main features of the inclusions in the Vietnamese samples are white and blue bands, cloudy inclusions, and extensive orange staining. The fine-grained rutile cloudy inclusions among them are thought to give them a foggy appearance and an orange iridescent color effect. Apatite and calcite, characteristic minerals of the marble type, were also found. The Madagascan samples, on the other hand, are characterized by the presence of large quantities of ubiquitous zircon, especially zircon clusters, indicating an alkaline basalt genesis.
The chromogenic element of the Vietnamese and Madagascan pink-purple sapphires is Cr3+. The Vietnamese samples are further influenced by V3+ transitions, reflecting more blue light for a more purple hue, while the Madagascan samples are affected by Fe3+ and Fe2+ transitions, reflecting more blue and red-orange light, respectively. The high iron content suppresses Cr3+ fluorescence at 693nm, making this absorption peak more prominent in the Vietnamese samples, aiding in the identification of their origins. The Fe content can be used to distinguish between pink-purple sapphires from Madagascar and Vietnam. Concentrations of V, Mg, and Ga are good chemical ‘‘fingerprints’’ for distinguishing Vietnamese pink-purple sapphire from other types of marble-hosted pink-red corundum. The Ga content serves as a distinctive identifier that sets Madagascan pink-purple sapphire apart from other varieties of high-iron-type pink-red corundum.

Author Contributions

Conceptualization, Q.G. and M.W.; methodology, Q.G. and M.W.; resources, M.W.; data curation, Q.G. and P.L.; writing—original draft preparation, Q.G. and P.L.; software, Q.G. and P.L.; visualization, Q.G., P.L. and S.Y.; writing—review and editing, Q.G., P.L., M.W., S.Z. and G.S.; supervision, M.W.; funding acquisition, M.W. and G.S. All authors have read and agreed to the published version of the manuscript.

Funding

Funding was provided by the National Natural Science Foundation of China (Grant No. 42273044).

Data Availability Statement

Data are contained within the article.

Acknowledgments

We thank the Gem Testing Laboratory within the School of Gemology, CUGB, and the Guild Gem Laboratory (Shenzhen) for providing the experimental conditions and instruments.

Conflicts of Interest

The authors declare no conflicts of interest.

Appendix A

Table A1. Detection limits of LA-ICP-MS (ppm).
Elements (ppm)Detection Limits
Mg0.73
Ti0.44
V0.08
Cr1.76
Fe25.55
Ga0.12

References

  1. Pornwilard, M.M.; Hansawek, R.; Shiowatana, J.; Siripinyanond, A. Geographical Origin Classification of Gem Corundum Using Elemental Fingerprint Analysis by Laser Ablation Inductively Coupled Plasma Mass Spectrometry. Int. J. Mass Spectrom. 2011, 306, 57–62. [Google Scholar] [CrossRef]
  2. Sutherland, F.; Zaw, K.; Meffre, S.; Thompson, J.; Goemann, K.; Thu, K.; Nu, T.; Zin, M.; Harris, S. Diversity in Ruby Geochemistry and Its Inclusions: Intra- and Inter- Continental Comparisons from Myanmar and Eastern Australia. Minerals 2019, 9, 28. [Google Scholar] [CrossRef]
  3. Li, E.; Xu, B. Gemological and Chemical Composition Characteristics of Basalt-Related Rubies from Chanthaburi-Trat, Thailand. Crystals 2023, 13, 1179. [Google Scholar] [CrossRef]
  4. Cooper, A.; Palke, A.C. Rare Intense Purplish Pink Montana SAPPHIRE. Gems Gemol. 2020, 56, 522. [Google Scholar]
  5. Rakotondrazafy, A.F.M.; Giuliani, G.; Ohnenstetter, D.; Fallick, A.E.; Rakotosamizanany, S.; Andriamamonjy, A.; Ralantoarison, T.; Razanatseheno, M.; Offant, Y.; Garnier, V.; et al. Gem Corundum Deposits of Madagascar: A Review. Ore Geol. Rev. 2008, 34, 134–154. [Google Scholar] [CrossRef]
  6. Winotai, P.; Wichan, T.; Tang, I.M.; Yaokulbode, J. Heat treatments of Tanzania ruby as monitored by ESR spectroscopy. Int. J. Mod. Phys. B 2000, 14, 1693–1700. [Google Scholar] [CrossRef]
  7. Nassau, K. Heat Treating Ruby and Sapphire: Technical Aspects. Gems Gemol. 1981, 17, 121–131. [Google Scholar] [CrossRef]
  8. Giuliani, G.; Groat, L.A. Geology of Corundum and Emerald Gem Deposits: A Review. Gems Gemol. 2019, 55, 464–489. [Google Scholar] [CrossRef]
  9. Palke, A.C.; Saeseaw, S.; Renfro, N.D.; Sun, Z.; McClure, S.F. Geographic Origin Determination of Ruby. Gems Gemol. 2019, 55, 580–613. [Google Scholar] [CrossRef]
  10. Giuliani, G.; Ohnenstetter, D.; Fallick, A.E.; Groat, L.; Fagan, A. The Geology and Genesis of Gem Corundum Deposits. In Geology of Gem Deposits; Mineralogical Association of Canada: Sudbury, ON, Candada, 2014; ISBN 978-0-921294-54-2. [Google Scholar]
  11. Devouard, B.; Notari, F. The Identification of Faceted Gemstones: From the Naked Eye to Laboratory Techniques. Elements 2009, 5, 163–168. [Google Scholar] [CrossRef]
  12. Rossman, G.R. The Geochemistry of Gems and Its Relevance to Gemology: Different Traces, Different Prices. Elements 2009, 5, 159–162. [Google Scholar] [CrossRef]
  13. Giuliani, G.; Fallick, A.; Rakotondrazafy, M.; Ohnenstetter, D.; Andriamamonjy, A.; Ralantoarison, T.; Rakotosamizanany, S.; Razanatseheno, M.; Offant, Y.; Garnier, V.; et al. Oxygen isotope systematics of gem corundum deposits in Madagascar: Relevance for their geological origin. Miner. Depos. 2007, 42, 251–270. [Google Scholar] [CrossRef]
  14. Kochelek, K.; Mcmillan, N.; McManus, C.; Daniel, D. Provenance Determination of Sapphires and Rubies Using Laser-Induced Breakdown Spectroscopy and Multivariate Analysis. Am. Mineral. 2015, 100, 1921–1931. [Google Scholar] [CrossRef]
  15. Keulen, N.; Thomsen, T.B.; Schumacher, J.C.; Poulsen, M.D.; Kalvig, P.; Vennemann, T.; Salimi, R. Formation, Origin and Geographic Typing of Corundum (Ruby and Pink Sapphire) from the Fiskenæsset Complex, Greenland. Lithos 2020, 366–367, 105536. [Google Scholar] [CrossRef]
  16. Sutherland, F.L.; Giuliani, G.; Fallick, A.E.; Garland, M.; Webb, G. Sapphire–ruby characteristics west Pailin, Cambodia. Aust. Gemol. 2008, 23, 329–368. Available online: https://www.researchgate.net/publication/285867432_Sapphire-ruby_characteristics_west_Pailin_Cambodia (accessed on 2 November 2024).
  17. Smith, C.P. Rubies and pink sapphires from the Pamir Mountain Range in Tajikistan, former USSR. Gemmology 1998, 26, 104–109. Available online: https://gem-a.com/wp-content/uploads/2023/11/JoG1998_26_2.pdf#page=41 (accessed on 3 November 2024). [CrossRef]
  18. Santosh, M.; Katori, R.; Yoshikura, S.; Higash, S.; Salim, A.K. Pink Sapphire from Southern Kerala, S. India: Implications on India-Madagascar Correlation Within Gondwana Assembly. Gondwana Res. 2002, 5, 894–901. [Google Scholar] [CrossRef]
  19. Saminpanya, S.; Sutherland, F.L. Different Origins of Thai Area Sapphire and Ruby, Derived from Mineral Inclusions and Co-Existing Minerals. Eur. J. Mineral. 2011, 23, 683–694. [Google Scholar] [CrossRef]
  20. Kane, R.E.; McClure, S.F.; Kammerling, R.C.; Khoa, N.D.; Mora, C.; Repetto, S.; Khai, N.D.; Koivula, J.I. Rubies and Fancy Sapphires from Vietnam. Gems Gemol. 1991, 27, 136–155. [Google Scholar] [CrossRef]
  21. Khoi, N.N.; Sutthirat, C.; Tuan, D.A.; Van Nam, N.; Thuyet, N.T.M.; Nhung, N.T. Ruby and Sapphire from the Tan Huong-Truc Lau Area, Yen Bai Province, Northern Vietnam. Gems Gemol. 2011, 47, 182–195. [Google Scholar] [CrossRef]
  22. Karampelas, S.; Hennebois, U.; Mevellec, J.-Y.; Pardieu, V.; Delaunay, A.; Fritsch, E. Pink to Purple Sapphires from Ilakaka, Madagascar: Insights to Separate Unheated from Heated Samples. Minerals 2023, 13, 704. [Google Scholar] [CrossRef]
  23. Garnier, V.; Ohnenstetter, D.; Giuliani, G.; Maluski, H.; Deloule, E.; Trong, T.P.; Van, L.P.; Quang, V.H. Age and Significance of ruby-bearing marble from the red river shear zone, northern Vietnam. Can. Mineral. 2005, 43, 1315–1329. [Google Scholar] [CrossRef]
  24. Leloup, P.H.; Arnaud, N.; Lacassin, R.; Kienast, J.R.; Harrison, T.M.; Trong, T.T.P.; Replumaz, A.; Tapponnier, P. New Constraints on the Structure, Thermochronology, and Timing of the Ailao Shan-Red River Shear Zone, SE Asia. J. Geophys. Res. 2001, 106, 6683–6732. [Google Scholar] [CrossRef]
  25. Zhang, J.; Lu, T.; Chen, H. Characteristics of Coated Jadeite Jade. Gems Gemol. 2014, 49, 246–251. [Google Scholar] [CrossRef]
  26. Hughes, E.B.; Perkins, R. Madagascar Sapphire: Low-Temperature Heat Treatment Experiements. Gems Gemol. 2019, 55, 184–197. [Google Scholar] [CrossRef]
  27. Pardieu, V.; Vertriest, W.; Weeramonkhonlert, V.; Raynaud, V.; Atikarnsakul, U.; Perkins, R. Sapphires from the Gem Rush Bemainty Area, Ambatondrazaka (Madagascar); GIA Laboratory: Bangkok, Thailand, 2017. [Google Scholar]
  28. GIA Field Gemology Team Explores Sapphire Mines at Ilakaka, Madagascar. Available online: https://www.gia.edu/gia-news-research/sapphire-mines-ilakaka-madagascar-field-expedition (accessed on 13 November 2024).
  29. Xu, B.; Yin, R.-S.; Chiaradia, M.; Miao, Z.; Griffin, W.L.; Hou, Z.-Q.; Yang, Z.-M.; O’Reilly, S.Y. Mercury Isotope Evidence for the Importance of Recycled Fluids in Collisional Ore Systems. Sci. Adv. 2024, 10, eadp7383. [Google Scholar] [CrossRef]
  30. Xu, B.; Hou, Z.-Q.; Griffin, W.L.; Zheng, Y.-C.; Wang, T.; Guo, Z.; Hou, J.; Santosh, M.; O’Reilly, S.Y. Cenozoic Lithospheric Architecture and Metallogenesis in Southeastern Tibet. Earth-Sci. Rev. 2021, 214, 103472. [Google Scholar] [CrossRef]
  31. Xu, B.; Hou, Z.-Q.; Griffin, W.L.; Lu, Y.; Belousova, E.; Xu, J.-F.; O’Reilly, S.Y. Recycled Volatiles Determine Fertility of Porphyry Deposits in Collisional Settings. Am. Mineral. 2021, 106, 656–661. [Google Scholar] [CrossRef]
  32. Xu, B.; Hou, Z.-Q.; Griffin, W.L.; Yu, J.-X.; Long, T.; Zhao, Y.; Wang, T.; Fu, B.; Belousova, E.; O’Reilly, S.Y. Apatite Halogens and Sr-O and Zircon Hf-O Isotopes: Recycled Volatiles in Jurassic Porphyry Ore Systems in Southern Tibet. Chem. Geol. 2022, 605, 120924. [Google Scholar] [CrossRef]
  33. Wang, A.; Kuebler, K.E.; Jolliff, B.L.; Haskin, L.A. Raman Spectroscopy of Fe-Ti-Cr-Oxides, Case Study: Martian Meteorite EETA79001. Am. Mineral. 2004, 89, 665–680. [Google Scholar] [CrossRef]
  34. Palke, A.C.; Saeseaw, S.; Renfro, N.D.; Sun, Z.; McClure, S.F. Geographic Origin Determination of Blue Sapphire. Gems Gemol. 2019, 55, 536–579. [Google Scholar] [CrossRef]
  35. Xu, W.; Krzemnicki, M. Raman Spectroscopic Investigation of Zircon in Gem-quality Sapphire: Application in Origin Determination. J. Raman Spectrosc. 2021, 52, 1011–1021. [Google Scholar] [CrossRef]
  36. Growth Tube Cluster in Sapphire. Gems Gemol. 2017, 53, 369–372. Available online: https://www.gia.edu/gems-gemology/fall-2017-microworld-growth-tube-cluster-sapphire (accessed on 13 November 2024).
  37. Giuliani, G.; Dubessy, J.; Banks, D.A.; Lhomme, T.; Ohnenstetter, D. Fluid Inclusions in Ruby from Asian Marble Deposits: Genetic Implications. Eur. J. Mineral. 2015, 27, 393–404. [Google Scholar] [CrossRef]
  38. Zu, E.D.; Sun, Y.D.; Zhang, P.X. The analysis of natural and synthetic ruby by Raman spectra. Spectrosc. Spectr. Anal. 2010, 30, 2164–2166. [Google Scholar] [CrossRef]
  39. Sorokina, E.S.; Litvinenko, A.K.; Hofmeister, W.; Häger, T.; Jacob, D.E.; Nasriddinov, Z.Z. Rubies and sapphires from Snezhnoe, Tajikistan. Gems Gemol. 2015, 51, 160–175. [Google Scholar] [CrossRef]
  40. Yimeng, Z.H.; Jingcheng, P.E.; Xiaojing, L.A. Gemmological and Spectral Characteristics of Ruby from Winza, Tanzania. J. Gems Gemmol. 2024, 26, 1–11. [Google Scholar] [CrossRef]
  41. Vertriest, W.; Saeseaw, S. A Decade of Ruby from Mozambique: A Review. Gems Gemol. 2019, 55, 162–183. [Google Scholar] [CrossRef]
  42. Rubies from the Montepuez Area. Available online: https://www.gia.edu/gia-rubies-from-montepuez-area (accessed on 13 November 2024).
  43. Leiqi, Y. Study on Gemological and Mineralogical Characteristics and Genesis of Red Corundum in Yuanjiang, Yunnan. Master’s Thesis, China University of Geosciences, Beijing, China, May 2021. [Google Scholar]
  44. Fengchun, L.; Yan, L.; Guyuan, D. Characteristics of low-and high-iron ruby and its significance for origin identification. Superhard Mater. Eng. 2024, 36, 62–67. [Google Scholar]
  45. Gao, Y.; He, M.; Lucas, A.C.; Sun, X.; Zhou, D.; Huang, T.; Li, K.; Fortaleché, D.; Lin, M.; Zhu, Y.; et al. Ruby from Longido, Tanzania: Mining, Color, Inclusion, and Chemical Features. Crystals 2024, 14, 383. [Google Scholar] [CrossRef]
  46. Saminpaya, S.; Manning, D.; Droop, G.T.R.; Henderson, C.M.B. Trace Elements in Thai Gem Corundums. J. Gemmol. 2003, 28, 392–398. [Google Scholar] [CrossRef]
  47. Chulapakorn, T.; Intarasiri, S.; Bootkul, D.; Singkarat, S. Identification of Deposit Types of Natural Corundum by PIXE. Nucl. Instrum. Methods Phys. Res. Sect. B Beam Interact. Mater. At. 2014, 331, 108–112. [Google Scholar] [CrossRef]
  48. Palke, A.C.; Wong, J.; Verdel, C.; Ávila, J.N. A Common Origin for Thai/Cambodian Rubies and Blue and Violet Sapphires from Yogo Gulch, Montana, USA? Am. Mineral. 2018, 103, 469–479. [Google Scholar] [CrossRef]
  49. Peucat, J.J.; Ruffault, P.; Fritsch, E.; Bouhnik-Le Coz, M.; Simonet, C.; Lasnier, B. Ga/Mg Ratio as a New Geochemical Tool to Differentiate Magmatic from Metamorphic Blue Sapphires. Lithos 2007, 98, 261–274. [Google Scholar] [CrossRef]
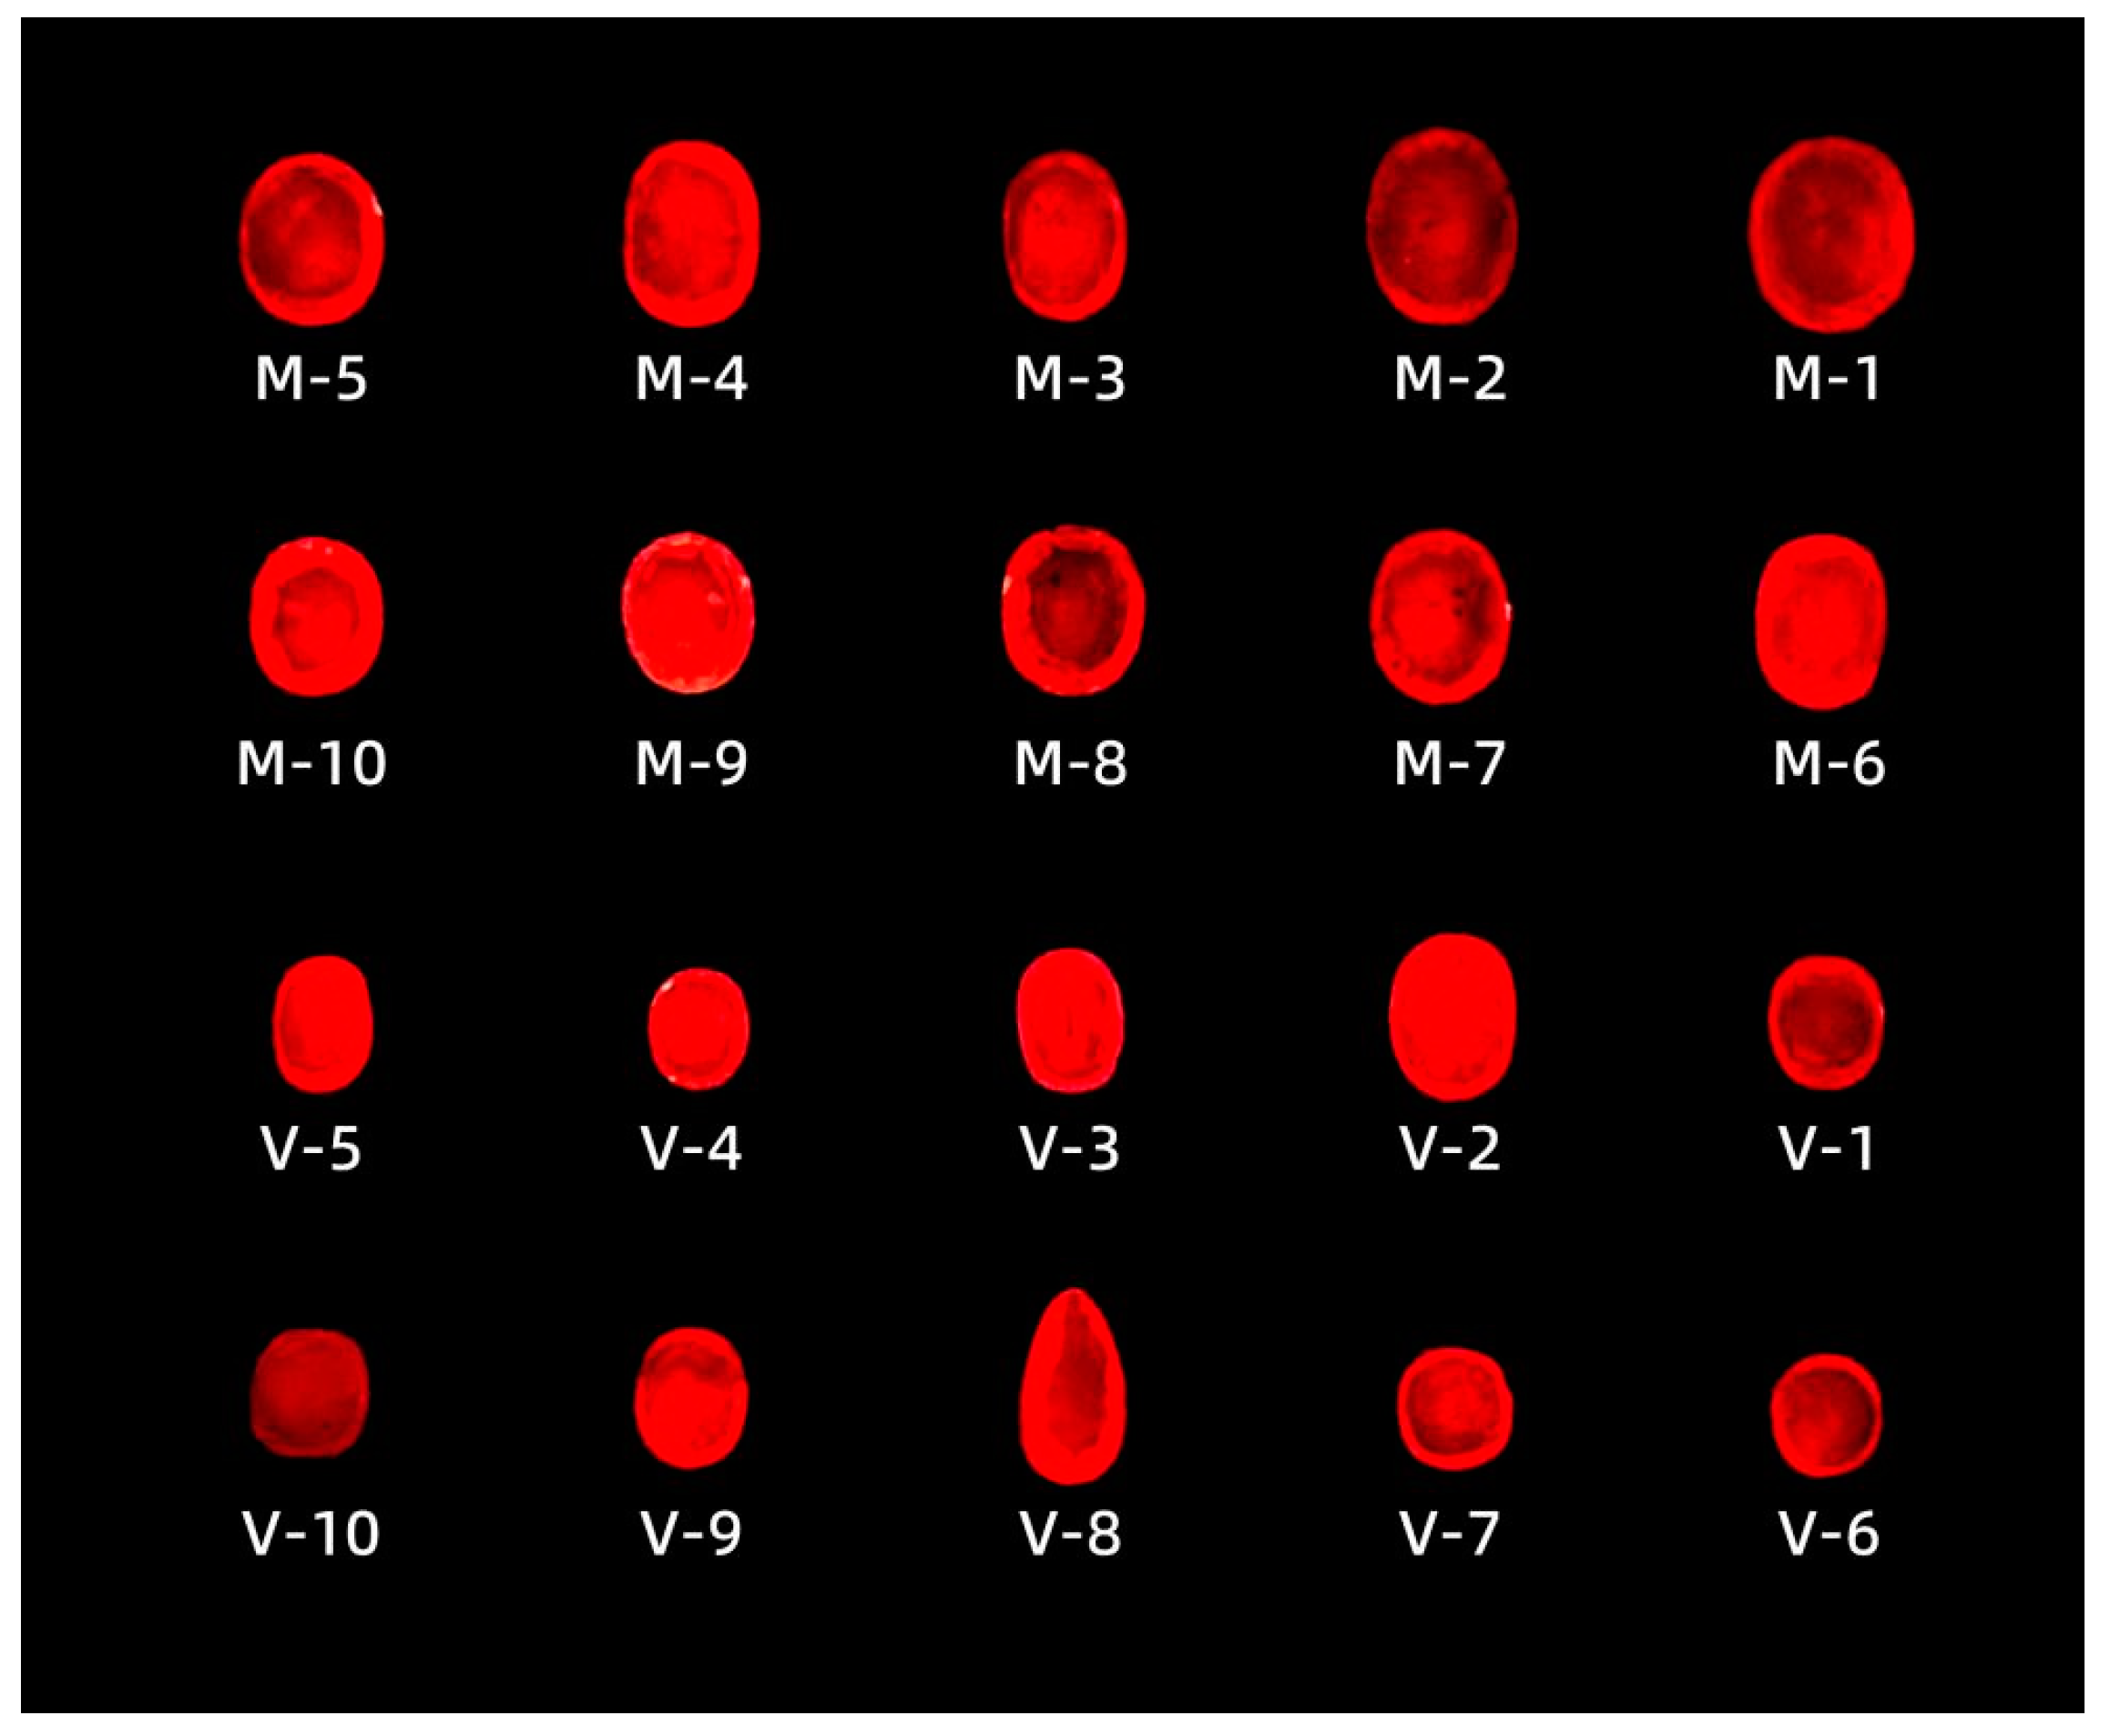
Figure 1. A world map of the geographical origins of the samples: Luc Yen of Vietnam and Ilakaka of Madagascar.
Crystals 15 00229 g001
Figure 2. A geological map of the Lo Gam District of Luc Yen. This was adapted from Blue Spinel from the Luc Yen District of Vietnam.
Crystals 15 00229 g002
Figure 3. A simplified geological map of Madagascar, showing the main tectonic units of the Precambrian basement and the main metamorphic ruby and sapphire deposits [27].
Crystals 15 00229 g003
Figure 4. The 20 pink-purple sapphire samples collected and examined in this study.
Crystals 15 00229 g004
Figure 5. Red fluorescence of the pink sapphire samples under long-wave ultraviolet light.
Crystals 15 00229 g005
Figure 6. Inclusions detected using Raman spectroscopy in samples from Vietnam: (a) apatite inclusion and its Raman spectrum; (b) calcite inclusion and its Raman spectrum; (c) ilmenite inclusion and its Raman spectrum; (d) graphite inclusion and its Raman spectrum; (e) sulfur inclusion and its Raman spectrum; (f) elongated gas–liquid inclusions and Raman bands of their CO2 vibration modes.
Crystals 15 00229 g006
Figure 7. Various inclusions found in Vietnamese samples: (a) dark, elongated prismatic mineral inclusions with larger grain sizes, accompanied by healed fractures and cloudy inclusions; (b) two long, parallel, tubular objects that are thick; (c) inclusions filled with fluid and gas and yellow-orange staining healed fractures; (d) yellowish-orange stain-like inclusions in the fissure; (e) white and blue-striped area; (f) transparent and blue-striped area.
Crystals 15 00229 g007
Figure 8. The cloudy inclusions and orange iridescence in the Vietnamese samples: (a) (V-3) cloudy inclusion composed of uniformly distributed fine particles, appearing blue under fiber optic light; (b,d,e) (V-5,8) cloudy inclusions composed of larger white particles, with indistinct contours and areas of varying density. Upon further magnification, (c,f) are shown to be composed of various sizes and lengths of needle-like structures and fine particles; (g,h) Vietnamese samples V-3 and V-5 exhibiting orange iridescence; (i,j) Vietnamese samples V-8 and V-9 without the appearance of orange iridescence; (k) Madagascan samples without the appearance of orange iridescence.
Crystals 15 00229 g008
Figure 9. Colorless transparent solid inclusions in the Madagascan samples: (a) the Madagascan samples are filled with colorless transparent crystal inclusions; (b) prismatic, hexagonal plate-like colorless transparent crystal inclusions; (ce) isolated zircon, zircon with tension cracks, and clusters of zircon; (f) their Raman spectra.
Crystals 15 00229 g009
Figure 10. Colorless opaque inclusions, fluid inclusions, and acicular inclusions in the Madagascan samples: (a) graphite inclusions and (b) their Raman spectrum; (c) long needle-like inclusions filled with yellow–brown material; (d) bat-shaped yellow–brown flake-like inclusions; (e) oriented tubular gas–liquid inclusions; (f) parallel needle-like inclusions.
Crystals 15 00229 g010
Figure 11. FTIR spectra of samples from (a) Vietnam and (b) Madagascar.
Crystals 15 00229 g011
Figure 12. UV–Vis–NIR spectra of samples from (a) Vietnam and (b) Madagascar.
Crystals 15 00229 g012
Figure 13. Raman spectra of samples from (a) Vietnam and (b) Madagascar.
Crystals 15 00229 g013
Figure 14. (a) Relationship between AVIE and Cr contents in samples from Vietnam; (b) relationship between AMAD and Cr contents in samples from Madagascar; (c) relationship between X560 and Cr and Fe+Ti contents in 20 samples; (d) relationship between X418 and the values of Fe/V in 20 samples.
Crystals 15 00229 g014
Figure 15. (a) Cr and V components of pink sapphires from Vietnam and rubies of the same geographic origin; (b) Cr and Fe components of Madagascan pink sapphires and rubies of the same geographic origin; (c) LA-ICP-MS data for the main trace element analysis of the 20 sapphire samples; (d) the relationship between the Mg and V content of Vietnamese pink-purple sapphires and pink and red corundum from Yunnan and Myanmar; (e) the relationship between the Ga and V content of Vietnamese pink-purple sapphires and pink and red corundum from Yunnan and Myanmar; (f) the relationship between the ratio of Cr/Ga and Fe/Ti of Vietnamese pink-purple sapphires and pink and red corundum from Yunnan and Myanmar.
Crystals 15 00229 g015
Figure 16. (a) The relationship between the ratio of Cr/Ga and Fe/Ti of Madagascar pink-purple sapphire and pink and red corundum from Thailand, Cambodia, and Tanzania; (b) the relationship between the ratio of Ga/Mg and Fe content of Madagascar pink-purple sapphire and pink and red corundum from Thailand, Cambodia, and Tanzania; (c) the relationship between the ratio of Ga/Mg and V content of Madagascar pink-purple sapphire and pink and red corundum from Thailand, Cambodia, and Tanzania; (d) the relationship between the ratio of Fe/Ga and Ti/V of Madagascar pink-purple sapphire and pink and red corundum from Thailand, Cambodia, and Tanzania.
Crystals 15 00229 g016
Table 1. Basic information of the 20 sapphire samples.
MadagascarM-1M-2M-3M-4M-5M-6M-7M-8M-9M-10
ColorLight pinkPinkPinkPinkPurplish pinkPurplish pinkPinkish purplePinkish purplePinkish purpleDark pinkish purple
DiaphaneityTransparent
SG3.943.953.974.043.9443.963.8943.98
No Ne1.765 1.7581.767 1.7591.768 1.7601.768 1.7601.769 1.7601.769 1.7611.768 1.7601.768 1.7601.769 1.7611.767 1.759
Weight (Ct)1.060.790.741.041.090.961.10 0.991.561.59
LW UVRed fluorescence
SW UVInert
VietnamV-1V-2V-3V-4V-5V-6V-7V-8V-9V-10
ColorLight pinkLight pinkPinkPinkPinkPinkPinkPurplish pinkPurplish pinkPurple
DiaphaneitySemitransparentSemitransparentSemitransparentTransparentSemitransparentTransparentTransparentTransparentTransparentSemitransparent
SG4.13.9844.064.0544.1444.123.78
No Ne1.766 1.7591.767 1.7591.766 1.7601.766 1.7591.768 1.7601.767 1.7591.765 1.7591.765 1.7591.765 1.7591.766 1.760
Ct0.450.480.3650.3650.4450.360.4550.520.5150.605
LW UVRed fluorescence
SW UVInert
Table 2. The main trace elements (ppm) of the sapphires from Madagascar and Vietnam examined in this study using LA-ICP-MS.
Madagascar
Trace Elements (ppm)MgTiVCrFeGa
Range10.95–37.8516.10–67.104.63–38.608.00–283.98132.10–1281.2627.45–78.95
X21.3434.5412.56195.11728.0744.88
S4.866.823.7635.42222.307.72
CV22.78%19.76%29.93%18.16%30.53%17.21%
Vietnam
Trace Elements (ppm)MgTiVCrFeGa
Rangebdl–32.8812.51–277.068.82–48.70132.56–842.88bdl–700.8610.25–74.49
X10.8582.0221.73374.32167.3129.56
S9.1861.219.54182.57197.2217.14
CV84.62%74.63%43.91%48.77%117.87%58.00%
X = average. S = standard deviation. CV = coefficient of variation.
Table 3. The relationship between inclusions observed under a microscope and the characteristic appearance of Vietnamese stones (foggy appearance and orange iridescence).
Foggy AppearanceCloudy InclusionOrange IridescenceYellowish-Orange Stains
V-1
V-2
V-3√ (Thick, fine)√ (Obvious)Medi
V-4MediMediMedi×
V-5√ (Thick, finer)√ (Obvious)
V-6MediMediMediMedi
V-7×××Medi
V-8×√ (Larger particles)××
V-9×××
V-10Medi
M-(1–10)×××
Table 4. Mean value (ppm) of the LA-ICP-MS test results for marble-hosted pink-to-red corundum.
Trace Elements (ppm)MgTiVCrFeGa
Vietnam10.8582.0221.73374.32167.3129.56
Yunnan [43]29.9363.3870.624928.0885.7141.83
Myanmar [2]64.00454.00287.003072.0092.0072.00
Table 5. Mean value (ppm) of the LA-ICP-MS test results for pink-to-red corundum of metamorphic origin.
Trace Elements (ppm)MgTiVCrFeGa
Madagascar21.3434.5412.56195.11728.0744.88
Thailand [1]236.25216.2522.002905.251887.0025.75
Cambodia [1]226.50232.3323.001260.832233.0024.33
Tanzania [1]98.14180.4272.822122.60865.5239.73
Disclaimer/Publisher’s Note: The statements, opinions and data contained in all publications are solely those of the individual author(s) and contributor(s) and not of MDPI and/or the editor(s). MDPI and/or the editor(s) disclaim responsibility for any injury to people or property resulting from any ideas, methods, instructions or products referred to in the content.

