Abstract
The mechanical properties of steel are intricately connected to their composition and service temperature. Predicting these properties across different work temperatures using traditional statistical methods, algorithms, and equations is highly challenging due to these complex interdependencies. To address this, we developed an artificial-neural-network (ANN) model to elucidate the relationships between composition, temperature, and mechanical properties of 5Cr-0.5Mo steels. Our model demonstrated high accuracy, with minimal percentage errors in predicting YS, UTS, and El (%)—3.5%, 0.97%, and 1.9%, respectively. The ANN predictions are realistic and closely match the experimental results. We propose an easy-to-use model’s GUI to predict steel composition to achieve desired properties at any temperature. The ANN model’s findings offer valuable insights for researchers and designers, aiding in developing steel components with optimized properties. This technique is expected to significantly enhance the planning of practical experiments and improve material performance overall.
1. Introduction
The drive to improve the thermal efficiency of power-plant components has led to the development of Cr-Mo steels as important construction materials. These steels are highly valued for their excellent mechanical properties at elevated temperatures and their strong resistance to corrosion, making them ideal for use in high-stress, high-heat environments [1]. Such steels are used in components like heater tubes, vessels, and pipes, where temperatures typically range from 300 to 650 °C and are subjected to high stresses over extended periods of around 30 years [2]. The main objective of these steel components is to function reliably throughout their lifespan. An analysis of material failures in the power generation sector indicates that 81% of these failures are attributed to high-temperature exposure, predominantly influenced by mechanical factors. Within this category, 65% of failures are attributed to short-term material failures, such as tensile, compressive, flexural, and shear failures [3].
Conversely, a smaller proportion (~9%) is due to long-term exposures related explicitly to creep phenomena [4]. The mechanical properties of materials are highly dependent on alloying additions and operating temperatures [5,6,7]. Prolonged exposure to high temperatures can precipitate various secondary phases and carbides [8,9,10]. These precipitation and microstructural changes can have a notable impact on the ultimate mechanical properties of the material [11,12]. The grain size of austenite also influences the final mechanical properties of the steels [13]. Furthermore, certain alloying additions have the potential to segregate along grain boundaries, which can significantly influence the mechanical properties of the material [14]. Investigating the effect of each alloying element through experimental methods and assessing its influence on mechanical properties at different temperatures is impractical and would be significantly time-consuming, labor-intensive, and costly. In a similar vein, designing steel compositions that achieve the desired properties over an extended period is also highly challenging [15]. Recent regulations to reduce greenhouse gas emissions in the power sector [16] have made accurate lifespan prediction of these materials even more crucial. Therefore, any new technique or model that can significantly reduce costs by minimizing the number of experimental trials during the design phase is highly welcomed in materials science. Due to the rapid advancements in computational power and intelligent algorithms in recent years, data-driven methods are now commonly used to predict the behavior of structural materials. The significance of such methods lies in their ability to establish correlations among interdependent parameters, like composition and operating temperature, thereby enabling researchers to comprehend these intricate relationships effortlessly [17]. This capability aids in effectively guiding actual experiments, facilitating a more streamlined approach to research and development.
Machine-learning techniques, particularly artificial neural networks (ANNs), have been widely used to predict various alloy systems’ mechanical behavior, as documented in several studies [18,19,20,21,22]. Specifically, ANN models have been applied to forecast the mechanical properties of vessel steels [23,24], austenitic stainless steels [25], maraging steels [26], and cast alloys [27]. The creep behavior of Cr-Mo steel has also been reported by the magnetic Barkhausen emission technique [28]. However, the impact of composition and service temperature on the tensile properties of 5Cr-0.5Mo steel systems requires further elucidation.
This study aims to develop a novel ANN-based predictive model for the mechanical properties (YS, UTS, and El) of 5Cr-0.5Mo steels. The key objectives are as follows:
- (i)
- Development of an Optimized ANN Model: To accurately predict mechanical properties (YS, UTS, and El) of 5Cr-0.5Mo steels as a function of composition and temperature (room temperature to 700 °C).
- (ii)
- Input–Output Relationship Analysis: To analyze the relationships between input variables (composition and temperature) and output properties using Pearson correlation and sensitivity analysis, thereby identifying key influential parameters.
- (iii)
- User-Friendly GUI Development: To develop a graphical user interface (GUI) based on the ANN model, allowing users to predict mechanical properties for any given composition and temperature, supporting efficient material design and experimental planning.
Through the graphical user interface (GUI), users can easily modify the composition to achieve desired properties for a specific service temperature. Alternatively, if users wish to determine the properties of a particular steel composition at a given service temperature, they can simply input the known composition and temperature to predict the corresponding mechanical properties.
2. Materials and Methods
2.1. Data Collection
In the present investigation, data containing the chemical composition, service temperature, and mechanical properties of 5Cr-0.5Mo steel were collected from the National Institute of Materials Science (NIMS), Japan. Various Cr-Mo steel ingots were produced using a basic electric arc furnace, with the compositions provided in Supplementary Materials. Tensile test specimens, each with a diameter of 10 mm and a gauge length of 50 mm, were extracted from the final bar-shaped product. The tensile tests were conducted by following the ISO 9513 standard, using an extensometer at a strain rate of 10−3 s−1. The database includes a range of compositions and corresponding mechanical properties tested at temperatures ranging from 25 °C to 700 °C.
The inputs for the current model include (i) the chemical composition (wt.%) of the steel, which encompasses 11 different alloying elements (C, Si, Mn, P, S, Ni, Cr, Mo, Cu, Al, and N) and other non-metallic inclusions (NMI); (ii) austenite grain size (um); and (iii) a series of test temperatures (25 °C, 100 °C, 200 °C, 300 °C, 400 °C, 500 °C, 600 °C, 650 °C, and 700 °C). The model outputs the steel’s tensile properties (YS, UTS, El (%), and RA (%)). The entire experimental dataset consists of 99 samples. Of these, 81 datasets were used to develop the ANN model, while 18 were reserved for testing the model’s accuracy. The details of all the variables in the training and testing datasets, including the minimums, maximums, mean values, and corresponding standard deviations, are presented in Table 1 for both the training and testing datasets.

Table 1.
Statistical data of input and output variables of Cr-Mo steel used for ANN Modeling.
2.2. Correlation Analysis of Inputs and Outputs
A heatmap in Figure 1 illustrating the linear correlations between inputs and outputs can be created using the Pearson correlation coefficient [29]. The correlation values range from −1 to 1 for simplicity. The colored heatmap allows for quick and easy identification of correlations, with the color intensity of each square representing the strength of the linear relationship between input and output variables. Darker colors indicate a stronger correlation, close to either 1 or −1, while lighter colors suggest a weaker correlation [30]. A positive value indicates a direct relationship between two variables, while a negative value signifies an inverse relationship. A value close to zero, such as 0.001 between Ni and EL (%) in the heatmap, represents a fragile and insignificant relationship.
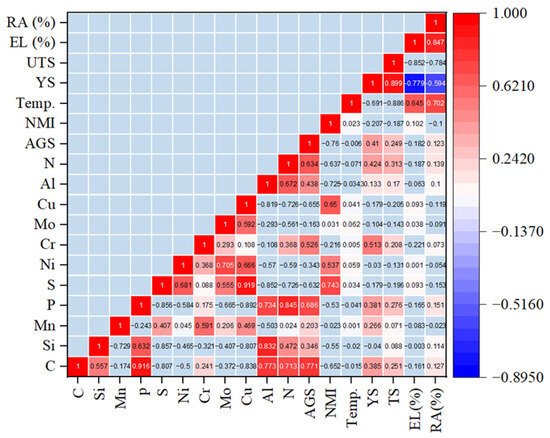
Figure 1.
Heatmap showing the Pearson correlation coefficient between inputs and outputs. The intensity of the color in each square reflects the strength of the correlation.
The correlation coefficient of any parameter with itself is always +1, which appears along the diagonal of the heatmap. While detailing the correlation of each element with others is beyond the scope of this paper, the overall trends can be easily observed through the color variations in the heatmap. Sulfur and phosphorus form non-metallic inclusions [31], indicated by the red color in the heatmap, signifying a strong relationship between these elements and non-metallic inclusions.
2.3. Preprocessing of Data
The experimental dataset consists of 99 samples, as shown in Supplementary. All the variables were normalized to a range between 0.1 and 0.9 to ensure that all input features have consistent scaling, which improves the stability and performance of the model. Normalization was done using the normalization function represented by Equation (1) [32].
Here, the normalized values of x are xn, and xmin and xmax are the inputs’ minimum and maximum values, respectively.
After achieving the best-trained network, all normalized data are reverted to their original values using Equation (2) [32].
2.4. Development of the ANN Model
ANN modeling is inspired by the human brain, where interconnected neurons adjust their responses based on inputs. In an ANN, there are typically three layers: input, hidden, and output layers. This model’s input layer includes composition, non-metallic inclusions, austenite grain size, and temperature. The outputs are YS, UTS, El (%), and RA (%). The hidden layers, positioned between the input and output layers, contain a certain number of nodes. Part of the data is used to train the ANN, enabling it to produce highly accurate outputs from new, unknown inputs. The model is trained by adjusting the network to align the computed outputs with the experimental values. The primary focus during model training is on minimizing the mean squared error (MSE), which represents the average error in output predictions (Etr), calculated by using Equations (3) and (4) [33].
Here, Etr(y) = Average error in prediction of training and testing sets for output parameter y.
N = Number of datasets, Ti(y) = Targeted output, and Oi(y) = Output calculated.
The training program utilized the C programming language (C99), while Java (1.4) was employed to design the graphical user interface. A comprehensive explanation of ANN-based modeling in materials science is given in another source [34]. Figure 2 depicts the basic structure of the ANN model, which includes input, hidden, and output layers. The number of neurons in the input and output layers matches the number of input and output parameters, respectively. The entire experimental dataset was split into training and testing sets to train the model. The training data were used to identify the optimal model architecture, including the number of hidden layers, neurons per hidden layer, momentum term, learning rate, and number of iterations.
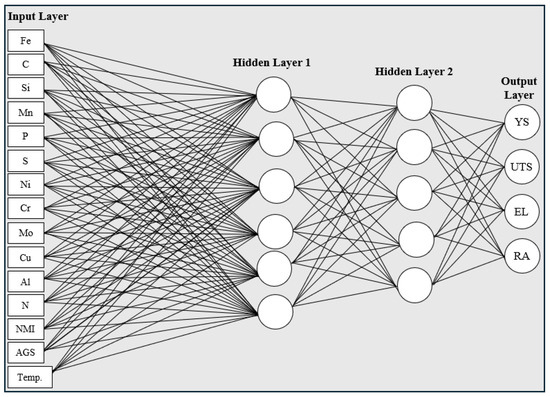
Figure 2.
Schematic diagram of ANN architecture representing inputs (composition, AGS, and temp.) and outputs (YS, UTS, EL, and RA).
The critical steps in developing the ANN model are as follows:
- (i)
- Selecting the number of hidden layers and neurons;
- (ii)
- Determining the momentum term and learning rate;
- (iii)
- Choosing the number of iterations.
Figure 3 presents a comprehensive flowchart of the investigation using the developed model. It outlines the process of data division into training and testing sets, normalization of values, operation of the ANN within hidden layers, selection of the optimal model, and subsequent accuracy determination and prediction of mechanical properties for unseen data.
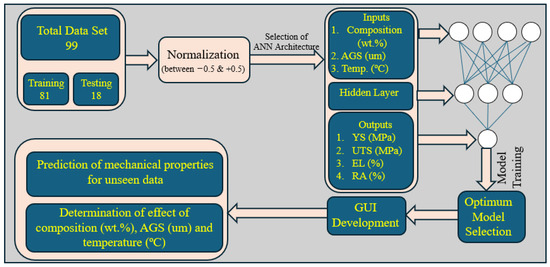
Figure 3.
Comprehensive flowchart of the ANN model employed in this study.
2.5. Optimization of the ANN Model
The accuracy and effectiveness of the developed model rely on its training phase, which entails meticulously selecting the optimal configuration of hidden layers and neurons. In the current study, the model was trained using configurations with single and two hidden layers, where the number of neurons in each layer ranged from 2 to 15. The MSE was computed for each configuration of single and two hidden layers, and the results are illustrated in Figure 4. It is evident from the figure that the MSE decreases as the number of hidden neurons increases.
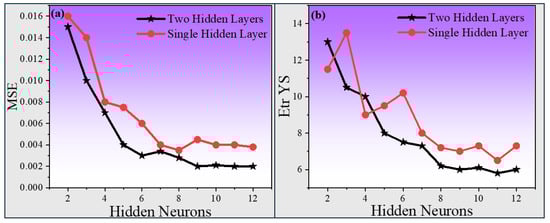
Figure 4.
Effect of the number of hidden layers and neurons on: (a) MSE and (b) Etr YS. The black line is for a single hidden layer, and the red line is for two hidden layers.
This trend indicates that training the model with two hidden layers leads to a notable reduction in error compared to using a single hidden layer. We obtained minimum testing errors with 2 hidden layers and 12 neurons (MSE of 0.00149 and Etr of 6) (shown in Figure 4). With two hidden layers, we varied the momentum term from 0.05 to 0.95 and observed the minimum error occurred with a 0.95 value (MSE of 0.001136 and Etr of 4.395) (shown in Figure 5a,b). After fixing the momentum term, the learning rate varied from 0.05 to 0.95, and a 0.45 learning rate was found; the minimum error was achieved with an MSE of 0.000698 and Etr of 10.353 (shown in Figure 5c,d). The optimum ANN model was obtained based on the MSE and average error in the prediction of the blind 18 testing datasets. The GUI design of the ANN model was built based on the connective weights of the optimum ANN model. The number of iterations required for ANN training depends on the complexity of relationships between input variables and mechanical properties (21, 22, 23), such as YS, UTS, El (%), and RA (%). Simpler properties like YS and UTS, which correlate strongly with material composition and processing parameters, converge faster due to their relatively straightforward patterns. In contrast, El (%) and RA (%) exhibit more complex dependencies on microstructural factors and secondary phenomena, necessitating additional iterations for accurate predictions. The variability in iteration requirements reflects the ANN’s ability to handle diverse levels of complexity effectively.
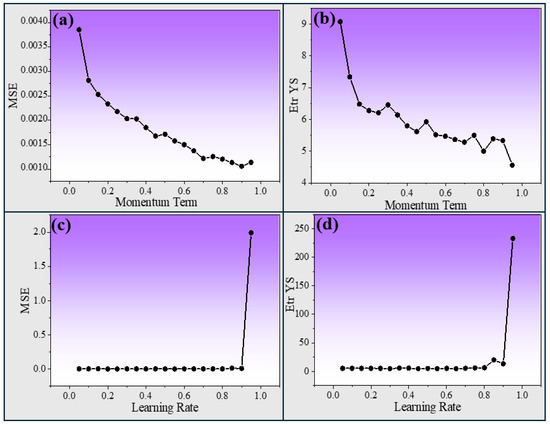
Figure 5.
Effect of various parameters on prediction error: (a) effect of momentum term on MSE, (b) effect of momentum term on Etr YS, (c) effect of learning rate on MSE, and (d) effect of learning rate on Etr YS.
2.6. Sigmoid Output Transfer Function
In our developed ANN model, we implemented the sigmoid function as the output transfer function [35]. This choice of activation function enhanced the predictive accuracy of the trained model configured with a 2-12-12 architecture. The transfer function is a crucial element in neural networks, providing the capability to manage non-linear relationships. The complexity and performance of neural networks are heavily influenced by selecting a suitable transfer function [36]. The initial ANN model synaptic weights are randomly generated between −0.5 and +0.5. Figure 6 illustrates the transformation of weights with the number of iterations. The optimum model weight values varied between −16 and +16.
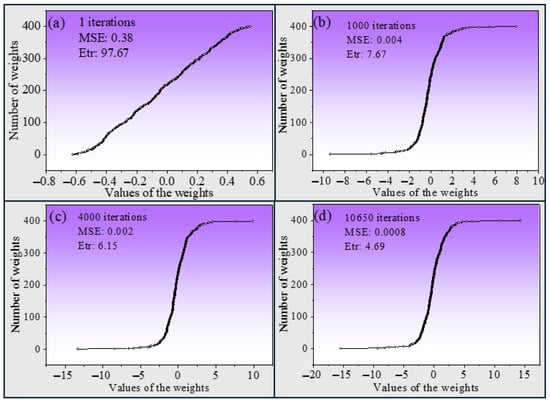
Figure 6.
Change in the magnitude of weights at (a) 0, (b) 1000, (c) 4000, and (d) 10,650 iterations.
We varied the number of iterations to find the testing error deviations. We observed 10,650, 7350, 6100, and 1050 iterations for YS, UTS, El (%), and RA (%), respectively. As the number of iterations increases to 10,650, there is a significant reduction in error values, and the curve gradually adopts a sigmoid-function shape. This transformation is accompanied by an improved distribution of weights, demonstrating the effectiveness of the sigmoid activation function in modeling the provided database.
3. Results and Discussion
3.1. Prediction of Mechanical Properties Using ANN
After training the network with 81 datasets, the remaining 18 datasets are used to test the model performance. Figure 7a,c show the comparison among actual or experimental mechanical properties (YS and El) of training datasets. Prediction of mechanical properties of 5Cr-0.5Mo steels for specified input parameters (composition, test temperature) was achieved. Pearson’s r and adj. R-squared values are nearer to one for training datasets of all properties. A similar comparison for the testing dataset is presented in Figure 7b,d. The predictions with unseen data are very accurate for the YS. The greater scatter in the El (%) resulting from the testing dataset can be attributed to the intrinsic variability of the elongation property across different steel compositions and testing conditions.
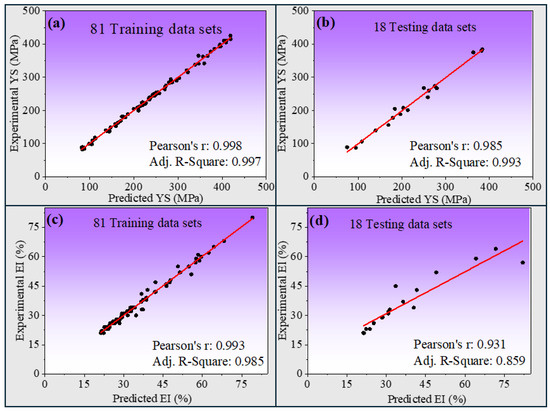
Figure 7.
Graphical representation of predicted and experimental values of (a) YS (MPa) for the training dataset, (b) YS (MPa) for the testing dataset, (c) El (%) for the training dataset, and (d) El (%) for the testing dataset.
The MSE and average error values were calculated based on the differences between predicted and experimental mechanical properties, expressed in their respective dimensional parameters, as shown in Figure 8a–d. For YS, the percentage average error in prediction is 4.655%, while for El (%), it is 3.76%. These errors indicate the model’s ability to achieve high accuracy in predicting tensile properties, with most predictions exhibiting an average error of less than 5%, as shown in Figure 8a,b for YS and Figure 8c,d for El (%). The ANN model demonstrates exceptional accuracy in modeling and optimizing the relationships between complex parameters, making it highly effective for improving new alloy systems with desired properties.
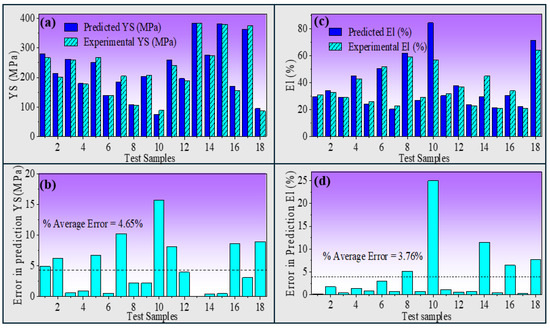
Figure 8.
Graphical representation of (a) predicted and experimental values for YS (MPa), (b) % error in predictions for YS (MPa), (c) predicted and experimental values for El (%), and (d) % error in prediction for El (%).
Mechanical properties were predicted as a function of temperature using ANN model predictions. Results from the model show that as the temperature increases from 0 °C to 700 °C, the two strength properties (YS, UTS) gradually decrease irrespective of the steel composition, as shown in Figure 9a,b. From the metallurgical point of view, the higher dislocation motion with the increase in temperature is the main factor that influences the plastic behavior of steel [37]. An increase in the working temperature of steel leads to quick movement in dislocations, and as a result, steel deforms more plastically. So, a temperature rise will reduce the strength properties (YS, UTS). Moreover, at around 400 °C, there is a slight increase in YS and UTS, which can be attributed to dynamic recovery or carbide/precipitation hardening mechanisms at this temperature, which may have enhanced the strength and delayed the onset of softening temporarily [38]. On the other hand, Figure 9c,d show El (%) and RA (%) with the function of temperatures. It was observed that both properties are increased linearly at elevated temperatures of higher than 400 °C. This is due to more slip planes becoming active at higher temperatures, thereby increasing the material’s ductility [39]. From the outcomes of ANN, it is clear that model predictions are matches with experimental results. The available data are with 25, 100, 200, 300, 400, 450, 500, 550, 600, 650, and 700 °C only. However, the model can predict at any temperature with small errors.
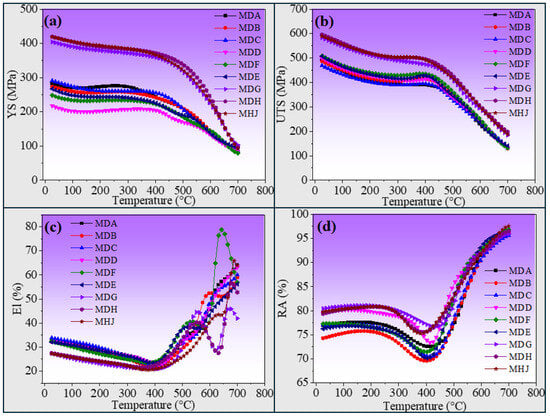
Figure 9.
Graphical representation of the predicted effect of temperature change on mechanical properties for (a) YS (MPa), (b) UTS (MPa), (c) El (%), and (d) RA (%) for all the steels studied in the present work. The labels such as MDA, MDB, etc. represent the distinct steel composition in the NIMS dataset.
3.2. Single Variable Sensitivity Analysis
The ANN model provides the sensitivity analysis by varying any of our chosen independent variables on output parameters. As here, we can get several results from the model, we consider the effect of temperature and carbon on UTS and El (%).
3.2.1. Effect of Temperature
The mechanical properties of 5Cr-0.5Mo steel are highly temperature-dependent. At higher temperatures, yield and tensile strength decrease due to the role of temperature in the development and dissolution of precipitates [40]. At around 400 °C, fibrous M2C carbides disappear, and massive grain boundary M23C6 carbides form, which can develop at grain boundaries or within grain interiors [41]. The sequence of carbide precipitation is ε-carbide → cementite → M2C → M7C3 → M23C6 → M6C [42]. These M23C6 carbides require a large number of Mo atoms, leading to the dissolution of carbides into the ferrite matrix after 400 °C [43]. Depending on the temperature and exposure duration, these carbides can vary in shape, being either spherical or elongated, and can exhibit varying compositions, e.g., Cr-rich and/or Mo-rich [44]. The UTS values initially decreased slowly, then showed a steep decline after 400 °C due to carbide dissolution. Similarly, El (%) initially decreased until 400 °C, then increased. The graphs in Figure 10a,b display the experimental and predicted values and trends of UTS and El (%) against different temperatures, proving the model’s intelligence without explicit metallurgical inputs to the ANN model.
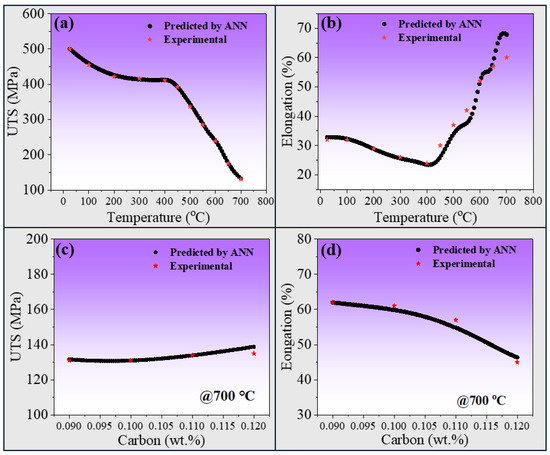
Figure 10.
Effect of temperature (°C) on (a) UTS (MPa) and (b) elongation (%). Effect of carbon content (wt.%) on (c) UTS (MPa) and (d) elongation (%) at a temperature of 700 °C. The red stars show the experimental values, whereas the black dots are the values predicted by the ANN.
3.2.2. Effect of Carbon
Carbon plays an important role in strengthening Cr-Mo steels through precipitation strengthening by forming carbides, such as Fe3C, M7C3, M23C6, and Mo2C [45]. However, it is worth mentioning that these carbides form at higher temperatures, and prolonged heating can lead to coarsening, resulting in decreased strength [8]. The graphs generated by our developed ANN model demonstrate the effect of carbon content on UTS and El (%). The ANN model accurately predicted the trends for both UTS and elongation at a randomly selected temperature of 700 °C, as shown in Figure 10c,d. It is well known that alloys with higher UTS typically exhibit lower ductility [7]. Consequently, while an increase in carbon content enhances strength, it also results in a decrease in elongation, a relationship accurately predicted by our model.
3.3. Two Variable Sensitivity
The combined effect of carbon and silicon on the mechanical properties of Cr-Mo steels is significant. Carbon, crucial for precipitation strengthening, forms various carbides that enhance YS and UTS. An increase in carbon content can result in a higher volume fraction of carbides, leading to improved YS and UTS [46]. Most of the carbides, like cementite, are brittle and can reduce ductility [47]. Silicon acts as a deoxidizer and contributes to strength through solid solution strengthening but can also reduce ductility at high concentrations [48]. The contour graphs in Figure 11a–d are generated by our ANN model and illustrate the intricate interplay between C and Si. These graphs plot C and Si against YS, UTS, El (%), and RA (%), revealing clear trends. Increased levels of C and Si lead to higher YS and UTS, confirming their strengthening effects. However, these increases come at the expense of El (%) and RA (%), indicating a trade-off between strength and ductility. Most importantly, the ANN model was not fed the explicit relationship between inputs and outputs. Nevertheless, the well-trained model is capable of capturing and mapping of these relationships.
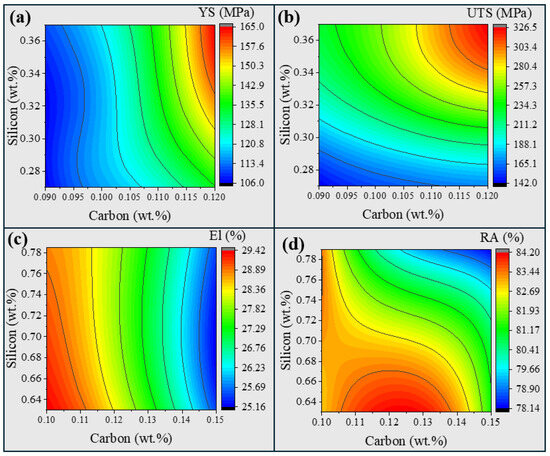
Figure 11.
Contour maps showing combined effects of C (wt.%) and Si (wt.%) on (a) YS (MPa), (b) UTS (MPa), (c) El (%), and (d) RA (%).
3.4. Graphical User Interface (GUI)
The developed ANN model has been integrated into a user-friendly GUI, featuring fourteen input parameters and four output parameters (predicted YS, UTS, EL, and RA). Users can manually adjust the input parameters and calculate all four outputs with a single button click. For linear visualization, there is a button to select the desired seed and another to save the plot. Users can save the plot data to a new file, with the number of points customizable. Surface plots, which show the combined effect of multiple inputs, can also be generated similarly for easy visualization and understanding. Additionally, bar plots displaying both input and output parameters are accessible on the same screen with a single click. Input values can be adjusted by clicking and dragging the respective bars. This makes the model highly intuitive and easy to use. We have included one screenshot of the GUI of our developed model, as shown in Figure 12. Figure 12 provides a detailed visualization of how mechanical properties change with temperature. The calculations allow users to observe subtle variations and trends by displaying temperatures at finer intervals. The predicted mechanical properties are presented on a normalized scale, making comparing and analyzing the data across different conditions easier. This feature enhances the usability and interpretability of the model, facilitating more precise and informed decision-making in materials engineering.
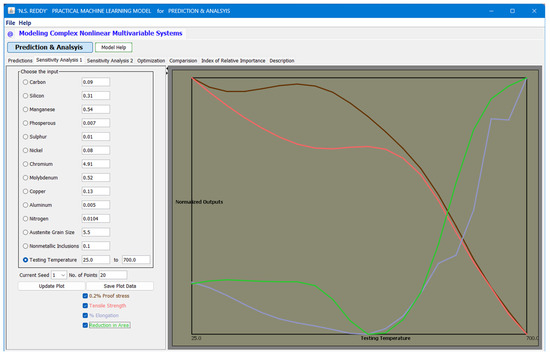
Figure 12.
The Screenshot of the developed ANN model shows varying temperatures at finer intervals and respective predicted mechanical properties in a normalized scale.
4. Conclusions
A neural network model has been developed to estimate the mechanical properties of 5Cr-0.5Mo steel based on its chemical composition (C, Si, Mn, P, S, Ni, Cr, Mo, Cu, Al, and N), the presence of non-metallic inclusions, austenite grain size, and test temperatures (ranging from 25 to 700 °C). The model’s predictions align well with experimental data, accurately reproducing numerous observed trends by capturing complex nonlinear relationships. The model accurately predicted the mechanical properties, with a Pearson’s r of 0.99853 and an adj. R2 of 0.99763 for the YS in the training dataset, a Pearson’s r of 0.98479, and an adj. R2 of 0.99281 for the testing dataset. Similarly, for El (%), the model achieved a Pearson’s r of 0.99265 and an adj. R2 of 0.98517 for the training dataset, a Pearson’s r of 0.93112, and an adj. R2 of 0.85868 for the testing dataset, demonstrating the model’s efficiency. The percentage errors in prediction for YS, UTS, and El (%) are 3.5%, 0.97%, and 1.9%, respectively. The contour plots generated by the model allow for visual optimization of YS, UTS, El (%), and RA (%) of the steel under various conditions. The ANN-based GUI model is a practical tool for the steel industry, enabling users to predict key mechanical properties (YS, UTS, and El) of 5Cr-0.5Mo steels based on composition and temperature. Its user-friendly interface supports alloy design, process optimization, and material selection, allowing engineers and researchers to make informed decisions without requiring expertise in machine learning.
Supplementary Materials
The following supporting information can be downloaded at: https://www.mdpi.com/article/10.3390/cryst15030213/s1.
Author Contributions
M.I.: Writing—original draft, Investigation, Formal analysis, and Data curation. S.T.: Validation and Visualization. M.N.: Formal analysis and Validation. S.-G.K.: Methodology, Formal analysis, and Conceptualization. N.G.S.R.: Writing—review and editing and Supervision. All authors have read and agreed to the published version of the manuscript.
Funding
This research received no external funding.
Data Availability Statement
The raw data used for developing and evaluating the model can be found in the Supplementary file.
Conflicts of Interest
The authors declare no conflicts of interest.
References
- Zinkle, S.J.; Was, G.S. Materials challenges in nuclear energy. Acta Mater. 2013, 61, 735–758. [Google Scholar] [CrossRef]
- Viswanathan, R. Damage Mechanisms and Life Assessment of High Temperature Components; ASM International: Almere, The Netherlands, 1989. [Google Scholar]
- French, D. Metallurgical Failures in Fossil Fired Boilers; John Wiley & Sons: New York, NY, USA, 1993. [Google Scholar]
- Gorash, Y.; Altenbach, H.; Lvov, G. Modelling of high-temperature inelastic behaviour of the austenitic steel AISI type 316 using a continuum damage mechanics approach. J. Strain Anal. Eng. Des. 2012, 47, 229–243. [Google Scholar] [CrossRef]
- Samantaray, D.; Kumar, V.; Bhaduri, A.; Dutta, P. Microstructural evolution and mechanical properties of type 304 L stainless steel processed in semi-solid state. Int. J. Metall. Eng. 2013, 2, 149–153. [Google Scholar]
- Ishtiaq, M.; Kim, Y.-K.; Tiwari, S.; Lee, C.H.; Jo, W.H.; Sung, H.; Cho, K.-S.; Kang, S.-G.; Na, Y.-S.; Seol, J.B. Serration-induced plasticity in phase transformative stainless steel 316L upon ultracold deformation at 4.2 K. Mater. Sci. Eng. A 2025, 921, 147591. [Google Scholar] [CrossRef]
- Ishtiaq, M.; Inam, A.; Tiwari, S.; Seol, J.B. Microstructural, mechanical, and electrochemical analysis of carbon doped AISI carbon steels. Appl. Microsc. 2022, 52, 10. [Google Scholar] [CrossRef]
- Saucedo-Muñoz, M.L.; Lopez-Hirata, V.M.; Dorantes-Rosales, H.J.; Villegas-Cardenas, J.D.; Rivas-Lopez, D.I.; Beltran-Zuñiga, M.; Ferreira-Palma, C.; Moreno-Palmerin, J. Phase Transformations of 5Cr-0.5Mo-0.1C Steel after Heat Treatment and Isothermal Exposure. Metals 2022, 12, 1378. [Google Scholar] [CrossRef]
- Mohapatra, J.N.; Panda, A.K.; Gunjan, M.K.; Bandyopadhyay, N.R.; Mitra, A.; Ghosh, R.N. Ageing behavior study of 5Cr–0.5Mo steel by magnetic Barkhausen emissions and magnetic hysteresis loop techniques. NDT E Int. 2007, 40, 173–178. [Google Scholar] [CrossRef]
- Kucharova, K.; Sklenicka, V.; Kvapilova, M.; Svoboda, M. Creep and microstructural processes in a low-alloy 2.25%Cr1.6%W steel (ASTM Grade 23). Mater. Charact. 2015, 109, 1–8. [Google Scholar] [CrossRef]
- Lyu, Z.; Kannan, R.; Saini, N.; Li, J.; Li, L. Degradation of a Cr-Mo steel by carbide precipitation over long-term service. Mater. Sci. Eng. A 2024, 898, 146354. [Google Scholar] [CrossRef]
- Kim, M.-Y.; Chu, D.-J.; Lee, Y.-S.; Jung, W.-S.; Lee, J.; Lee, Y.-K.; Shim, J.-H. Mechanical property change and precipitate evolution during long-term aging of 1.25 Cr-0.5 Mo steel. Mater. Sci. Eng. A 2020, 789, 139663. [Google Scholar] [CrossRef]
- Białobrzeska, B.; Konat, Ł.; Jasiński, R. The Influence of Austenite Grain Size on the Mechanical Properties of Low-Alloy Steel with Boron. Metals 2017, 7, 26. [Google Scholar] [CrossRef]
- Shen, D.D.; Song, S.H.; Yuan, Z.X.; Weng, L.Q. Effect of solute grain boundary segregation and hardness on the ductile-to-brittle transition for a Cr–Mo low-alloy steel. Mater. Sci. Eng. A 2005, 394, 53–59. [Google Scholar] [CrossRef]
- Creese, R.; Adithan, M. Estimating and Costing for the Metal Manufacturing Industries; CRC Press: Boca Raton, FL, USA, 1992. [Google Scholar]
- Bertsch, J.; Growitsch, C.; Lorenczik, S.; Nagl, S. Flexibility in Europe’s power sector—An additional requirement or an automatic complement? Energy Econ. 2016, 53, 118–131. [Google Scholar] [CrossRef]
- Narayana, P.L.; Lee, S.W.; Park, C.H.; Yeom, J.-T.; Hong, J.-K.; Maurya, A.K.; Reddy, N.S. Modeling high-temperature mechanical properties of austenitic stainless steels by neural networks. Comput. Mater. Sci. 2020, 179, 109617. [Google Scholar] [CrossRef]
- Yang, X.-W.; Zhu, J.-C.; Nong, Z.-S.; He, D.; Lai, Z.-H.; Liu, Y.; Liu, F.-W. Prediction of mechanical properties of A357 alloy using artificial neural network. Trans. Nonferrous Met. Soc. China 2013, 23, 788–795. [Google Scholar] [CrossRef]
- Lan, Q.; Wang, X.; Sun, J.; Chang, Z.; Deng, Q.; Sun, Q.; Liu, Z.; Yuan, L.; Wang, J.; Wu, Y.; et al. Artificial neural network approach for mechanical properties prediction of as-cast A380 aluminum alloy. Mater. Today Commun. 2022, 31, 103301. [Google Scholar] [CrossRef]
- Krajewska-Śpiewak, J.; Lasota, I.; Kozub, B. Application of classification neural networks for identification of damage stages of degraded low alloy steel based on acoustic emission data analysis. Arch. Civ. Mech. Eng. 2020, 20, 109. [Google Scholar] [CrossRef]
- Yeong, C.-H.; Li, W. Prediction of load-deformation relations for CFDST columns through machine learning methods. J. Constr. Steel Res. 2024, 223, 108998. [Google Scholar] [CrossRef]
- Ishtiaq, M.; Tiwari, S.; Panigrahi, B.B.; Seol, J.B.; Reddy, N.S. Neural Network-Based Modeling of the Interplay between Composition, Service Temperature, and Thermal Conductivity in Steels for Engineering Applications. Int. J. Thermophys. 2024, 45, 137. [Google Scholar] [CrossRef]
- Yescas, M.; Le Gloannec, B.; Roch, F. Prediction of mechanical properties of PWR vessel steel heads containing residual carbon macrosegregation using Artificial Neural Networks. J. Nucl. Mater. 2022, 558, 153360. [Google Scholar] [CrossRef]
- Olejarczyk-Wożeńska, I.; Mrzygłód, B.; Hojny, M. Modelling the high-temperature deformation characteristics of S355 steel using artificial neural networks. Arch. Civ. Mech. Eng. 2022, 23, 1–11. [Google Scholar] [CrossRef]
- Wang, Y.; Wu, X.; Li, X.; Xie, Z.; Liu, R.; Liu, W.; Zhang, Y.; Xu, Y.; Liu, C. Prediction and Analysis of Tensile Properties of Austenitic Stainless Steel Using Artificial Neural Network. Metals 2020, 10, 234. [Google Scholar] [CrossRef]
- Guo, Z.; Sha, W. Modelling the correlation between processing parameters and properties of maraging steels using artificial neural network. Comput. Mater. Sci. 2004, 29, 12–28. [Google Scholar] [CrossRef]
- Fragassa, C.; Babic, M.; Bergmann, C.P.; Minak, G. Predicting the tensile behaviour of cast alloys by a pattern recognition analysis on experimental data. Metals 2019, 9, 557. [Google Scholar] [CrossRef]
- Mohapatra, J.N.; Ray, A.K.; Swaminathan, J.; Mitra, A. Creep behaviour study of virgin and service exposed 5Cr–0.5Mo steel using magnetic Barkhausen emissions technique. J. Magn. Magn. Mater. 2008, 320, 2284–2290. [Google Scholar] [CrossRef]
- Kirch, W. Pearson’s Correlation Coefficient. In Encyclopedia of Public Health; Springer: Dordrecht, The Netherlands, 2008; pp. 1090–1091. [Google Scholar]
- Cook, D.; Hofmann, H.; Lee, E.-K.; Yang, H.; Nikolau, B.; Wurtele, E. Exploring gene expression data, using plots. J. Data Sci. 2007, 5, 151–182. [Google Scholar] [CrossRef]
- Wang, Y.; Karasev, A.; Park, J.H.; Jönsson, P.G. Non-metallic Inclusions in Different Ferroalloys and Their Effect on the Steel Quality: A Review. Metall. Mater. Trans. B 2021, 52, 2892–2925. [Google Scholar] [CrossRef]
- Bishop, C.M.; Nasrabadi, N.M. Pattern Recognition and Machine Learning; Springer: Singapore, 2006; Volume 4. [Google Scholar]
- Cichocki, A.; Unbehauen, R. Neural Networks for Optimization and Signal Processing; John Wiley& Sons: New York, NY, USA, 1993; p. 544. [Google Scholar]
- Sha, W.; Edwards, K. The use of artificial neural networks in materials science based research. Mater. Des. 2007, 28, 1747–1752. [Google Scholar] [CrossRef]
- Reddy, N.; Krishnaiah, J.; Hong, S.-G.; Lee, J.S. Modeling medium carbon steels by using artificial neural networks. Mater. Sci. Eng. A 2009, 508, 93–105. [Google Scholar] [CrossRef]
- Priddy, K.L.; Keller, P.E. Artificial Neural Networks: An Introduction; SPIE Press: Bellingham, WA, USA, 2005; Volume 68. [Google Scholar]
- Ding, Y.; Yuan, F.; Cao, Z.; Ren, J.; Li, Y.; Xin, Y.; Ran, G. In-situ study on factors impeding dislocation motion in Fe9Cr1.5W0.4Si F/M steel during high temperature heating. Mater. Sci. Eng. A 2024, 891, 145964. [Google Scholar] [CrossRef]
- Wieczerzak, K.; Bala, P.; Dziurka, R.; Tokarski, T.; Cios, G.; Koziel, T.; Gondek, L. The effect of temperature on the evolution of eutectic carbides and M7C3→M23C6 carbides reaction in the rapidly solidified Fe-Cr-C alloy. J. Alloys Compd. 2017, 698, 673–684. [Google Scholar] [CrossRef]
- Weinberger, C.R.; Boyce, B.L.; Battaile, C.C. Slip planes in bcc transition metals. Int. Mater. Rev. 2013, 58, 296–314. [Google Scholar] [CrossRef]
- Tipler, H.R.; Taylor, L.H.; Thomas, G.B.; Williamson, J.; Branch, G.D.; Hopkins, B.E. Effect of heattreatment variations on strength and ductility of Cr-Mo-V steels during creep at 550 °C. Met. Technol. 1975, 2, 206–219. [Google Scholar] [CrossRef]
- Williams, K.; Wilshire, B. Microstructural instability of 0.5Cr-0.5Mo-0.25 V creep-resistant steel during service at elevated temperatures. Mater. Sci. Eng. 1981, 47, 151–160. [Google Scholar] [CrossRef]
- Inoue, A.; Masumoto, T. Carbide reactions (M3C→M7C3→M23C6→M6C) during tempering of rapidly solidified high carbon Cr-W and Cr-Mo steels. Metall. Trans. A 1980, 11, 739–747. [Google Scholar] [CrossRef]
- Das, S.; Joarder, A. Effect of long-term service exposure at elevated temperature on microstructural changes of 5Cr–0.5Mo steels. Metall. Mater. Trans. A 1997, 28, 1607–1616. [Google Scholar] [CrossRef]
- Mohapatra, J.N.; Bandyopadhyay, N.R.; Gunjan, M.K.; Mitra, A. Study of high-temperature ageing and creep on bainitic 5Cr–0.5Mo steel by magnetic NDE techniques. J. Magn. Magn. Mater. 2010, 322, 589–595. [Google Scholar] [CrossRef]
- Saucedo-Munoz, M.L. Precipitation kinetics of carbides during cyclical and isothermal aging of 2.25 Cr–1Mo steel and its effect on mechanical properties. J. Iron Steel Res. Int. 2021, 28, 1282–1290. [Google Scholar] [CrossRef]
- Thomson, R.C.; Miller, M.K. Carbide precipitation in martensite during the early stages of tempering Cr- and Mo-containing low alloy steels. Acta Mater. 1998, 46, 2203–2213. [Google Scholar] [CrossRef]
- Papavinasam, S. Chapter 3—Materials. In Corrosion Control in the Oil and Gas Industry; Gulf Professional Publishing: Boston, MA, USA, 2014; pp. 133–177. [Google Scholar]
- Kalisz, D.; Migas, P.; Karbowniczek, M.; Moskal, M.; Hornik, A. Influence of Selected Deoxidizers on Chemical Composition of Molten Inclusions in Liquid Steel. J. Mater. Eng. Perform. 2020, 29, 1479–1487. [Google Scholar] [CrossRef]
Disclaimer/Publisher’s Note: The statements, opinions and data contained in all publications are solely those of the individual author(s) and contributor(s) and not of MDPI and/or the editor(s). MDPI and/or the editor(s) disclaim responsibility for any injury to people or property resulting from any ideas, methods, instructions or products referred to in the content. |
© 2025 by the authors. Licensee MDPI, Basel, Switzerland. This article is an open access article distributed under the terms and conditions of the Creative Commons Attribution (CC BY) license (https://creativecommons.org/licenses/by/4.0/).