Article

Innovative Hygroscopic Material for Humidity Regulation: Diatomaceous Earth Composite Porous Ceramic

1
School of Design, Southern University of Science and Technology, No. 1088 Xueyuan Blvd., Shenzhen 518055, China
2
Laboratory of Inflammation and Vaccines, Shenzhen Institute of Advanced Technology, Chinese Academy of Sciences, Shenzhen 518055, China
*
Author to whom correspondence should be addressed.
Crystals 2025, 15(2), 158; https://doi.org/10.3390/cryst15020158
Submission received: 26 December 2024 / Revised: 28 January 2025 / Accepted: 30 January 2025 / Published: 4 February 2025
(This article belongs to the Section Polycrystalline Ceramics)

Abstract

:
Urbanization in hot and humid regions such as southern China has increased the demand for comfortable indoor environments. In order to design a material for efficient passive indoor humidity regulation, this study investigates a composite material that combines the hygroscopic properties of salt and the adsorption capacity of diatomaceous earth (DE). Firstly, we prepared DE and boehmite into moisture-absorbing porous materials. Then, the initial DE-based sample was innovatively doped with SiO2 nanomaterials and loaded with LiCl to enhance the humidity regulation ability of the composite, especially in the adsorption and desorption ability of water vapour. The microstructure and phase composition of the composite samples were analysed, and we observed an increase in porosity, filling performance and capillary condensation upon the introduction of SiO2 nanoparticles. The hygroscopic salt loaded into the pores can absorb more water when exposed to the ambient humidity. This synergic effect can effectively improve the hygroscopic performance of the composite material while maintaining the stability of the physical and chemical properties. The optimized samples showed a moisture absorption rate of 28% in high-humidity environments, meeting moisture buffer value evaluation standards. The study’s findings lay the foundation for the future integration of these materials through advanced manufacturing technologies.

1. Introduction

Urbanization is driving the demand for comfortable living spaces, particularly in the hot and humid climate of southern China, which presents challenges to reach comfort levels indoor [1,2]. The ideal comfort conditions typically include a temperature range of 20–26 °C and a relative humidity level between 40 and 60% [3,4]. Deviations from these optimal conditions can negatively impact both human health and the structural integrity of buildings [5,6]. Traditional indoor climate control relies on energy-intensive air conditioning systems and clothes dryers. However, they are not sustainable and have low energy efficiency [7,8]. This highlights the need for more sustainable and health-conscious indoor strategies. In response, humidity control materials have emerged as a critical research area of material science, offering promising and innovative solutions for efficient indoor environmental regulation [9,10].
The moisture adsorption capacity of porous materials depends on the size of the microscopic pores. The physicochemical properties of the pore walls can also affect adsorption within the micropores. Smaller pore diameters always exhibit higher adsorption potential, allowing adsorption even in low-humidity environments. Thus, suitable pore size is the key to controlling the humidity absorption capacity of porous medium [11]. DE porous ceramics are sustainable and showed impressive adsorption capability [12,13]. DE is a natural silica-rich sedimentary rock with inherent porosity, widespread availability, and remarkable resistance to chemical degradation [14]. However, natural DE exhibits limited effectiveness under high ambient humidity, prompting the development of DE-based composite materials to address these challenges [15,16]. Boehmite is a natural mineral characterized by its small particle size, large specific surface area, and high pore volume, making it capable of moisture adsorption. It can be used to modify porous ceramic materials to increase their specific surface area [17]. Moreover, DE composites are expected to inherit the anti-bacterial properties of DE that along with humidity control will block or decrease the spreading of mould in high humidity environments [18]. Inorganic salts have demonstrated exceptional water absorption properties and rapid response characteristics within humidity control materials. Hong et al. [19,20] employed saturated salt solutions for humidity detection and regulating elements. However, the instability, susceptibility to salt precipitation, deliquescence, and the regeneration process during humidity regulation have limited their application. In response to these limitations, Simonova et al. [21] designed a composite material called SWS-8L by saturating mesoporous silica with a calcium nitrate solution. Significantly, the post-liquefied salt solution is steadily stored within the pores of the porous material, thereby mitigating the issue of salt solution liquefaction [22]. Despite the widespread practice of loading hygroscopic salts into porous media in this field [23,24,25], research on DE as a primary porous medium has been relatively scarce [26].
In this study, DE and boehmite porous composites with hygroscopic capacity were prepared. Afterward, the investigation focused on the regulation mechanisms of enhanced humidity underlying the incorporation of SiO2 nanomaterials and loading LiCl, particularly regarding water vapor adsorption and desorption. This study developed an efficient passive indoor humidity-regulating material that can significantly reduce energy consumption while enhancing the overall well-being of individuals residing in these environments.

2. Methods

2.1. Materials

DE is a naturally porous sedimentary rock mainly composed of fossilized diatoms, with a particle size ranging from 3.5 μ m to 22 μ m, and was purchased from MACKLIN (Shanghai, China). Calcium carbonate is utilized to introduce additional porosity into ceramic materials, with a particle size of 13 μ m. Nano-silicon dioxide creates nanoscale pores within ceramic materials, with a 4–70 nm particle size range. Polyvinyl alcohol (PVA) is a binder for ceramic molding, used at 5 wt%. Oxalic acid ( C 2 H 2 O 4 · 2 H 2 O ) is used for surface treatment of porous ceramics at a concentration of 1 mol/L, to partially remove the metal oxides deposited in the pores of the sample, thus clearing the microscopic pores of the sample, purchased from ALADDIN (Shanghai, China). Lithium chloride (LiCl), a hygroscopic salt, is used at concentrations of 96 wt%, 64 wt%, and 32 wt%.

2.2. Sample Preparation

The sample preparation involves two main procedures: creating porous ceramics with water absorption capacity and modifying these samples physico-chemically to produce moisture-absorbing materials with humidity-regulating properties.

2.2.1. Procedure I: Preparation of DE/Boehmite Porous Ceramics

In Procedure I, porous ceramics were prepared using diatomaceous earth (DE) and boehmite as raw materials. Five composition gradients were set with DE content ranging from 50% to 90%. The powders were ball-milled for 15 min, during which a 5% PVA solution was added dropwise at 2 mL/min as a binder. The homogenized mixtures were then uniaxially pressed into 5 mm thick samples at 30 MPa for 30 min. The samples were dried at 100 °C and sintered in a muffle furnace. The sintering process included heating to 300 °C over 90 min, ramping to 950 °C over 120 min, holding for 120 min, and cooling naturally.

2.2.2. Procedure II: Physical-Chemical Modification of Samples

In Procedure II, the samples were modified to enhance moisture absorption and humidity regulation. The composition was optimized with SiO2 (4–70 nm), diatomite (3.5 μ m), and boehmite (3.5 μ m) in a 4:3:3 ratio. DE-Nano was prepared according to the previous protocol. The DE samples underwent surface treatment by immersion in a 1 mol/L oxalic acid solution, followed by sonication. After neutralizing, the samples were dried in a humidity-absorbing salt solution for 2 h and then dried again for humidity absorption testing. The preparation details of all samples in this article are shown in Table 1.

2.3. Characterization

X-ray diffraction (XRD) was performed on powdered samples using a high-resolution diffractometer (Siemens D 5000, Aubrey, TX, USA) in a θ - θ configuration using Cu-K α radiation ( λ = 1.54 Å). The samples were tested between 2 θ values of 10° and 70° with step size of 0.02° and step time of 1.0 s. This scope detects the major and minor crystalline phases present in the sample. The XRD result can determine the crystal structure type of the sample (such as cubic, tetragonal, hexagonal, etc.) and identify the crystal phases present in the sample.
Based on the nitrogen gas adsorption/desorption test dates by a specific surface area analyzer, the Brunauer–Emmett–Teller (BET) and t-plot methods were used to calculate the surface area. S B E T is determined using the BET method, a standard approach for assessing a material’s surface area based on gas adsorption isotherms. The process begins by degassing the sample under vacuum or inert gas at high temperatures to remove contaminants and moisture. The degassed sample is then exposed to nitrogen gas at liquid nitrogen temperature (77 K), allowing the gas to adsorb onto the material’s surface at different relative pressures. An adsorption isotherm is generated by plotting the volume of gas adsorbed against these pressures. The BET theory is applied to this isotherm to calculate the monolayer capacity, which indicates the amount of gas that forms a single layer on the surface. Using these data, the specific surface area of the material is determined.
A higher S B E T value indicates a greater surface area, which is advantageous for moisture adsorption reactions by providing more active sites for interaction. Total pore volume ( V t a ) reflects the volume of pores per unit mass of the sample, which is crucial for accommodating moisture molecules and facilitating their contact with the surface. A larger Vta suggests a higher pore volume, which benefits reactions or adsorption processes involving moisture. Average pore diameter ( D p c ) provides insights into the size of pores within the material, influencing moisture molecule diffusion and active site accessibility.
The focused ion beam scanning electron microscope (SEM) GAIA 3 GMH was used to observe the morphology of the sample.
The static immersion water absorption test experiment was used to determine the maximum water absorption rate of the material and to conduct a preliminary evaluation of its water retention and wetting properties. The process involves placing the porous hygroscopic ceramics in a drying oven for 8 h until constant weight is reached and then passively cooling to room temperature in a desiccator to maintain continuous weight. The initial mass of the sample is recorded as m 0 , and the measurement accuracy is 0.001 g. Subsequently, the sample was placed into a cubic container filled with deionized water, and the sample was thoroughly immersed in the deionized water using a glass rod to ensure complete submersion. After 1 h, take out the sample, use qualitative filter paper to remove the moisture adsorbed on the surface, quickly weigh the sample, record it as m 1 , and the weighing accuracy is 0.001 g. The maximum water retention W m a x of the sample can then be calculated using the following equation:
W m a x = m 1 m 0 m 0 × 100 %
The experiment to test moisture absorption and desorption was conducted using a custom-built experimental apparatus, as shown in Figure 1. Within the sealed testing chamber (Temperature: 25 ± 1 °C), an electronic balance recorded variations in sample mass throughout a testing cycle. Real-time data transmission to the workstation enabled continuous monitoring.
The humidity of the environment was controlled by saturated salt solution (KCl and MgCl2) in the closed test environment. The moisture absorption condition of the sample was set at relative humidity (RH) = 85%, and the desorption environment was set at RH = 35%.

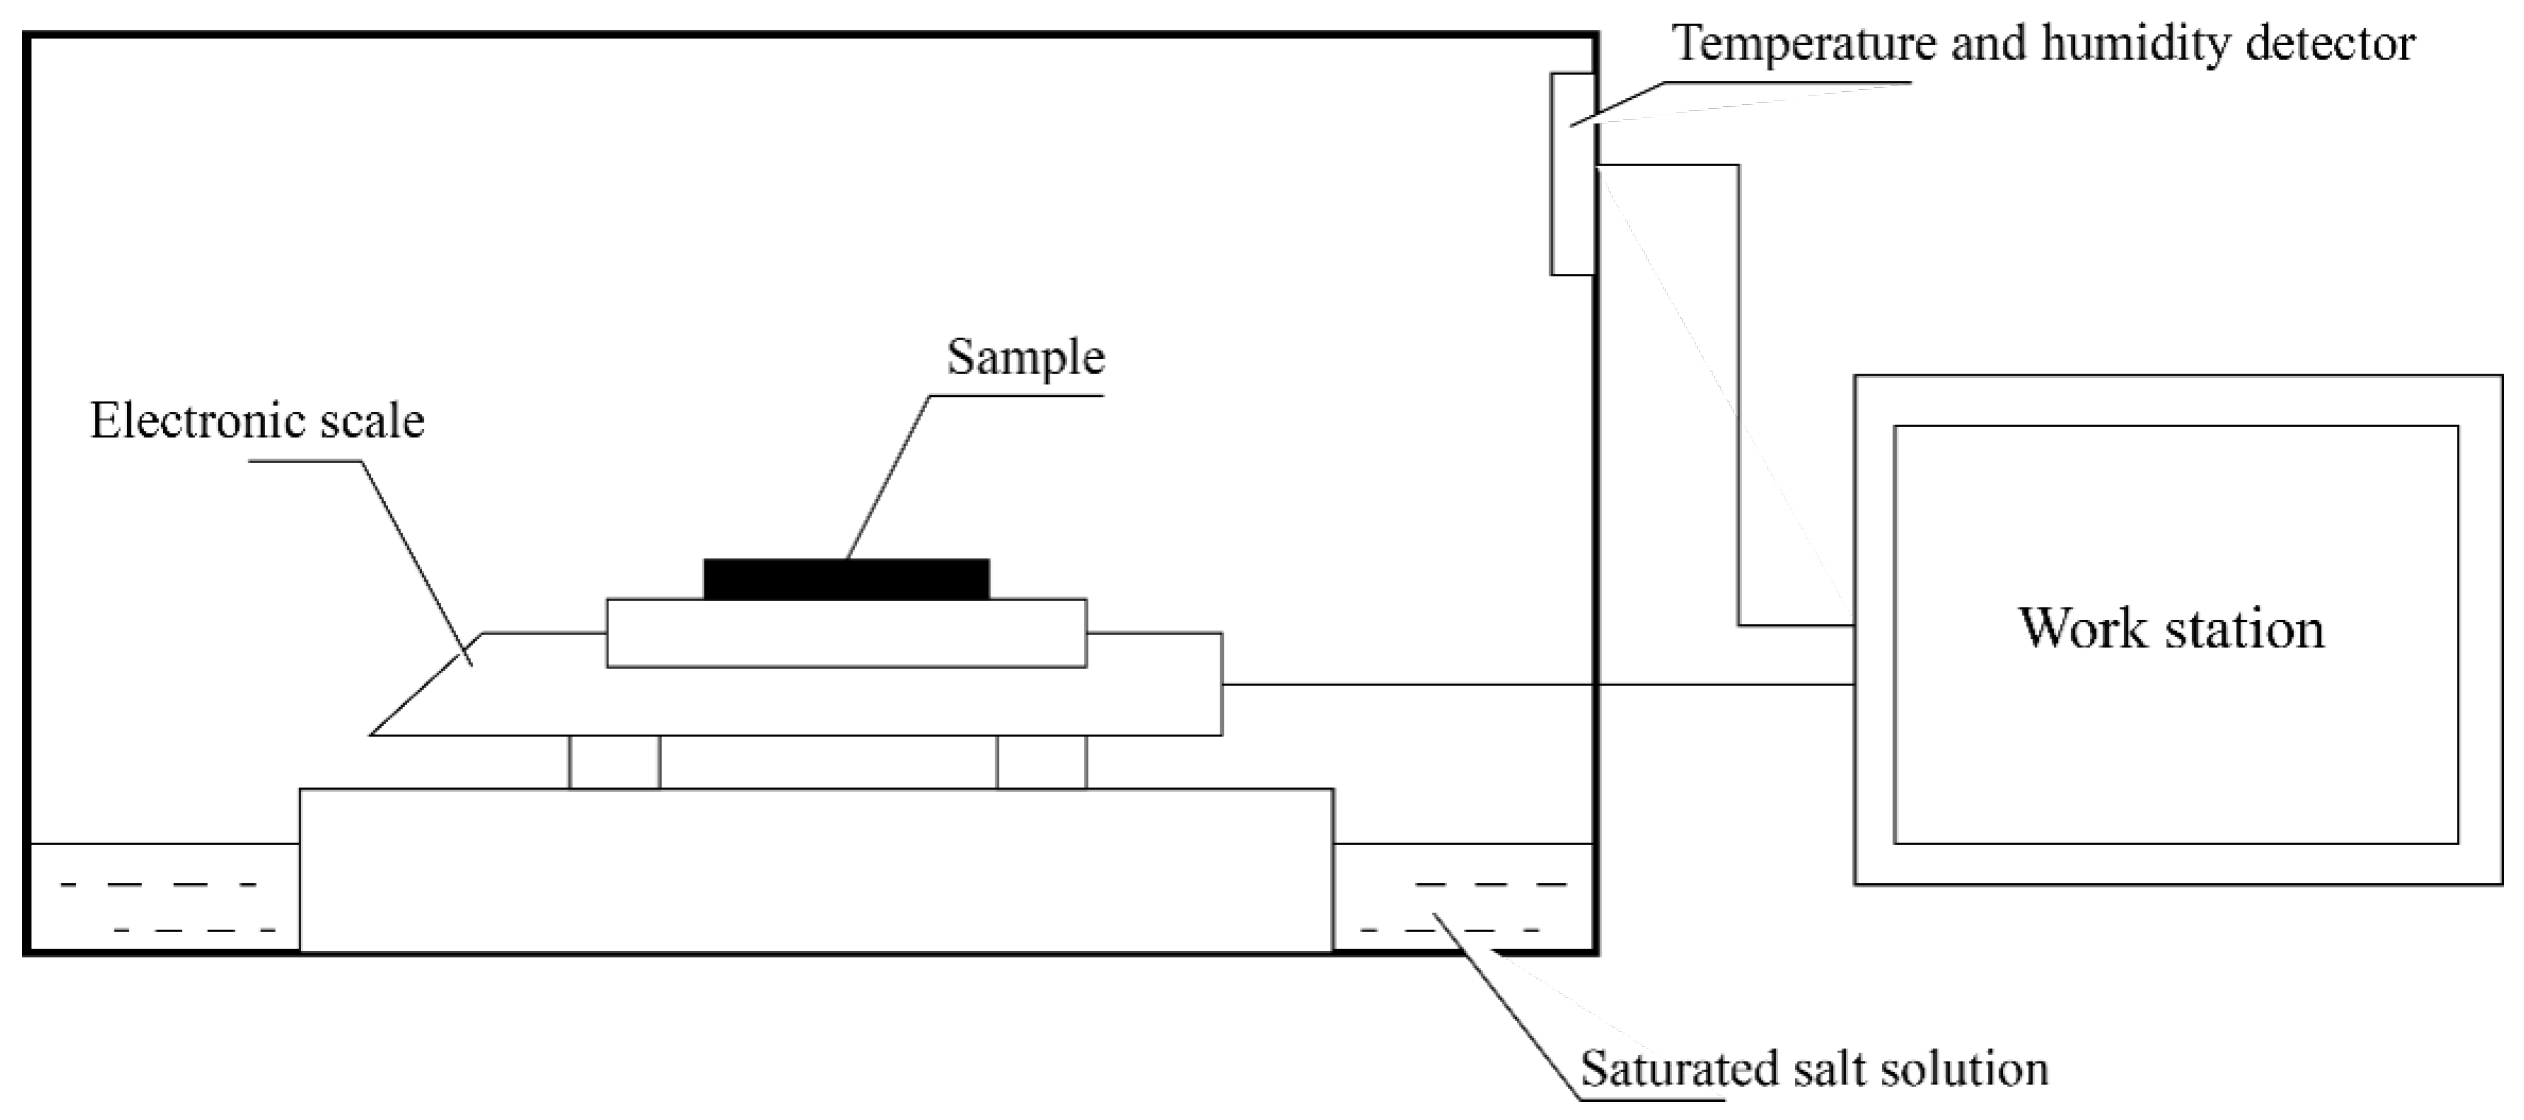
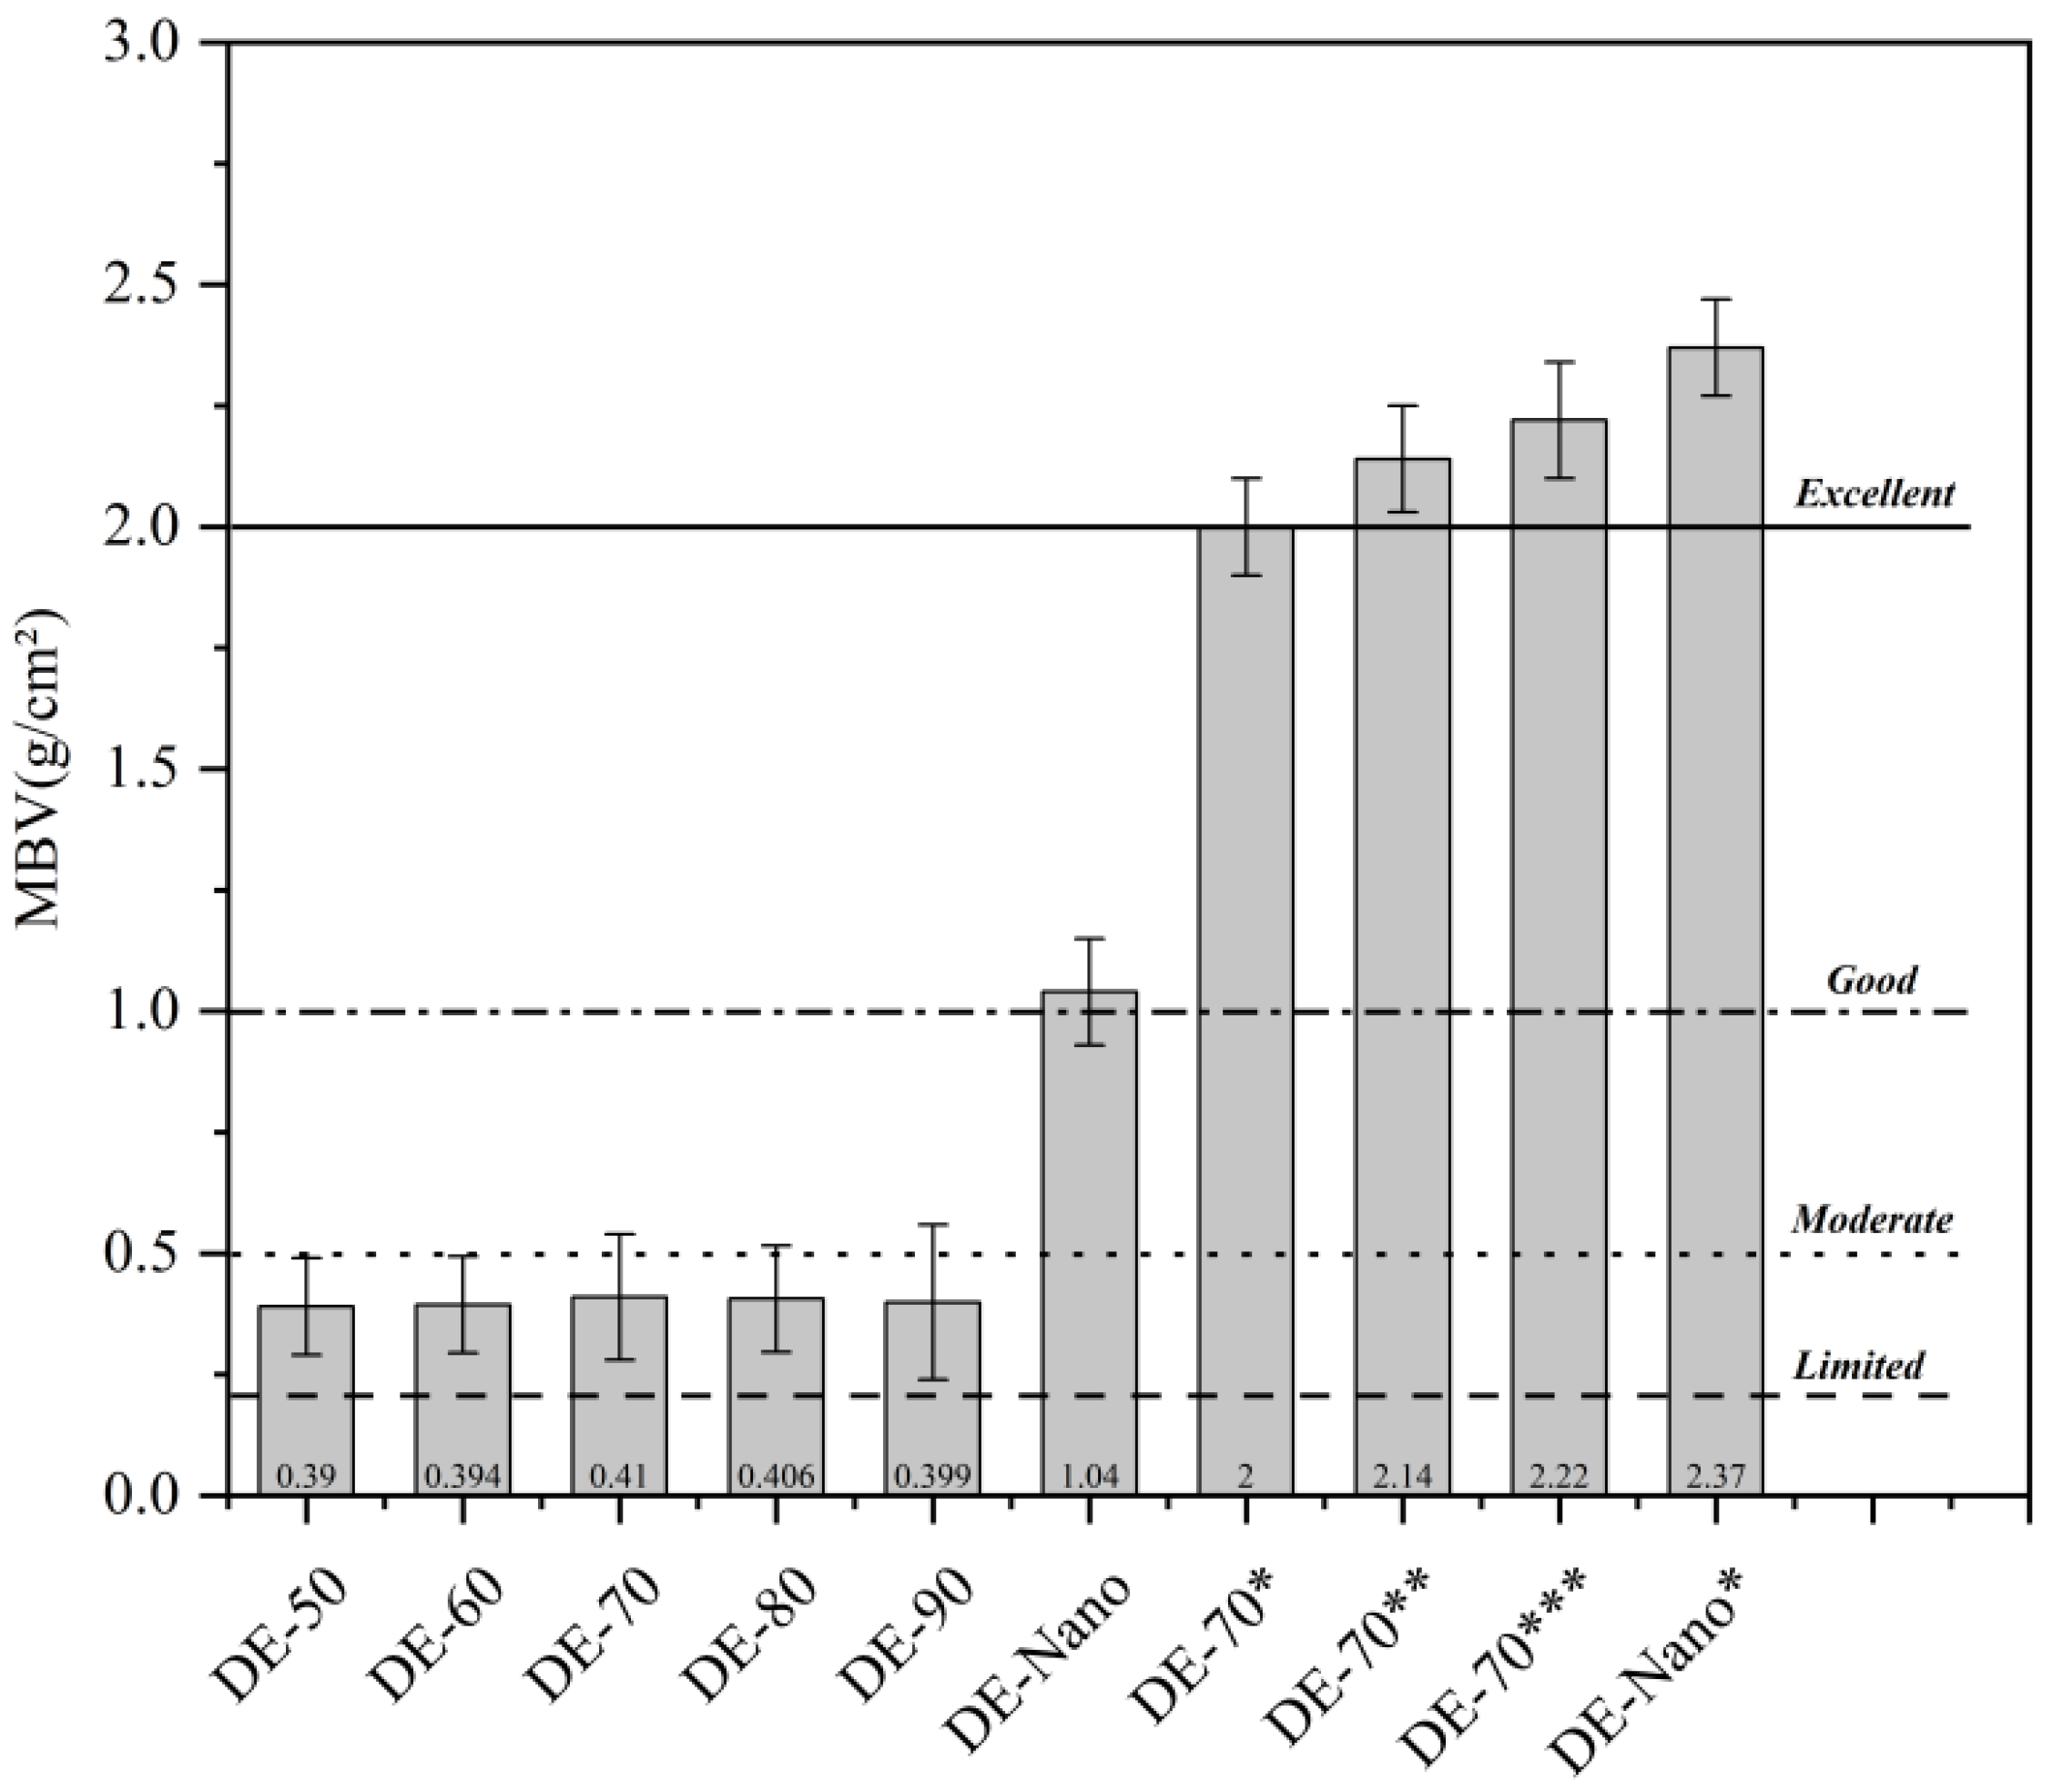
2.4. Moisture Buffer Value

The moisture buffering capacity should be investigated to indicate the hygroscopic behaviour of a material. Hygroscopic materials have a strong affinity for the adsorption and desorption of moisture upon exposure to ambient air, reaching equilibrium with the relative humidity in the surrounding environment. Several methods exist to assess a material’s moisture buffering capacity [27]. In light of this study’s focus on evaluating the moisture buffering capacity of hygroscopic materials within real-world settings, the selected method is the practical moisture buffer value M B V p r a c t i c a l derived from the Nordtest approach [28].
Practical moisture buffer value, M B V p r a c t i c a l , is defined as the amount of moisture absorbed by the material when exposed to variation in relative humidity of the surrounding air.
M B V p r a c t i c a l = Δ m A · Δ R H · 100
where M B V p r a c t i c a l is practical moisture buffer value [g/( m 2 .%RH)], Δ m is moisture uptake/release during the period (g), A is open surface area ( m 2 , RH is relative humidity level (%). For the present study, M B V p r a c t i c a l values of samples are determined.
In addition to the direct description of the assemblies’ moisture buffer values, the capacity of materials can also be categorized in terms of their moisture buffer classes [19]. As shown in Table 2, the materials’ moisture buffer values are classified into the following categories [27]:

3. Result and Discussion

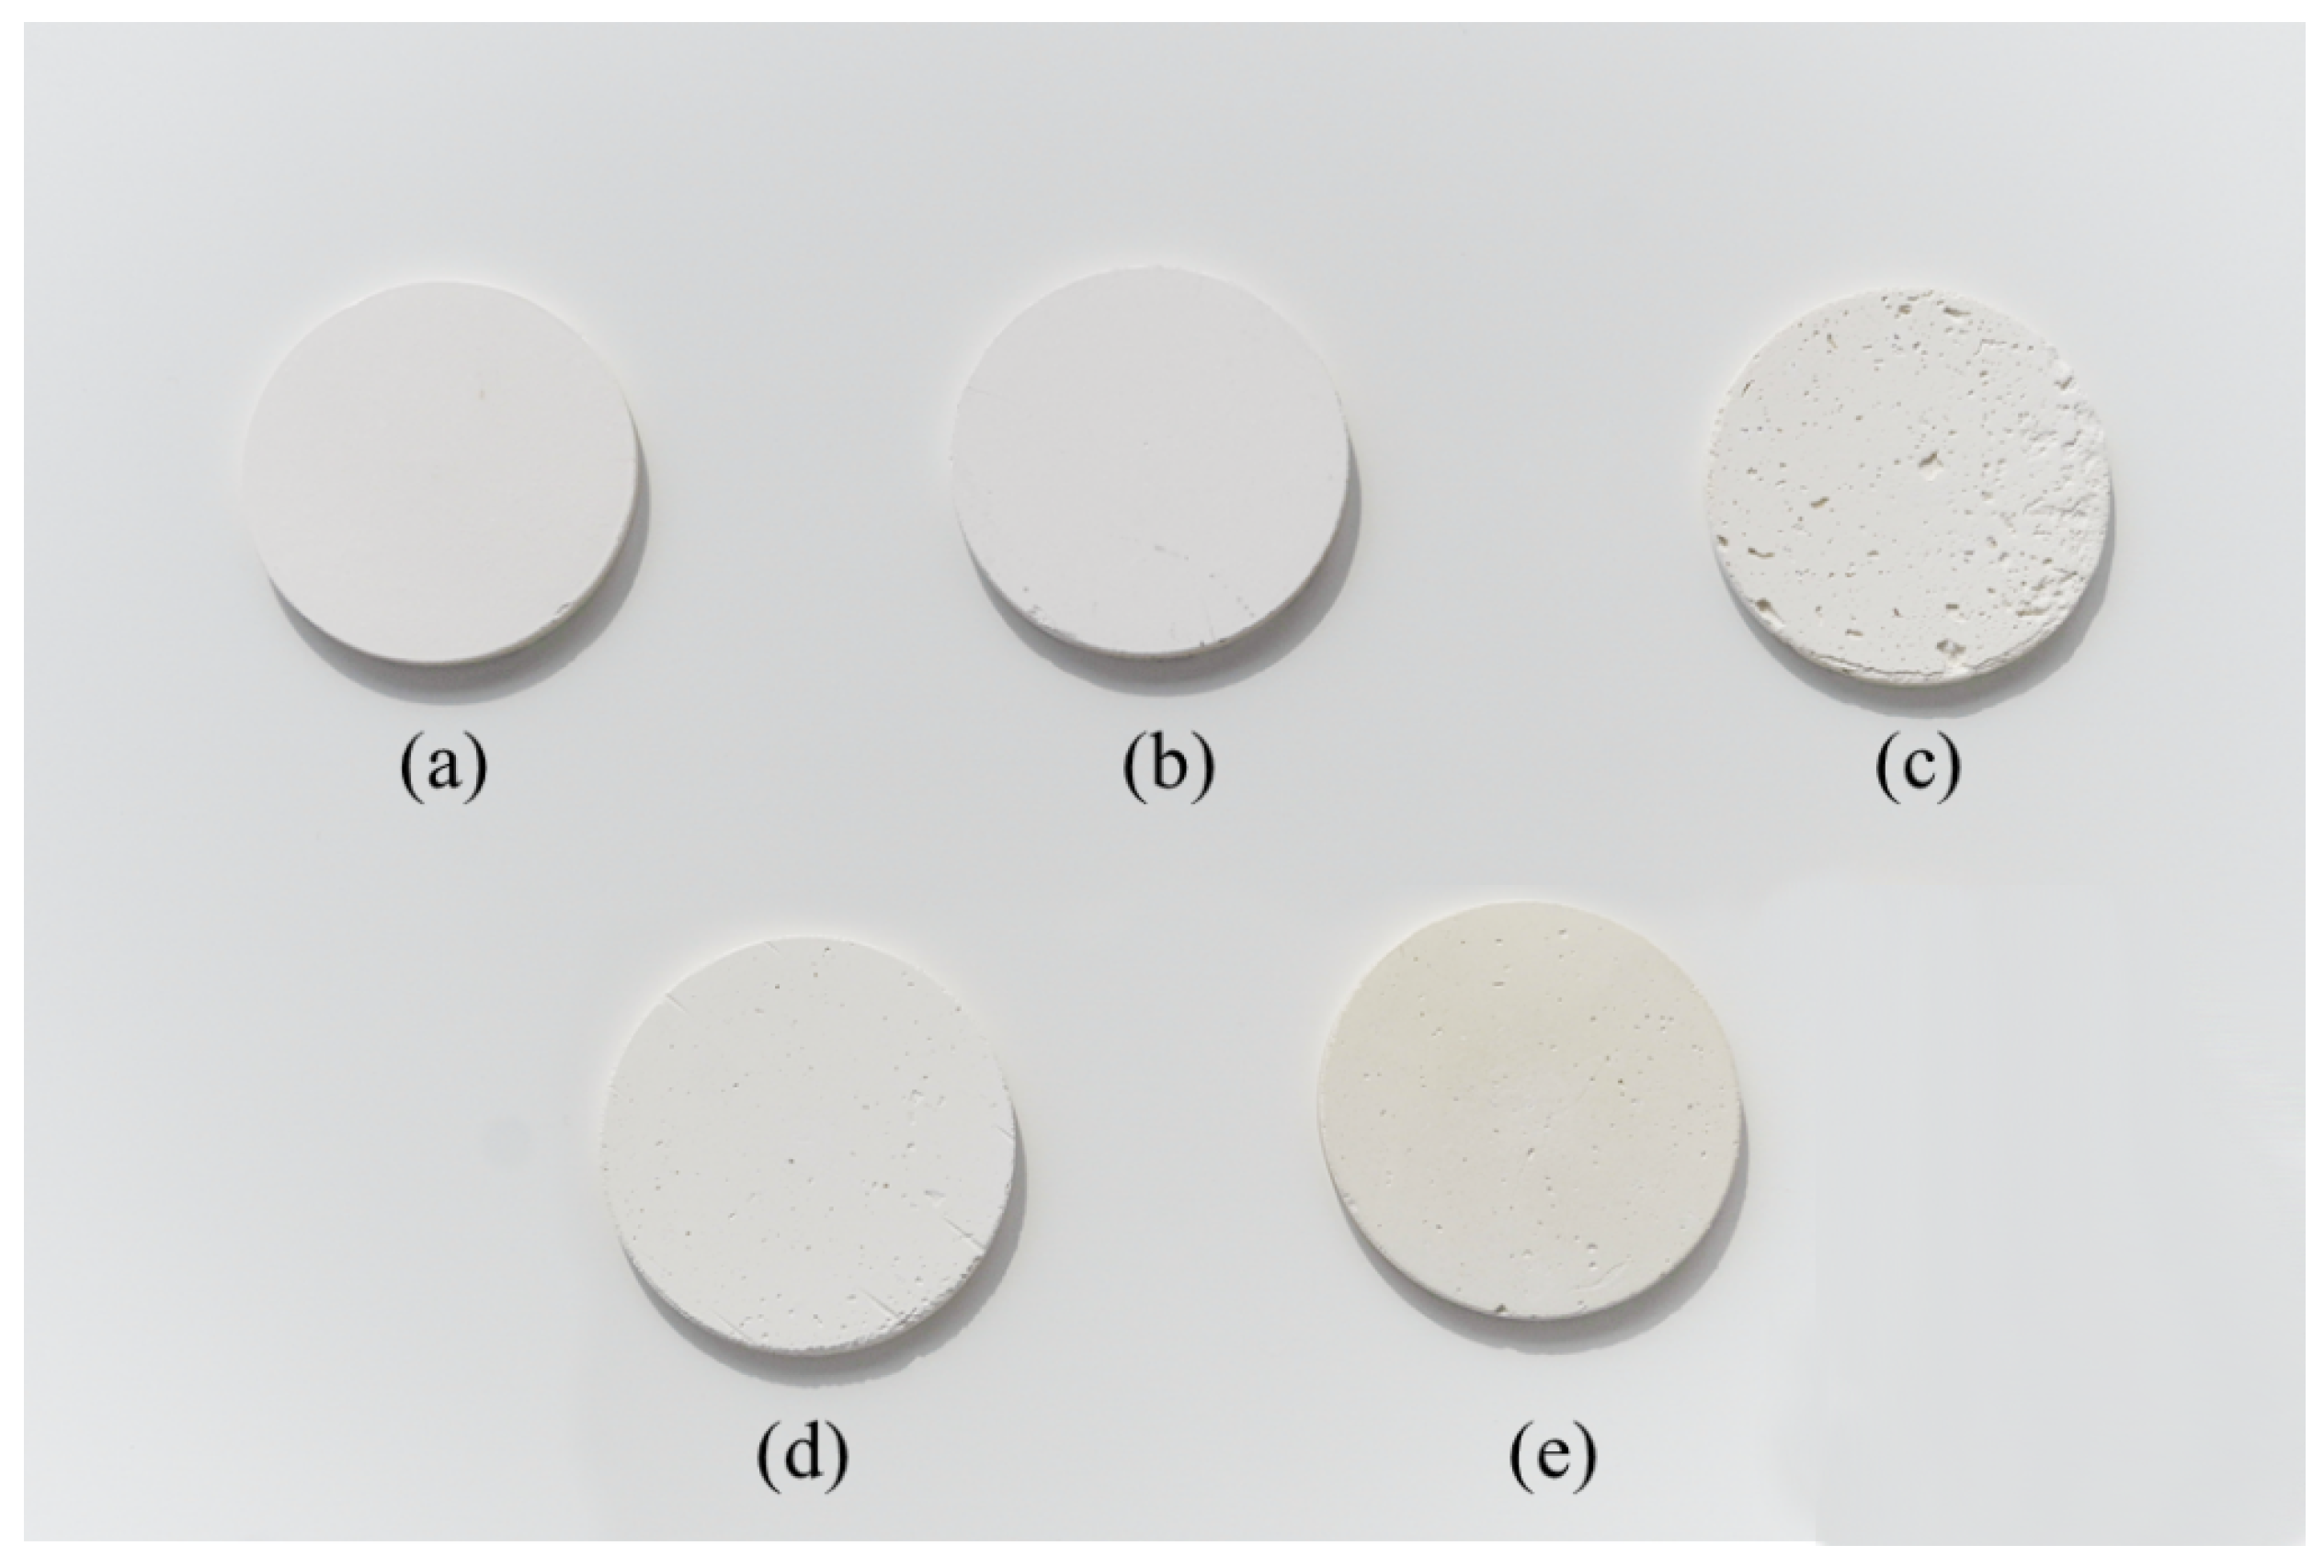
3.1. DE Composite Samples
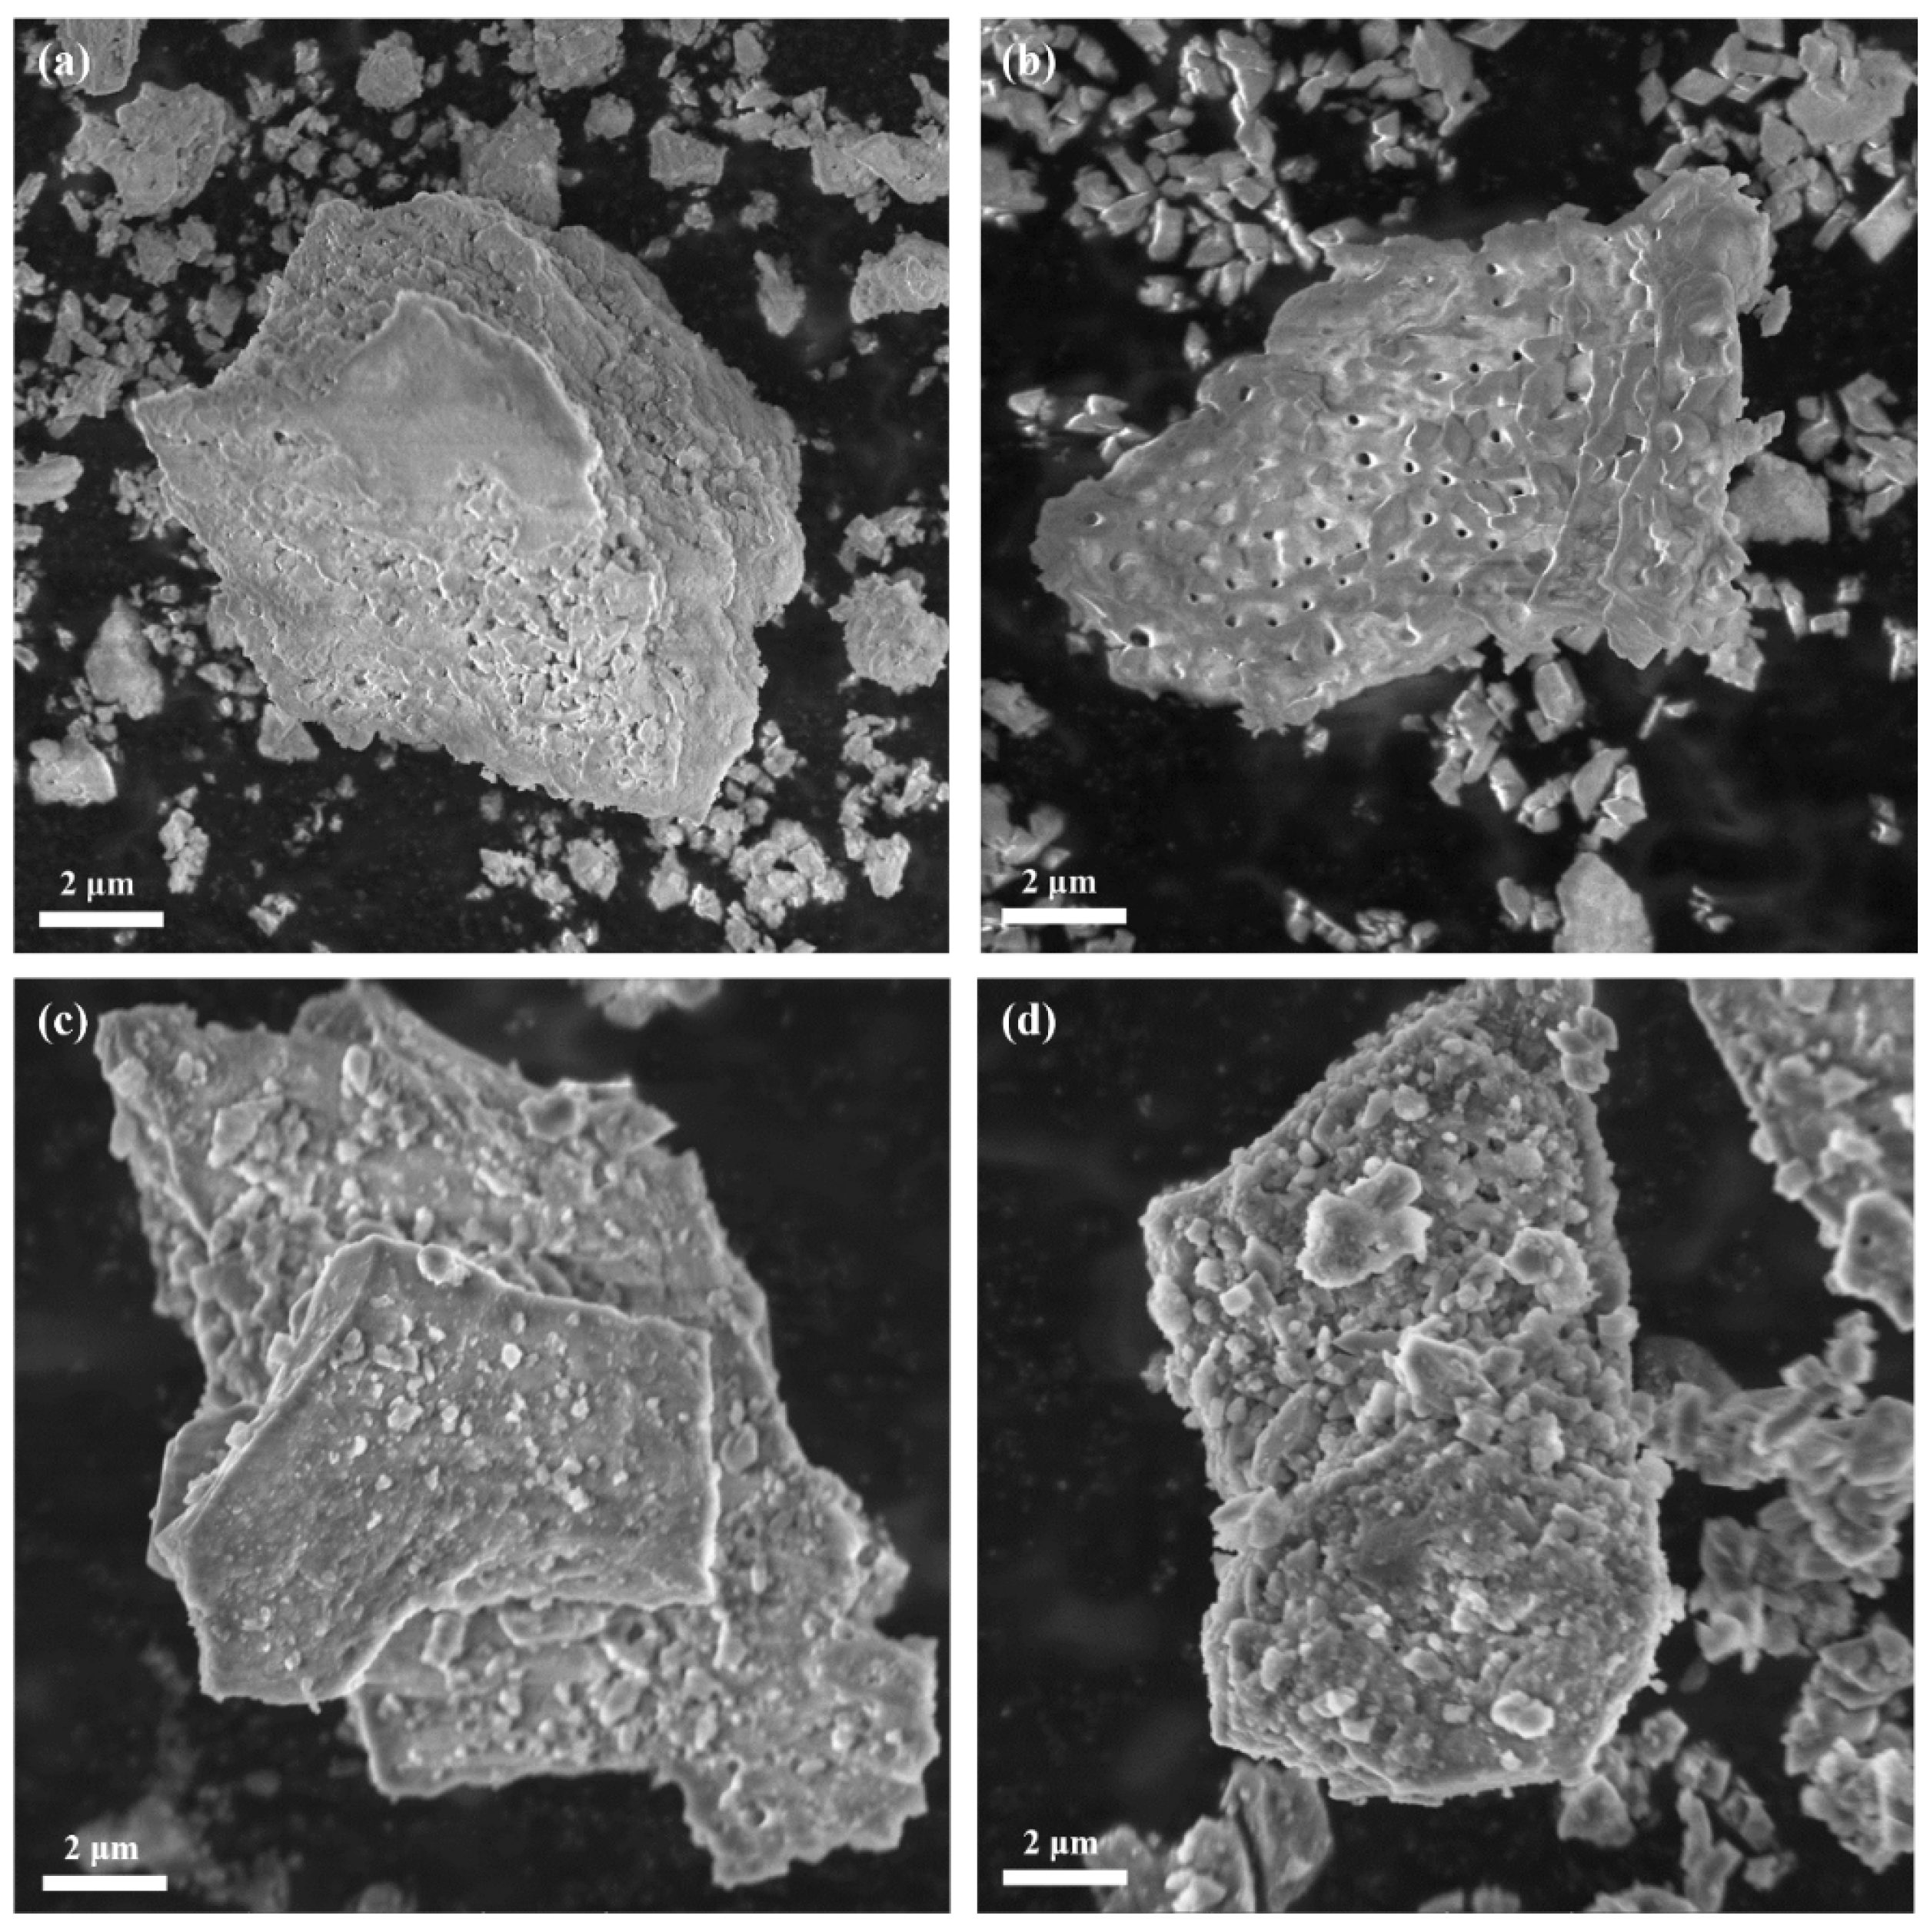
The macroscopic observation of the samples reveals distinct differences in appearance, as shown in Figure 2. The DE-70 sample exhibits a white colour and a smooth surface texture. In contrast, DE-Nano, which contains added nano-silica, maintains a similar smooth appearance. Following ultrasonic acid washing, the surface structure of DE-70 is reduced, exposing millimeter-sized pores. The sample impregnated with hygroscopic salt LiCl presents a darker and more yellowish hue than DE-70 and DE-Nano. This colour change is likely attributed to the formation of LiCl hydrate during solution preparation, which absorbs specific wavelengths of light, resulting in the observed darker, yellowish appearance.

3.2. Morphology

The SEM pictures of the samples are shown in Figure 3. The original particles of DE-70 exhibit a high degree of dispersion, as shown in Figure 3a, with numerous micrometer-sized pores evident, preserving the natural DE’s intact structure. Figure 3b illustrates that porous DE ceramics feature nanometer-sized pores with uniform and stable sizes, indicating a bimodal size distribution of nano- and micrometer-sized pores. The samples (DE-70* and DE-Nano*) under LiCl (32%) loading showed mesopores in the original particles filled with crystalline salt particles and some crystal particles still adhering to the surface of the sample particles. The SEM results demonstrate that the natural DE prepared at 950 °C effectively maintains the pore structure without collapse or blockage. The pore-forming agent, calcium carbonate, decomposes as expected, and the pore gradient remains intact.
Figure 2. (a) DE-70, (b) DE-Nano, (c) DE-70 (after ultrasonic acid washing), (d) DE-Nano (after ultrasonic acid washing), (e) DE-70* (loaded with LiCl).
Crystals 15 00158 g002
Figure 3. (a) DE-70, (b) DE-Nano, (c) DE-70 under LiCl loading, (d) DE-Nano under LiCl loading.
Crystals 15 00158 g003
Samples with good pore structure and gradient facilitate water absorption and retention. In the optimization supplementary experiment, the acid-washing process removes impurities from the sample’s surface without significantly damaging its original structure. While the salt solution is loaded into the mesopores of the sample, further precise control of the salt concentration is achievable. However, excessive attachment of hygroscopic salt crystals to the surface of the particles may lead to overabsorption of moisture by the porous ceramic samples, resulting in the pores being unable to retain the excess liquid, causing water to overflow.

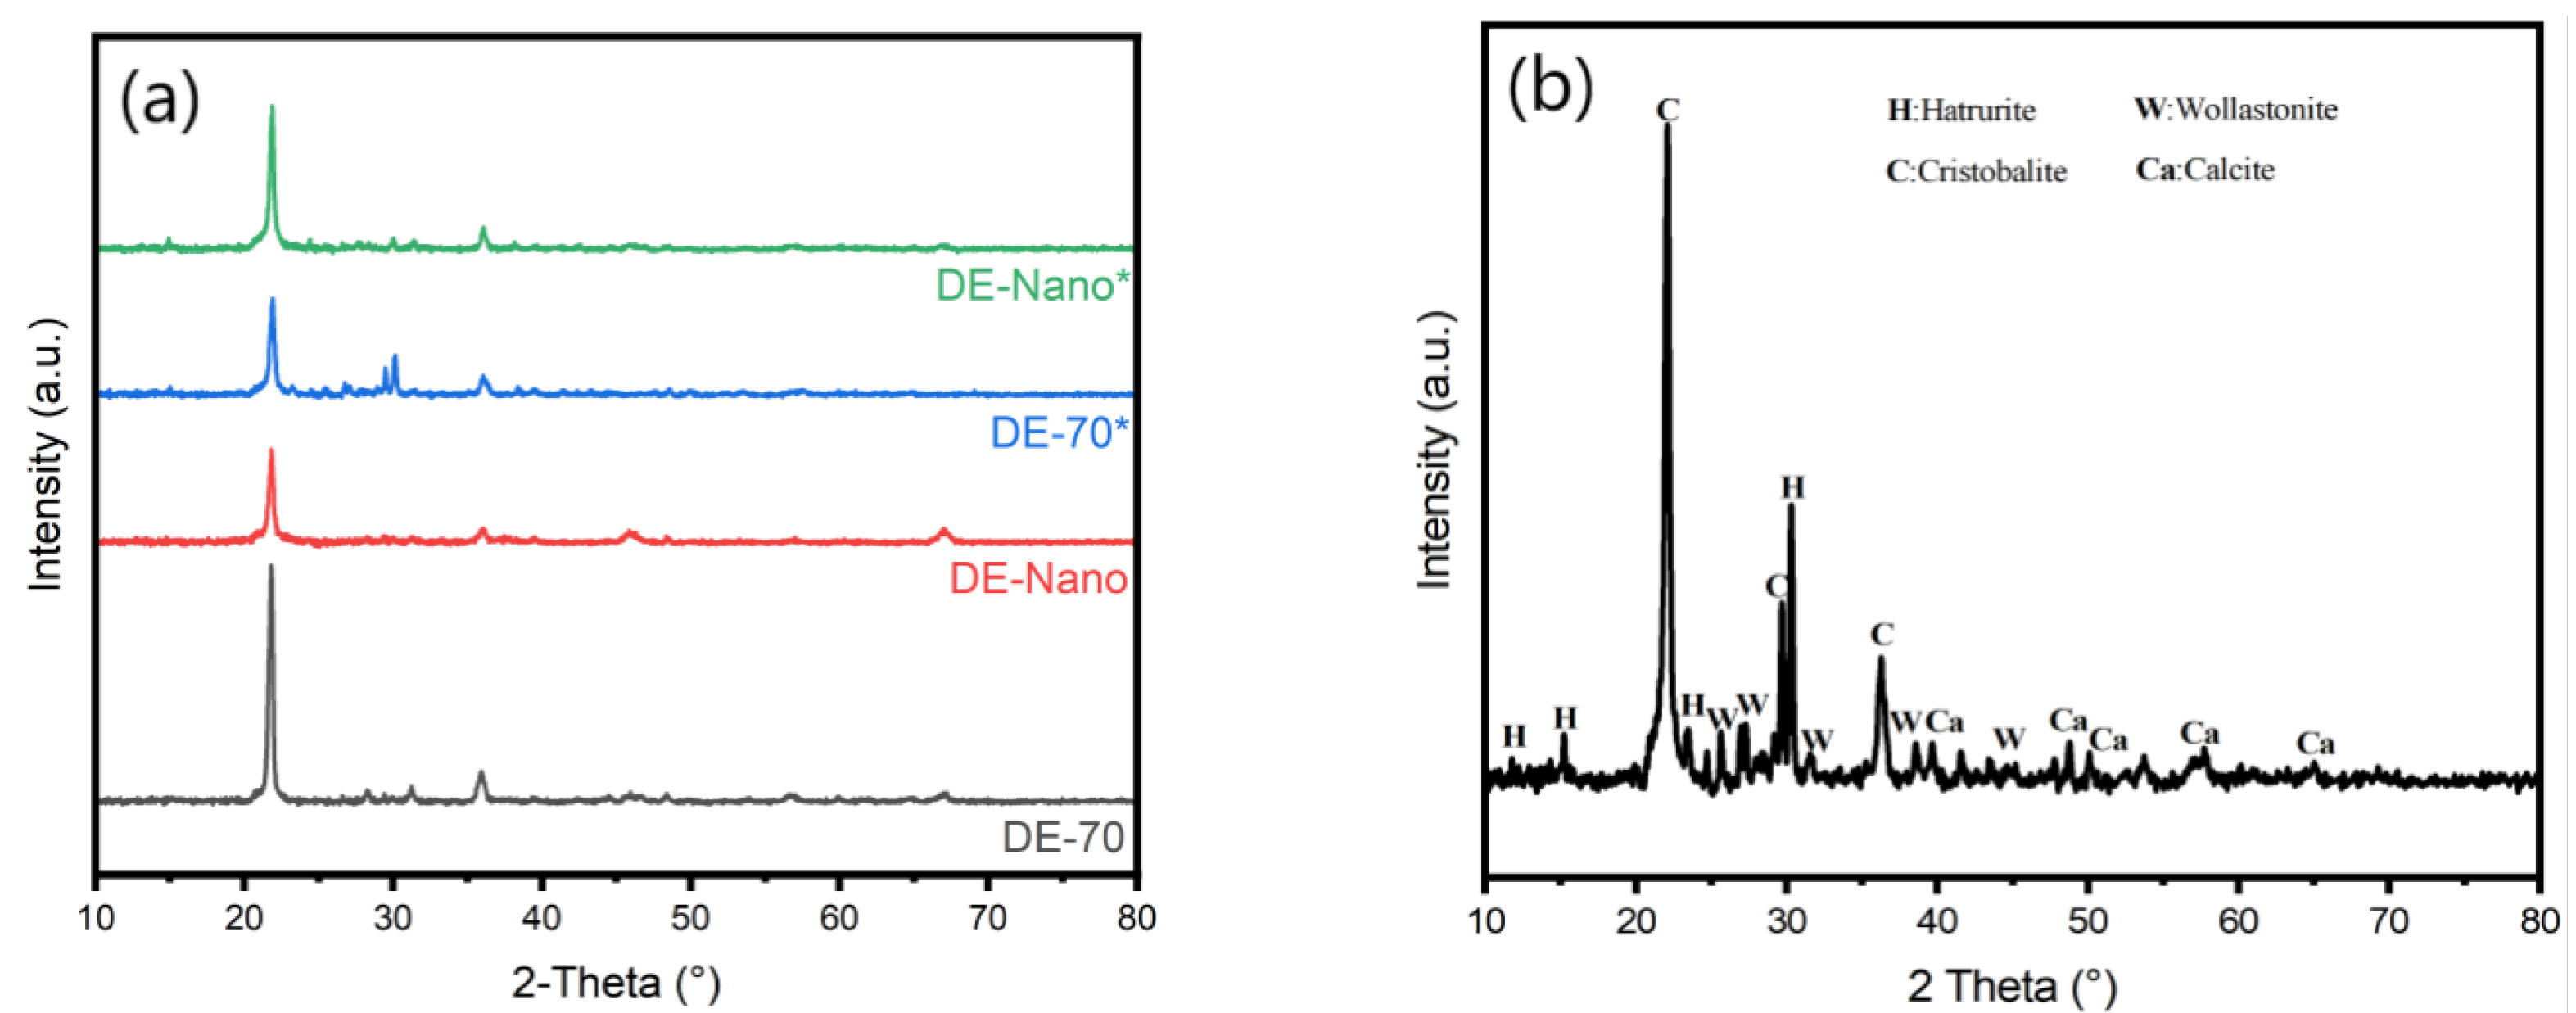
3.3. Crystal Structure

The XRD results of the four prepared samples are illustrated in Figure 4a. The diffraction peaks in the porous water-absorbent ceramics remain unchanged before and after the modification with LiCl. There is no appearance of diffuse scattering peaks from LiCl. The positions of the prominent peaks in both patterns are consistent, indicating that the crystal form of the porous water-absorbent ceramics remains intact after adding LiCl. Therefore, the crystal structure of the ceramics is not altered by adding LiCl.
Figure 4b exhibits the XRD result of the sample DE-70*, demonstrating superior performance in the moisture absorption test. The peaks observed at 21.9°, 30.1°, and 35.9° in the graph correspond to the characteristic peaks of Cristobalite. Cristobalite, a polymorph of silicon dioxide distinct from quartz, shares an identical chemical composition but features a particular tetragonal crystal structure.
With its complex tetragonal lattice compared to quartz, Cristobalite presents notable peaks at 14.7°, 23.3°, and 30.1°, indicative of Hatrurite. Hatrurite primarily comprises calcium silicate with a significant aluminium content, typically represented by the chemical formula Ca 3 Al 2 ( SiO 4 ) 3 . This result suggests a reaction between added bauxite in the raw materials and silicon dioxide at elevated temperatures, resulting in the formation of silicate phases, accounting for the observed strength enhancement in the sample. Although Wollastonite, another silicate containing Fe elements, was not directly introduced into the raw materials, the presence of Fe elements in the piece is attributed to metal oxides in the diatomaceous earth components. The characteristic calcite peaks in the graph imply that calcium carbonate or calcium oxalate produced due to the reaction between oxalic acid and calcium carbonate during cleaning may still be contained in the sample. However, there is no characteristic diffraction peak of calcium oxalate in the spectrum, so the degree of reaction is relatively small and the characteristic calcite peaks indicate that the added calcium carbonate might not have completely decomposed. In addition, there is no diffraction peak of LiCl crystal in the diffraction pattern of DE-70*, which also indicates that the loading of hygroscopic salt does not change the crystal structure of the sample.

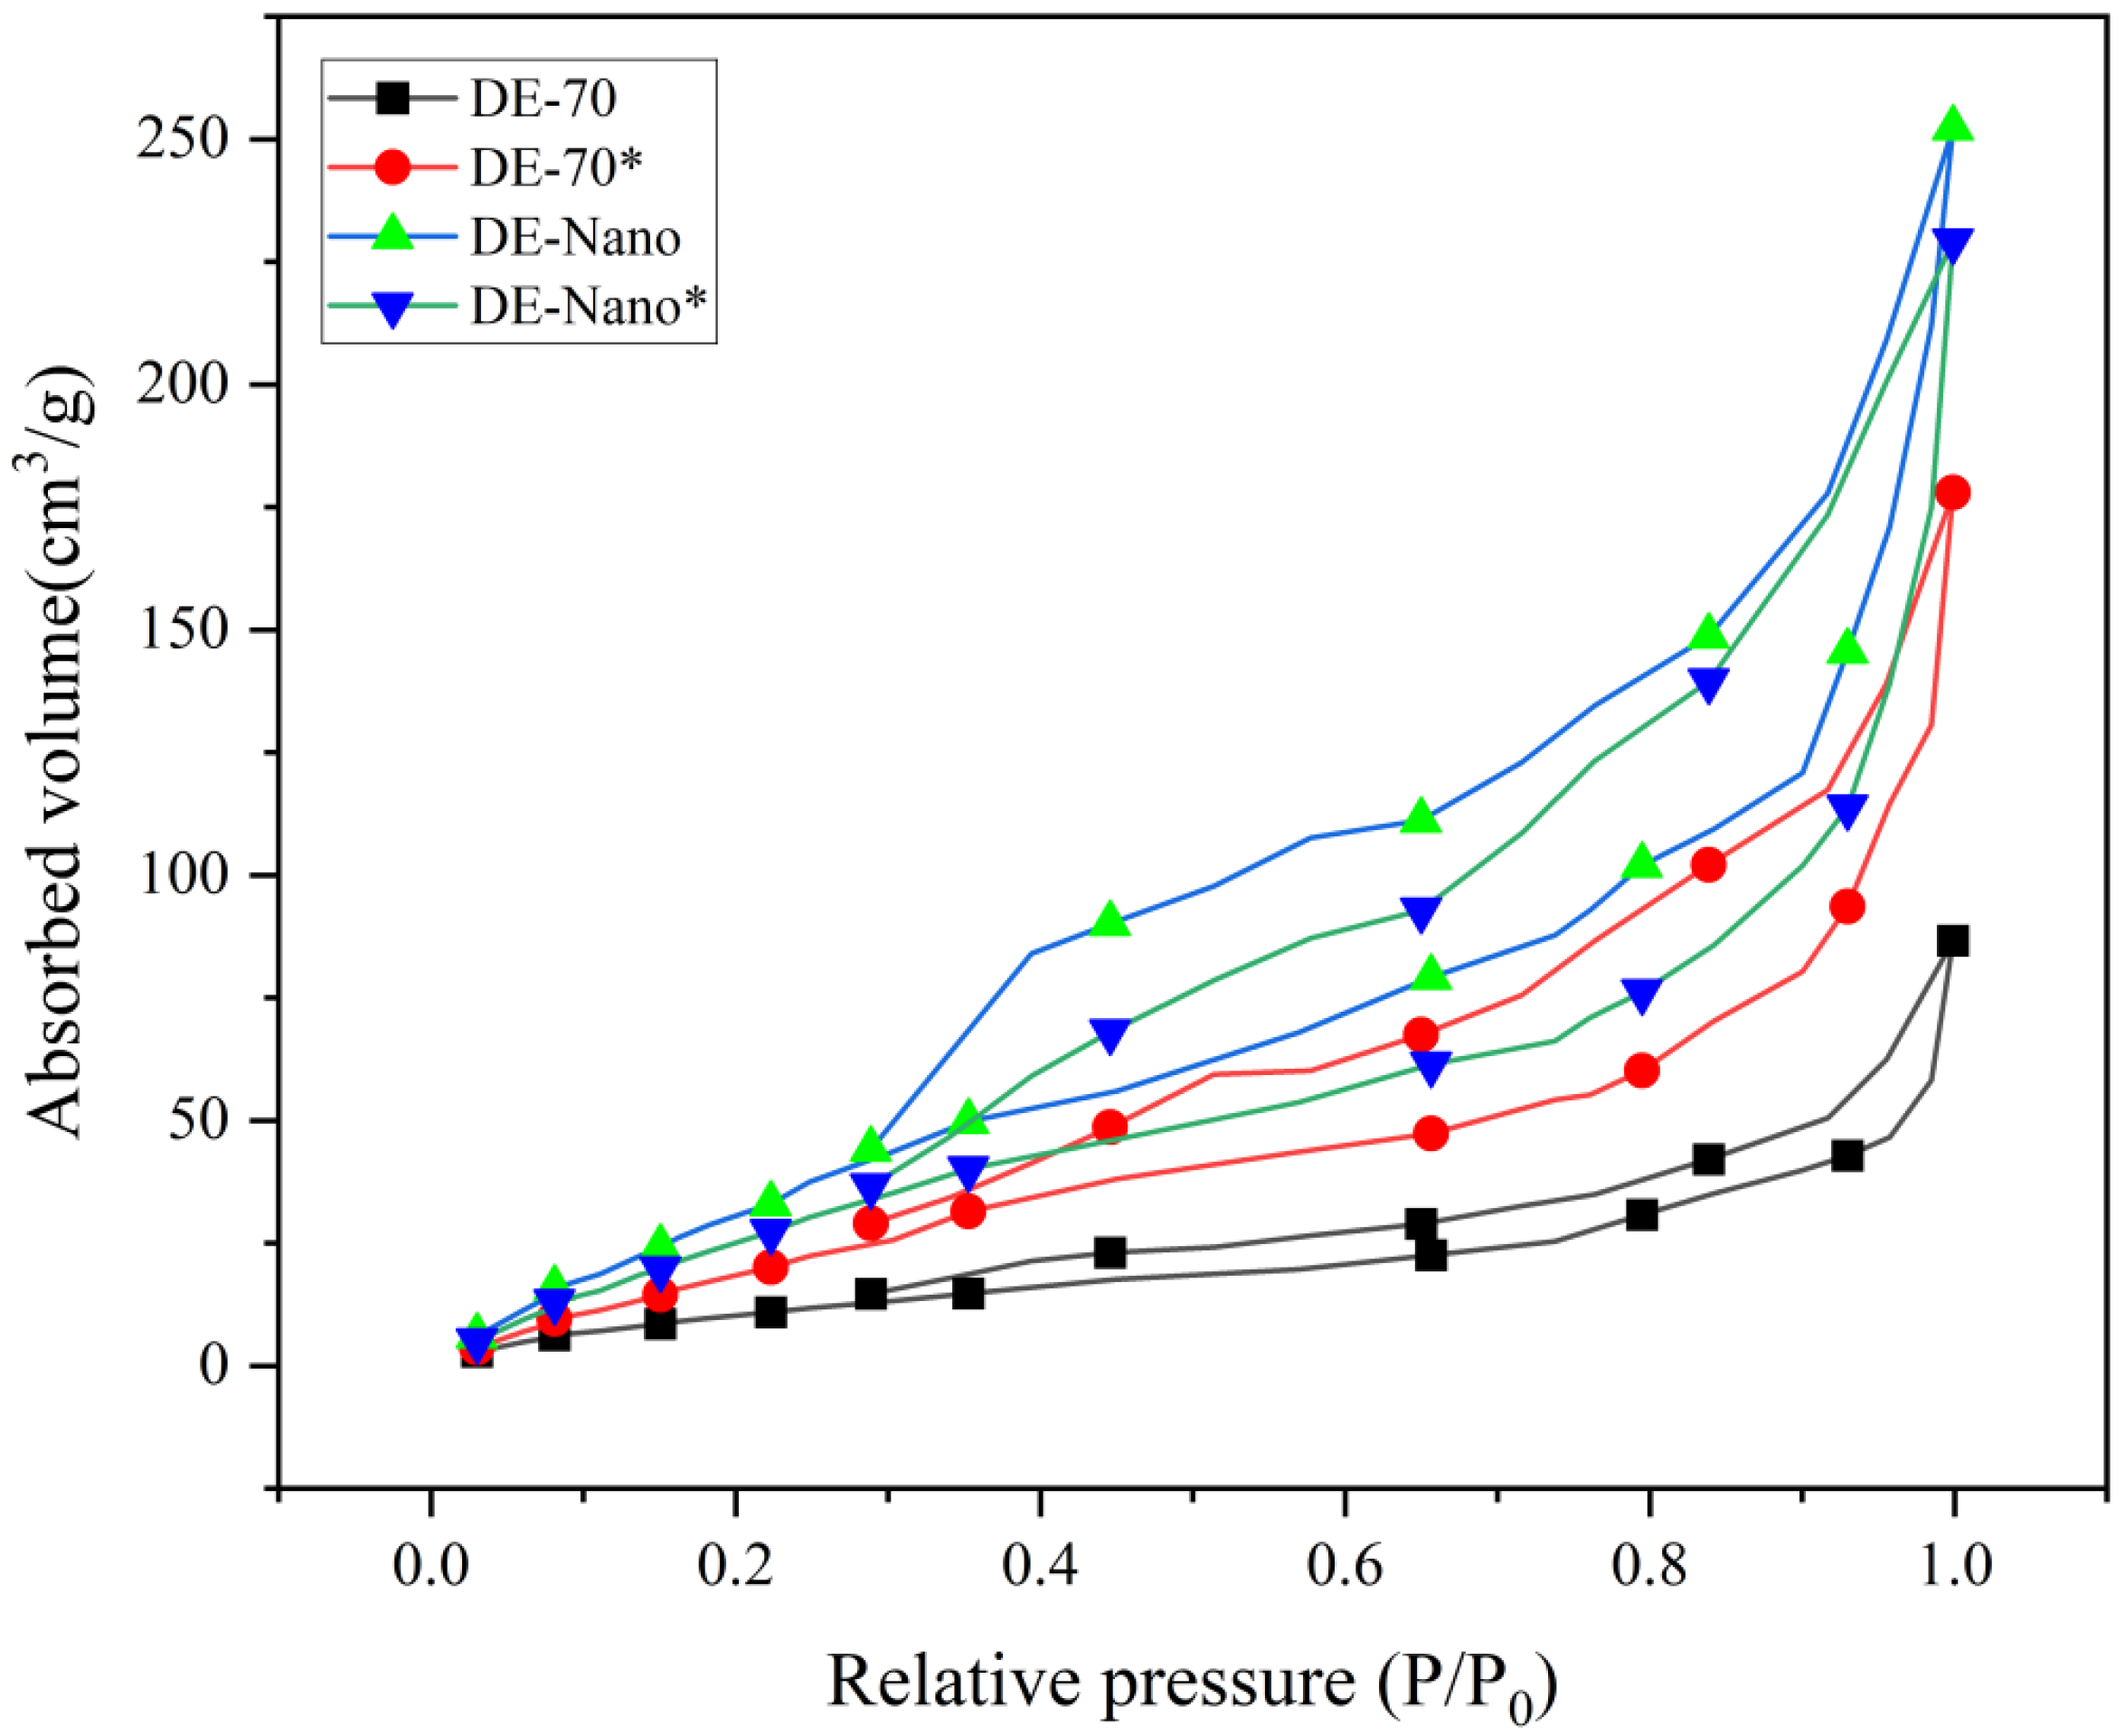
3.4. BET Specific Surface Area

The nitrogen adsorption–desorption isotherms in Figure 5 exhibit pronounced hysteresis loops across all samples. The desorption pathway differs from the adsorption pathway, forming a consistent hysteresis loop by Type H4 as per the IUPAC classification [29,30]. This observation supports the indication that the sample possesses a microporous structure. Table 3 displays the nitrogen adsorption–desorption results, revealing that including nanoscale DE particles increases the proportion of mesopores in the sample, thereby enhancing its specific surface area. DE-Nano is expected to exhibit superior water adsorption characteristics, with mesopores aiding in water vapor absorption from the surrounding environment. The loading of hygroscopic salts reduces the surface area and porosity of the sample, indicating successful loading into the pores.

3.5. Humidity-Regulating Property

This investigation focused on the sample’s ability to interact with moisture. From an application perspective, we quantified the sample’s maximum water retention capacity, response speed, and absorption–desorption capacity to environmental moisture in a high-humidity environment.
Figure 6a depicts the moisture absorption capacity of the samples. Altering the composition ratio of the DE-AlOOH composite samples (DE-50, DE-60, DE-70, DE-80, DE-90) did not produce a discernible effect on their water absorption capacity during direct water contact tests. The prepared DE-AlOOH composite hygroscopic material consistently exhibits a static water absorption rate exceeding 40%, demonstrating minimal variations. Comparative analyses were conducted between the samples and two commercially available moisture-absorbing products ’Marna’ and ’DP-Breath’, indicating a significant superiority in the samples’ moisture absorption capacity.
The capability of hygroscopic material to retain water reflects the amount of humidity it absorbs. A larger water storage volume can impart a stronger influence on the surrounding humidity levels. Upon adjusting the raw material particle size for the DE-70 sample, as illustrated in Figure 6b, an inverse correlation can be seen between the sample’s water absorption rate and the particle size of the raw material. The BET and SEM results indicate that increased raw material particle size proportionally reduces the sample’s porosity. This is because larger particle sizes possess relatively more minor external surface areas under equivalent volume conditions. During stacking, their contact surface area diminishes, resulting in the formation of smaller pores. Conversely, smaller particle sizes exhibit relatively larger external surface areas, increasing contact points during stacking. Consequently, samples formed from smaller particles demonstrate reduced interstitial space and lower porosity due to the closer packing of the particles.
Figure 7a displays the moisture absorption performance of the initial DE-AlOOH sample synthesis. DE-AlOOH (13 μ m) fails to meet humidity regulation requirements. Upon microscopic structural analysis, this deficiency arises due to its limited mesoporous quantity, consequently hindering both microspore filling and capillary condensation, mainly leading to physical adsorption. Figure 7b compares the moisture absorption performance between models with reduced raw material particle size (13–3.5 μ m) and the introduction of nanoscale (4–70 nm) gaseous SiO2 as the primary component with DE-70. The findings highlight a positive impact on the sample’s humidity absorption capacity following these adjustments, increasing the saturation moisture absorption from 5.3% to 13.8%. This indicates that reducing the size of raw material particles increases the porosity of the material, facilitating capillary condensation. Three parallel experimental groups were established to address excessive moisture absorption in composite materials. Different concentrations of LiCl solution were loaded into DE-70, dried, and subjected to humidity absorption performance tests in the same environment, as outlined in Table 4. LiCl concentrations of 96%, 64%, and 32% were set and denoted in this paper as DE-70*, DE-70**, and DE-70***. The 96% and 64% concentration groups exhibited saturated moisture absorption within the initial 24-h testing period. The plateauing of curves in the graph signifies excessive moisture absorption, notably accelerated by higher concentrations of loaded salt solution. Conversely, the 32% concentration group did not manifest this phenomenon within the same testing duration, reaching saturation at 28.8% even after extending the test period to 36 h. Similar experiments conducted on DE-Nano demonstrated a predominant role in moisture absorption, albeit initiated earlier. This comparative analysis is depicted in Figure 7c. From an applied standpoint, excessive moisture absorption detrimentally affects composite materials. Thus, the performance of DE-70 at a low LiCl concentration (32%) holds practical significance. Figure 7d illustrates the implementation of three selectively representative samples throughout a complete moisture absorption (25 °C RH:85%) and desorption (25°C RH:30%) cycle. Using finer powder for sample synthesis enhances the sample’s moisture absorption capacity. Furthermore, models loaded with low-concentration hygroscopic salts exhibit more robust humidity regulation abilities. Notably, samples loaded with hygroscopic salts at 25 °C did not revert to their initial weight, suggesting that the inclusion of hygroscopic salts not only enhances the sample’s moisture absorption capacity but also elevates the sample’s regeneration temperature, possibly providing a chemical adsorption pathway.

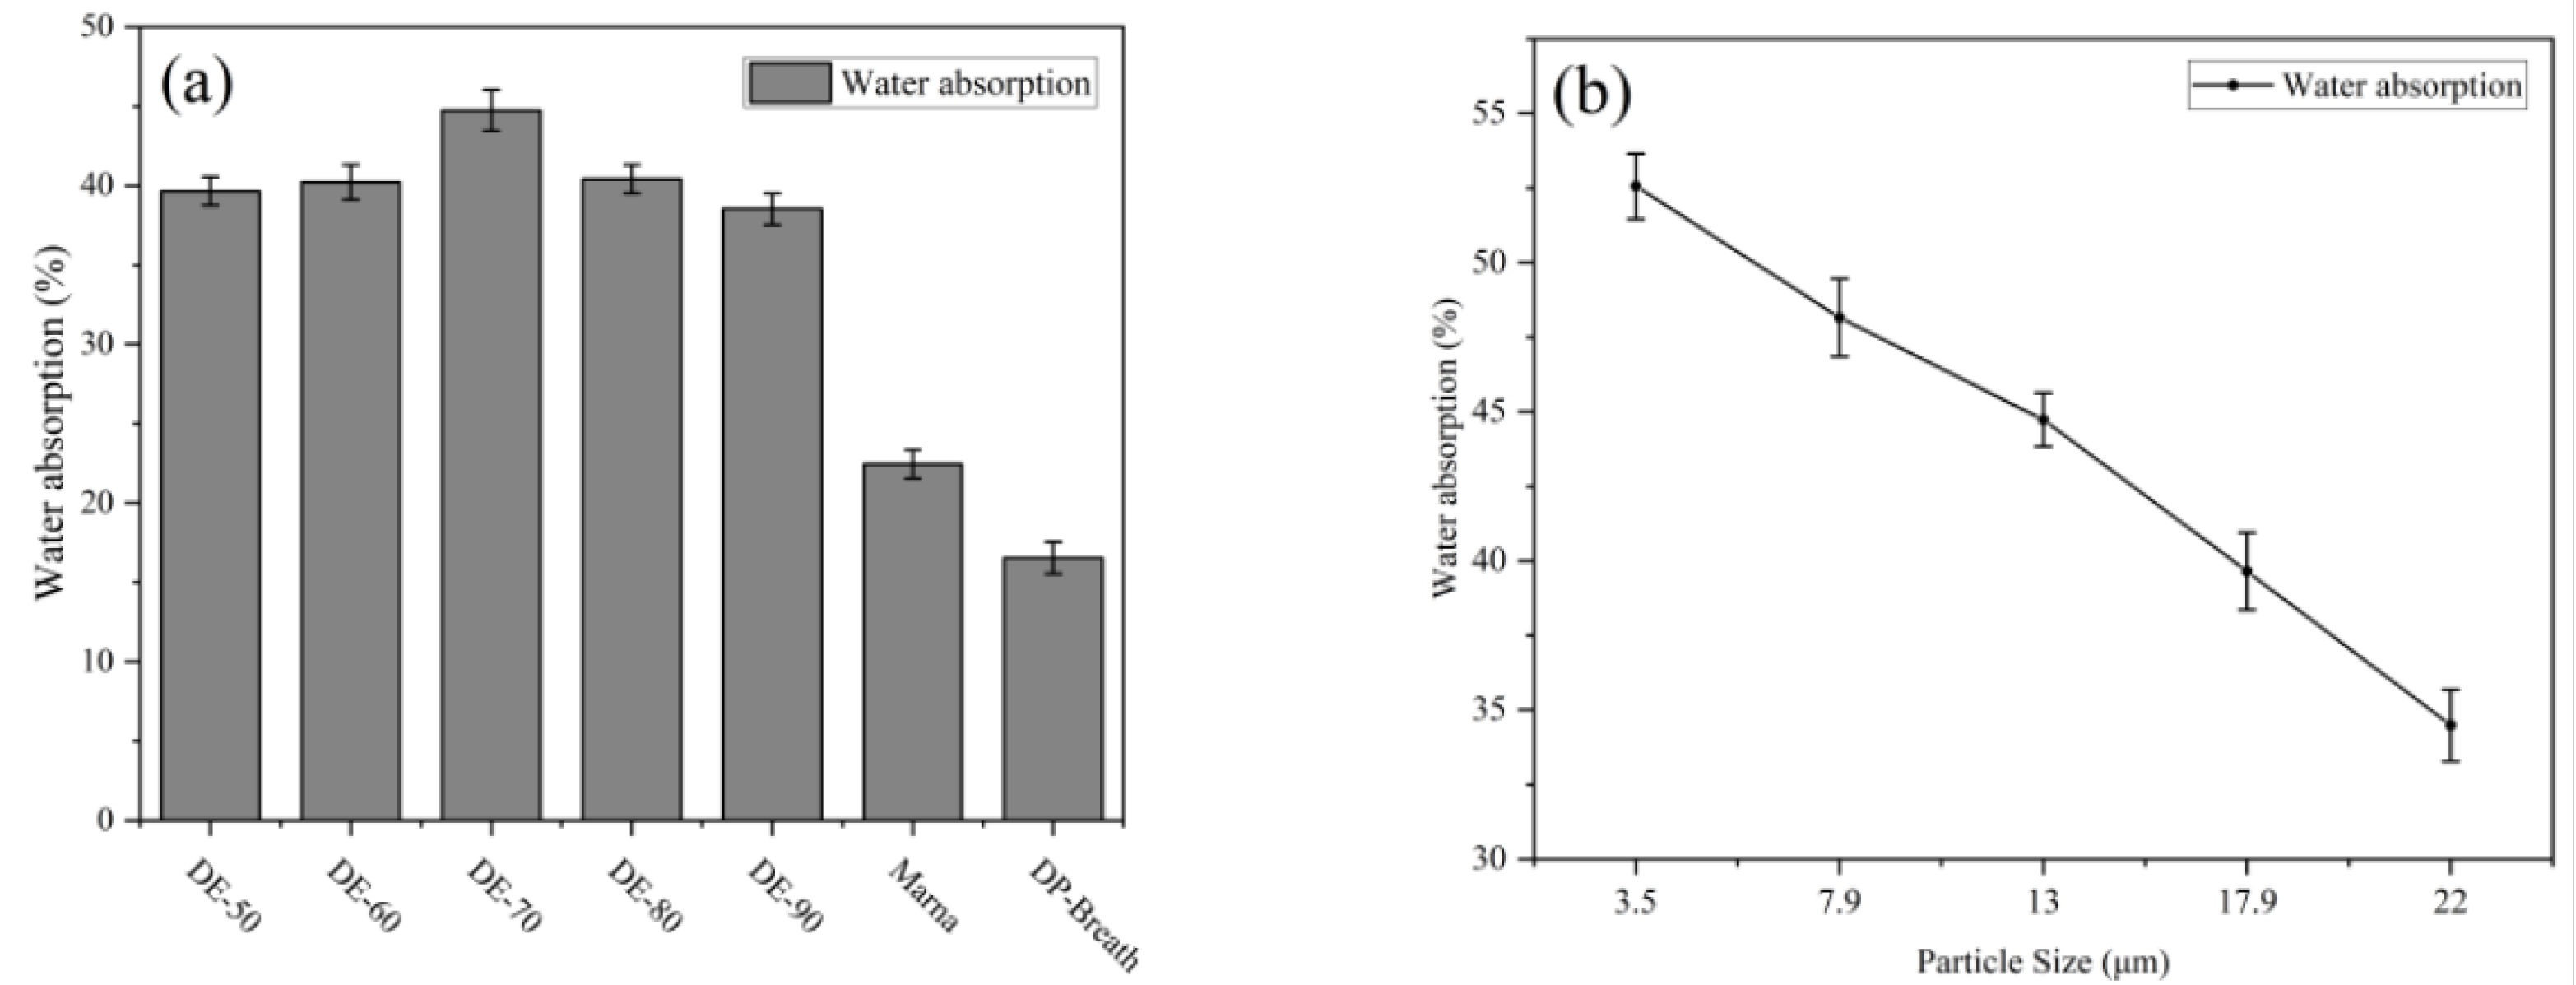
3.6. Performance Investigation

The MBV values for all samples were computed following Equation (2), and the results are illustrated in Figure 8.
The empirical computation outcomes of MBV (moisture buffer value) corroborate the findings obtained from the hygroscopic performance testing of the samples. Upon analyzing the standard MBV results, as shown in Table 5, it becomes apparent that both experimental groups—specifically, the one adjusting the particle size of the raw material (DE-Nano) and the group incorporating hygroscopic salt (DE-70*)—exhibit excellent humidity regulation capabilities. Notably, experimental groups loaded with higher concentrations of hygroscopic salts demonstrate exceptional prowess in humidity control. However, it is essential to note that despite these positive results, their practical application warrants further exploration due to excessive moisture absorption.

4. Conclusions

Using diatomite and boehmite as the primary raw materials, polyvinyl alcohol (PVA) and calcium carbonate as the binder and pore-forming agent, a diatomite-based porous ceramic hygroscopic material was prepared, with a maximum water absorption capacity of 45% on weight. Increasing the hygroscopic performance of the material involves adjusting the particle size of the raw material powder, treating the surface, and adding salt to the material. Experimental analysis and material characterization confirm that adding nanoscale raw material powder can actively increase the mesoporous of the material’s microstructure, thereby improving capillary condensation and enhancing the hygroscopic properties of the material. In addition to removing impurities, acidic surface treatment increases porosity, thus allowing hygroscopic salts to penetrate the material further. Moisture absorption experiments show that loading hygroscopic salts significantly improves the moisture absorption efficiency of porous materials. However, this can also lead to challenges with excessive moisture absorption and solution spillage. The optimal solution (salt solution concentration of 32%) was found by adjusting the loading concentration of hygroscopic salt. The results showed that the treated sample had a hygroscopic capacity of 28.3% of its weight in a high-humidity environment (RH: 85%) and was recyclable. The MBV characterization result is excellent in terms of properties, indicating its ability to adjust indoor humidity levels. Diatomite-based porous ceramic materials and hygroscopic salts have demonstrated their high efficacy in regulating humidity in various application areas. Future research may focus on further tuning the pore gradient and loading other hygroscopic salts.

Author Contributions

Z.Y.: Data Curation, Formal analysis, Investigation, Methodology, Software, Writing—Original Draft, Writing—Review and Editing. M.G.: Resources, Supervision, Validation, Writing—Review and Editing. J.L.: Software, Visualization, Writing—Review and Editing. E.M.: Conceptualization, Funding acquisition, Project administration, Resources, Supervision, Writing—Review and Editing. All authors have read and agreed to the published version of the manuscript.

Funding

This research received no external funding.

Institutional Review Board Statement

Not applicable.

Informed Consent Statement

Not applicable.

Data Availability Statement

Data will be made available on request.

Acknowledgments

The authors would like to thank Xin Cheng from Shenzhen Key Laboratory of Nanoimprint Technology of Southern University of Science and Technology for the support of experimental sample preparation and laboratory use.

Conflicts of Interest

The authors declare no conflicts of interest.

References

  1. Han, J.; Zhang, G.; Huang, Q. Field study on occupants’ thermal comfort and residential thermal environment in a hot-humid climate of China. Build. Environ. 2007, 42, 4043–4050. [Google Scholar] [CrossRef]
  2. Li, B.; Chen, Y.; Zhao, J. An introduction to the Chinese Evaluation Standard for the indoor thermal environment. Energy Build. 2014, 82, 27–36. [Google Scholar] [CrossRef]
  3. Frontczak, M.; Wargocki, P. Literature survey on how different factors influence human comfort in indoor environments. Build. Environ. 2011, 46, 922–937. [Google Scholar] [CrossRef]
  4. Migliore, E.; Yao, Z.; Deng, X. Porous Ceramics for the Design of Domestic Ecologies. In Proceedings of the International Conference on Human-Computer Interaction; Springer: New York, NY, USA, 2023. [Google Scholar]
  5. Viitanen, H.; Ritschkoff, A.C.; Peuhkuri, R. Moisture and bio-deterioration risk of building materials and structures. J. Build. Phys. 2010, 33, 201–224. [Google Scholar] [CrossRef]
  6. Jin, L.; Zhang, Y.; Zhang, Z. Human responses to high humidity in elevated temperatures for people in hot-humid climates. Build. Environ. 2017, 114, 257–266. [Google Scholar] [CrossRef]
  7. Kolokotsa, D.; Santamouris, M. Review of the indoor environmental quality and energy consumption studies for low income households in Europe. Sci. Total Environ. 2015, 536, 316–330. [Google Scholar] [CrossRef]
  8. Zhang, M.; Wang, F.; Dong, S. Moisture buffering phenomenon and its impact on building energy consumption. Appl. Therm. Eng. 2017, 124, 337–345. [Google Scholar] [CrossRef]
  9. Fang, J.; Wang, X.; Zhang, L. Influence of climates and materials on the moisture buffering in office buildings: A comprehensive numerical study in China. Environ. Sci. Pollut. Res. 2022, 29, 14158–14175. [Google Scholar] [CrossRef]
  10. Feng, X.; Zhang, X.; Liu, Z. Metal-organic framework MIL-100 (Fe) as a novel moisture buffer material for energy-efficient indoor humidity control. Build. Environ. 2018, 145, 234–242. [Google Scholar] [CrossRef]
  11. Erdoğan, S.; Akmil Başar, C.; Önal, Y. Particle size effect of raw material on the pore structure of carbon support and its adsorption capability. Part. Sci. Technol. 2017, 35, 330–337. [Google Scholar] [CrossRef]
  12. Bakr, H. Diatomite: Its characterization, modifications and applications. Asian J. Mater. Sci. 2010, 2, 121–136. [Google Scholar]
  13. Zahajská, P.; Komárek, M.; Sochorová, V. What is diatomite? Quat. Res. 2020, 96, 48–52. [Google Scholar] [CrossRef]
  14. Reka, A.; Zuberi, A.; Fatima, S. Diatomaceous earth: A literature review. J. Nat. Sci. Math. UT 2022, 7, 256–268. [Google Scholar]
  15. Akhtar, F.; Rehman, Y.; Bergström, L. A study of the sintering of diatomaceous earth to produce porous ceramic monoliths with bimodal porosity and high strength. Powder Technol. 2010, 201, 253–257. [Google Scholar] [CrossRef]
  16. Aggrey, P.; Andoh, S.; Amoako, P. The structure and phase composition of nano-silicon as a function of calcination conditions of diatomaceous earth. Mater. Today Proc. 2020, 33, 1884–1892. [Google Scholar] [CrossRef]
  17. Kang, Y.; Chang, S.J.; Kim, S. Hygrothermal behavior evaluation of walls improving heat and moisture performance on gypsum boards by adding porous materials. Energy Build. 2018, 165, 431–439. [Google Scholar] [CrossRef]
  18. Grommersch, B.M.; Pant, J.; Hopkins, S.P.; Goudie, M.J.; Handa, H. Biotemplated Synthesis and Characterization of Mesoporous Nitric Oxide-Releasing Diatomaceous Earth Silica Particles. ACS Appl. Mater. Interfaces 2018, 10, 2291–2301. [Google Scholar] [CrossRef]
  19. Hong, T.D.; Jenkins, N.E.; Ellis, R.H. Saturated salt solutions for humidity control and the survival of dry powder and oil formulations of Beauveria bassiana conidia. J. Invertebr. Pathol. 2005, 89, 136–143. [Google Scholar] [CrossRef]
  20. Lu, T.; Chen, C. Uncertainty evaluation of humidity sensors calibrated by saturated salt solutions. Measurement 2007, 40, 591–599. [Google Scholar] [CrossRef]
  21. Simonova, I.A.; Pavlov, A.R.; Kislyakov, I.M. Water sorption on composite “silica modified by calcium nitrate”. Microporous Mesoporous Mater. 2009, 122, 223–228. [Google Scholar] [CrossRef]
  22. Cortés, F.; Trujillo, A.; Gil, A. Water adsorption on zeolite 13X: Comparison of the two methods based on mass spectrometry and thermogravimetry. Adsorption 2010, 16, 141–146. [Google Scholar] [CrossRef]
  23. Wang, L.; Wang, R.Z.; Oliveira, R.G. The performance of two adsorption ice making test units using activated carbon and a carbon composite as adsorbents. Carbon 2006, 44, 2671–2680. [Google Scholar] [CrossRef]
  24. Gong, L.; Wang, R.Z.; Oliveira, R.G. Adsorption equilibrium of water on a composite adsorbent employing lithium chloride in silica gel. J. Chem. Eng. Data 2010, 55, 2920–2923. [Google Scholar] [CrossRef]
  25. Pino, L.; Ghibaudi, E.; Torchio, M.F. Composite materials based on zeolite 4A for adsorption heat pumps. Adsorption 1997, 3, 33–40. [Google Scholar] [CrossRef]
  26. Yang, Y.; Zhao, J.; Deng, X. Preparation of a novel diatomite-based PCM gypsum board for temperature-humidity control of buildings. Build. Environ. 2022, 226, 109732. [Google Scholar] [CrossRef]
  27. Latif, E.; Tucker, S.; Ciupala, M.A.; Wijeyesekera, D.C. Moisture buffer potential of experimental wall assemblies incorporating formulated hemp-lime. Build. Environ. 2015, 93, 199–209. [Google Scholar] [CrossRef]
  28. Rode, C.; Peuhkuri, R.; Hansen, K.K. Moisture Buffering of Building Materials; BYG Report No. R-127; Technical University of Denmark, Department of Civil Engineering: Kongens Lyngby, Denmark, 2005. [Google Scholar]
  29. Bardestani, R.; Patience, G.S.; Kaliaguine, S. Experimental methods in chemical engineering: Specific surface area and pore size distribution measurements—BET, BJH, and DFT. Can. J. Chem. Eng. 2019, 97, 2781–2791. [Google Scholar] [CrossRef]
  30. Sing, K. The use of nitrogen adsorption for the characterisation of porous materials. Colloids Surf. A Physicochem. Eng. Asp. 2001, 187, 3–9. [Google Scholar] [CrossRef]
Figure 1. Custom-built experimental apparatus.
Crystals 15 00158 g001
Figure 4. XRD result of (a) 4 samples, (b) DE-70* (32% LiCl).
Crystals 15 00158 g004
Figure 5. Nitrogen adsorption–desorption isotherms. * Represents a 32% LiCl loading.
Crystals 15 00158 g005
Figure 6. (a) Results of water absorption performance test; (b) variations in water absorption capacity of samples with different particle sizes of raw materials.
Crystals 15 00158 g006
Figure 7. (a) Moisture absorption test for DE-AlOOH, (b) optimize raw material particle size, (c) hygroscopic salt load, (in (c), asterisks represents the concentration of LiCl, * represents 32%, ** represents 64%, and *** represents 96%) (d) moisture absorption and desorption curves.
Crystals 15 00158 g007
Figure 8. Nitrogen adsorption–desorption isotherms. * Represents a 32% LiCl loading. ** Represents a 64% LiCl loading. *** Represents a 96% LiCl loading.
Crystals 15 00158 g008
Table 1. Sample list.
SampleIngredient (DE/Boehmite)Post-ProcessingProcedure
DE-505/5-
DE-606/4-
DE-707/3-I
DE-808/2-
DE-909/1-
DE-Nano4/3/3 (DE/Boehmite/Nano-( SiO 2 ) )Add nano-( SiO 2 )
DE-Salt7/3Pickling, Hygroscopic salt loading (32%)
DE-Nano *4/3/3 (DE/Boehmite/Nano-( SiO 2 ) )Add nano-( SiO 2 ), salt loading (32%)II
DE-70 *7/3Load salt concentration: 32%
DE-70 **7/3Load salt concentration: 64%
DE-70 ***7/3Load salt concentration: 96%
* Represents a 32% LiCl loading. ** Represents a 64% LiCl loading. *** Represents a 96% LiCl loading.
Table 2. Moisture buffer value standard [27].
StandardValue
Negligible0.0–0.2
Limited0.2–0.5
Moderate0.5–1.0
Good1.0–2.0
Excellent2.0–upwards
Table 3. Nitrogen adsorption–desorption test results.
Sample S BET ( m 2 / g ) V ta ( cm 3 / g ) Dpc (nm)
DE-7017.6 ± 0.20.154 ± 0.0118.8 ± 0.1
DE-70 *12.4 ± 0.20.11 ± 0.0117.8 ± 0.1
DE-Nano19.8 ± 0.20.127 ± 0.0112.4 ± 0.1
DE-Nano *14.7 ± 0.20.072 ± 0.0111.6 ± 0.1
* Represents the loading of hygroscopic salt LiCl (32%).
Table 4. Salt loading—moisture absorption results.
SampleConcentration (LiCl)Over-Absorbing Time (h)Water Absorption (%)
DE-70 *96%12 ± 0.131.5 ± 0.3
DE-70 **64%19 ± 0.230.3 ± 0.2
DE-70 ***32%-28.1 ± 0.2
DE-Nano32%9 ± 0.232.6 ± 0.1
* Represents a 32% LiCl loading. ** Represents a 64% LiCl loading. *** Represents a 96% LiCl loading. - No excessive moisture absorption occurred during the 36 h test.
Table 5. Result of MBV test.
Sample Δ m (g) MBV practical (g/cm)Standard
DE-700.495 ± 0.10.41 ± 0.03Limited
DE-Nano1.263 ± 0.11.04 ± 0.06Good
DE-70 *2.43 ± 0.12.00 ± 0.07Good
DE-Nano *2.88 ± 0.12.37 ± 0.03Excellent
* Represents the loading of hygroscopic salt LiCl (32%). Δ m The quality difference of the sample before and after testing.
Disclaimer/Publisher’s Note: The statements, opinions and data contained in all publications are solely those of the individual author(s) and contributor(s) and not of MDPI and/or the editor(s). MDPI and/or the editor(s) disclaim responsibility for any injury to people or property resulting from any ideas, methods, instructions or products referred to in the content.

