Article

Mathematical Modeling to Predict the Formation of Micrometer-Scale Crystals Using Reverse Anti-Solvent Crystallization

1
Institute of Environmental and Safety Engineering, North University of China, Taiyuan 030051, China
2
China Safety Technology Research Academy of Ordnance Industry, Beijing 100053, China
*
Author to whom correspondence should be addressed.
Crystals 2025, 15(2), 145; https://doi.org/10.3390/cryst15020145
Submission received: 27 December 2024 / Revised: 24 January 2025 / Accepted: 27 January 2025 / Published: 29 January 2025
(This article belongs to the Special Issue Crystallization Process and Simulation Calculation, Third Edition)

Abstract

:
The reverse addition process in anti-solvent crystallization is safer and more efficient than sieving when dealing with energetic compounds. A new mathematical model has been developed to understand the crystal size mechanism during the reverse addition of solvent in a binary system. This model incorporates droplet dynamics, distribution moments, and mass balance constraints. It can be used to predict the appropriate crystal size for designing explosive recipes with a desired particle size distribution to maximize energy output. The model was validated by conducting reverse-addition crystallization of sodium chloride in a deionized water/ethanol binary system at temperatures ranging from 10 to 50 degrees Celsius. The predicted results closely matched the experimental findings, which were confirmed using a Laser Particle Size Analyzer and Electron Microscope Scanning.

Graphical Abstract

1. Introduction

The size distribution of crystals (CSD) not only significantly influences the bioavailability of a drug (e.g., dissolution rate, delivery efficiency, shelf-life) and the effectiveness of downstream processes (e.g., filtration, drying, tablet production) [1,2,3,4], but also has a significant impact on the density of explosive formulations, which affects the energy output in a warhead. However, it is difficult to predict CSD using a process model because of its stochastic and complex kinetic nature with many factors such as initial concentration, supersaturation, temperature, flow pattern, etc. [1,5,6]. Researchers have been exploring innovative technologies to control the nucleation crystallization rate in order to predict and achieve a satisfactory particle size distribution for both inorganic and organic compounds. These technologies include ultrasonic technology [7], plug flow crystallizers [8], membrane crystallization [9], quasi-emulsion solvent diffusion (QESD) [10,11,12,13], supercritical technology, jet crystallization [14], seeding [15,16], mixed suspension mixed product removal (MSMPR) crystallizers [17], and computational fluid dynamics coupled with population balance equation (CFD-PBE) [14], among others. However, the hazardous nature of energetic compounds, including their heat and mechanical sensitivity, can make it challenging to control their crystalline morphology and crystal size distribution (CSD) during continuous crystallization [18,19,20,21,22]. Additionally, it is difficult to quickly obtain large quantities of powders within a specific size range (0–100 μm) through sieving, as this process is time-consuming and laborious. To address the requirements of continuous crystallization, it is imperative to develop a crystallization technique and theory for energetic compounds that yield a narrow crystal size distribution and small crystal size.
The anti-solvent crystallization involves two mixing methods: positive addition and reverse addition. In positive addition, the anti-solvent is added drop by drop to the solvent, while, in reverse addition, the solvent is added to the non-solvent. The reverse addition method, similar to the QESD method, produces small crystals with a narrow size distribution [23,24,25,26]. Unlike the QESD method, which requires the maintenance of emulsion droplets using surfactants or a third solvent, reverse-addition crystallization occurs inside a droplet. The crystal size growth could be limited by the size of the droplet, and it is influenced by the diffusion behavior between the solvent and antisolvent until the supersaturation is depleted [27,28].
The mathematical model of the reverse-addition method is inspired by two crystallization research studies and involves preparing three different kinds of size distributions (2–10, 18–25, 45–60 um) of the LLM-105 crystal, which is an insensitive energetic compound. One study by R. Peña examines the kinetic relationship between primary crystals and agglomeration in droplets using the population balance model for application in the simulation and optimization of a spherical crystallization system [29]. However, this study does not explore the influence of temperature on crystal size in the reverse-addition binary system. The other study explores droplet diffusion behavior between solvent and anti-solvent to calculate supersaturation (crystallization force). The mathematical model described in this paper focuses on reverse addition. It provides a droplet diffusion model coupled with the moments of the distribution and a mass balance constraint.

2. The Establishment of Mathematical Models

2.1. Prelude to the Mathematical Model

In our previous work, we were able to easily prepare three different size distributions (2–10 um, 18–25 um, 45–60 um) of LLM-105 crystals (Figure 1). We achieved this through reverse addition in the sulfuric acid/water binary system, with changing crystallization temperature. Our research indicates that the size of the LLM-105 crystals increases as the temperature of the binary system increases through reverse addition. We particularly found that, when ice water is chosen as the anti-solvent, the crystal granule size becomes extremely small. Also, when the (sulfuric acid/distilled water) binary system is changed to the (DMSO/water) system, the crystal form changes to a thin rod-shaped one. Furthermore, as the temperature of the system increases, the size of the rod-shaped crystal also increases (Figure 2).
The crystal structure of LLM-105 changes from a polyhedron to a regular hexagonal shape when the temperature increases (as shown in Figure 1d). This suggests that the crystals likely grew in the solvent droplets, as the crystallization environment can influence crystal growth behavior. It is believed that the solvent disappears when it comes into contact with the anti-solvent due to droplet diffusion. This concept is similar to the QESD method, where particles can coalesce and grow larger as the binary system diffuses, while the ‘droplet’ can be sustained for some time. As a result, a model incorporating the droplet concept, coupled with moments of the distribution and mass balance constraint, is established and presented in the following section.

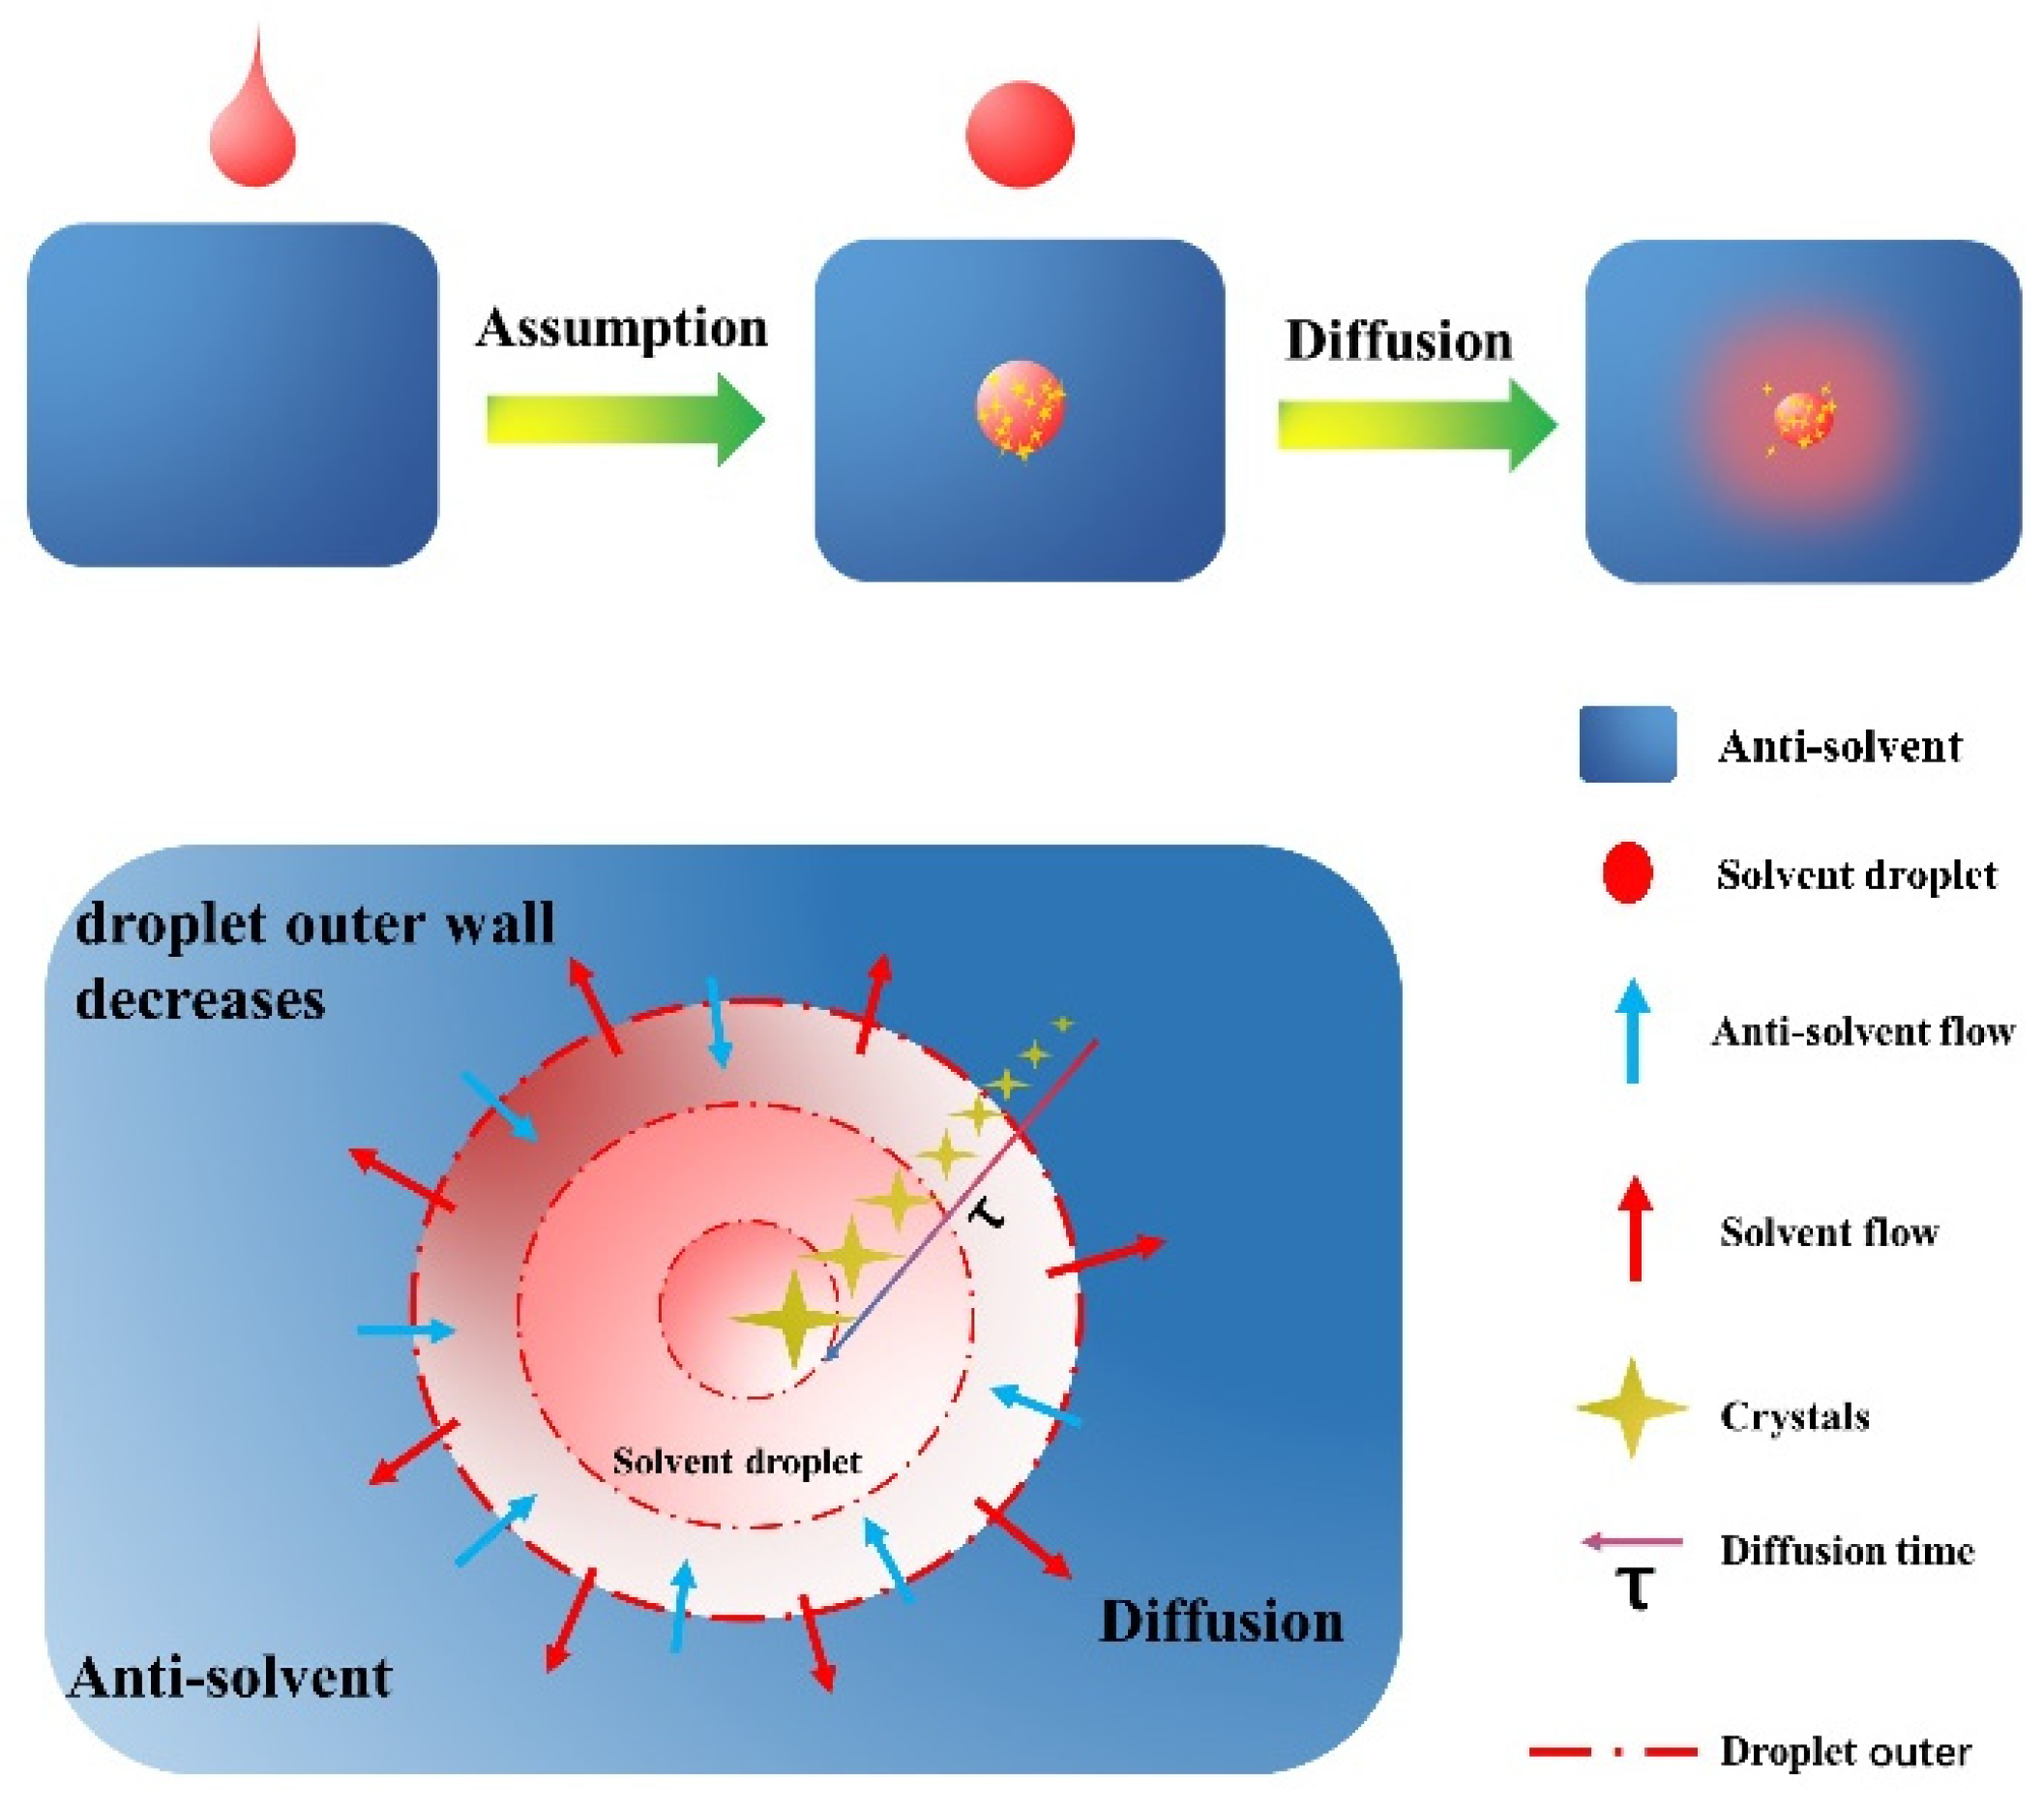
2.2. Mechanism Analysis and Mathematical Model Establishment

The crystal forms and grows quickly due to a rapid increase in concentration in the droplets when they are mixed with a different solution. It takes only a short time for the crystals to spread throughout the solution. The time it takes for the crystals to form is the same as the time it takes for the two solutions to mix. The QESD method suggests a model where each saturated solution drop acts as a tiny crystal maker, controlling the size of the crystals. This leads to the proposal of a reverse-addition crystallization model to better understand this type of crystal formation and to explain why reverse addition can produce small and uniform crystals and why crystal size increases with temperature.
Before establishing the model, let us first put forward some assumptions:
(1)
Each dripping droplet is spherical. When the spherical droplet completely enters the anti-solvent, the solvent could diffuse. At this time, crystallization begins to occur.
(2)
The solvent diffusion time in each droplet is the same as the time used for crystal growth, and the crystal nucleus growth time is ignored.
(3)
No secondary nucleation occurred in each drop of solution.
(4)
The supersaturation as the driving force for crystal growth keeps a constant value when crystal will occur in each solvent droplet.
(5)
The crystal growth rate is only related to the temperature and supersaturation.
To better understand the model, see Figure 3 below.
The crystal population density, n (number of crystals per unit size per unit volume of the system) is defined by the following:
lim Δ L 0 Δ N Δ L = d N d L = n
where Δ N is the number of crystals in the size range Δ L per unit volume.
A population balance in a system of a droplet volume V for a time interval Δ t and size range Δ L = L 2 L 1 is as follows:
n 1 G V 1 Δ t = n 2 G V 2 Δ t + R n ¯ Δ L Δ t
where R is the droplet diffusion volume per unit time, G the crystal growth rate, and n ¯ the average population density. At a constant temperature, G is a constant. As Δ L 0
d ( n V ) d L = R n G
Defining the V is independent of crystal size, i.e., d V / d L = 0 , and τ is the whole of time of droplet diffusion τ = V / R . Then, the following is true:
d n d L = n G τ
Which, on integration, gives the following:
n = n 0 exp ( L / G τ )
The quantity n 0 is the population density of nuclei (zero-sized crystals). So, we obtain the relationship of the n (crystal population density) and L (crystal size). Then we will use the method of moment to find the relationship between mass and size.
First, the zeroth moment of the distribution can be expressed as follows:
N = 0 L n d L = n 0 G τ [ 1 exp ( L / G τ ) ]
N represents the number of the crystals, and L ( L ) , N = N T , N T = n 0 G τ .
N T represents all of the number of the crystals.
Thus, the first moment can give the cumulative length. The second moment gives the surface area. The third moment gives the mass. These can be expressed as follows:
β = 0 L n L d L
A = χ 0 L n L 2 d L
M = α ρ C 0 L n L 3 d L
where β is the cumulative length, A the surface area, and M the mass. χ is a surface shape factor. Analogously, α represents a volume shape factor, and ρ C is the crystal density.
Next, integrating (9) can give the following equation:
M = 6 n 0 α ρ C ( G τ ) 4 ( 1 exp ( G τ ) L G τ exp ( L G τ ) 1 2 L 2 ( G τ ) 2 exp ( L G τ ) 1 6 L 3 ( G τ ) 3 exp ( L G τ ) )
For L , M = M T can give the following
M T = 6 α ρ C n 0 ( G τ ) 4
M T represents the total mass of all the number of the crystals. We acknowledge that the whole of the system of the droplet satisfies the conversation of mass; so, for a given Δ L = L 2 L 1 , we can obtain Δ M = M 2 M 1 . When Δ L 0 , differentiating (9) can give us the following:
d M = α ρ C n L 3 d L
Formula (12) represents the mass of crystals d M in a given size range d L . So, the mass fraction in Δ L = L 2 L 1 is d M M T . Therefore, the relationship between mass and size is given by the following:
M ( L ) d L = n L 3 6 n 0 ( G τ ) 4
Importing the Formula (5), Equation (13) becomes the following:
M ( L ) d L = exp ( L / G τ ) L 3 6 ( G τ ) 4
When taking the extremum of (14), i.e., ( M ( L ) / d L ) = 0 , it represents the most part of crystalline mass that occupies the total crystal mass of the entire droplet, the corresponding crystal diameter of which is L D . So, it can give the following:
L D = 3 G τ
We already know the τ is the whole of the time of droplet diffusion. Then, we build the diffusion equation to find the time τ . We have assumed that the droplet is spherical. In the case of droplet diffusion, the rate of diffusion of the poor solvent is related to the concentration gradient, d c / d x . On a spherical surface, the distance r from the center represents x . So, it can give the following
d n d t = 4 π r 2 D d c d r
Symbol D is the diffusion coefficient. We assume that, at any instant, d n / d t will be a constant. Thus, Formula (16) may be integrated to give the following:
4 π D C 1 C 2 d c = d n d t r 1 r 2 d r r 2
d n d t = 4 π D ( c 2 c 1 ) 1 r 1 1 r 2
If c 1 = c (droplet concentration) at r 1 = r (the radius of the droplet) and c 2 = c = 0 (diffusion into a pure solvent) at r 2 = . To keep the dimensions the same, then we use the following:
d n d t = 4 π r D c = d r d t ( 4 π r 2 ν )
d r d t = D ν c r
r 2 = r 0 2 2 D ν c t
where ν is the molar volume of liquid and r 0 is the droplet radium at time t = 0 . The time ( r = 0 ) for the droplet perfect diffusion is given by the following:
t = r 0 2 2 D ν c
In this way, we can obtain the whole time of droplet diffusion.
G = k g Δ c a exp ( E / R T )
where G is crystal growth rate, Δ c supersaturation, E activation energy for crystal growth, R universal gas constant, T temperature, and k g and α are the growth rate coefficients.
Combining Equations (15), (22) and (23) will give the relationship the temperature T and the dominant size of the crystals L D .
L D = 3 k g Δ c a exp ( E / R T ) r 0 2 2 D ν c
So far, the model has been established. Except for temperature, which is a variable, all the other parameters are constants.

2.3. Experiment

2.3.1. Materials

(1)
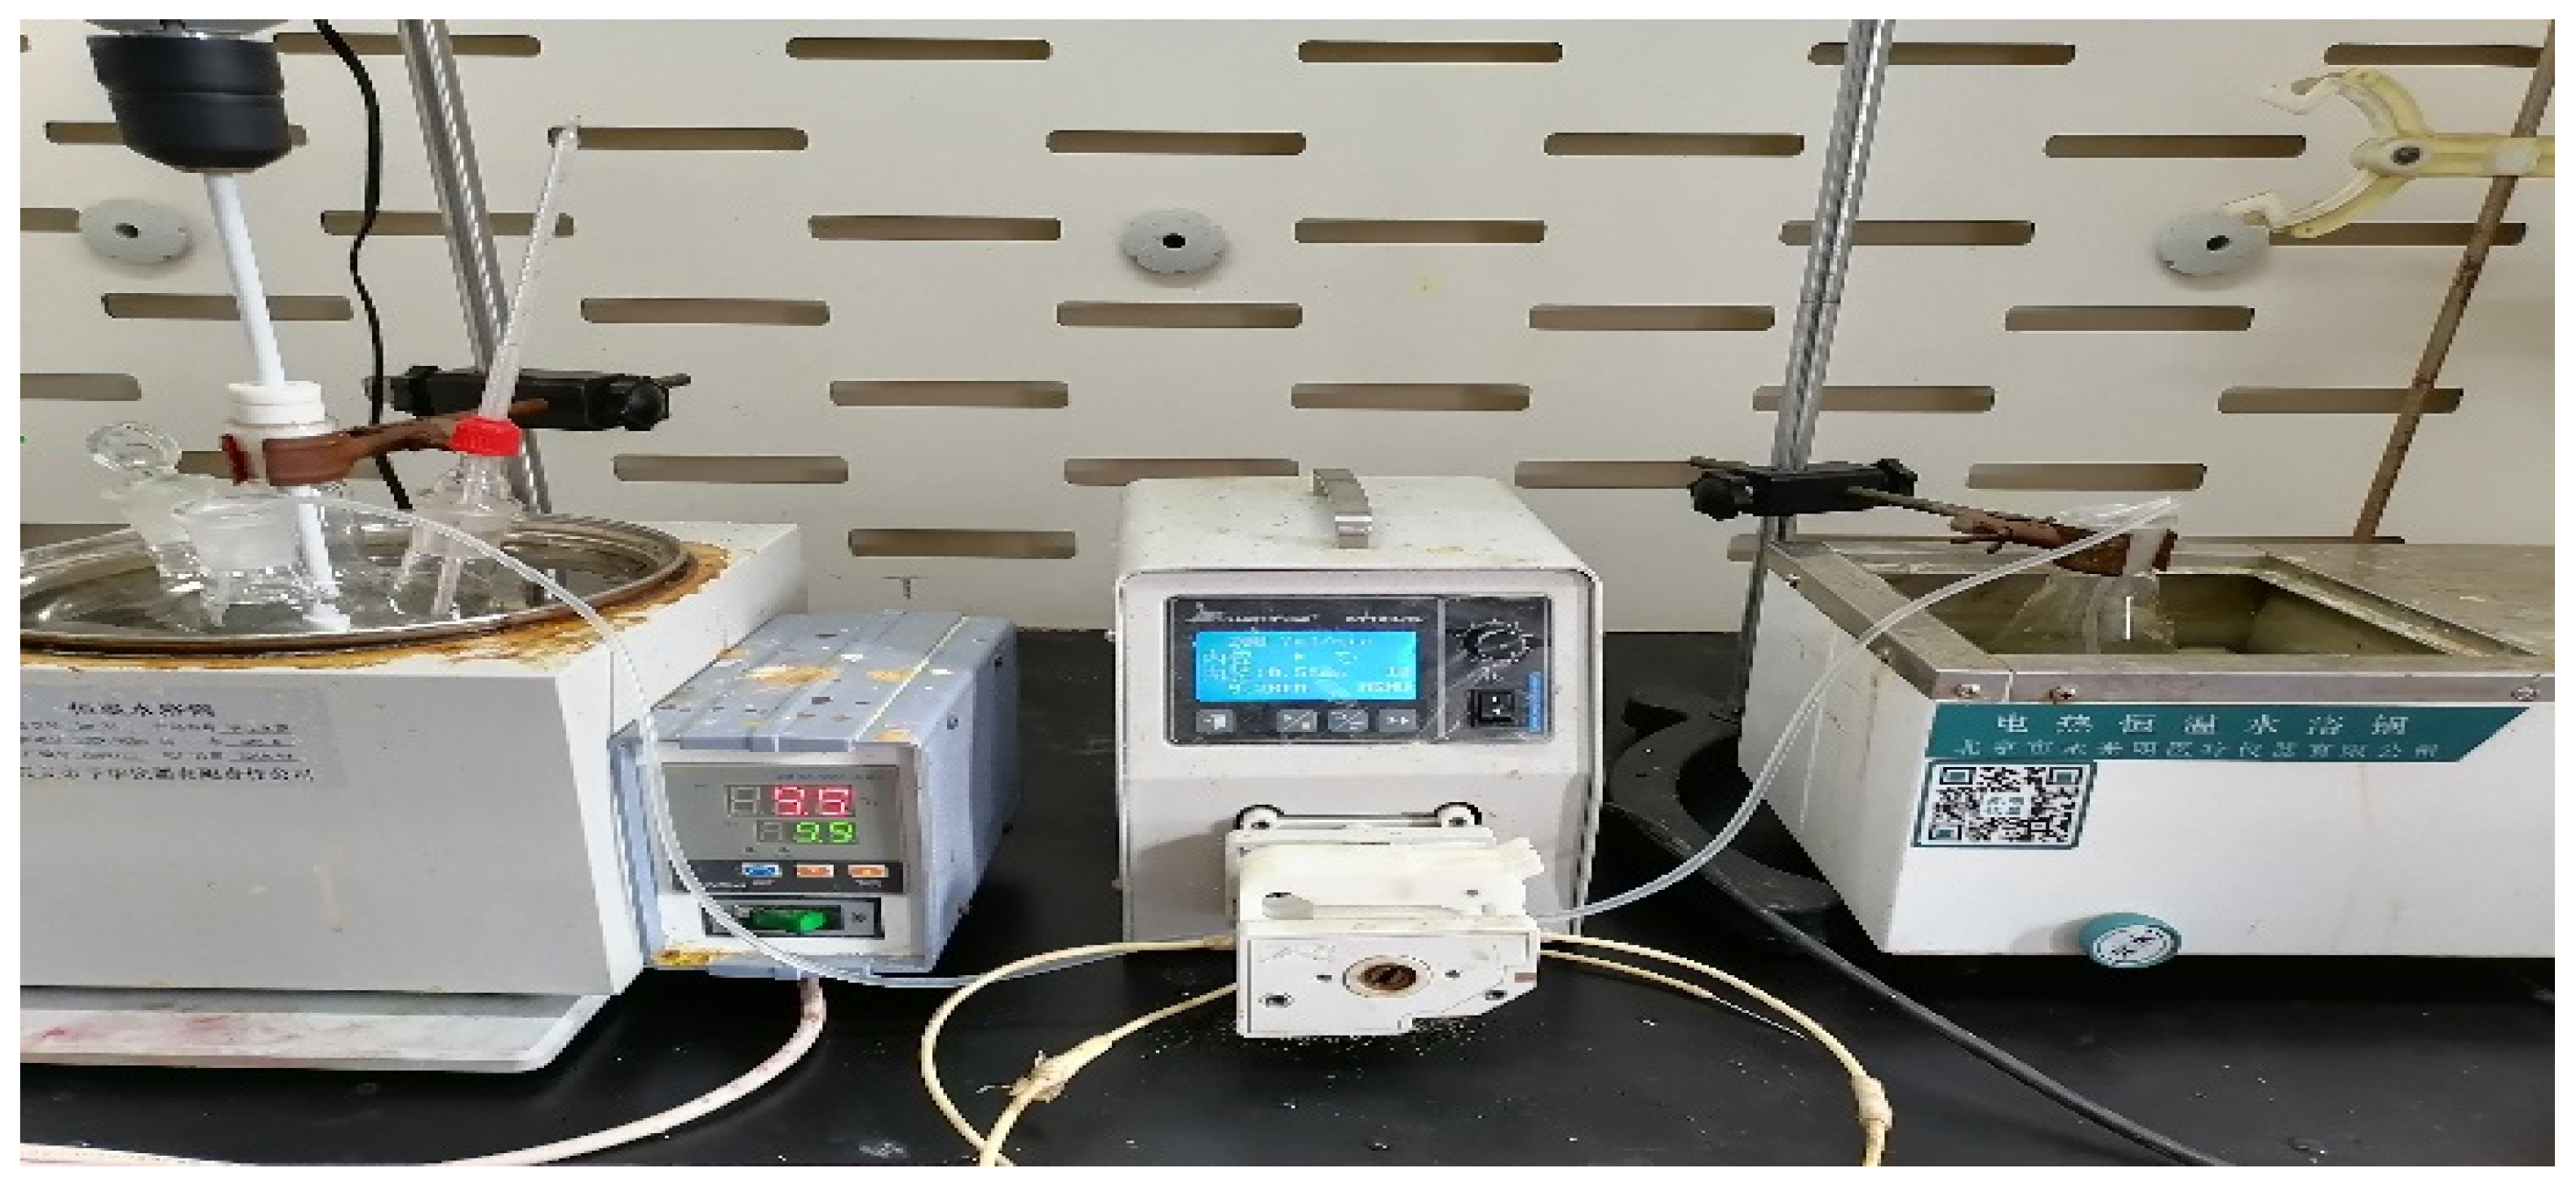
The main materials include a φ3 mm silicone tube, a peristaltic pump, a beaker, a Buchner funnel and vacuum filtration device, a small reactor, a set of stirring devices, and two sets of heating devices (ovens);
(2)
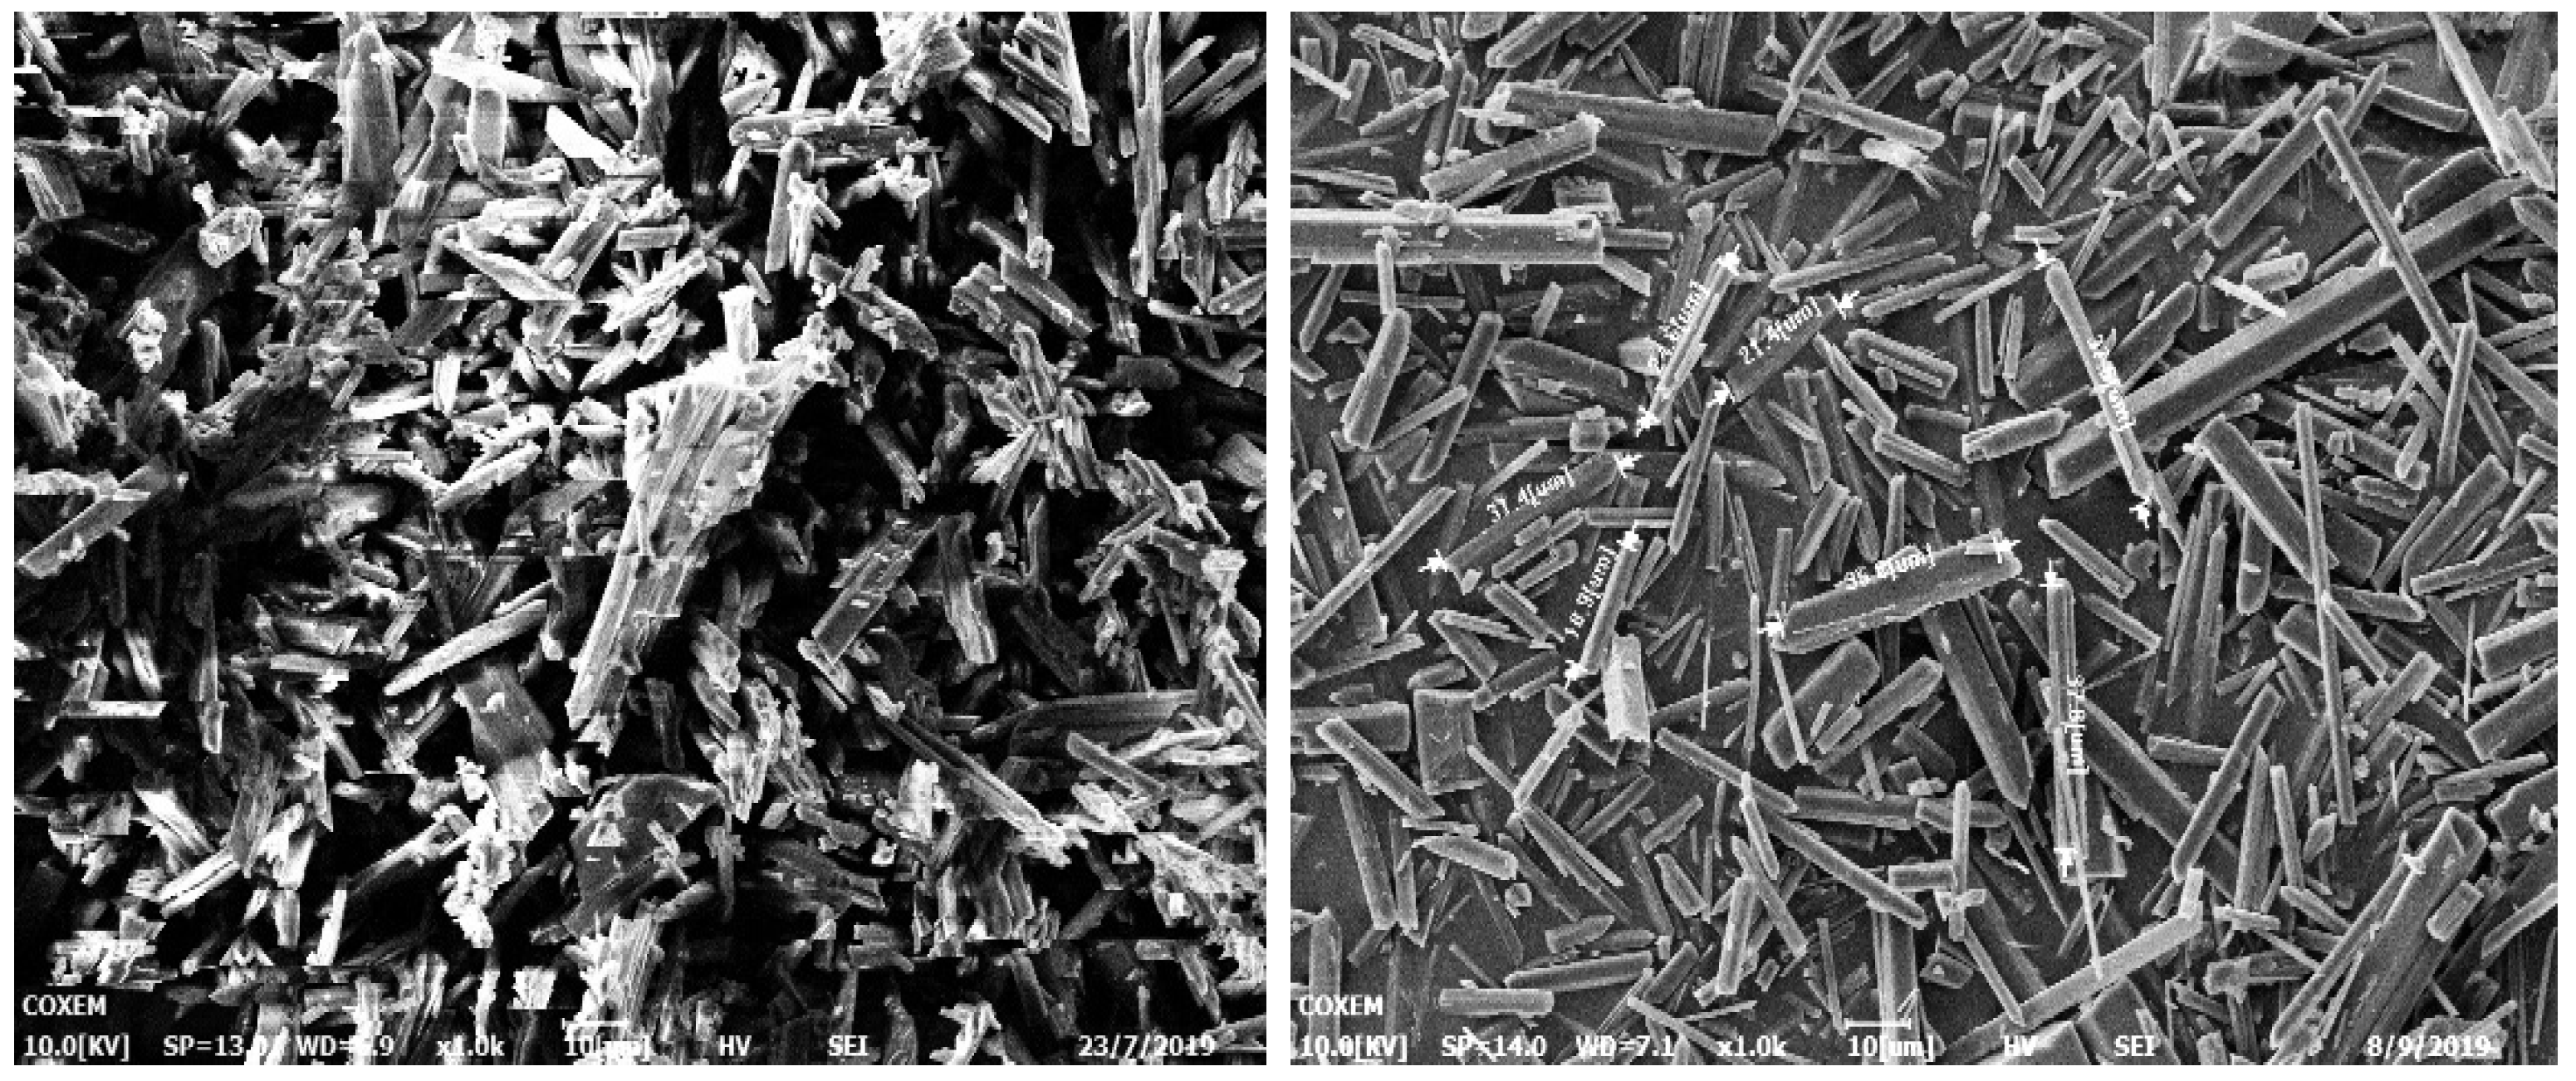
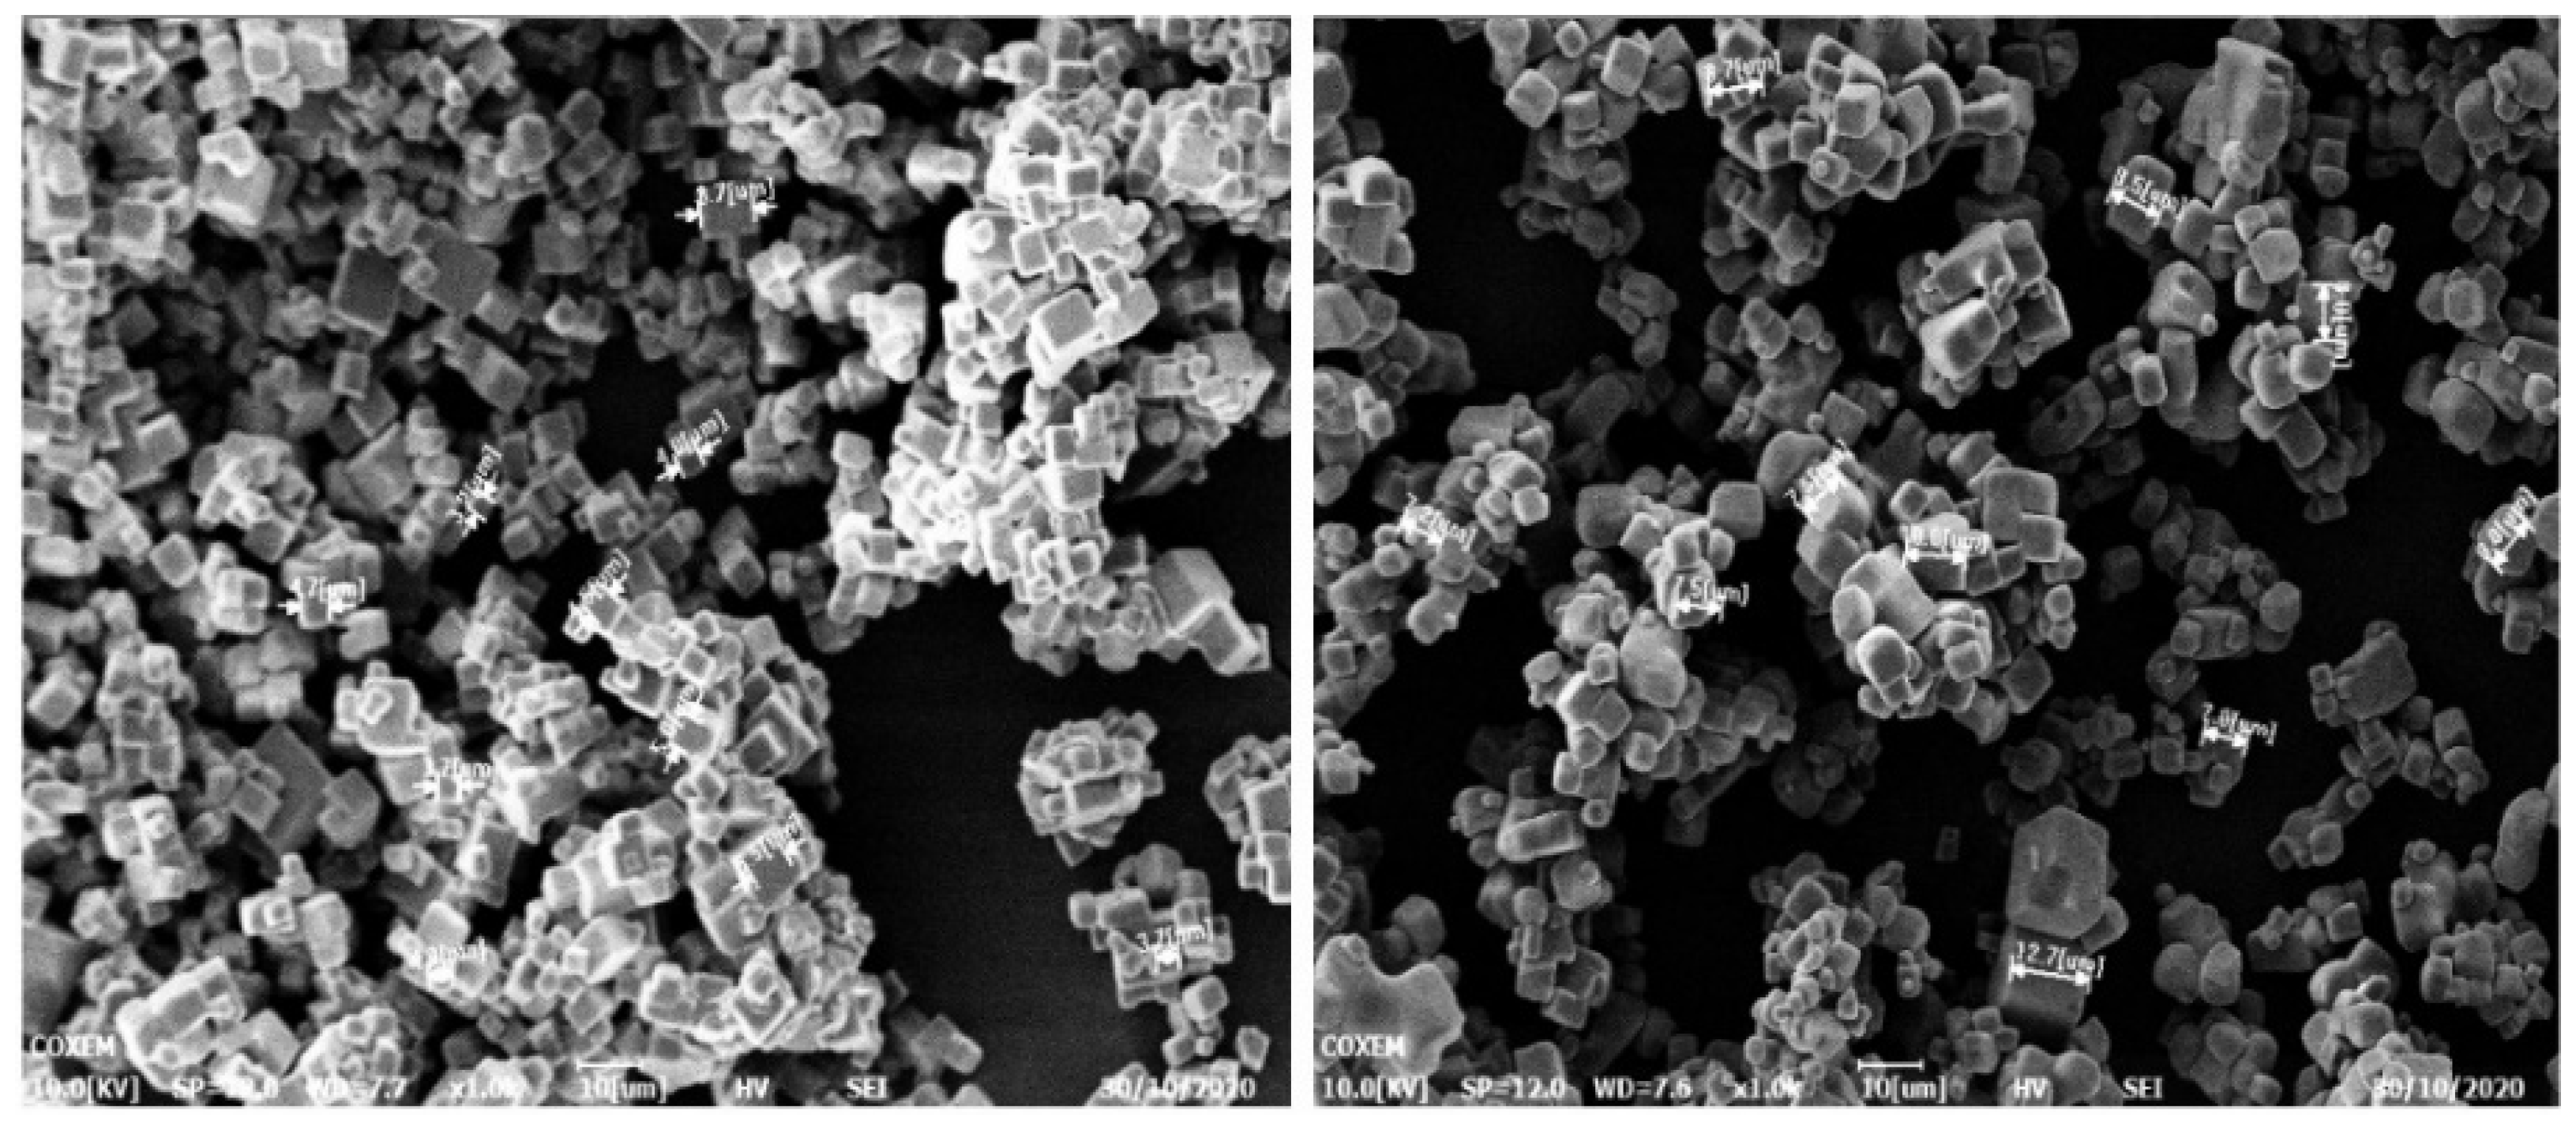
The test instruments include a scanning electron microscope (Nano SEM 450, Nova) and a laser particle size analyzer (MS2000, Malvern);
(3)
The experiment reagents include deionized water, anhydrous ethanol (analytically pure 99.9%), and NaCl (analytically pure).

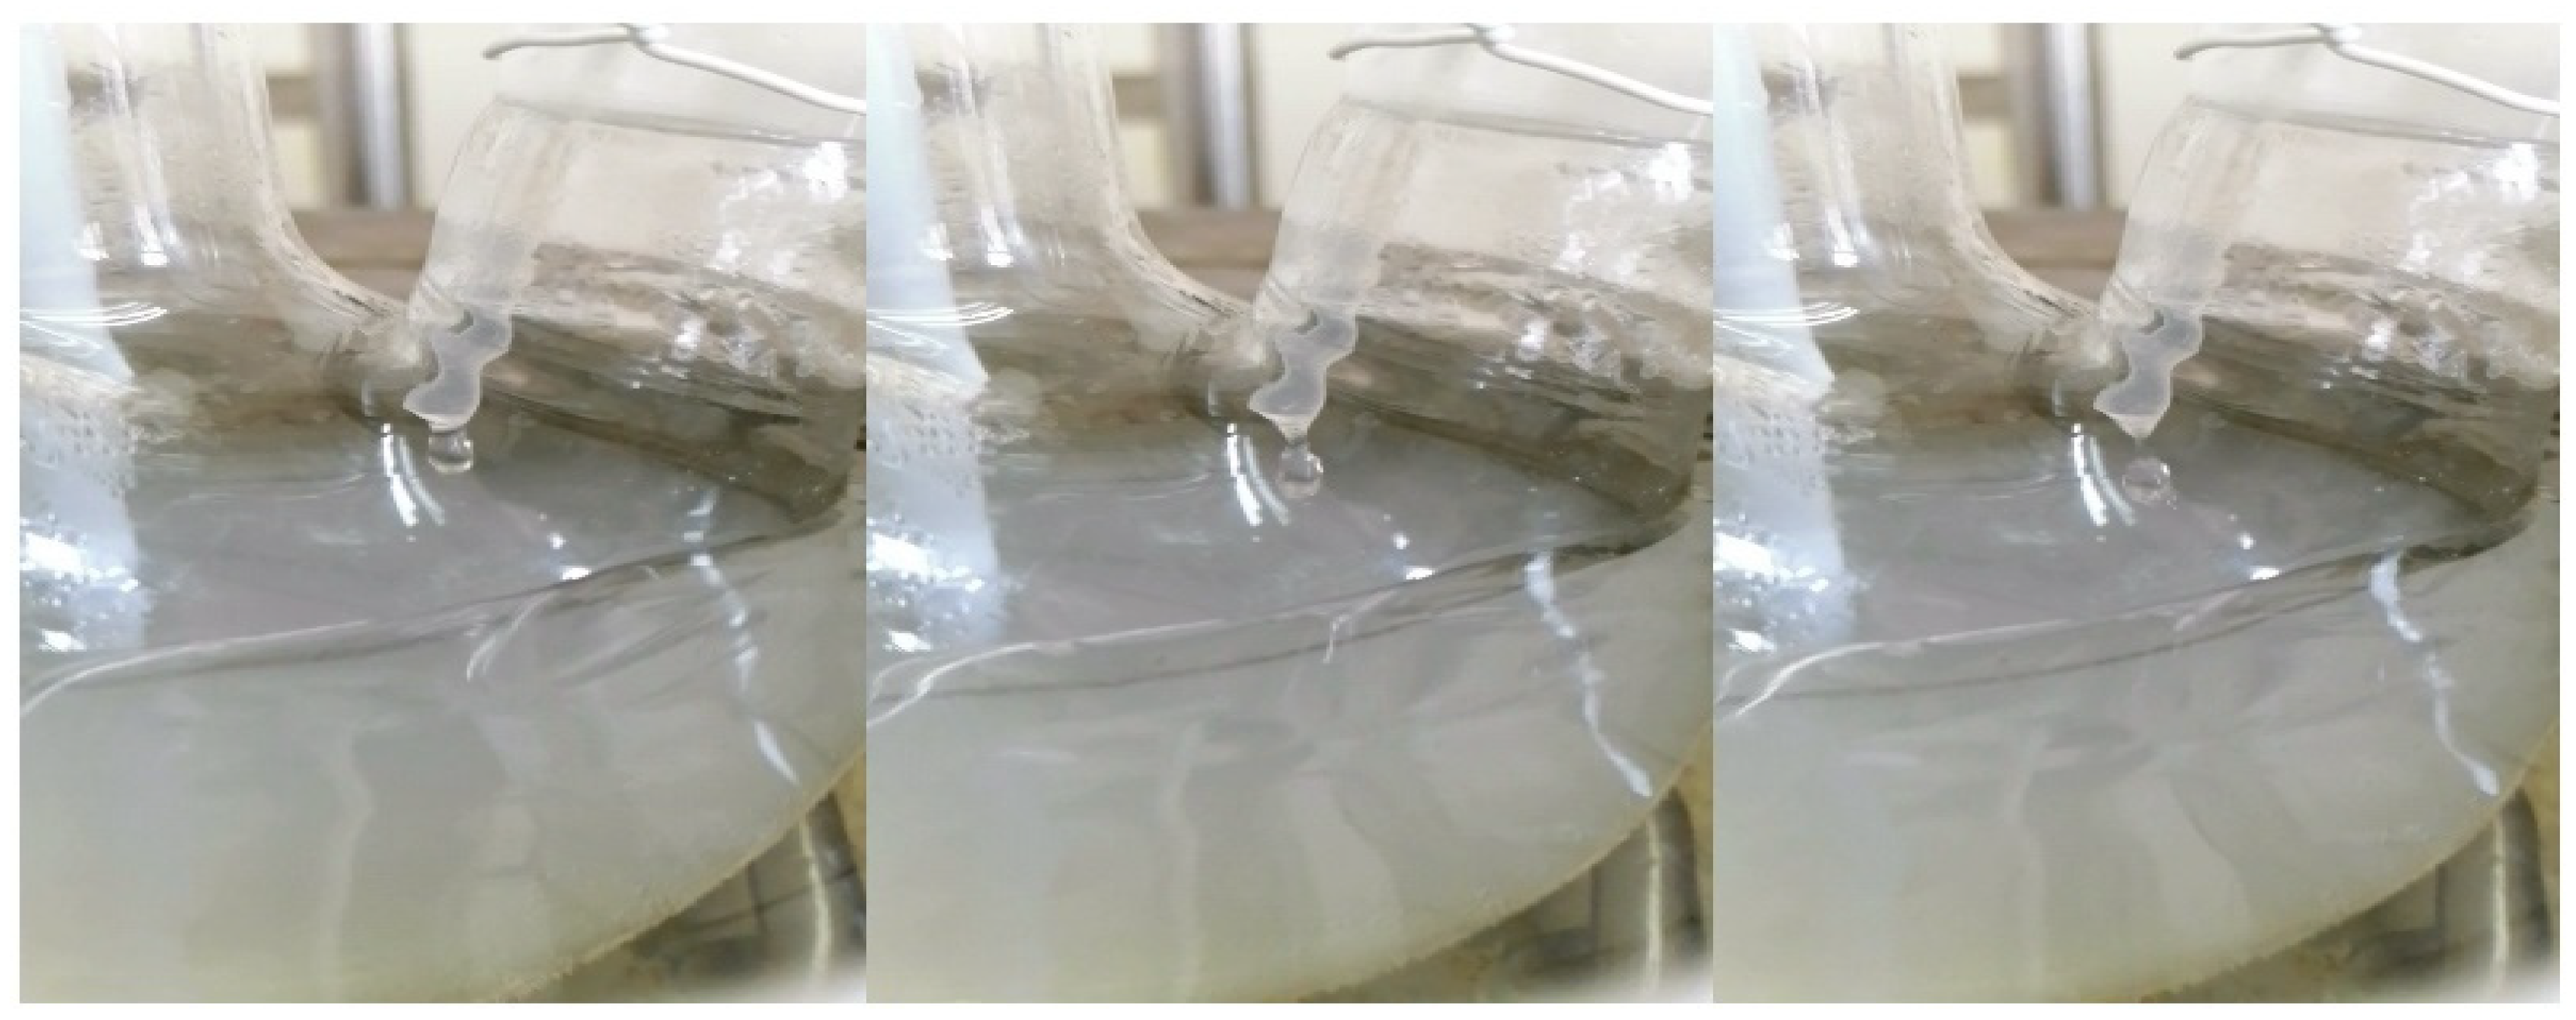
2.3.2. Experiment Methods

A saturated salt solution with a concentration of 36 g/100 g was prepared at a temperature of 20 °C. We then conducted the experiment under different temperature conditions (10 °C, 20 °C, 30 °C, 40 °C, 50 °C) taking into account the fact that the boiling point of anhydrous ethanol is 78 °C. The solvent was added drop by drop into the anhydrous ethanol, dividing the solution into five groups. We used a peristaltic pump to achieve the reverse addition, dripping the solvent at a rate of 100 μL/min through a φ3 mm silicone tube as shown in Figure 4 and Figure 5. We maintained consistent temperatures for the solvent and anti-solvent during the crystallization process. Once the dripping was complete, the product was filtered using a Buchner funnel and then dried in an oven for several hours. A small portion was taken for SEM measurement and particle size distribution analysis. The results obtained are shown in Table 1.

3. Result

The particle size distribution of the sodium chloride prepared by reverse addition and tested in the laser particle size analyzer under different temperature conditions is shown in Figure 6 and Table 2. It is obvious that the particle size increases with the increase in temperature during the crystallization process through the detection of particle size analysis and the observation of SEM.
The electron microscope images at 20 °C and 50 °C, respectively, were compared in Figure 7 to show more clearly that the crystal of sodium chloride prepared by reverse addition had a uniform particle size and a good appearance.
Crystals are generally around 3~5 um at 10 °C, and sodium chloride crystals are generally 7~10 um at 50 °C. Combining Equation (24) with the parameters in Table 3 verifies the accuracy of the mathematical model. The D32 of the measured particle size distribution by the laser particle size analyzer is very close to the calculated values L D by the model under different temperature conditions, as shown in Figure 8.

4. Discussion

Researchers have focused on studying the changes in the properties of crystal products and their effects on subsequent operations, but they have rarely investigated the main factors affecting particle size using the anti-solvent method. This mathematical model combines the particle size balance equation and the droplet diffusion equation to establish the relationship between the dominant crystal size and temperature. While the model cannot replicate real-world situations, it can still provide a suitable explanation for crystallization behavior through analysis. This approach is particularly feasible for controlling the size of small crystals of energetic compounds and heat-sensitive substances. In this model, various assumptions about crystalline conditions are made, and supersaturation is treated as a constant due to the limitations of existing technology in measuring the rapid changes in supersaturation resulting from the swift diffusion between solvents and anti-solvents. Additionally, it is unrealistic to assume that droplet diffusion begins only after the droplet has completely entered the solvent. Crystallization actually begins when the solvent droplet comes into contact with the anti-solvent through droplet-occurring diffusion. However, it is evident that crystallization is caused by the diffusion behavior between the solvent and the anti-solvent, rather than occurring after the solution has been fully mixed.
The crystallization mechanisms differ significantly between the positive addition and reverse addition directions, even though they are opposite. When using reverse addition, the crystallization process is similar to that of micro-crystallization. This means that the growing crystals flow out of the droplet at the same time as the solvent and anti-solvent rapidly diffuse, causing the crystals to grow rapidly until the droplet diffusion ends. This leads to a narrow particle size range due to the very short diffusion time. On the other hand, predicting the crystal size distribution within the solution using a simple mathematical model is not possible during positive addition due to the complex crystallization behavior in the solvent. Moreover, the mathematical model assumes that no secondary nucleation occurs.
The assumption contributes to a narrow grain size range for two reasons. First, the short droplet diffusion time makes it challenging for secondary nucleation to occur within such a brief period. Second, secondary nucleation often occurs in crystallization systems containing larger particles. According to the model, the crystal’s particle size is related to the diffusion rate between the solvent and the anti-solvent. A slower solvent diffusion results in larger crystal sizes, while faster diffusion leads to smaller crystal sizes. This provides a theoretical basis for adjusting the diffusion rate between the solvent and the anti-solvent by adding a third substance (solvent or reagent) to produce crystals of different sizes from emulsion droplets.
It is not reasonable to consider the diffusion coefficient as a constant because it varies with temperature. As the temperature increases, the droplet diffusion coefficient also increases. Although it simplifies the calculation and amplifies the temperature’s effect on particle size, setting the coefficient as a constant in the model is not accurate. Equation 24 shows that a larger diffusion coefficient inhibits crystallization size. One specific scenario to consider is when a substantial amount of heat is generated upon contact between the solvent and the anti-solvent, such as with concentrated acid and water. The impact of this scenario is crucial for accurately preparing particles of different sizes.
The physical meaning of the value of LD in the model represents the diameter of the main crystal in the group of crystal particles formed in the droplet, and it also implies the spherical nature of the crystal formed in the droplet. The calculation method for D32 is provided in Equation (25) as follows:
D 32 = 100 / ( ( f 1 / ( D 1 + f 2 / ( D 2 + f 3 / ( D 3 + f 4 / ( D 4 + ) . . . . . . ) ) ) ) )
where D i indicates the average particle size of the i th particle size interval and f i indicates the percentage of the i th particle size interval.
Therefore, it is not difficult to understand the relationship between the physical meaning represented by D32 and the L D . It could also explain why the values of LD are numerically close to those of D32 as shown in the experimental results. However, the value of LD cannot be considered as the average value of crystals produced by droplet crystallization. Therefore, comparing numerical sizes is meaningless. It is important to be able to predict the average crystal size produced in droplets based on the LD calculation. Although the average crystal size produced by reverse addition cannot be accurately calculated, the correctness of the crystallization model hypothesis could be demonstrated by experimental data that closely matches the value predicted by the calculation, as well as by the crystallization phenomenon encountered in previous work.

5. Conclusions

This paper proposes a mathematical model for predicting the size of crystals formed during droplet crystallization. The model is based on an experimental phenomenon involving the preparation of different small-size energetic compounds under varying temperature conditions using the anti-solvent method of reverse addition. NaCl is used to crystallize in the ionized water/anhydrous ethanol system to validate the model and examine how temperature affects particle size. The model’s validity is confirmed by comparing the average size D32 measured by a laser particle analyzer to the size LD calculated by the mathematical model. The model illustrates that droplet diffusion behavior influences crystal size based on three factors: droplet size, crystallization temperature, and the diffusion coefficient of the solvent and anti-solvent. This model can serve as a theoretical guide for utilizing emulsion droplet crystallization methods and crystallization technology to control small-size energetic compounds with a narrow particle size distribution and good appearance.

Author Contributions

Conceptualization, J.W. (Jianhua Wang), F.W. and J.W. (Jiapeng Wang); methodology, J.W. (Jiapeng Wang); software, J.W. (Jiapeng Wang) and F.W.; validation, J.W. (Jiapeng Wang) and F.W.; formal analysis, J.W. (Jiapeng Wang); resources, J.W. (Jianhua Wang); data curation, F.W., J.W. (Jiapeng Wang) and X.W.; writing—original draft preparation, J.W. (Jiapeng Wang) and F.W.; writing—review and editing, Y.Z. and Y.L.; funding acquisition, J.W. (Jianhua Wang). All authors have read and agreed to the published version of the manuscript.

Funding

This research received no external funding.

Data Availability Statement

The original contributions presented in this study are included in the article. Further inquiries can be directed to the corresponding author.

Conflicts of Interest

The authors declare no conflicts of interest.

References

  1. Sun, L.; Song, Y.; Li, B.; Guan, G.; Jiang, Y. A modified method for modelling, optimization and control of an anti-solvent crystallization process. Chem. Eng. Sci. 2020, 211, 115253. [Google Scholar] [CrossRef]
  2. Power, G.; Hou, G.; Kamaraju, V.K.; Morris, G.; Zhao, Y.; Glennon, B. Design and optimization of a multistage continuous cooling mixed suspension, mixed product removal crystallizer. Chem. Eng. Sci. 2015, 133, 125–139. [Google Scholar] [CrossRef]
  3. Nayhouse, M.; Tran, A.; Kwon, J.S.-I.; Crose, M.; Orkoulas, G.; Christofides, P.D. Modeling and control of ibuprofen crystal growth and size distribution. Chem. Eng. Sci. 2015, 134, 414–422. [Google Scholar] [CrossRef]
  4. Ghadipasha, N.; Romagnoli, J.A.; Tronci, S.; Baratti, R. A model-based approach for controlling particle size distribution in combined cooling-antisolvent crystallization processes. Chem. Eng. Sci. 2018, 190, 260–272. [Google Scholar] [CrossRef]
  5. Liu, Y.C.; Acevedo, D.; Yang, X.; Naimi, S.; Wu, W.-L.; Pavurala, N.; Nagy, Z.K.; O’Connor, T.F. Population Balance Model Development Verification and Validation of Cooling Crystallization of Carbamazepine. Cryst. Growth Des. 2020, 20, 5235–5250. [Google Scholar] [CrossRef]
  6. Galán, O.; Grosso, M.; Baratti, R.; Romagnoli, J.A. Stochastic approach for the calculation of anti-solvent addition policies in crystallization operations: An application to a bench-scale semi-batch crystallizer. Chem. Eng. Sci. 2010, 65, 1797–1810. [Google Scholar] [CrossRef]
  7. Prasad, R.; Dalvi, S.V. Sonocrystallization: Monitoring and controlling crystallization using ultrasound. Chem. Eng. Sci. 2020, 226, 115911. [Google Scholar] [CrossRef]
  8. Cogoni, G.; de Souza, B.P.; Frawley, P.J. Particle Size Distribution and yield control in continuous Plug Flow Crystallizers with recycle. Chem. Eng. Sci. 2015, 138, 592–599. [Google Scholar] [CrossRef]
  9. Jiang, X.; Shao, Y.; Sheng, L.; Li, P.; He, G. Membrane Crystallization for Process Intensification and Control: A Review. Engineering 2021, 7, 50–62. [Google Scholar] [CrossRef]
  10. Kovacic, B.; Vrecer, F.; Planinsek, O. Spherical crystallization of drugs. Acta Pharm. 2012, 62, 1–14. [Google Scholar] [CrossRef]
  11. Toldy, A.I.; Badruddoza, A.Z.M.; Zheng, L.; Hatton, T.A.; Gunawan, R.; Rajagopalan, R.; Khan, S.A. Spherical Crystallization of Glycine from Monodisperse Microfluidic Emulsions. Cryst. Growth Des. 2012, 12, 3977–3982. [Google Scholar] [CrossRef]
  12. Chen, M.; Liu, X.; Yu, C.; Yao, M.; Xu, S.; Tang, W.; Song, X.; Dong, W.; Wang, G.; Gong, J. Strategy of selecting solvent systems for spherical agglomeration by the Lifshitz-van der Waals acid-base approach. Chem. Eng. Sci. 2020, 220, 115613. [Google Scholar] [CrossRef]
  13. Li, L.; Zhao, S.; Xin, Z. Three-solvent spherical crystallization method with a model drug: Clopidogrel hydrogen sulfate. Chem. Eng. Sci. 2020, 212, 115001. [Google Scholar] [CrossRef]
  14. Wu, B.; Li, J.; Li, C.; He, J.; Luo, P. Antisolvent crystallization intensified by a jet crystallizer and a method for investigating crystallization kinetics. Chem. Eng. Sci. 2020, 211, 115259. [Google Scholar] [CrossRef]
  15. Holaň, J.; Ridvan, L.; Billot, P.; Štěpánek, F. Design of co-crystallization processes about particle size distribution. Chem. Eng. Sci. 2015, 128, 36–43. [Google Scholar] [CrossRef]
  16. Unno, J.; Hirasawa, I. Partial Seeding Policy for Controlling the Crystal Quality in Batch Cooling Crystallization. Chem. Eng. Technol. 2020, 43, 1065–1071. [Google Scholar] [CrossRef]
  17. Ferguson, S.; Morris, G.; Hao, H.; Barrett, M.; Glennon, B. Characterization of the anti-solvent batch, plug flow and MSMPR crystallization of benzoic acid. Chem. Eng. Sci. 2013, 104, 44–54. [Google Scholar] [CrossRef]
  18. Park, Y.; Hong, M.; Koo, J.Y.; Lee, M.; Lee, J.; Moon, D.J.; Sohn, S.H.; Joo, T.; Lim, W.T.; Lim, H.; et al. Reverse Anti-solvent Crystallization Process for the Facile Synthesis of Zinc Tetra(4-pyridyl)porphyrin Single Crystalline Cubes. Sci. Rep. 2017, 7, 2582. [Google Scholar] [CrossRef]
  19. Maghsoodi, M.; Nokhodchi, A. Agglomeration of Celecoxib by Quasi Emulsion Solvent Diffusion Method: Effect of Stabilizer. Adv. Pharm. Bull. 2016, 6, 607–616. [Google Scholar] [CrossRef]
  20. Khurshid, M.F.; Hussain, T.; Masood, R.; Hussain, N. Development and evaluation of a controlled drug delivery wound dressing based on polymeric porous microspheres. J. Ind. Text. 2016, 46, 986–999. [Google Scholar] [CrossRef]
  21. Nagula, R.L.; Wairkar, S. Cellulose microsponges based gel of naringenin for atopic dermatitis: Design, optimization, in vitro and in vivo investigation. Int. J. Biol. Macromol. 2020, 164, 717–725. [Google Scholar] [CrossRef] [PubMed]
  22. Jia, X.; Wang, J. Preparation and characterization of spherical submicron ε-CL-20 via green mechanical demulsification. J. Energetic Mater. 2019, 37, 475–483. [Google Scholar] [CrossRef]
  23. Chen, H.; Paul, S.; Xu, H.; Wang, K.; Mahanthappa, M.K.; Sun, C.C. Reduction of Punch-Sticking Propensity of Celecoxib by Spherical Crystallization via Polymer Assisted Quasi-Emulsion Solvent Diffusion. Mol. Pharm. 2020, 17, 1387–1396. [Google Scholar] [CrossRef]
  24. Wang, J.; Cao, W.; Zhu, L.; Wang, J.; Lakerveld, R. Emulsion-assisted cooling crystallization of ibuprofen. Chem. Eng. Sci. 2020, 226, 115861. [Google Scholar] [CrossRef]
  25. Garg, N.; Tona, R.; Martin, P.; Martin-Soladana, P.M.; Ward, G.; Douillet, N.; Lai, D. Seeded droplet microfluidic system for small molecule crystallization. Lab Chip 2020, 20, 1815–1826. [Google Scholar] [CrossRef]
  26. Vicent, V.; Ndoye, F.-T.; Verboven, P.; Nicolaï, B.; Alvarez, G. Modeling ice recrystallization in frozen carrot tissue during storage under dynamic temperature conditions. J. Food Eng. 2020, 278, 109911. [Google Scholar] [CrossRef]
  27. Bhoi, S.; Sarkar, D. Hybrid finite volume and Monte Carlo method for solving multi-dimensional population balance equations in crystallization processes. Chem. Eng. Sci. 2020, 217, 115511. [Google Scholar] [CrossRef]
  28. Tatsukawa, S.; Kadota, K.; Yoshida, M.; Shirakawa, Y. Development of quantifying supersaturation to determine the effect of the anti-solvent on precipitation in liquid-liquid interfacial crystallization. J. Mol. Liq. 2020, 309, 113097. [Google Scholar] [CrossRef]
  29. Peña, R.; Burcham, C.L.; Jarmer, D.J.; Ramkrishna, D.; Nagy, Z.K. Modeling and optimization of spherical agglomeration in suspension through a coupled population balance model. Chem. Eng. Sci. 2017, 167, 66–77. [Google Scholar] [CrossRef]
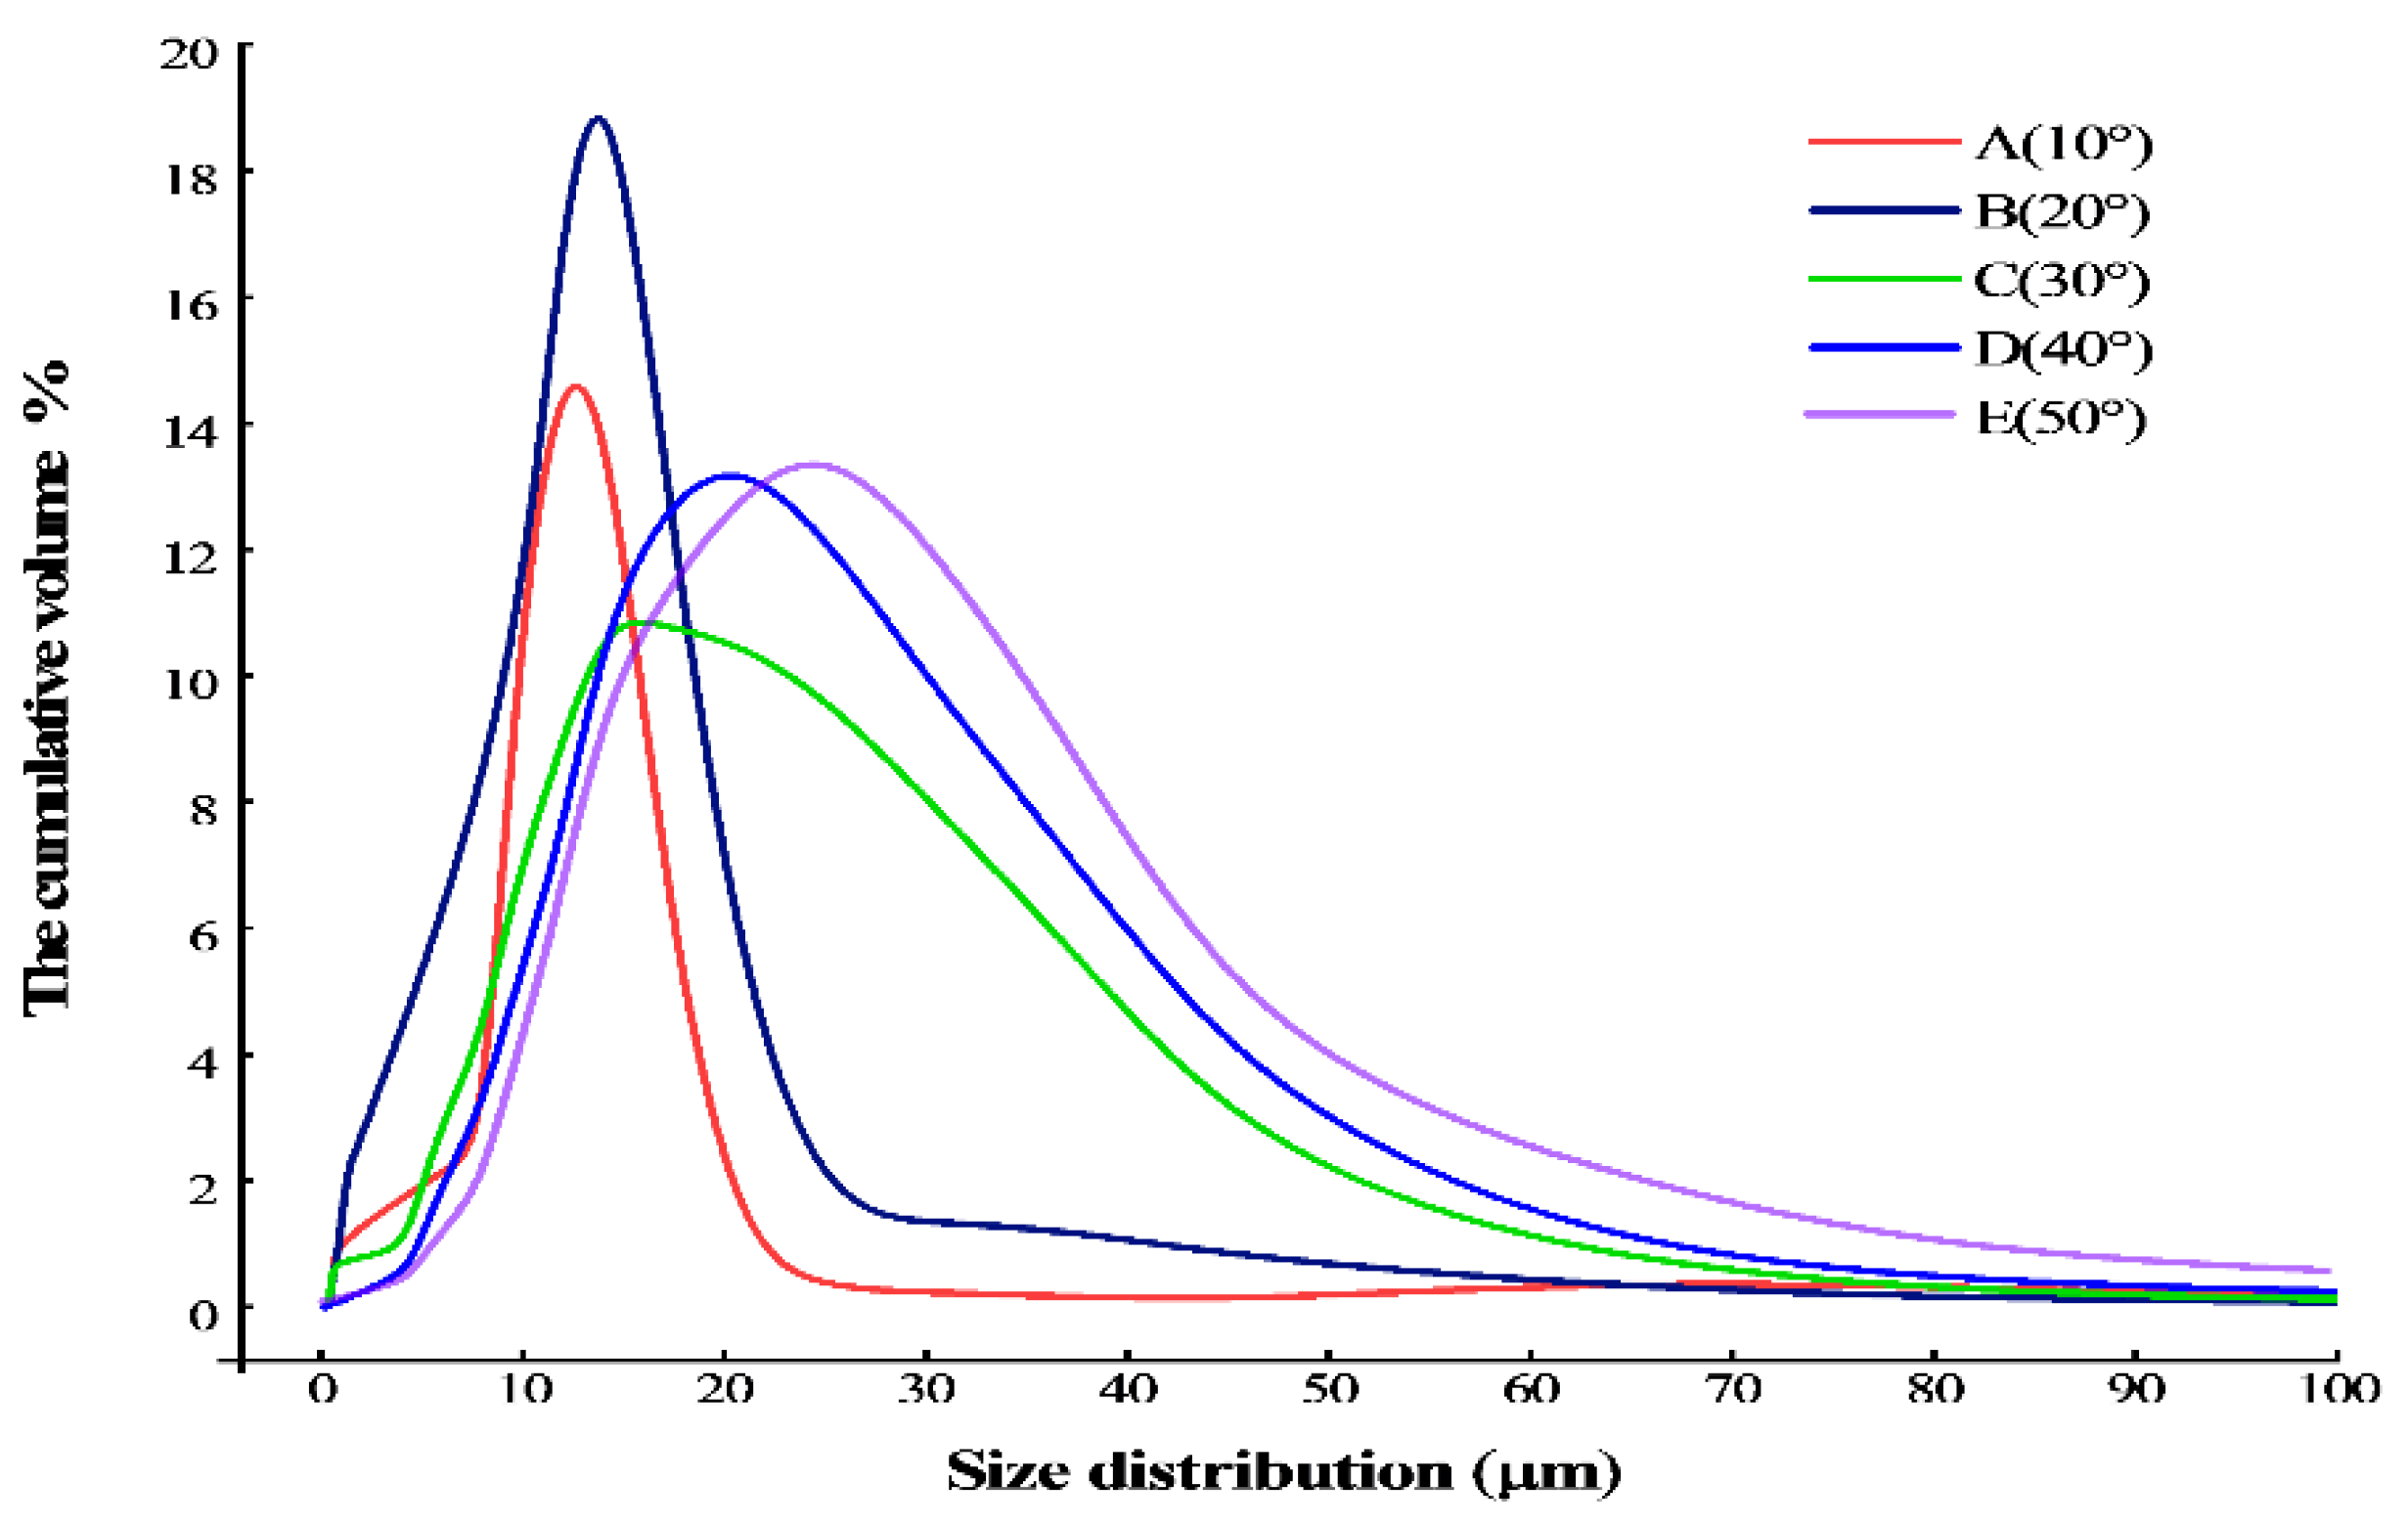
Figure 1. (a): 2~10 μm, (b): 18~30 μm, (c): 45~60 μm, (d): hexahedron morphology.
Crystals 15 00145 g001
Figure 2. Needle-like crystal size changing with increasing temperature.
Crystals 15 00145 g002
Figure 3. Droplet diffusion process.
Crystals 15 00145 g003
Figure 4. The picture of the dripping solvent droplet.
Crystals 15 00145 g004
Figure 5. Experimental device.
Crystals 15 00145 g005
Figure 6. The particle size distribution of sodium chloride under different temperature conditions.
Crystals 15 00145 g006
Figure 7. The electron microscope images at 20 °C and 50 °C.
Crystals 15 00145 g007
Figure 8. Data comparison between calculating and D32.
Crystals 15 00145 g008
Table 1. Details of the experiment.
NO.Concentration g/g (Water)Dripping Droplet Velocity μL/minAgitation Rate rpm/minTemperature
°C
10.3610050010
20.3610050020
30.3610050030
40.3610050040
50.3610050050
Table 2. Details of the size distribution of sodium chloride.
N O . D 10 / μ m D 50 / μ m D 90 / μ m D 32 / μ m S p a n
11.2577.27914.0123.7381.752
21.6518.74520.6014.2202.161
31.68711.51724.6904.7451.997
44.82215.63732.9656.8141.799
57.49519.48039.6699.1311.653
Table 3. The value of the parameter in the model.
Parameter [units]DescriptionValue
ν [m3/mol]The molar volume of liquid1.8 × 10−5
c [mol/m3]Droplet concentration55.6 × 103
D [m2/s]Diffusion coefficient2 × 10−9
k g [m/s]Growth rate constant7.1150 × 10−5
α [-]Growth rate order1.079
E [kJ/mol]Activation energy for growth1.9023
Disclaimer/Publisher’s Note: The statements, opinions and data contained in all publications are solely those of the individual author(s) and contributor(s) and not of MDPI and/or the editor(s). MDPI and/or the editor(s) disclaim responsibility for any injury to people or property resulting from any ideas, methods, instructions or products referred to in the content.

